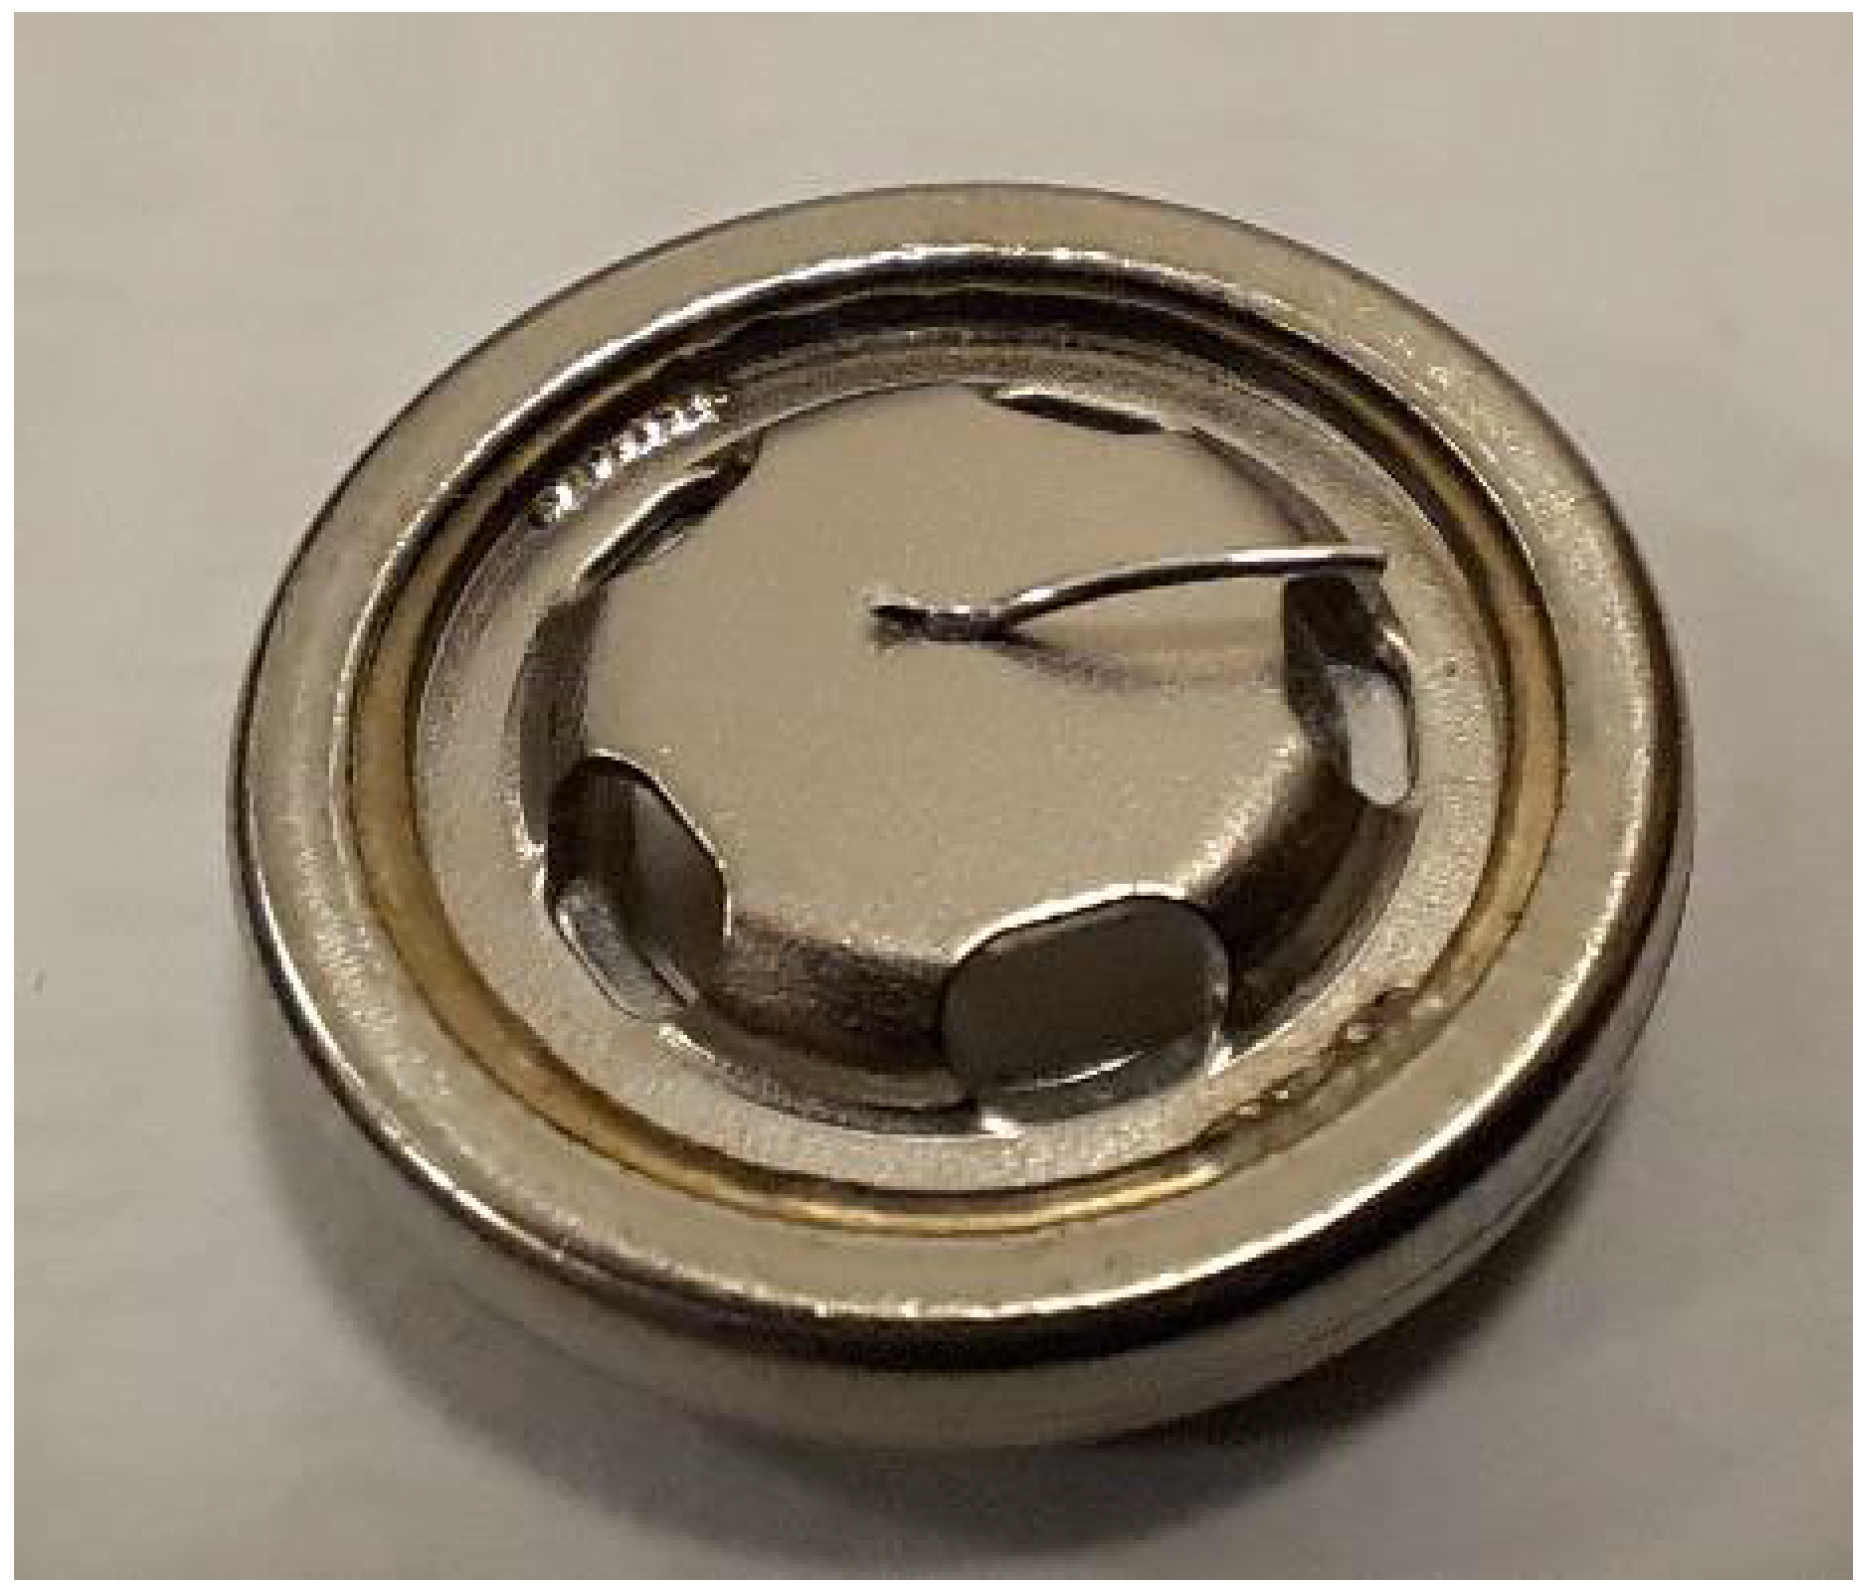
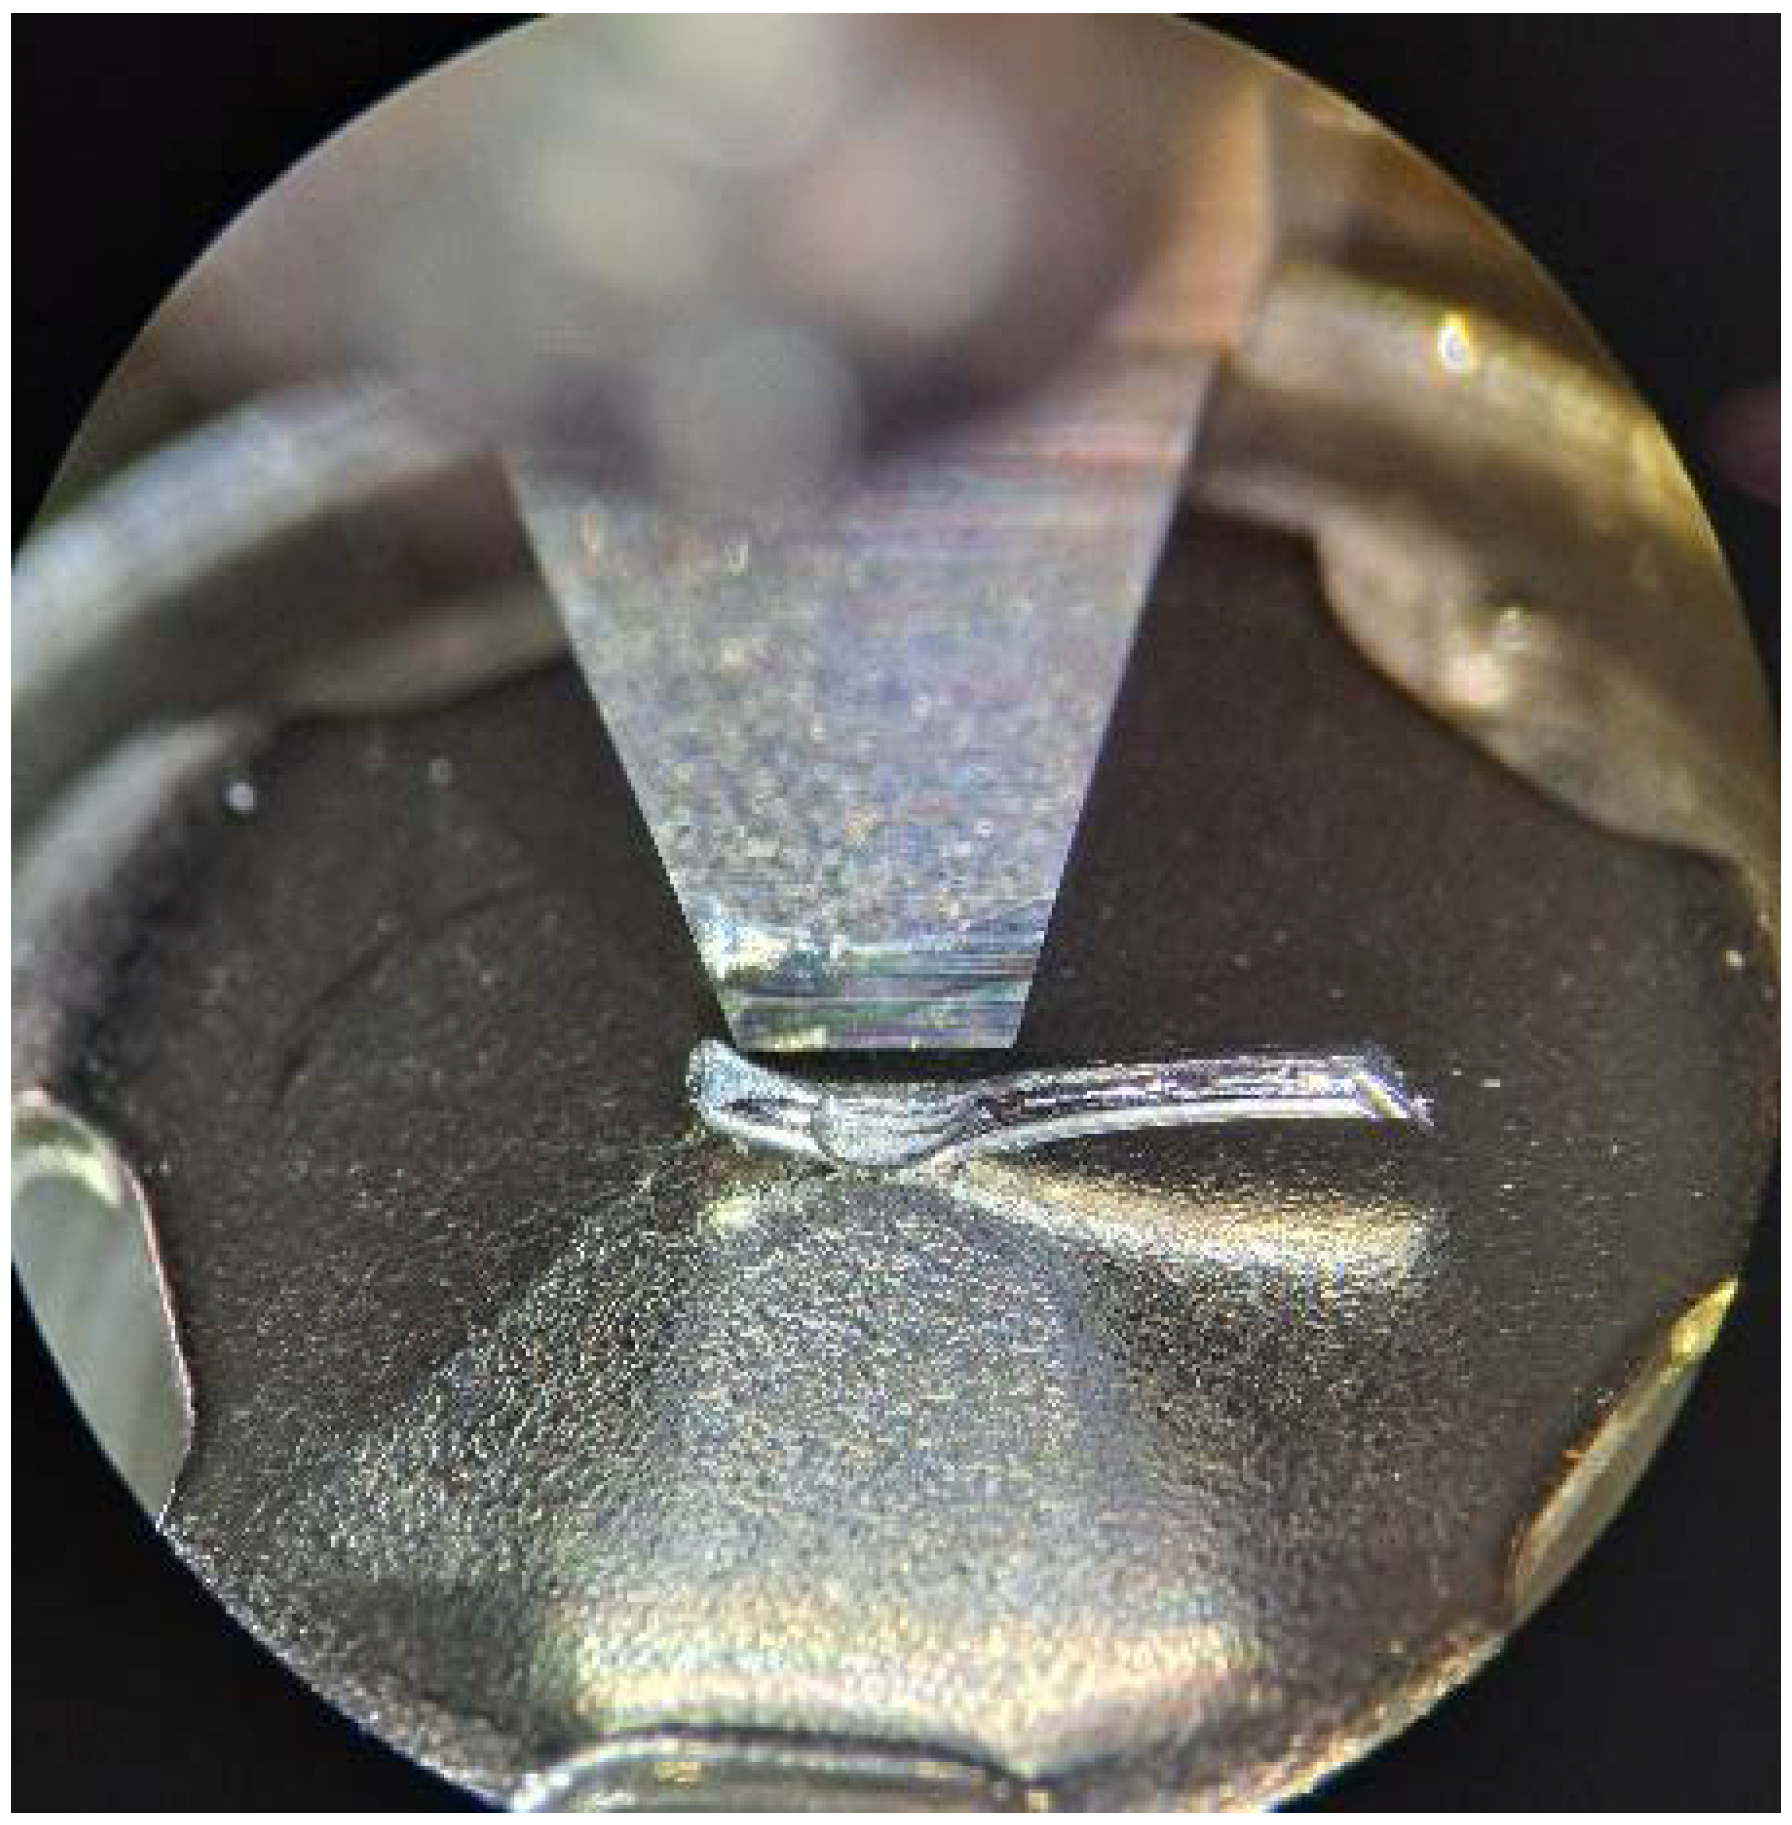
Figure 1.
Wire bond visible on battery cap after cutting off top of battery cell.
Figure 1.
Wire bond visible on battery cap after cutting off top of battery cell.
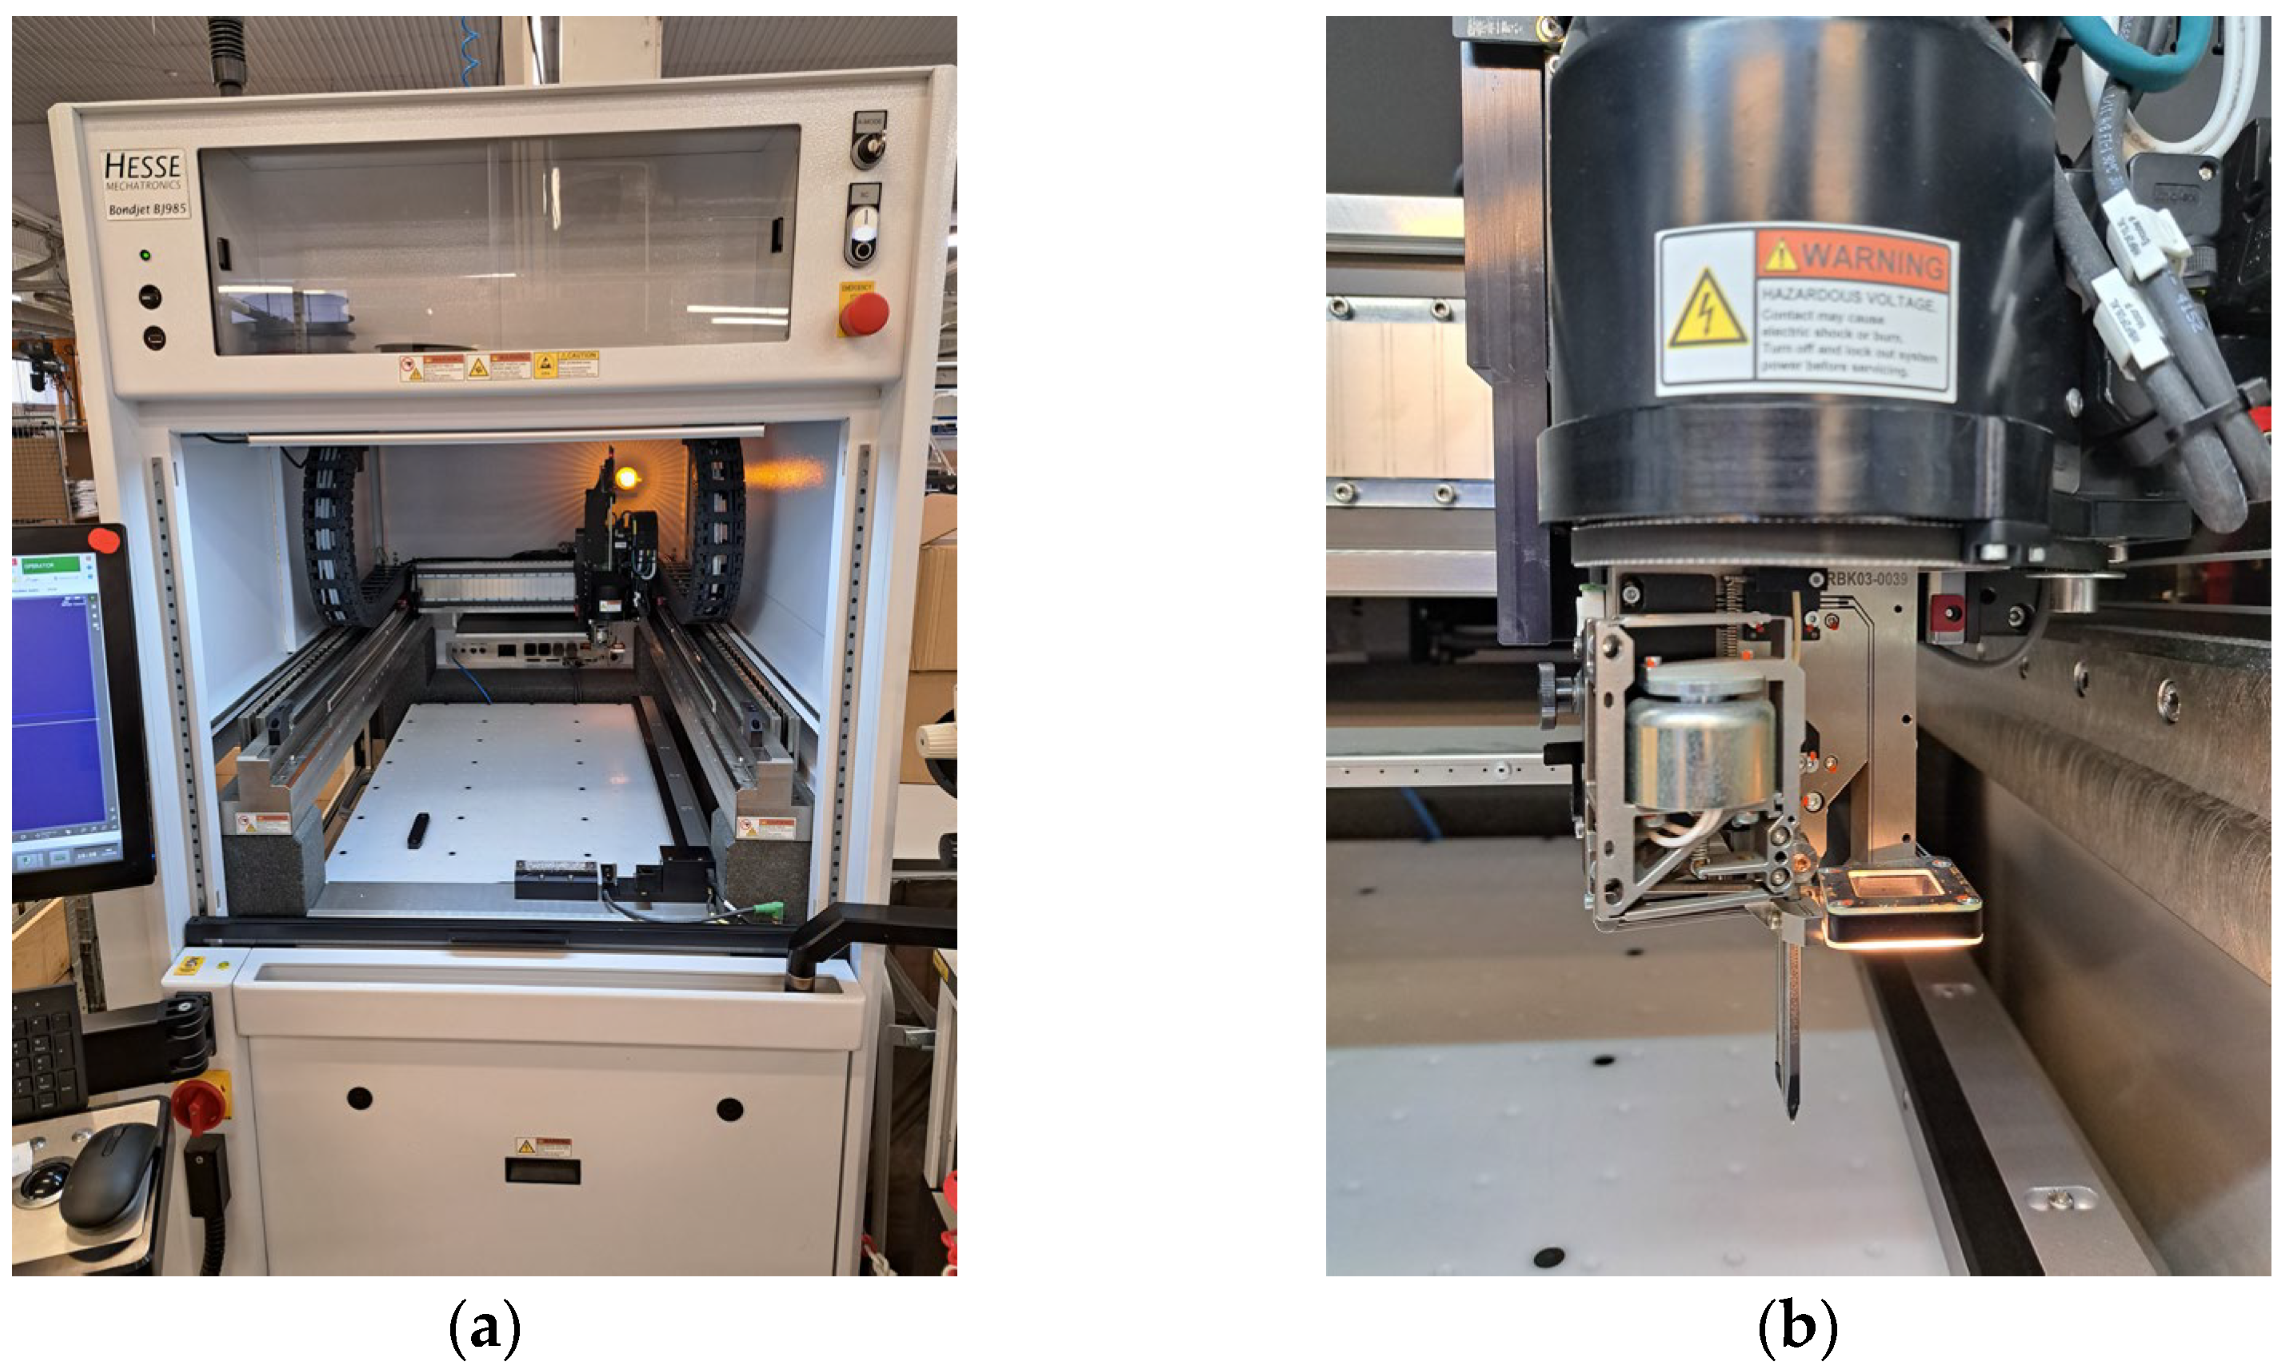
Figure 2.
Hesse BJ985 wire bonder (
a) and RBK03 bondhead (
b) [
4].
Figure 2.
Hesse BJ985 wire bonder (
a) and RBK03 bondhead (
b) [
4].
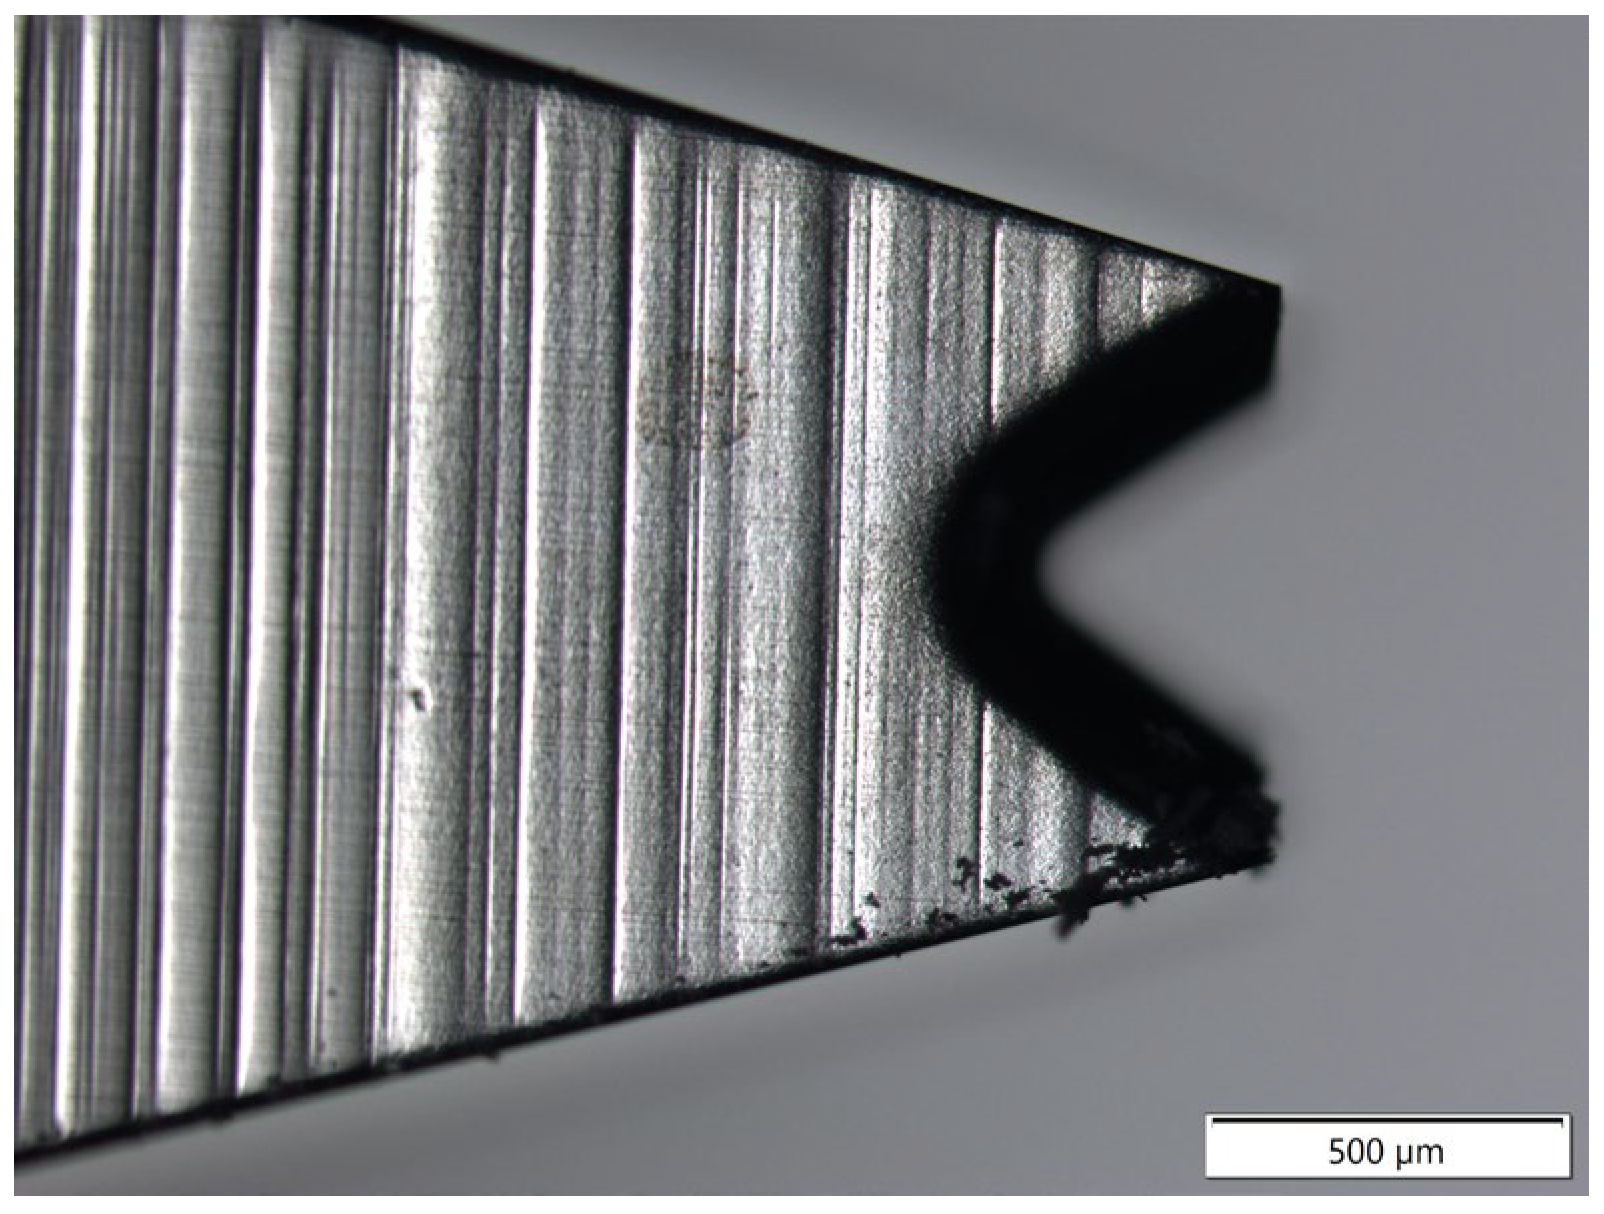
Figure 3.
Sonotrode wedge Hesse 65408-400.
Figure 3.
Sonotrode wedge Hesse 65408-400.
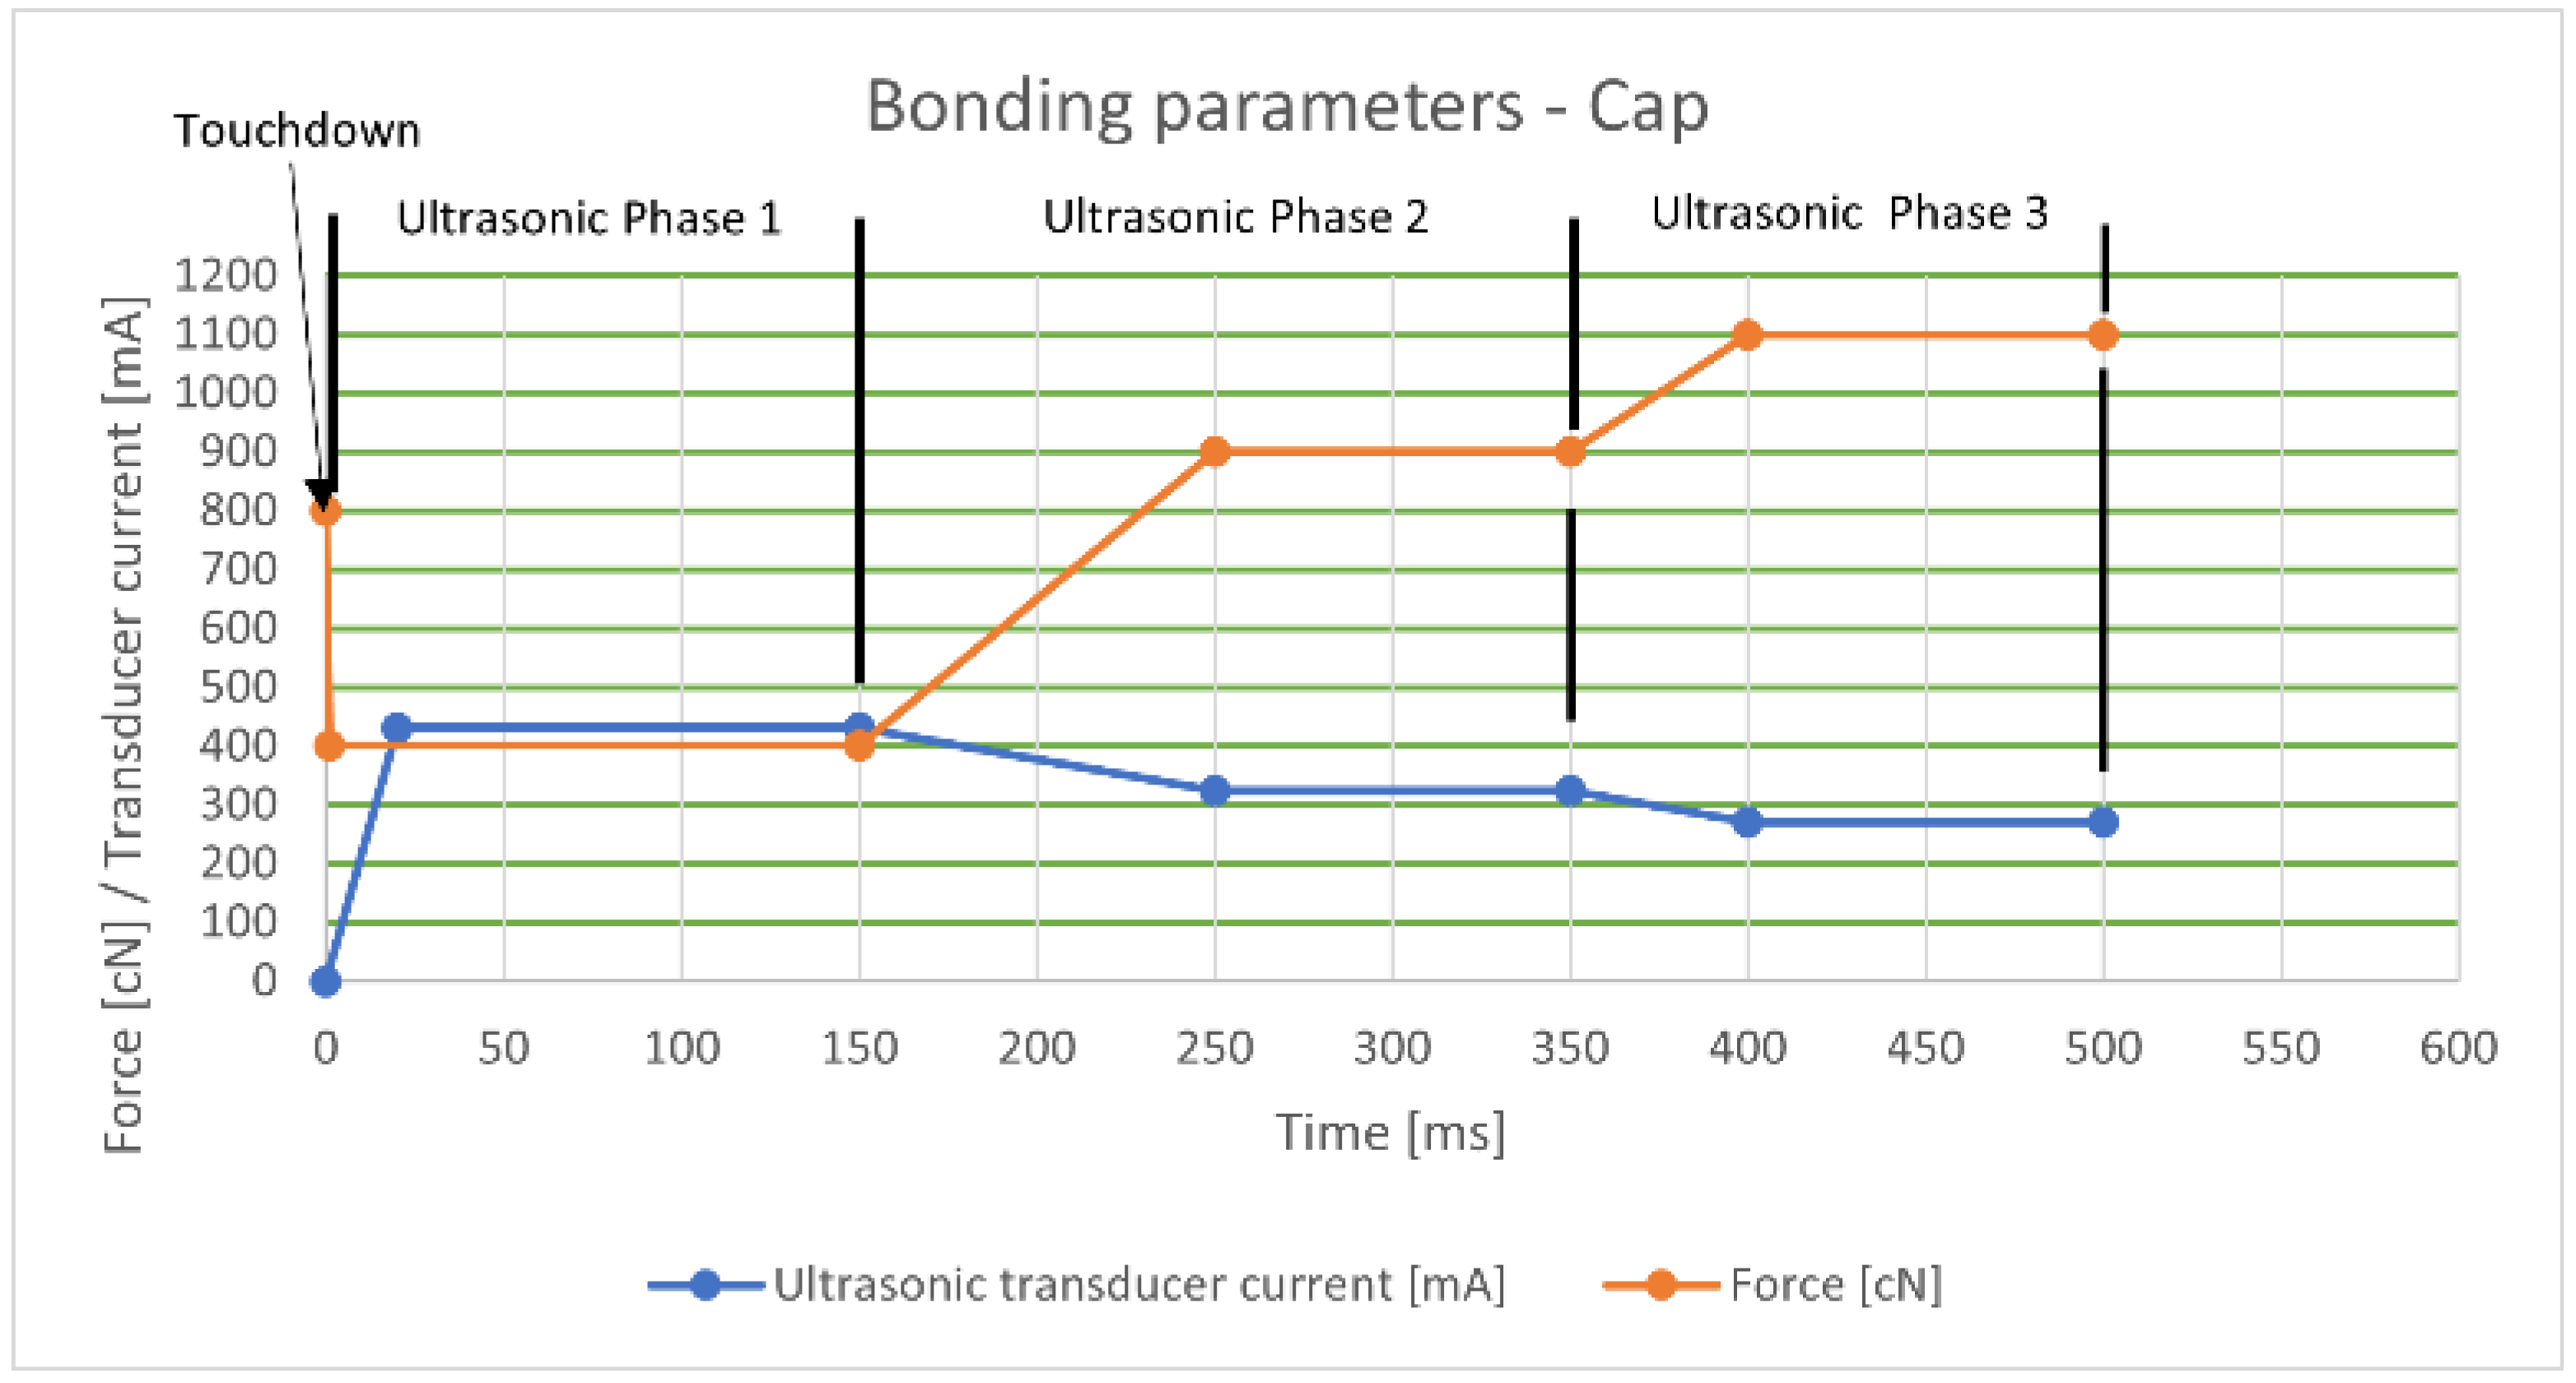
Figure 4.
Bonding process parameters.
Figure 4.
Bonding process parameters.
Figure 5.
Shear tool location during testing follows the same formatting.
Figure 5.
Shear tool location during testing follows the same formatting.
Figure 6.
Boundary of the cleaned surface ×50 (a) and ×200 (b) magnification for 20% laser cleaning power.
Figure 6.
Boundary of the cleaned surface ×50 (a) and ×200 (b) magnification for 20% laser cleaning power.
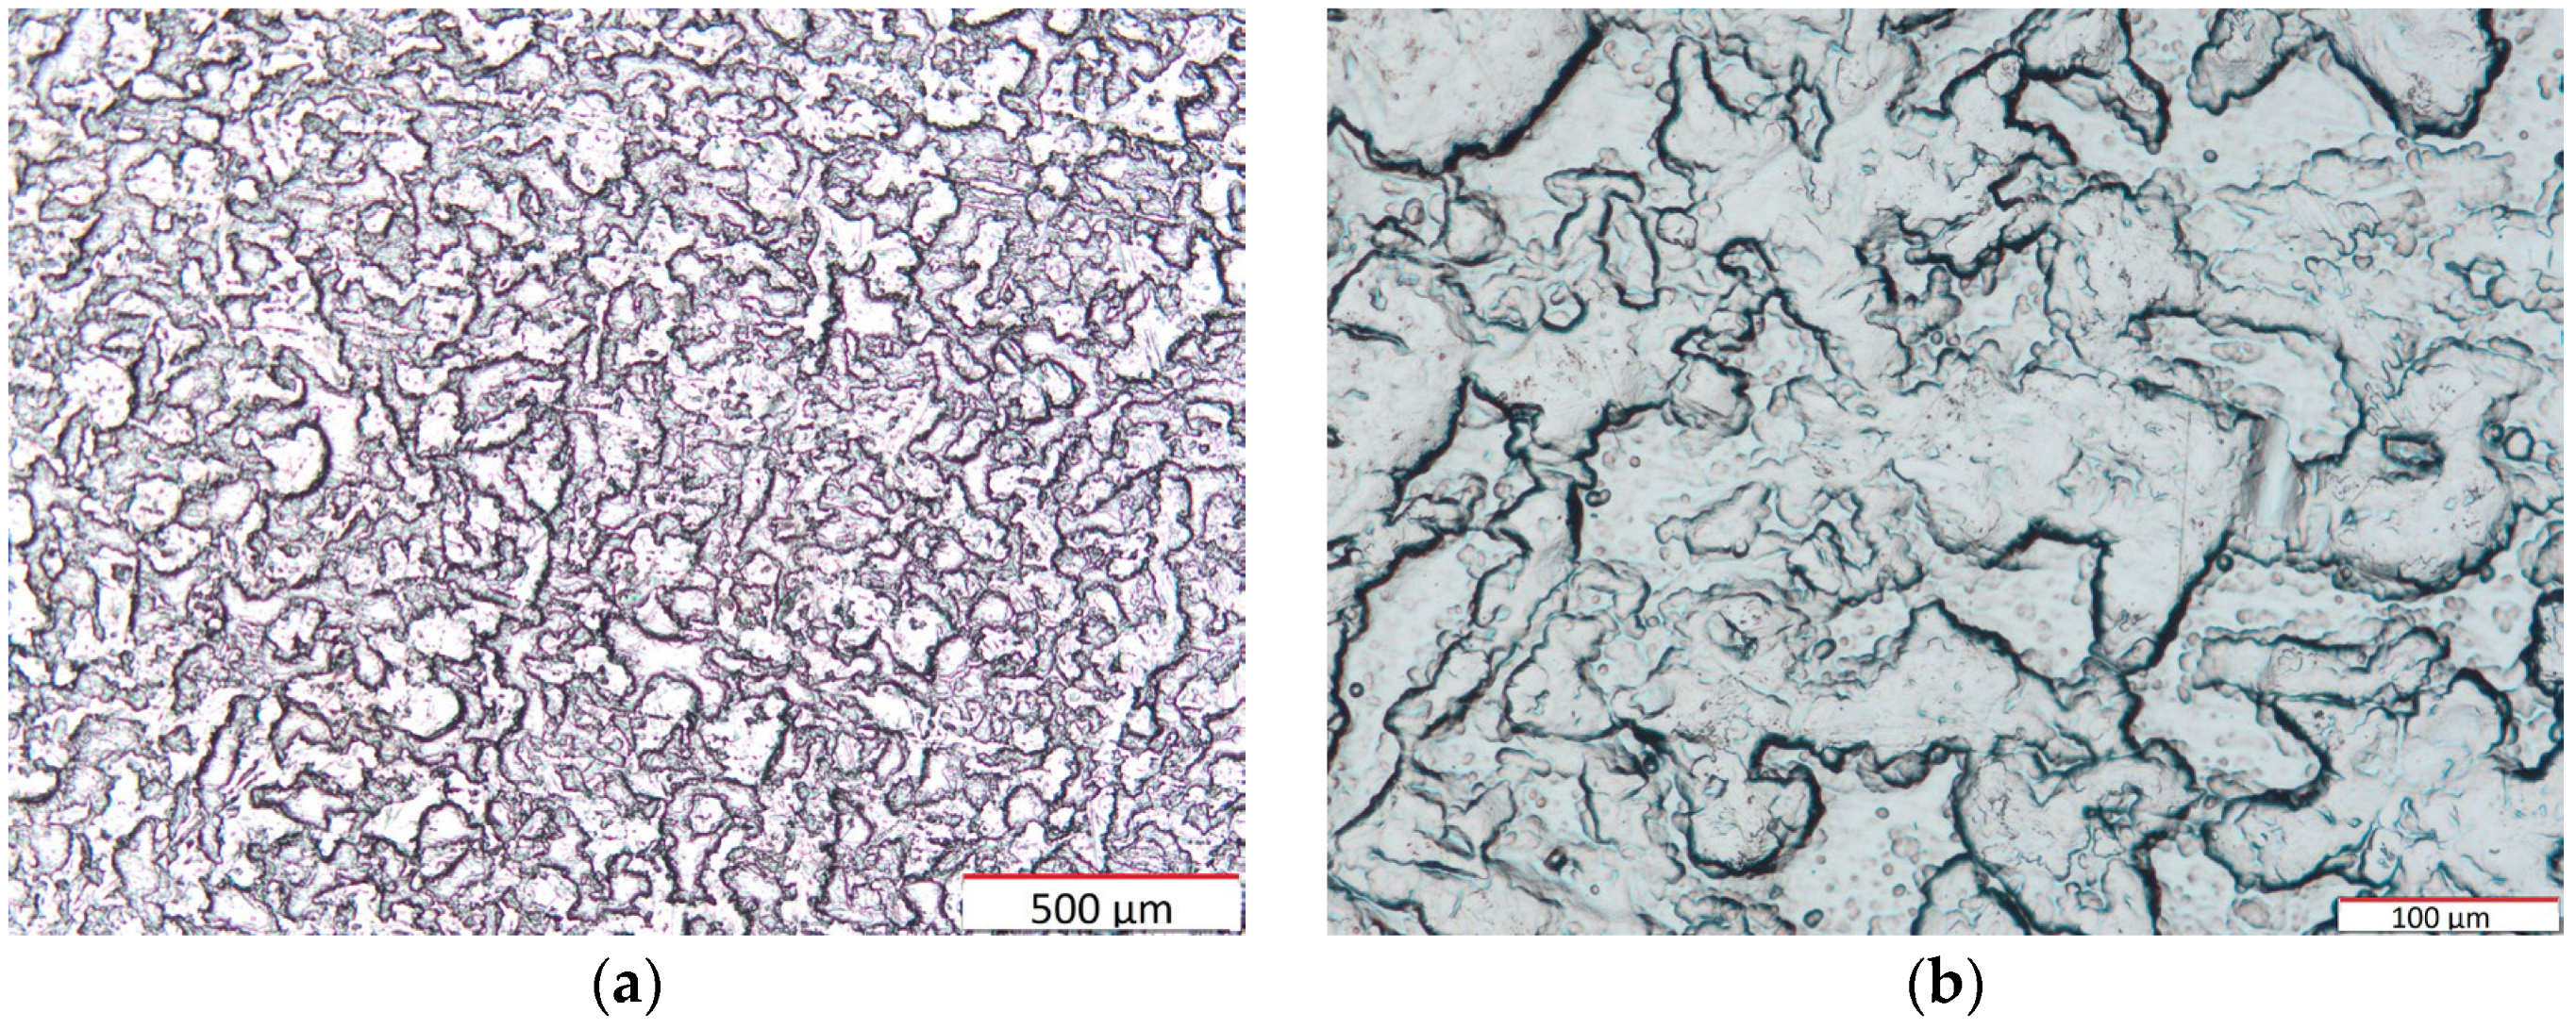
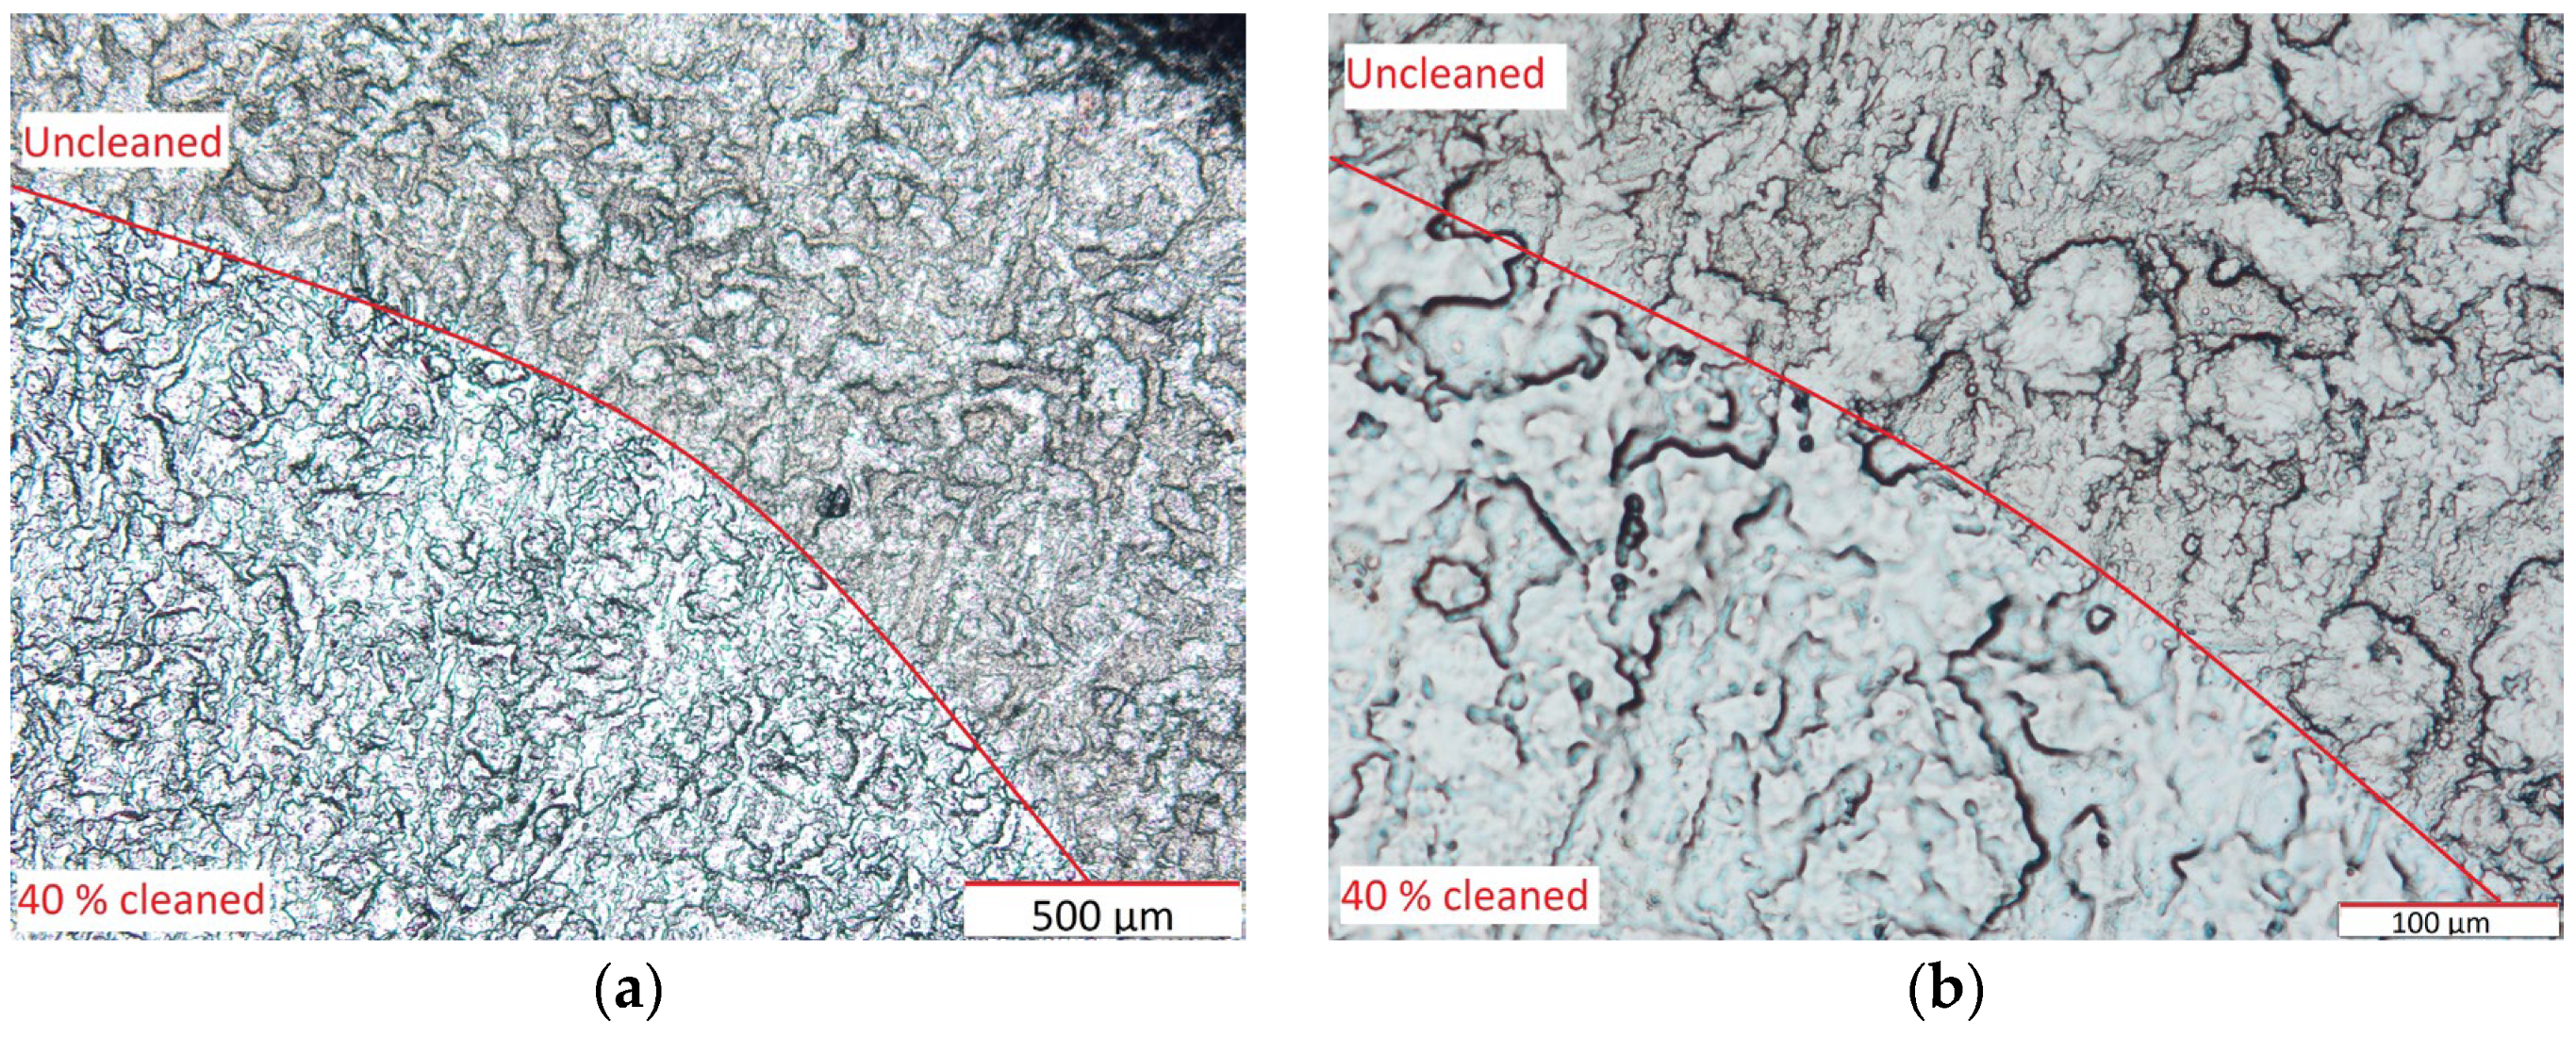
Figure 7.
Boundary of the cleaned surface ×50 (a) and ×200 (b) magnification for 40% laser cleaning power.
Figure 7.
Boundary of the cleaned surface ×50 (a) and ×200 (b) magnification for 40% laser cleaning power.
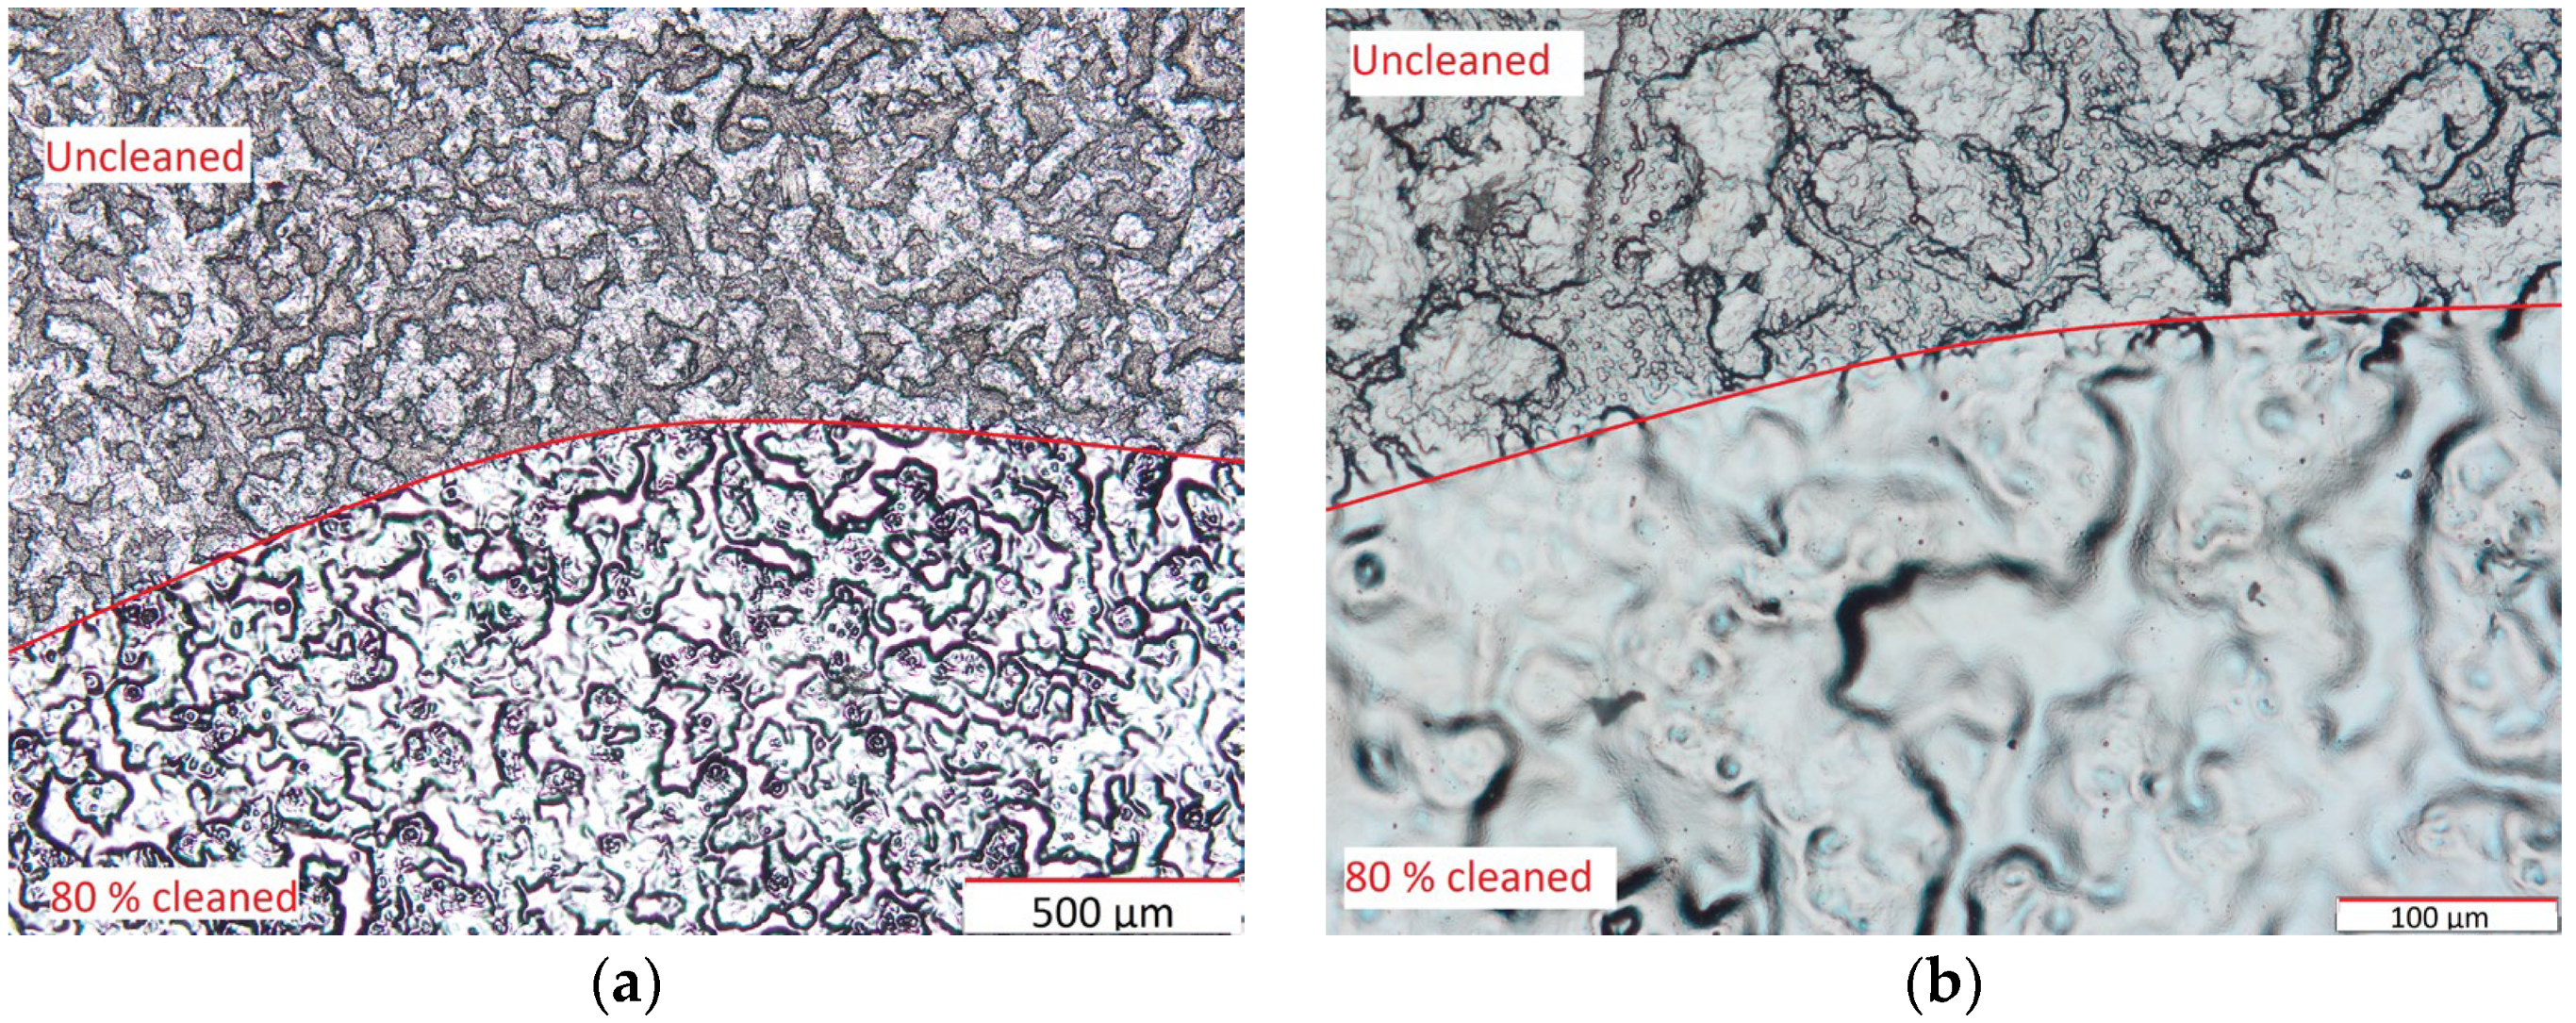
Figure 8.
Boundary of the cleaned surface with ×50 (a) and ×200 (b) magnification for 80% laser cleaning power.
Figure 8.
Boundary of the cleaned surface with ×50 (a) and ×200 (b) magnification for 80% laser cleaning power.
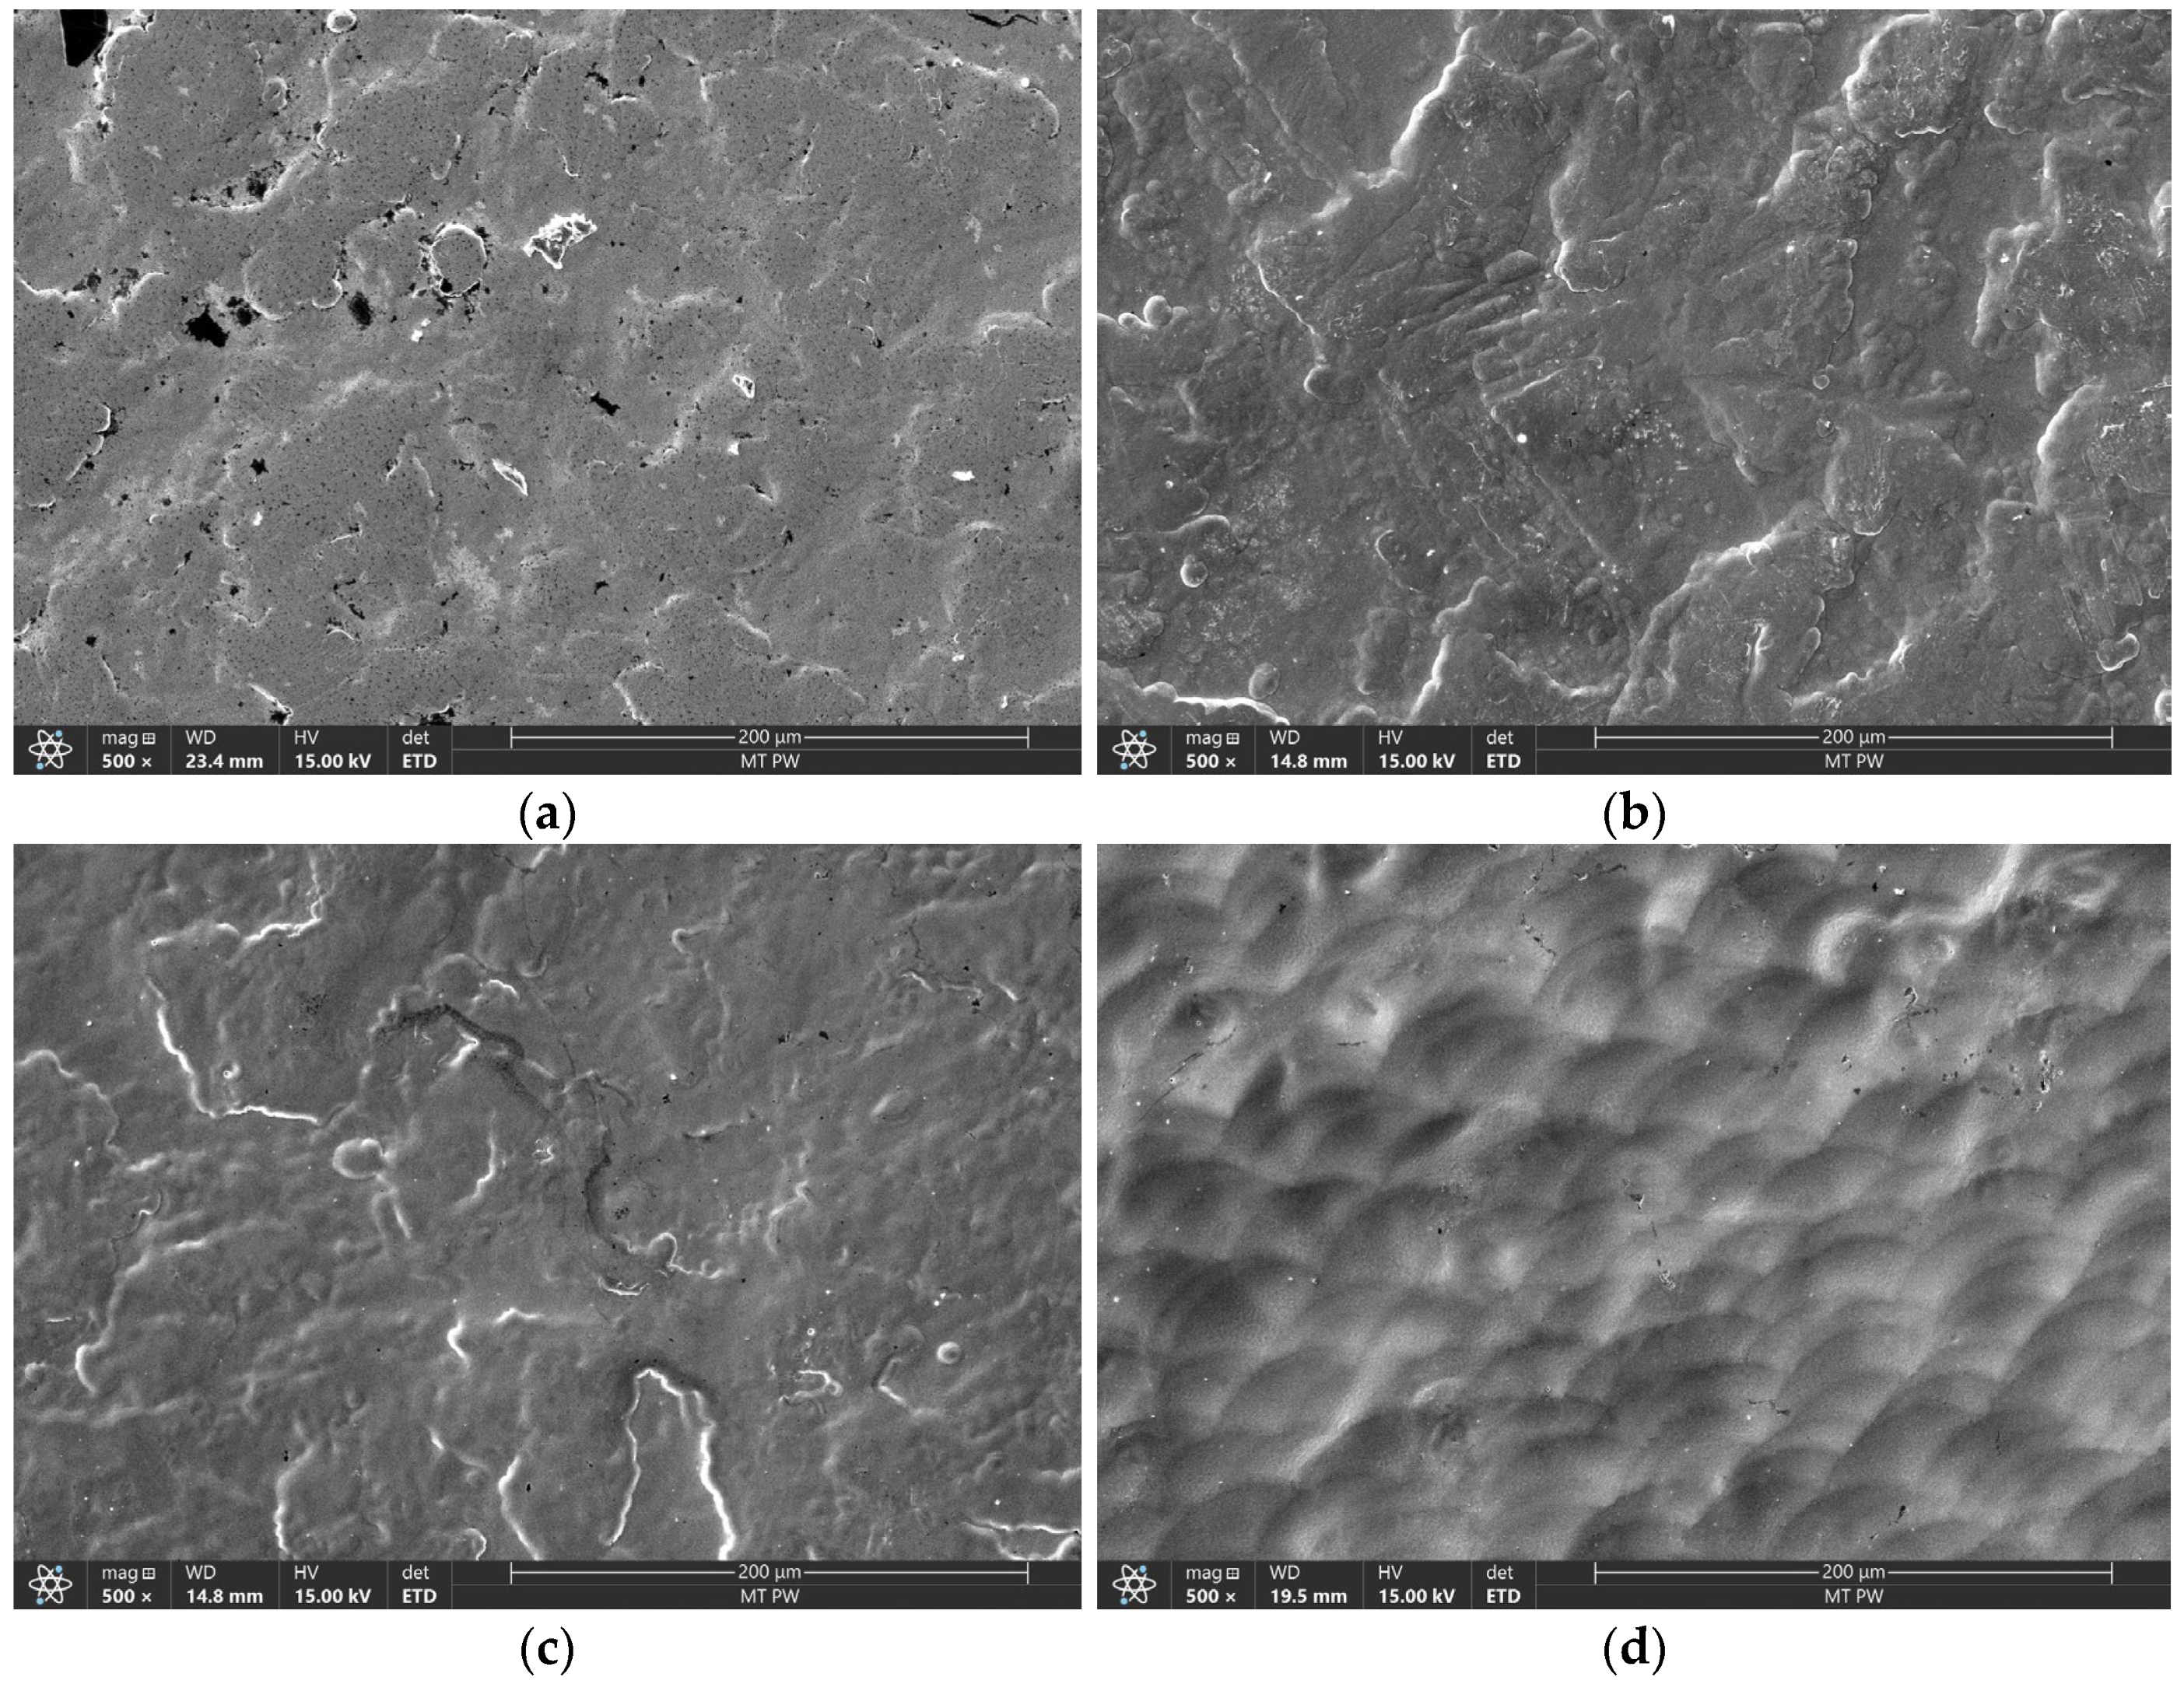
Figure 9.
SEM imaging of the battery surface with 500× magnification for uncleaned (a), 20% (b), 40% (c), and 80% (d) laser power cleaned samples.
Figure 9.
SEM imaging of the battery surface with 500× magnification for uncleaned (a), 20% (b), 40% (c), and 80% (d) laser power cleaned samples.
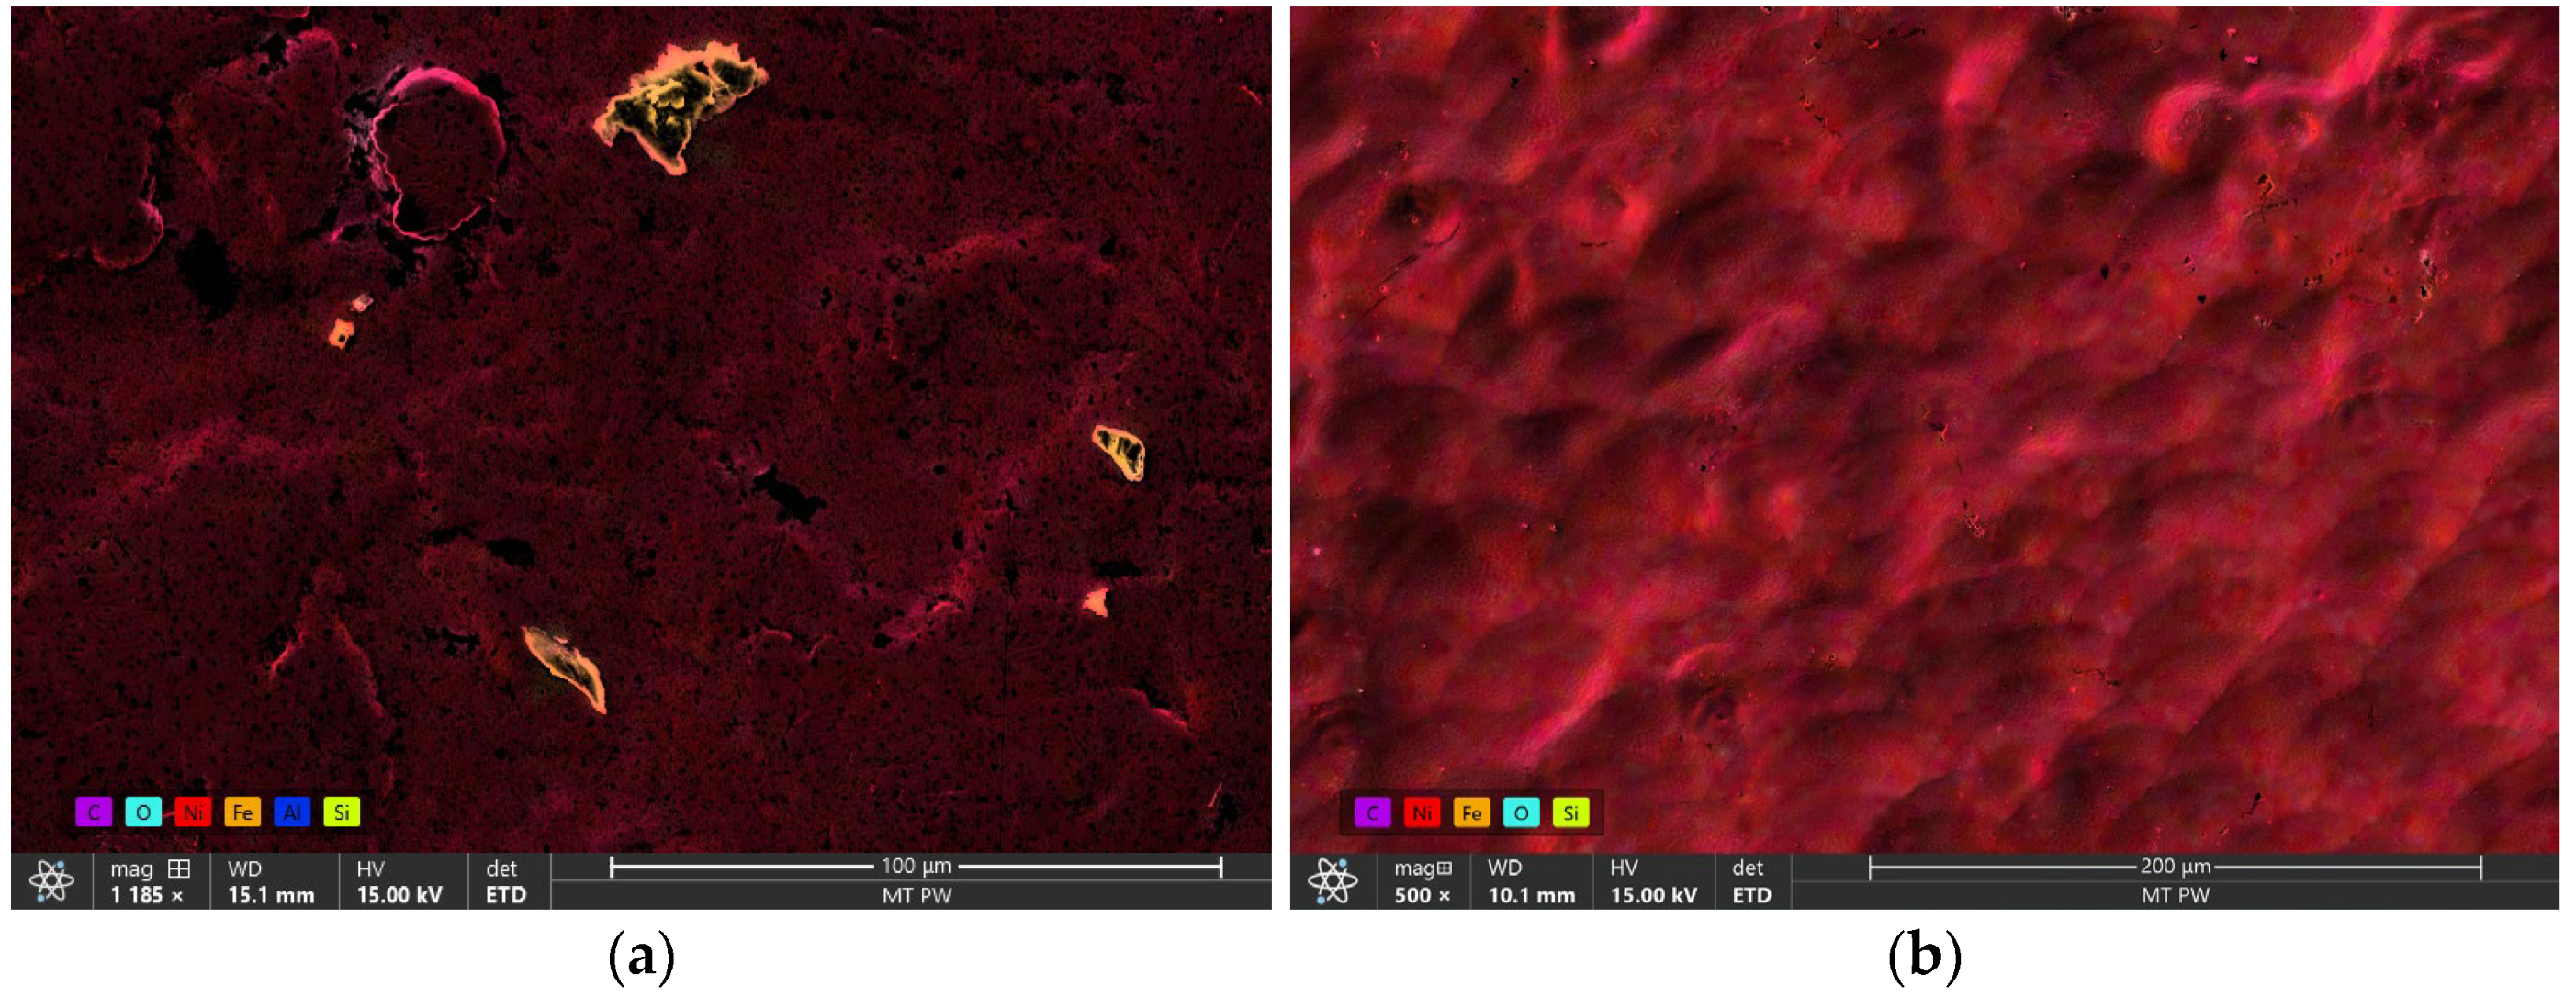
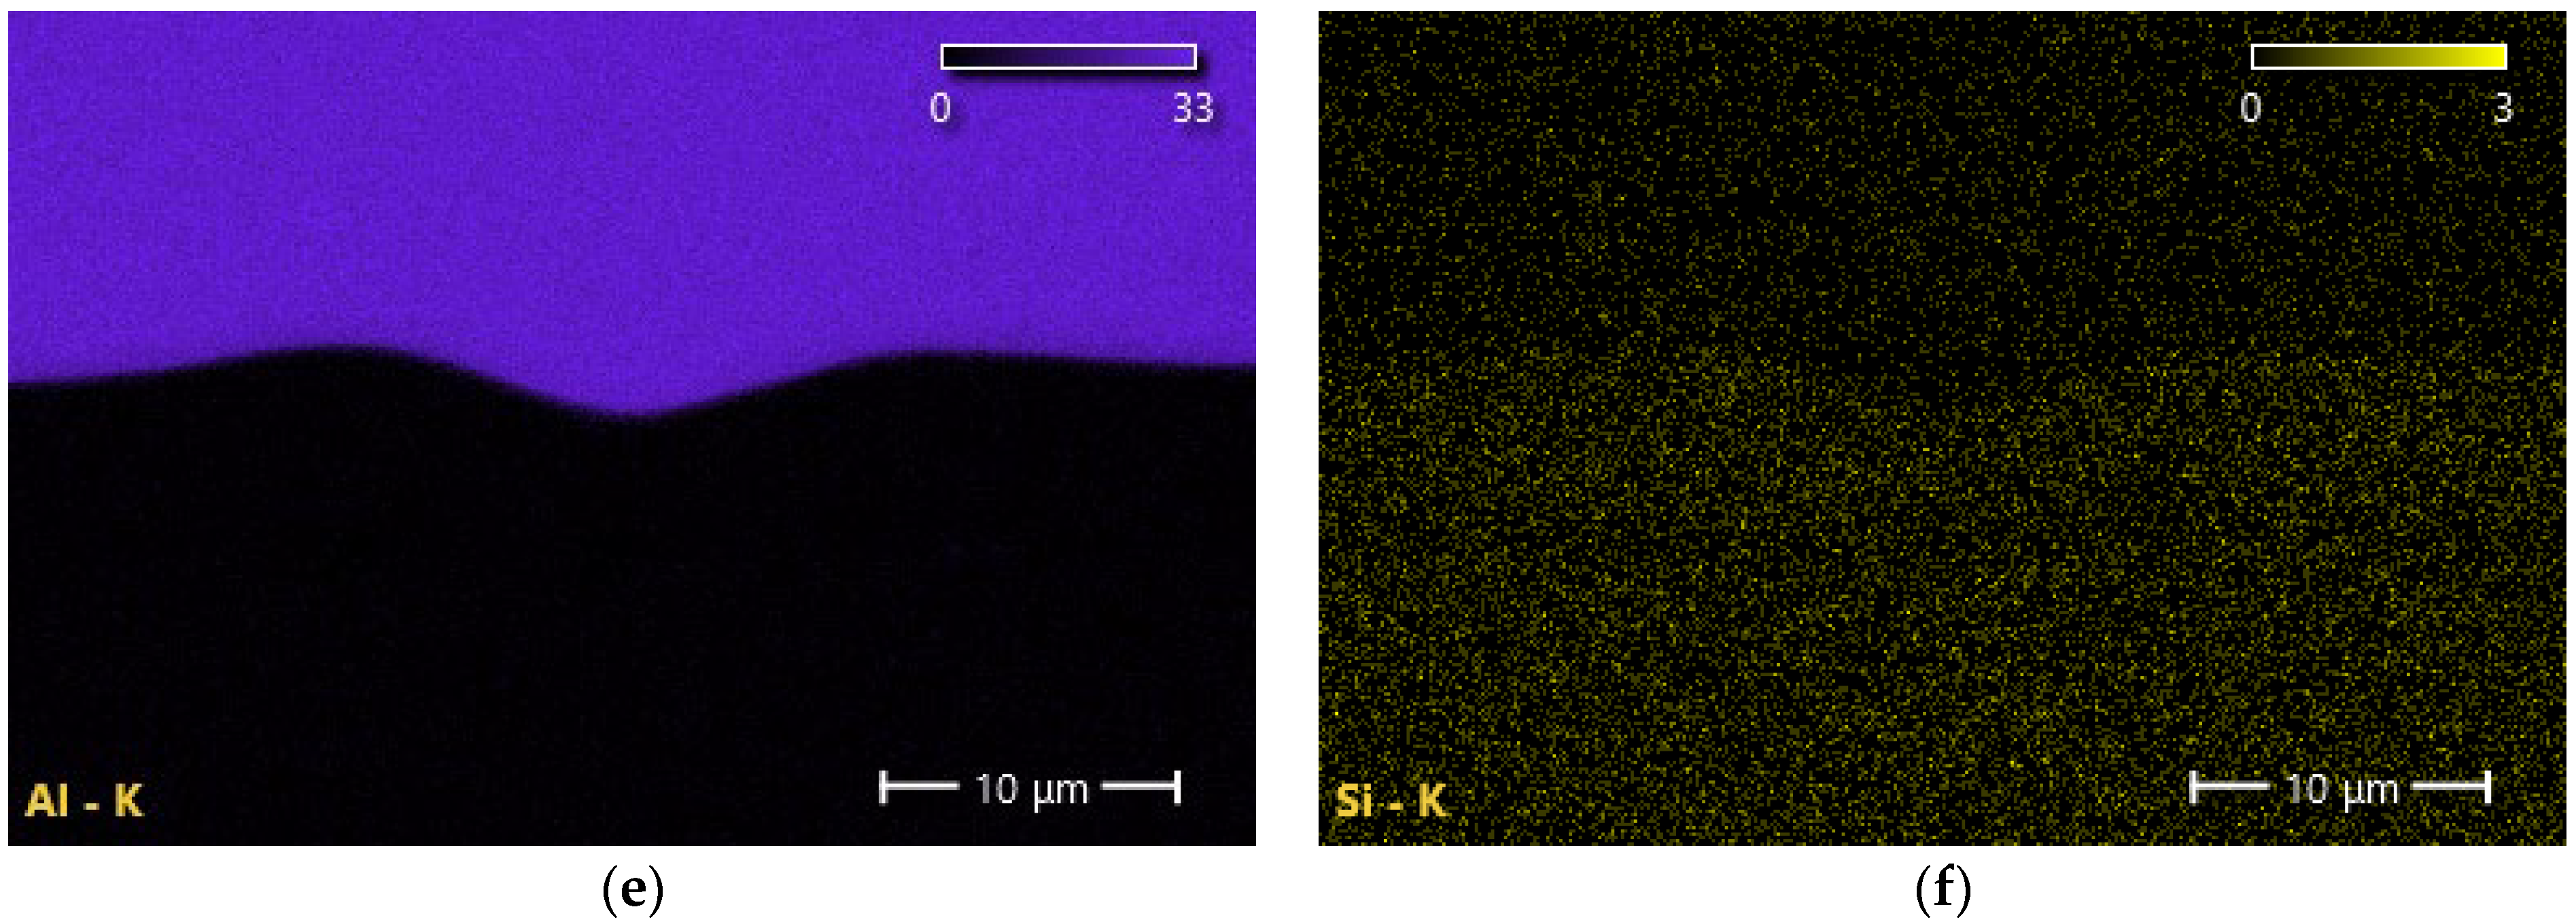
Figure 10.
Comparison of EDS quantity map of the uncleaned (a) surface and surface cleaned with 80% laser power (b).
Figure 10.
Comparison of EDS quantity map of the uncleaned (a) surface and surface cleaned with 80% laser power (b).
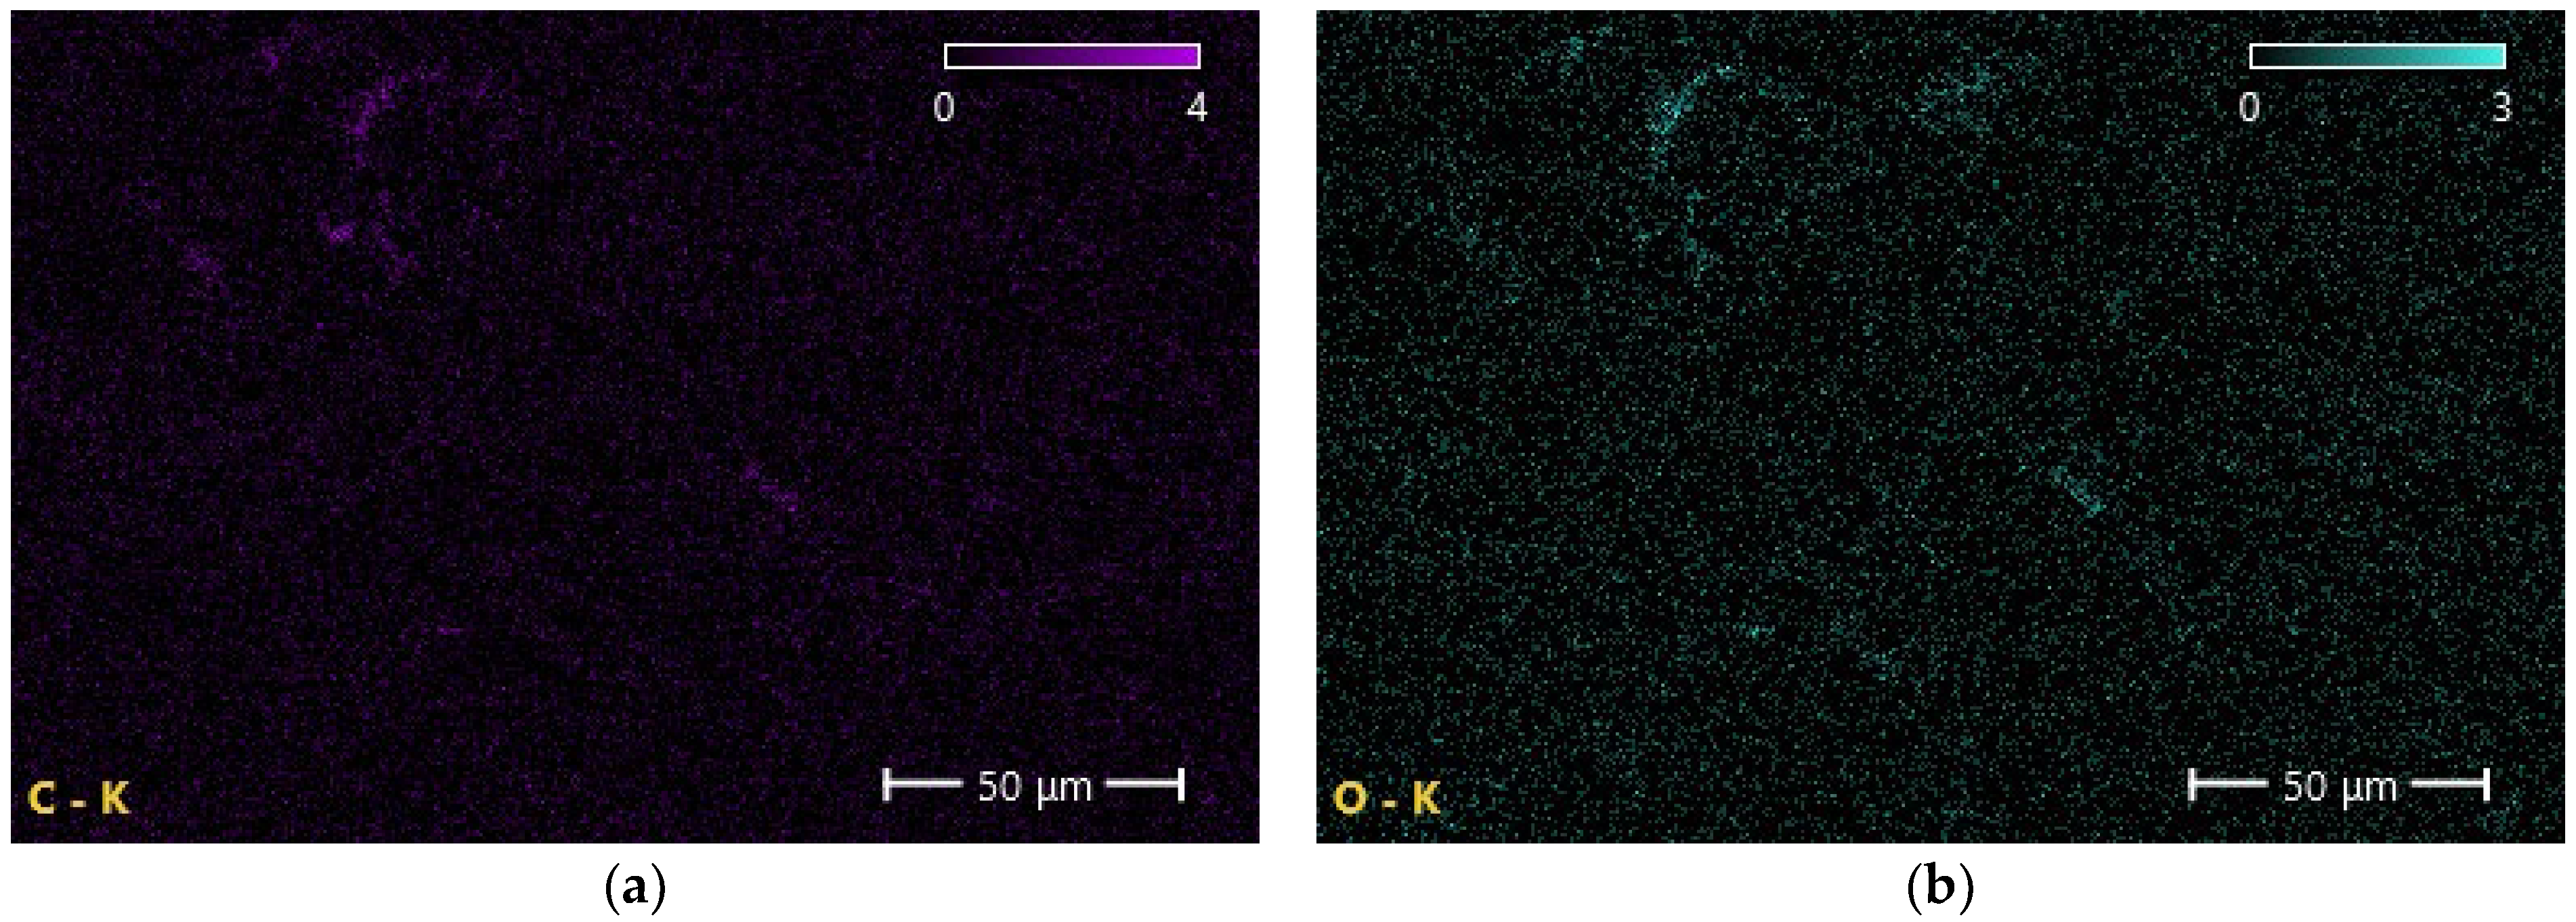
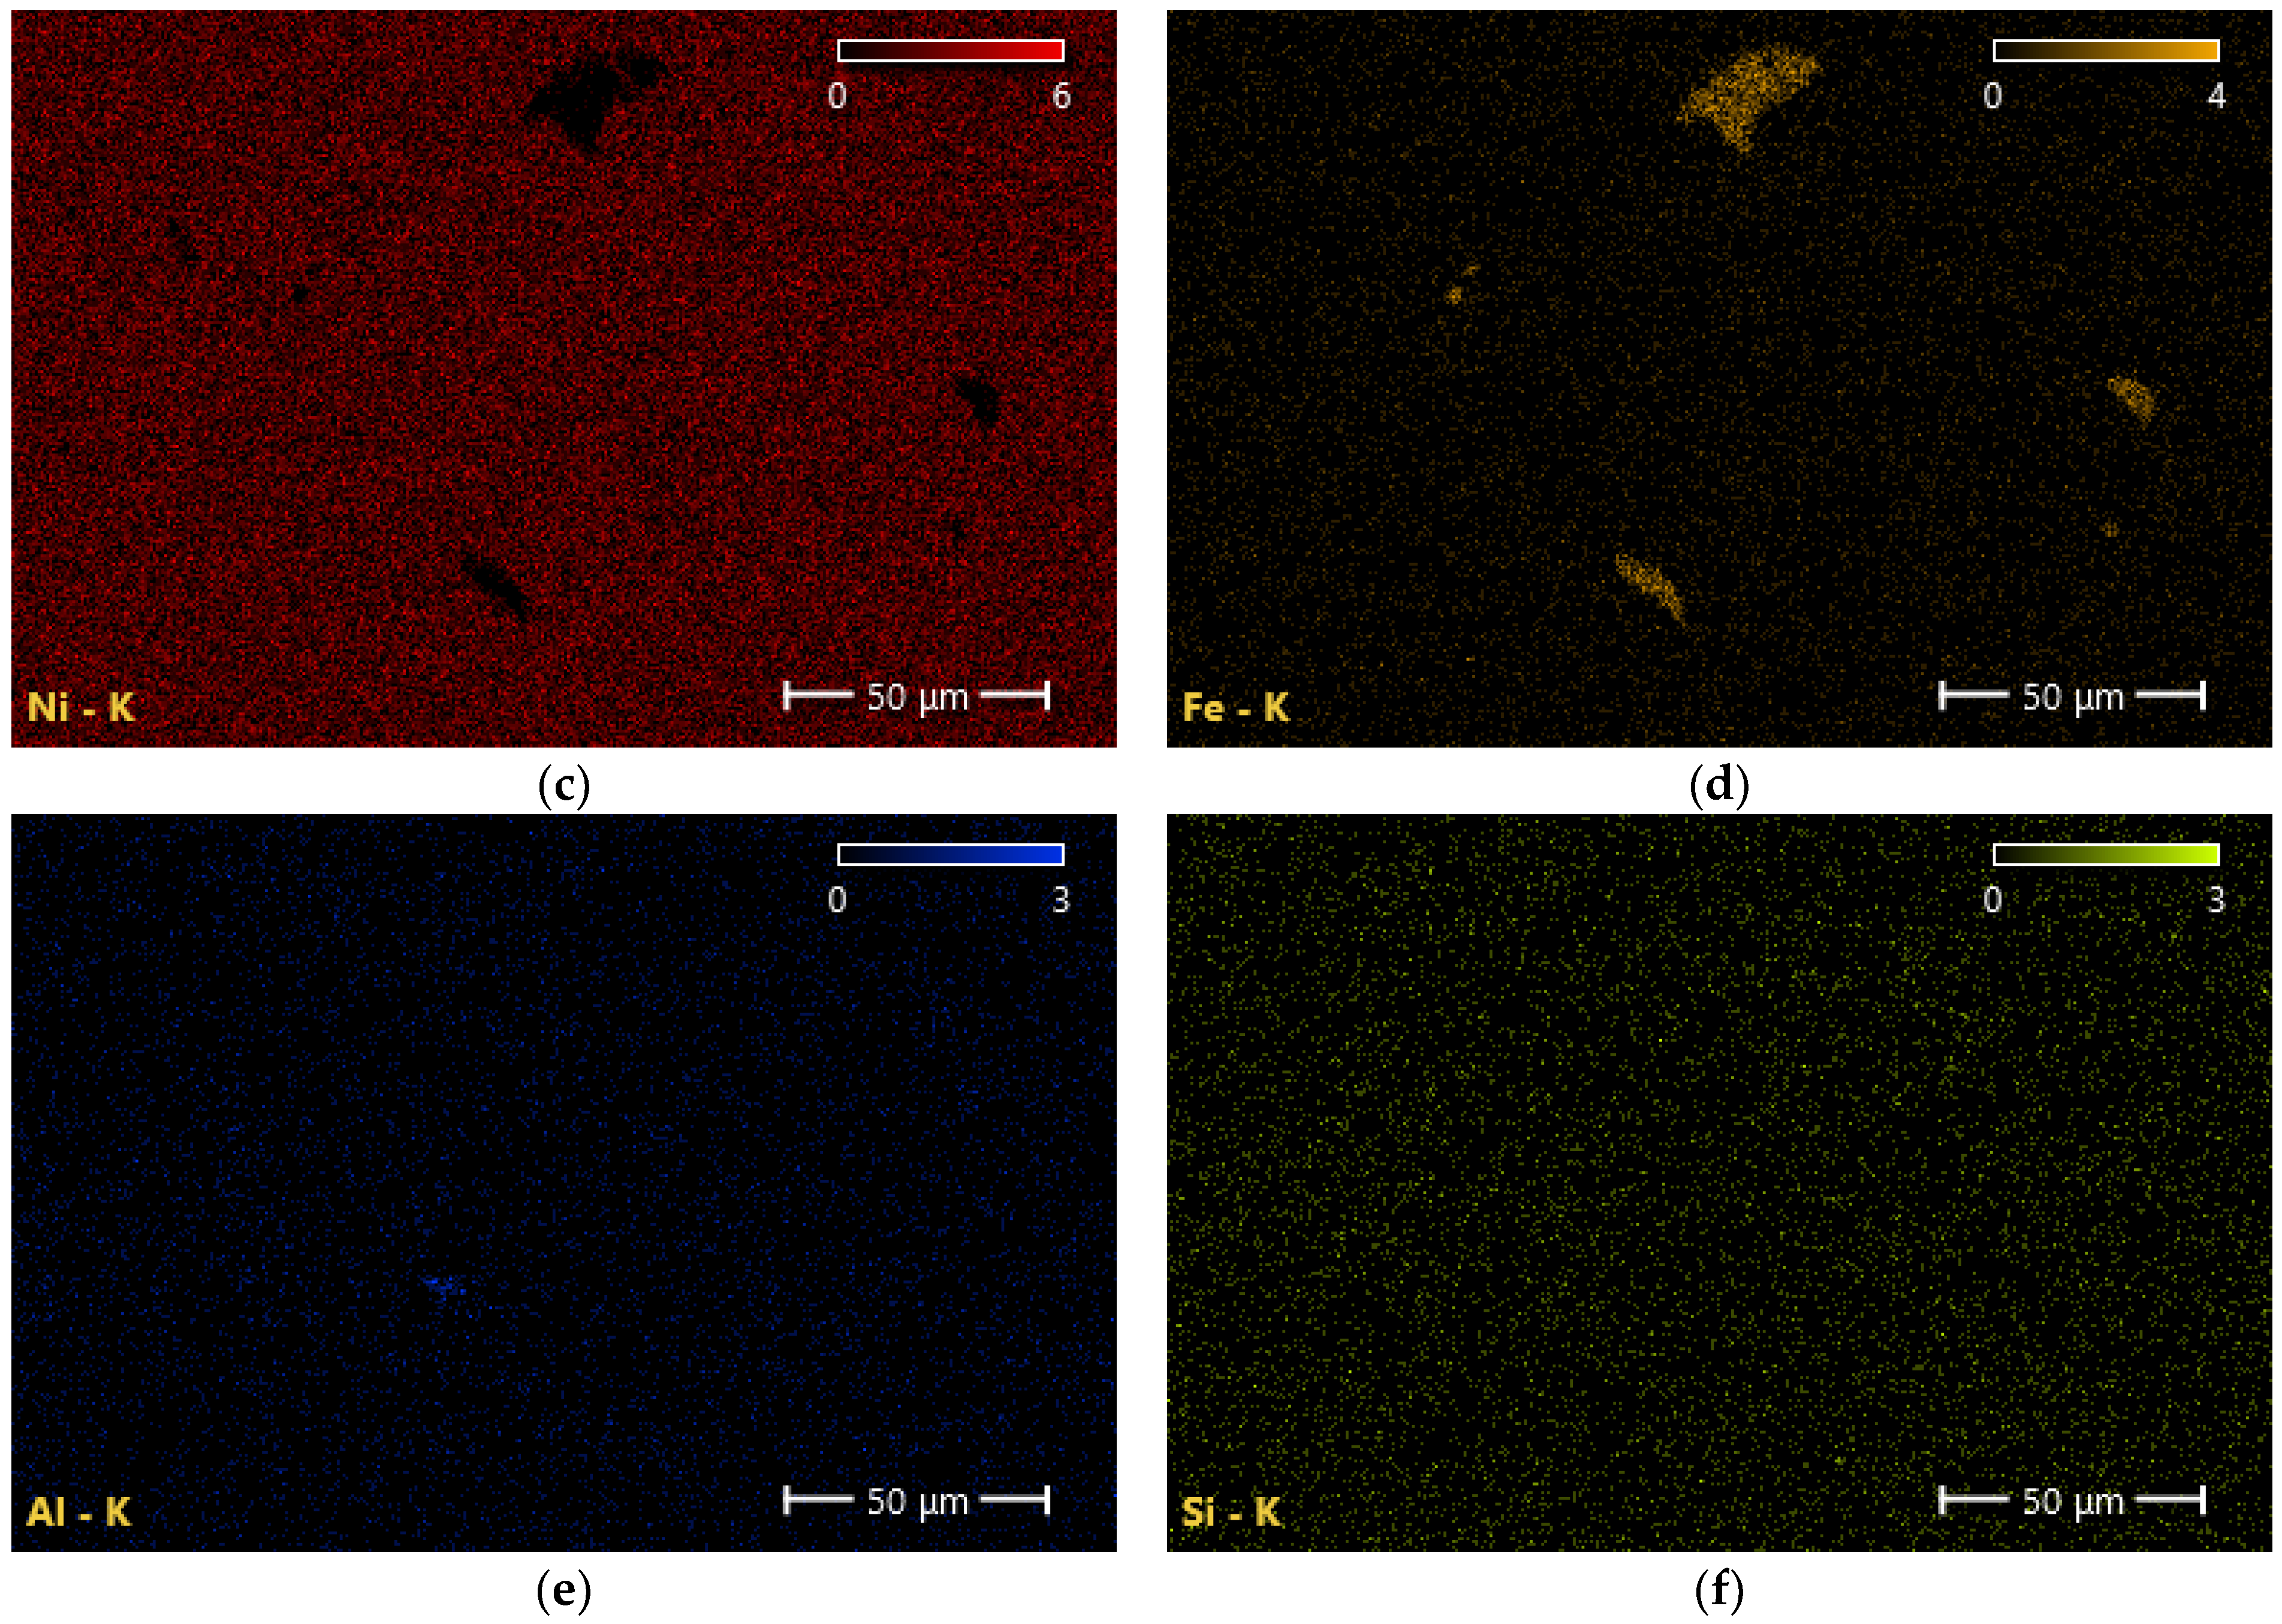
Figure 11.
EDS count map of the uncleaned surface with distribution of carbon (a), oxygen (b), nickel (c), iron (d), aluminum (e), and silicon (f).
Figure 11.
EDS count map of the uncleaned surface with distribution of carbon (a), oxygen (b), nickel (c), iron (d), aluminum (e), and silicon (f).
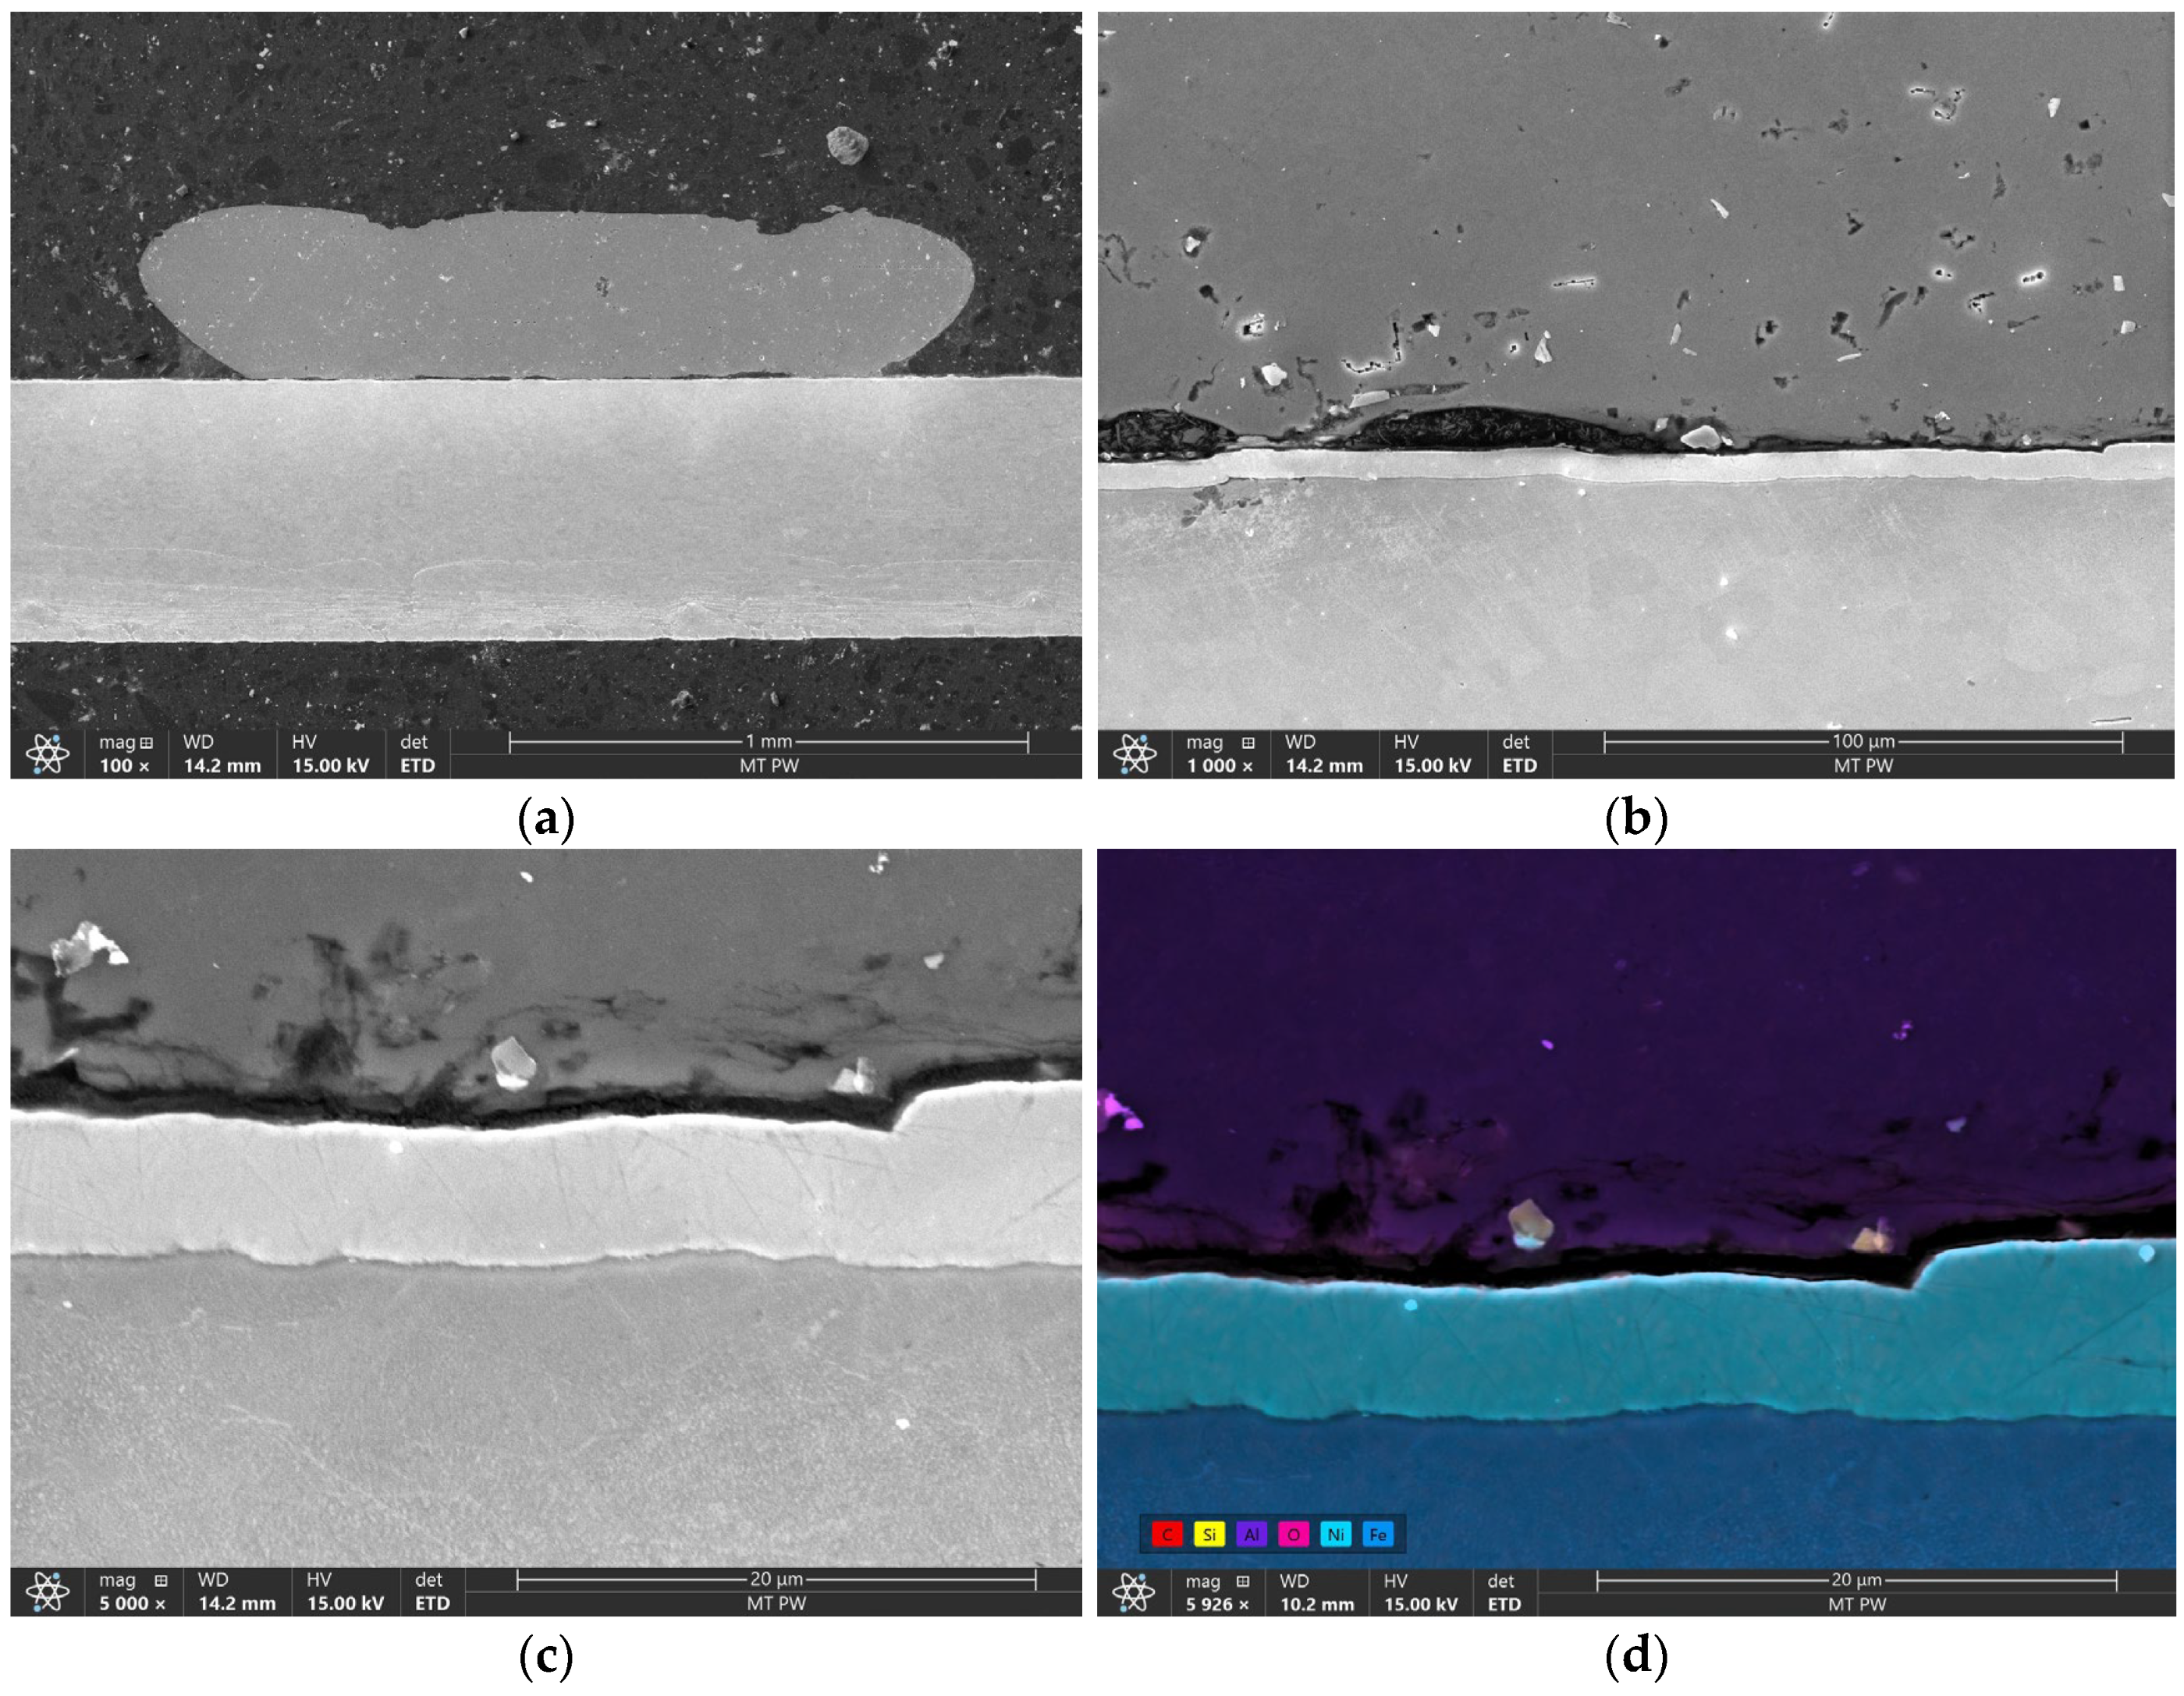
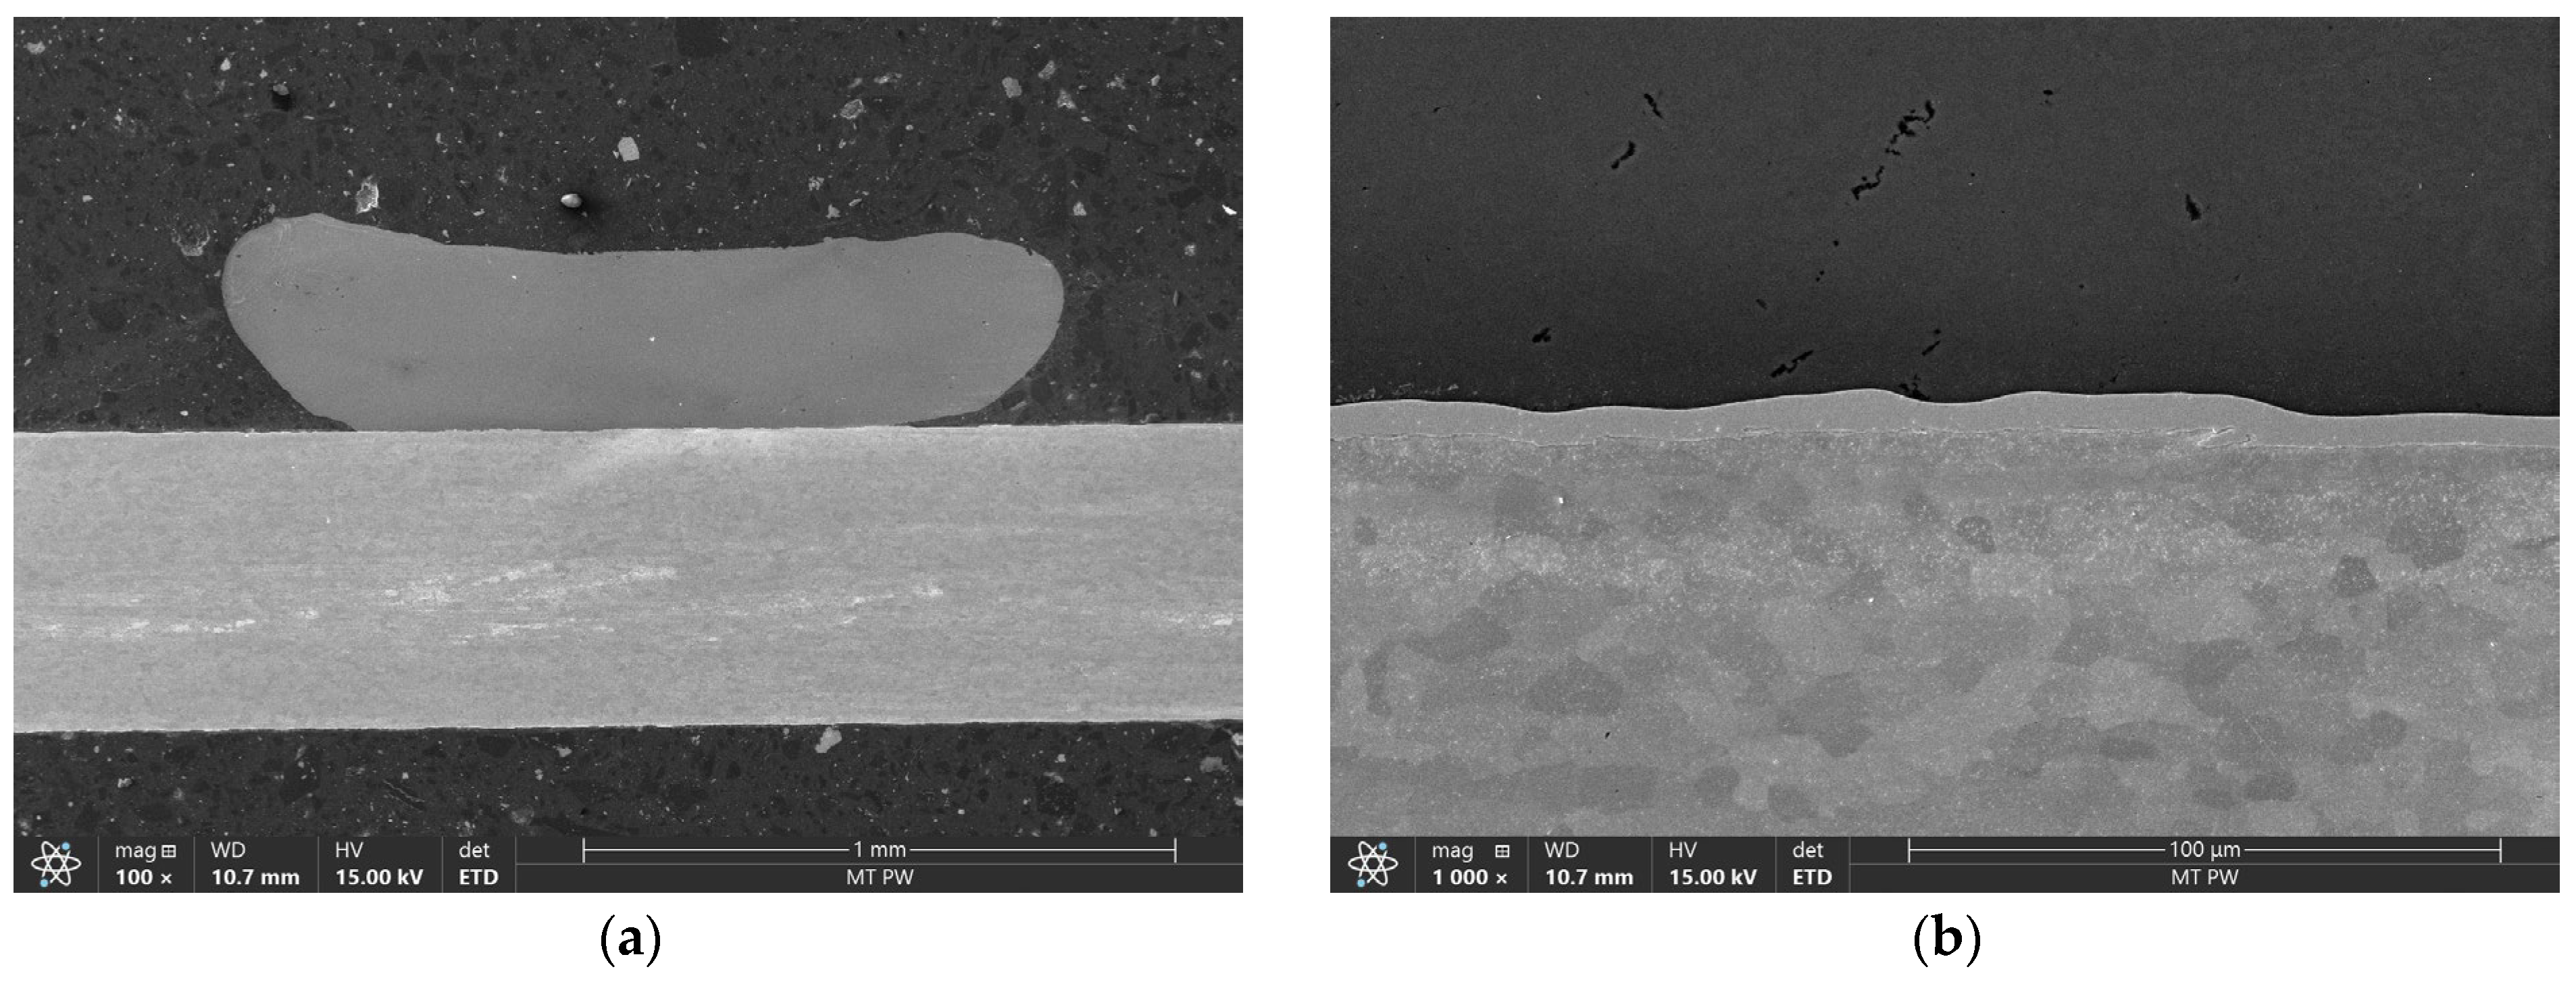
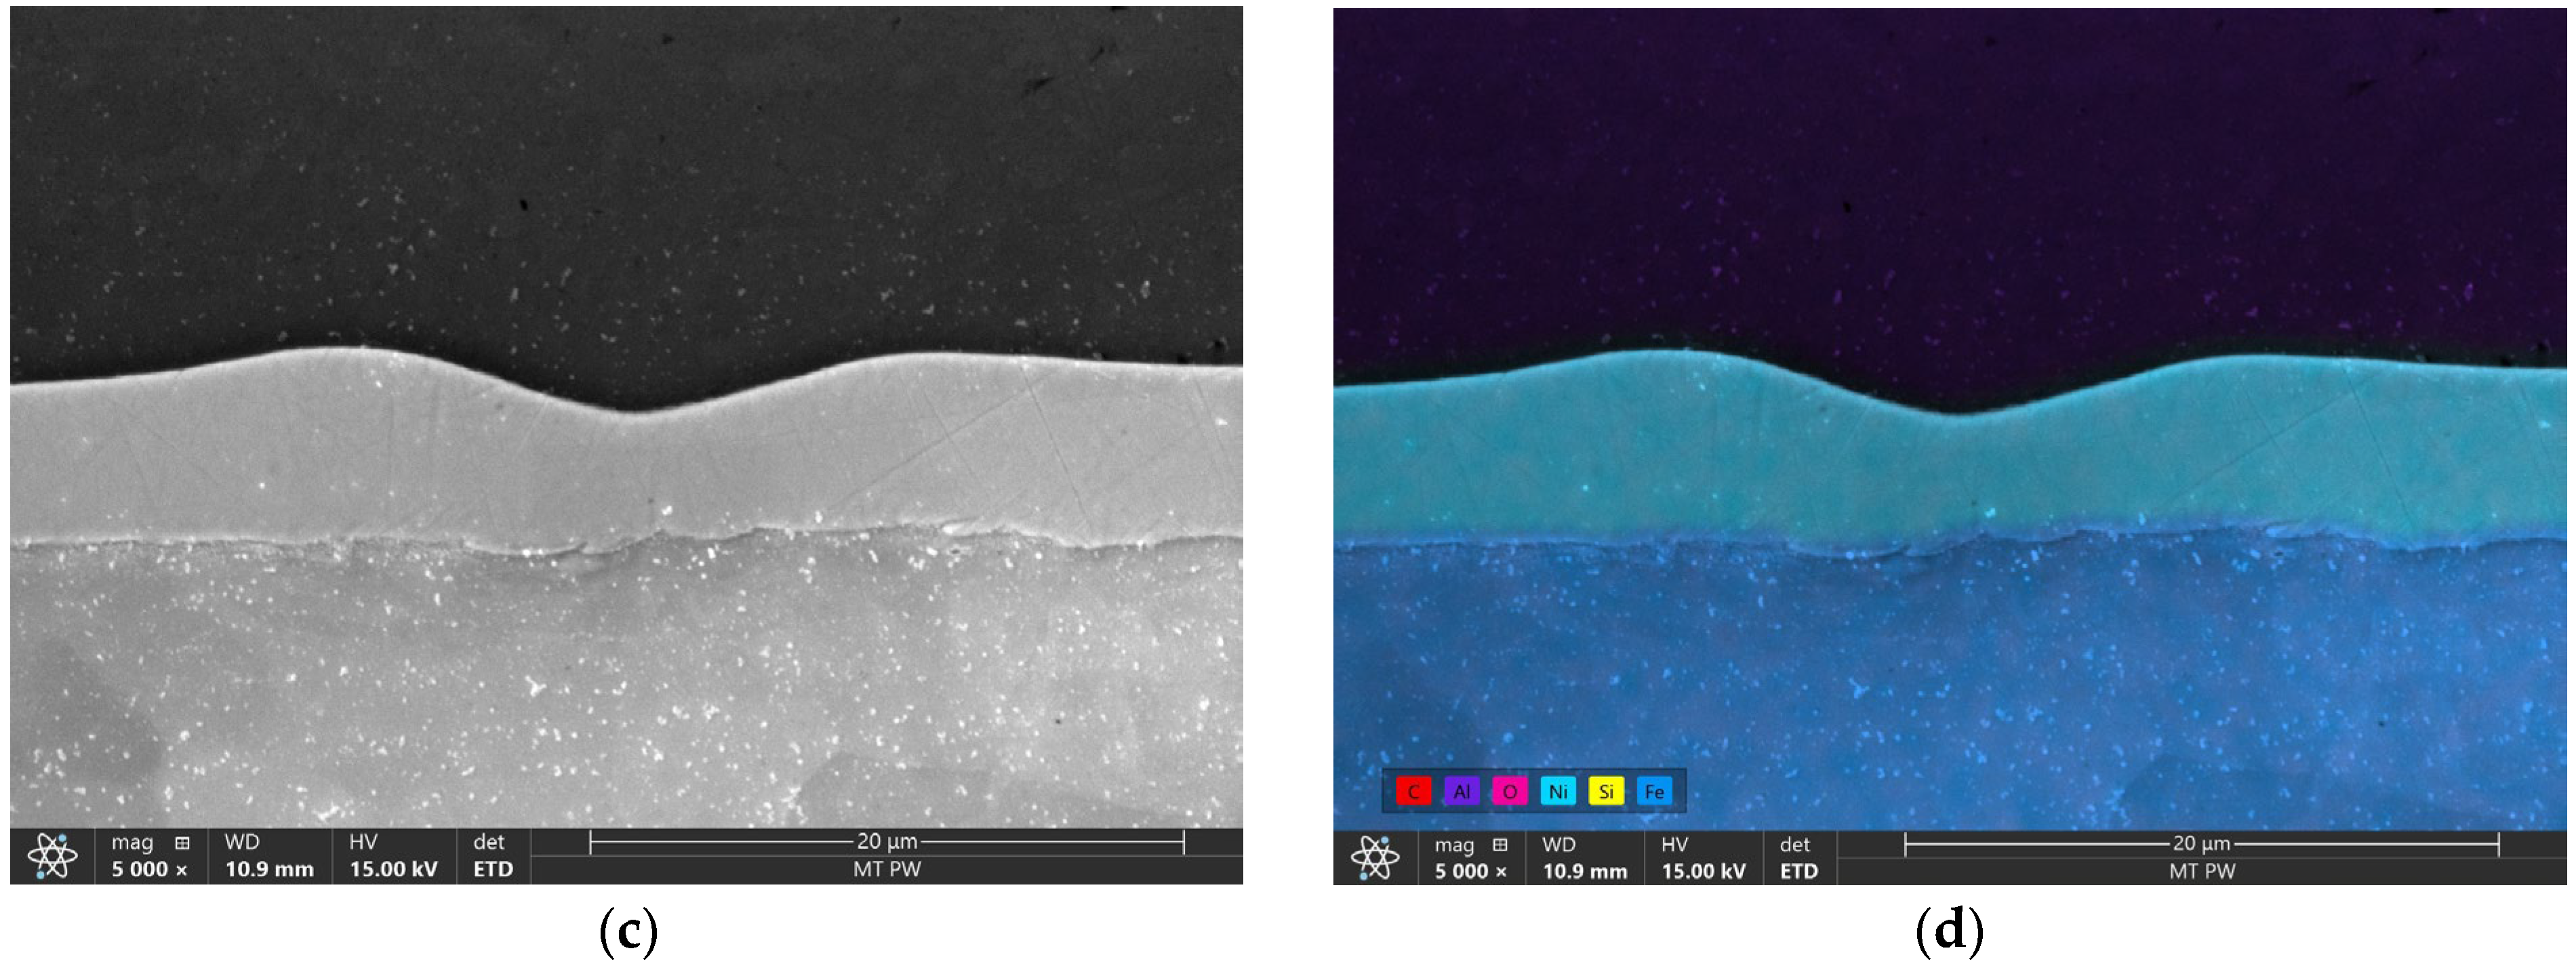
Figure 12.
SEM images of the bonded wire on uncleaned sample cross section in 100× (a), 1000× (b), 5000× (c) magnification and EDS quantity map of the sample (d).
Figure 12.
SEM images of the bonded wire on uncleaned sample cross section in 100× (a), 1000× (b), 5000× (c) magnification and EDS quantity map of the sample (d).
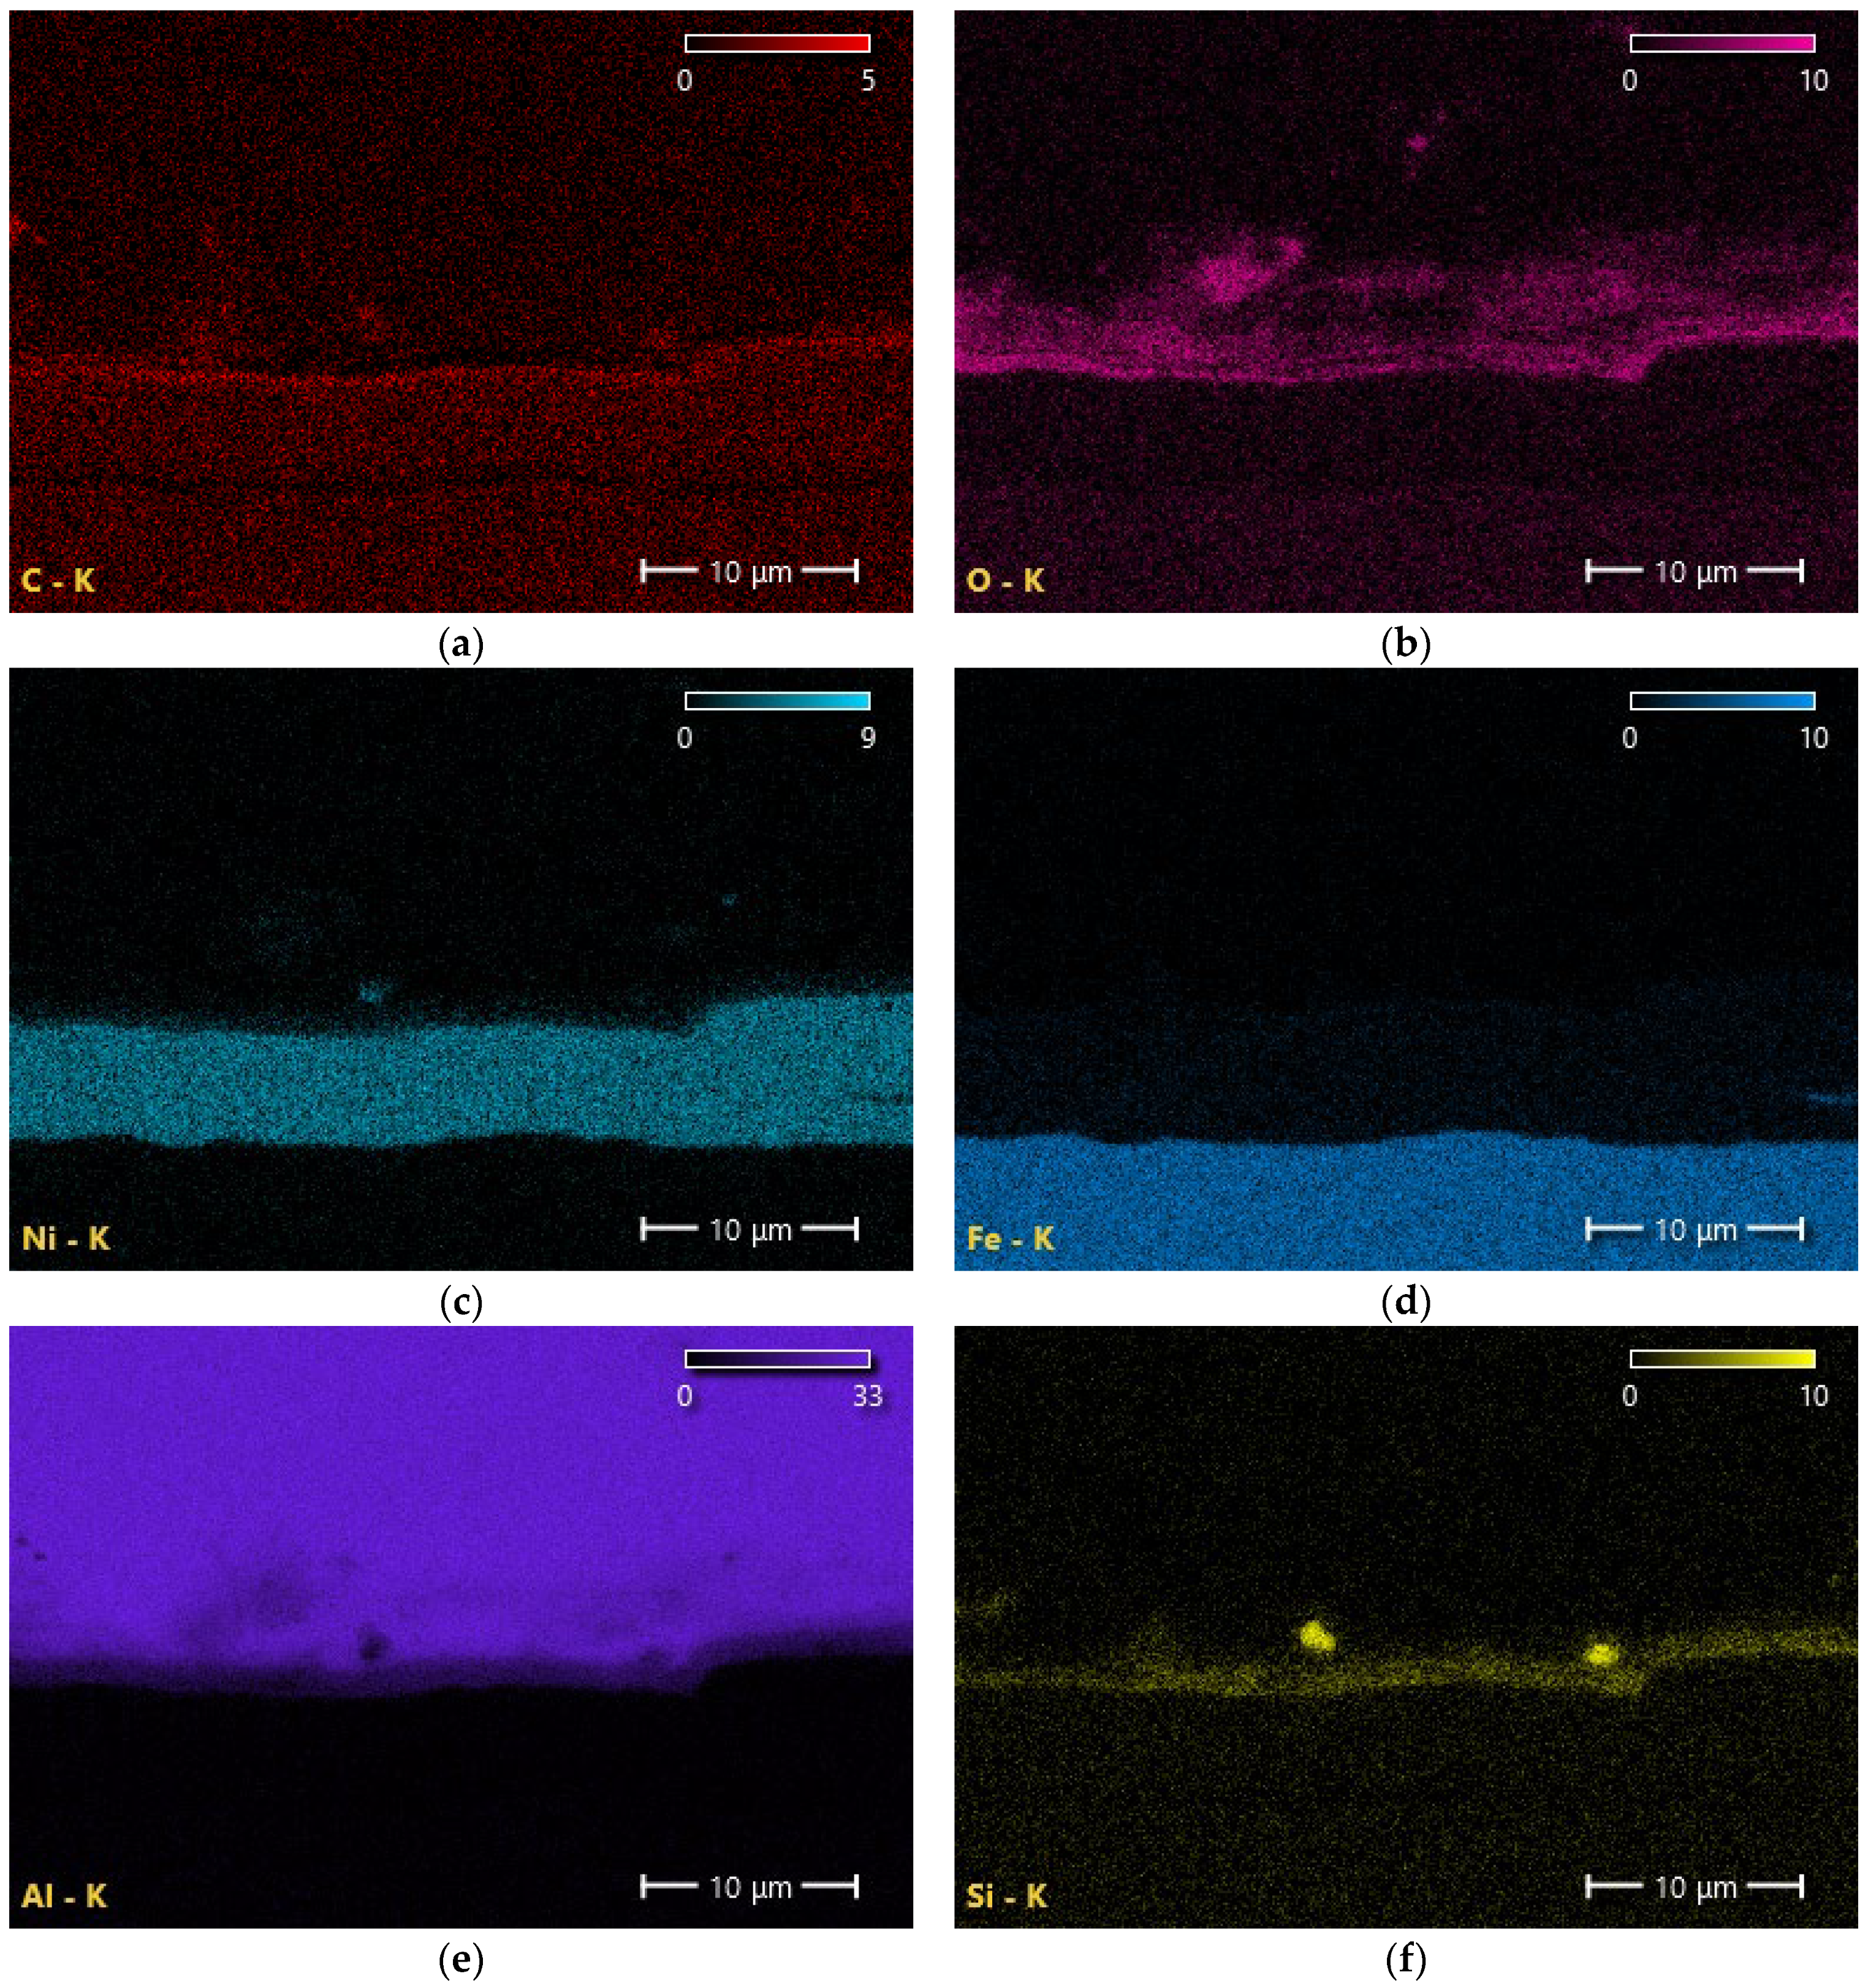
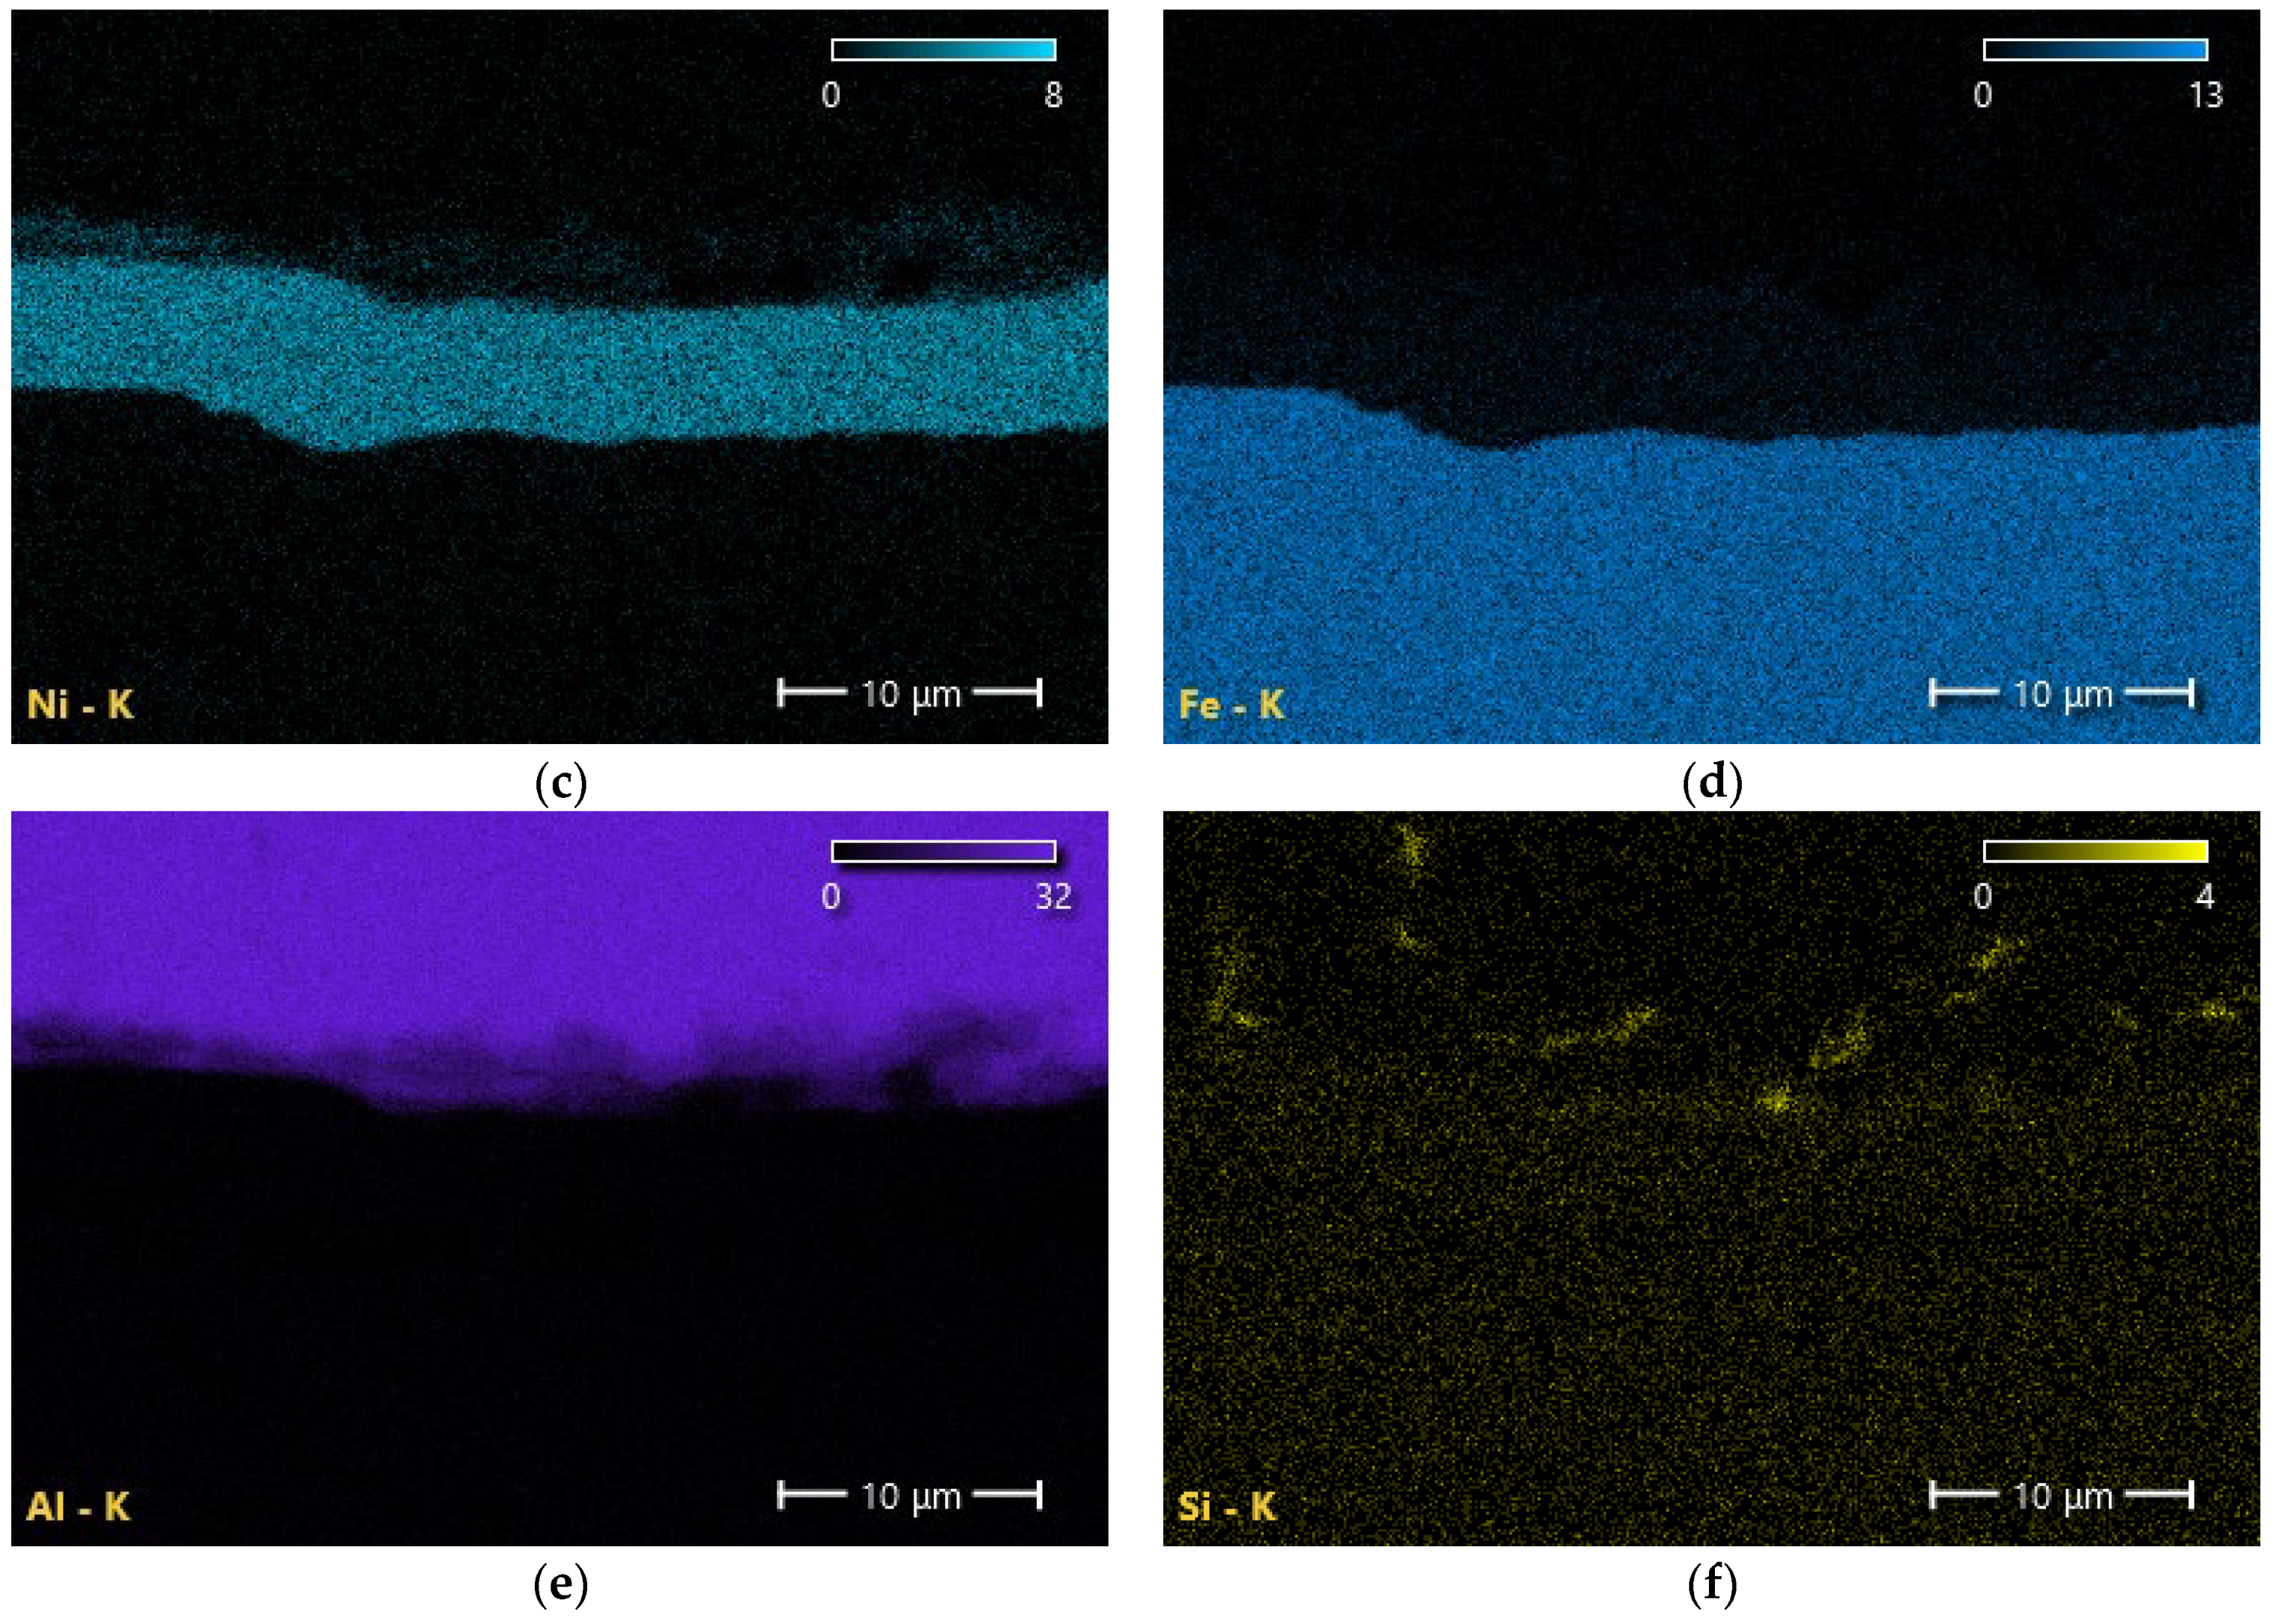
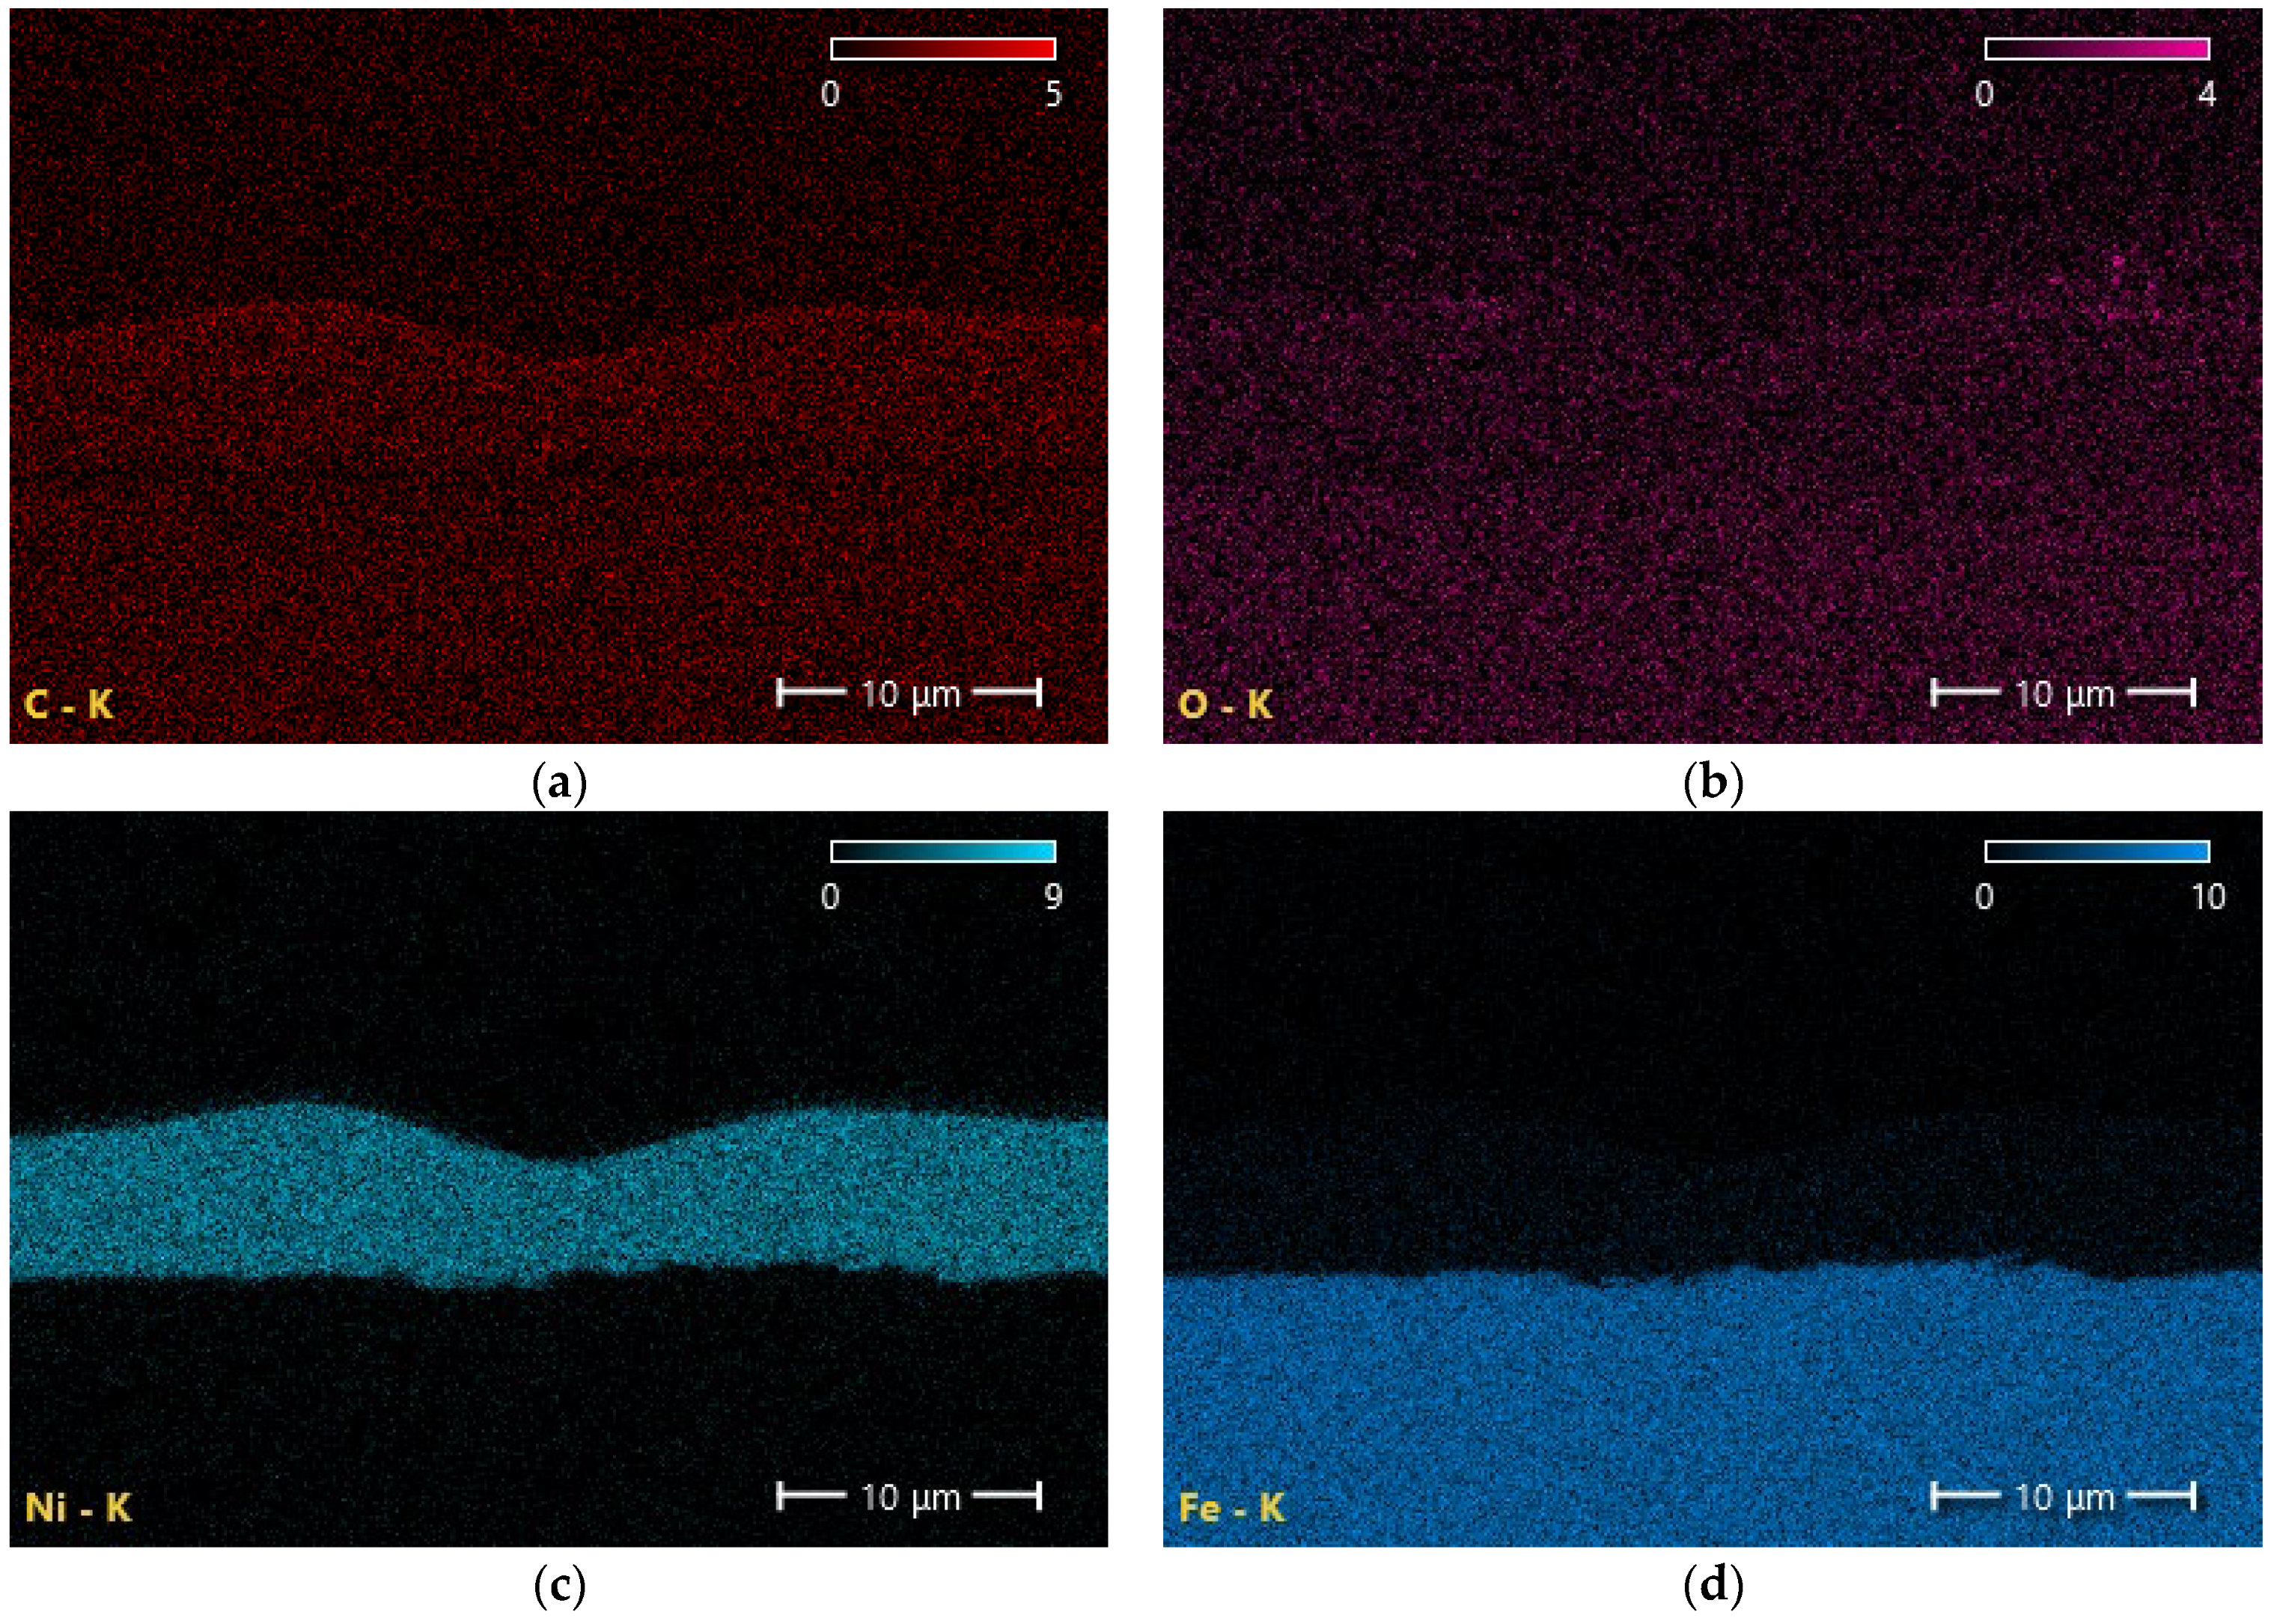
Figure 13.
EDS count map of the uncleaned sample bond cross section distribution of carbon (a), oxygen (b), nickel (c), iron (d), aluminum (e), and silicon (f).
Figure 13.
EDS count map of the uncleaned sample bond cross section distribution of carbon (a), oxygen (b), nickel (c), iron (d), aluminum (e), and silicon (f).
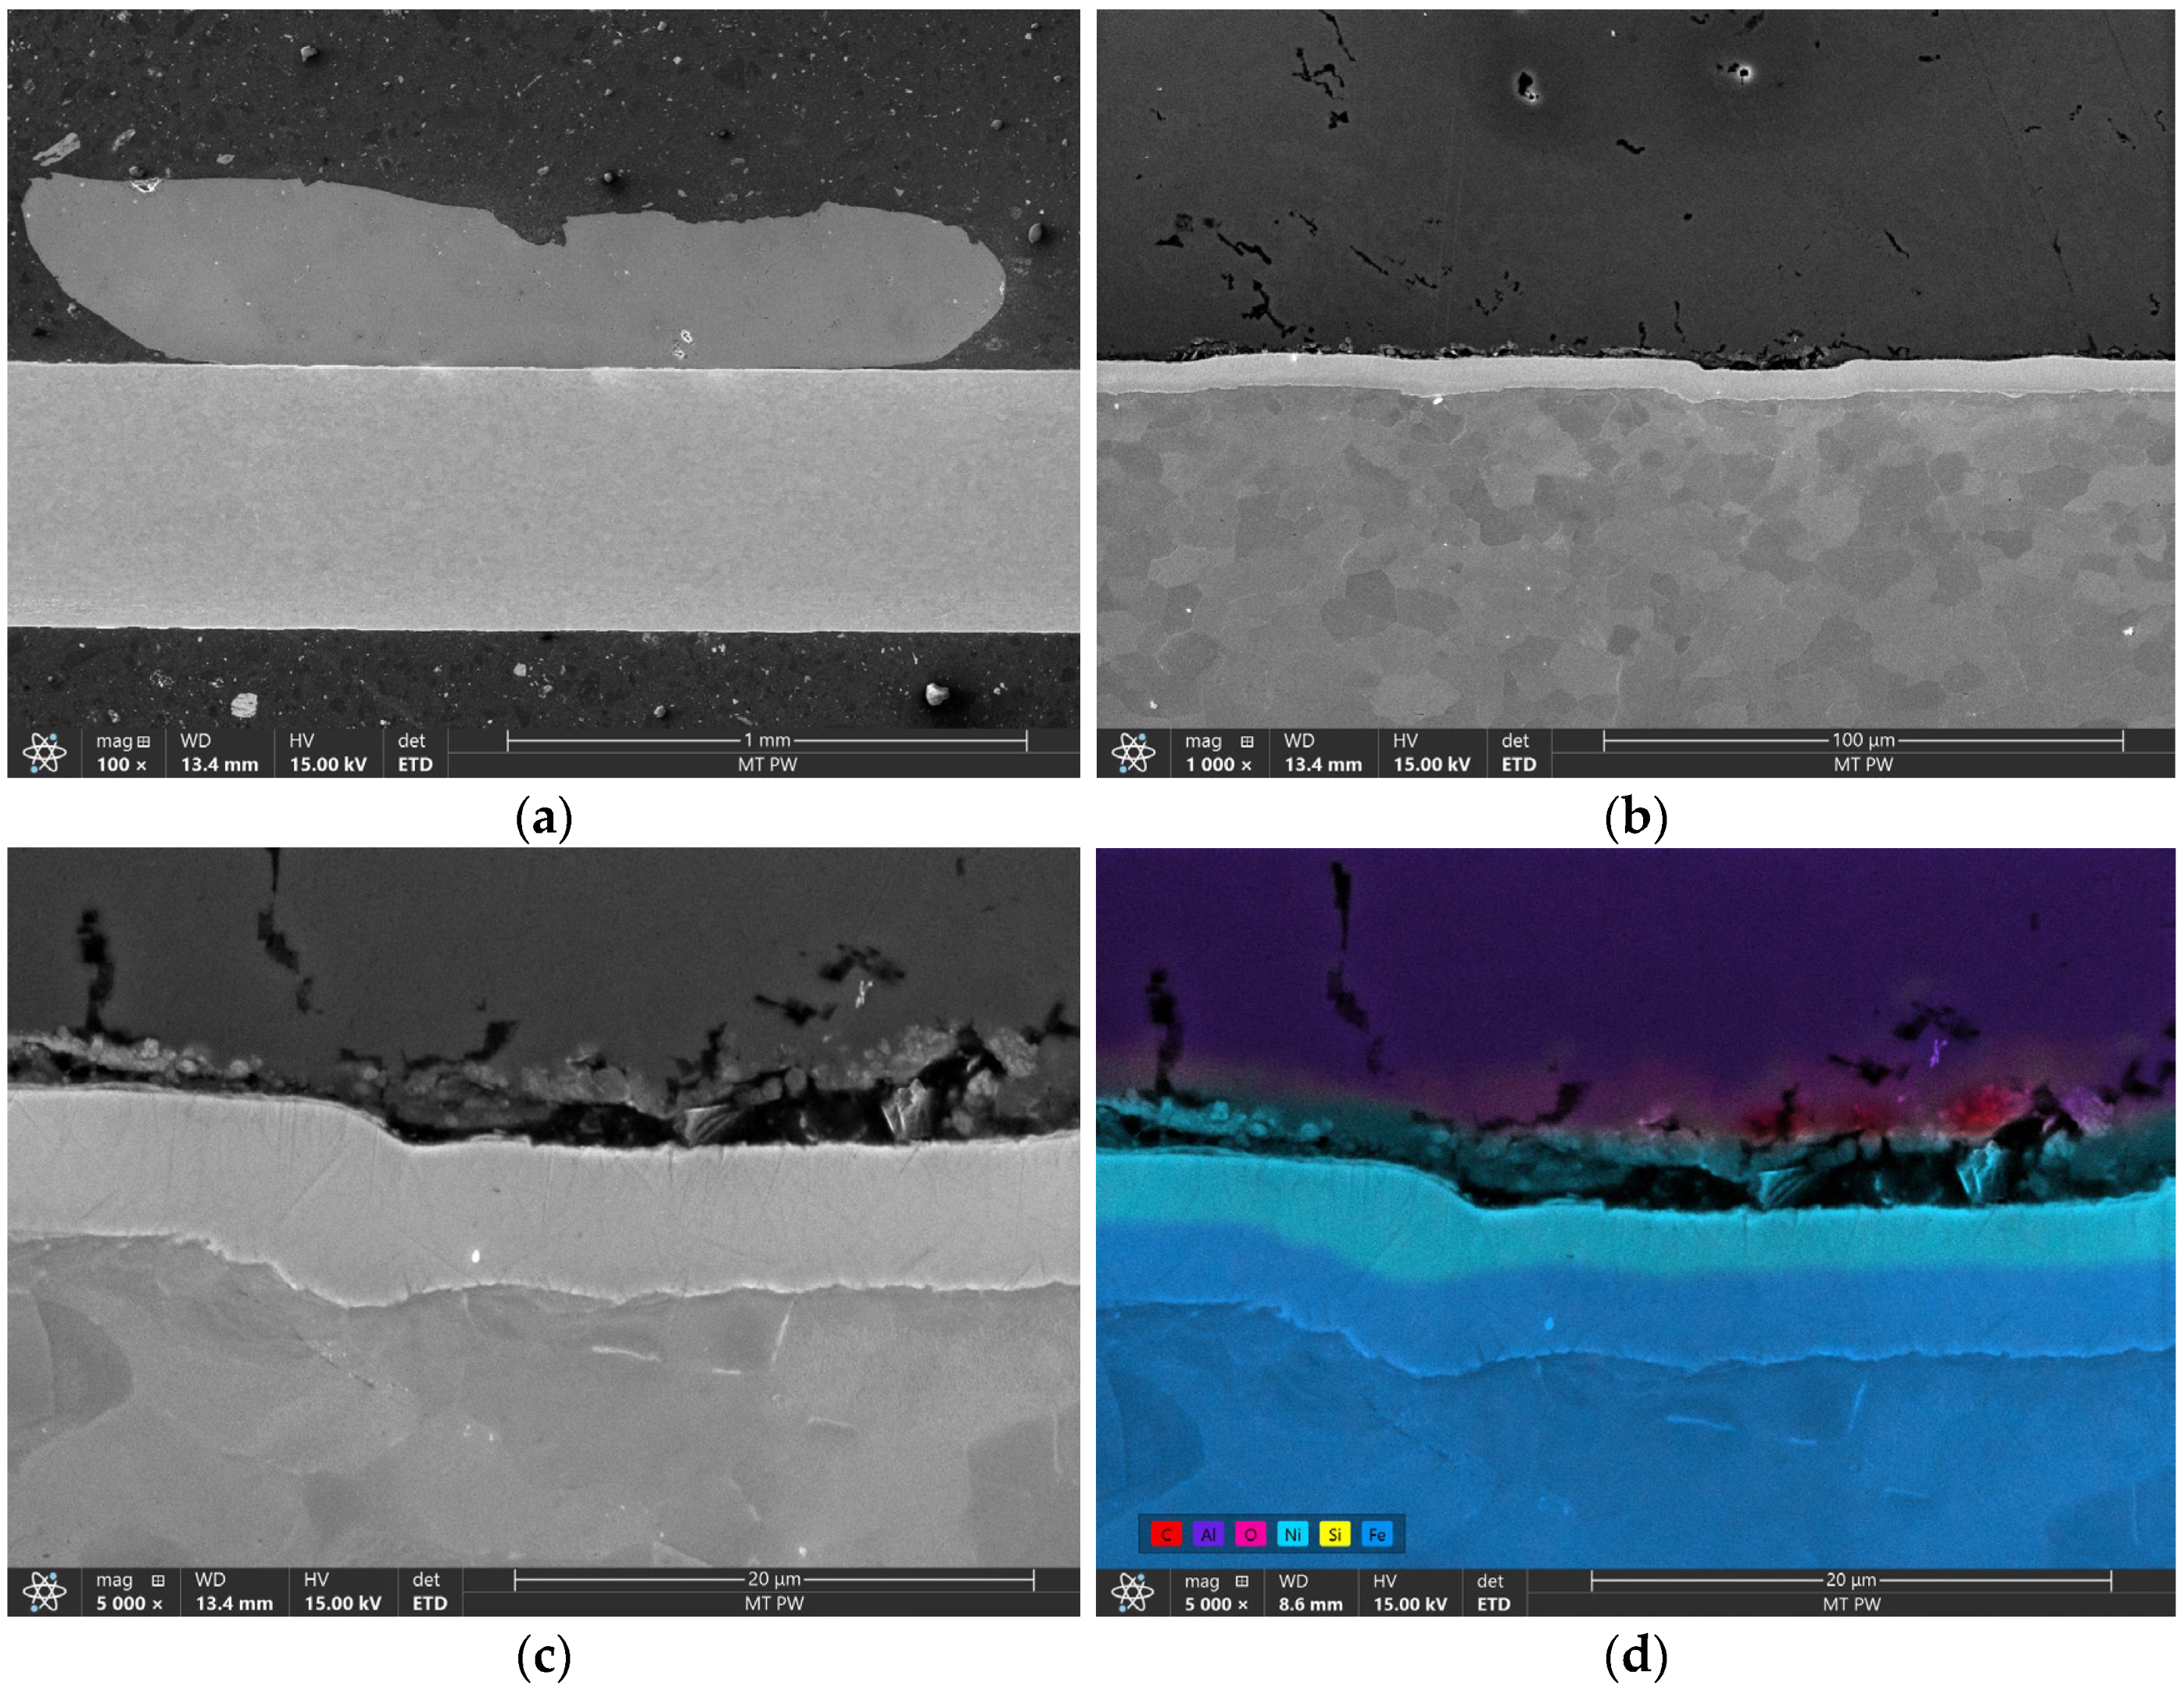
Figure 14.
SEM images of the bonded wire on 40% laser power cleaned sample cross section in 100× (a), 1000× (b), 5000× (c) magnification and EDS quantity map of the sample (d).
Figure 14.
SEM images of the bonded wire on 40% laser power cleaned sample cross section in 100× (a), 1000× (b), 5000× (c) magnification and EDS quantity map of the sample (d).
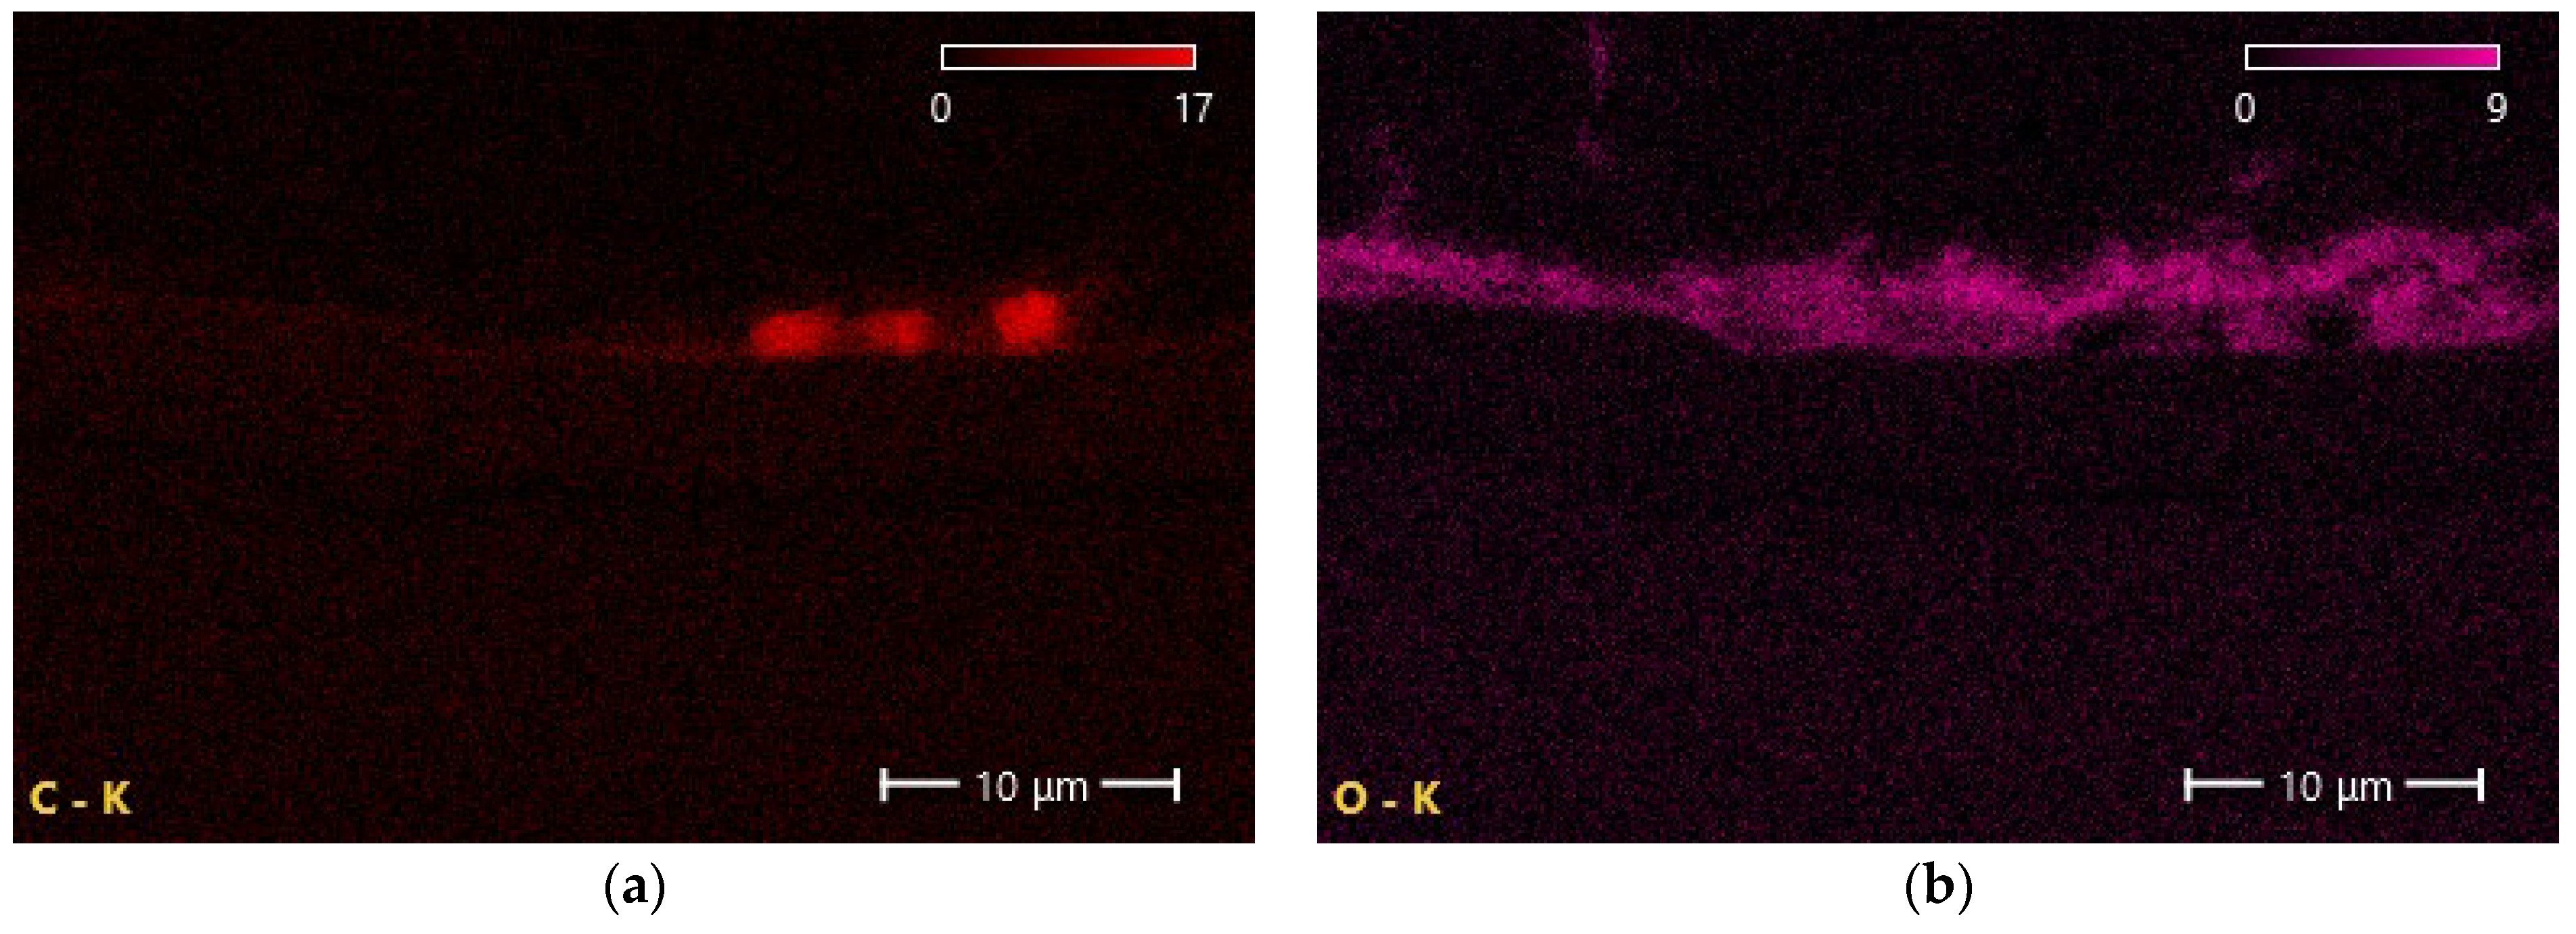
Figure 15.
EDS count map of the 40% laser power cleaned sample bond cross section distribution of carbon (a), oxygen (b), nickel (c), iron (d), aluminum (e), and silicon (f).
Figure 15.
EDS count map of the 40% laser power cleaned sample bond cross section distribution of carbon (a), oxygen (b), nickel (c), iron (d), aluminum (e), and silicon (f).
Figure 16.
SEM images of the bonded wire on 80% laser power cleaned sample cross section in ×100 (a), ×1000 (b), ×5000 (c) magnification, and EDS quantity map of the sample (d).
Figure 16.
SEM images of the bonded wire on 80% laser power cleaned sample cross section in ×100 (a), ×1000 (b), ×5000 (c) magnification, and EDS quantity map of the sample (d).
Figure 17.
EDS count map of the 80% laser power cleaned sample bond cross section distribution of carbon (a), oxygen (b), nickel (c), iron (d), aluminum (e), and silicon (f).
Figure 17.
EDS count map of the 80% laser power cleaned sample bond cross section distribution of carbon (a), oxygen (b), nickel (c), iron (d), aluminum (e), and silicon (f).
Figure 18.
Shear test force plots for 6 samples without laser cleaning.
Figure 18.
Shear test force plots for 6 samples without laser cleaning.
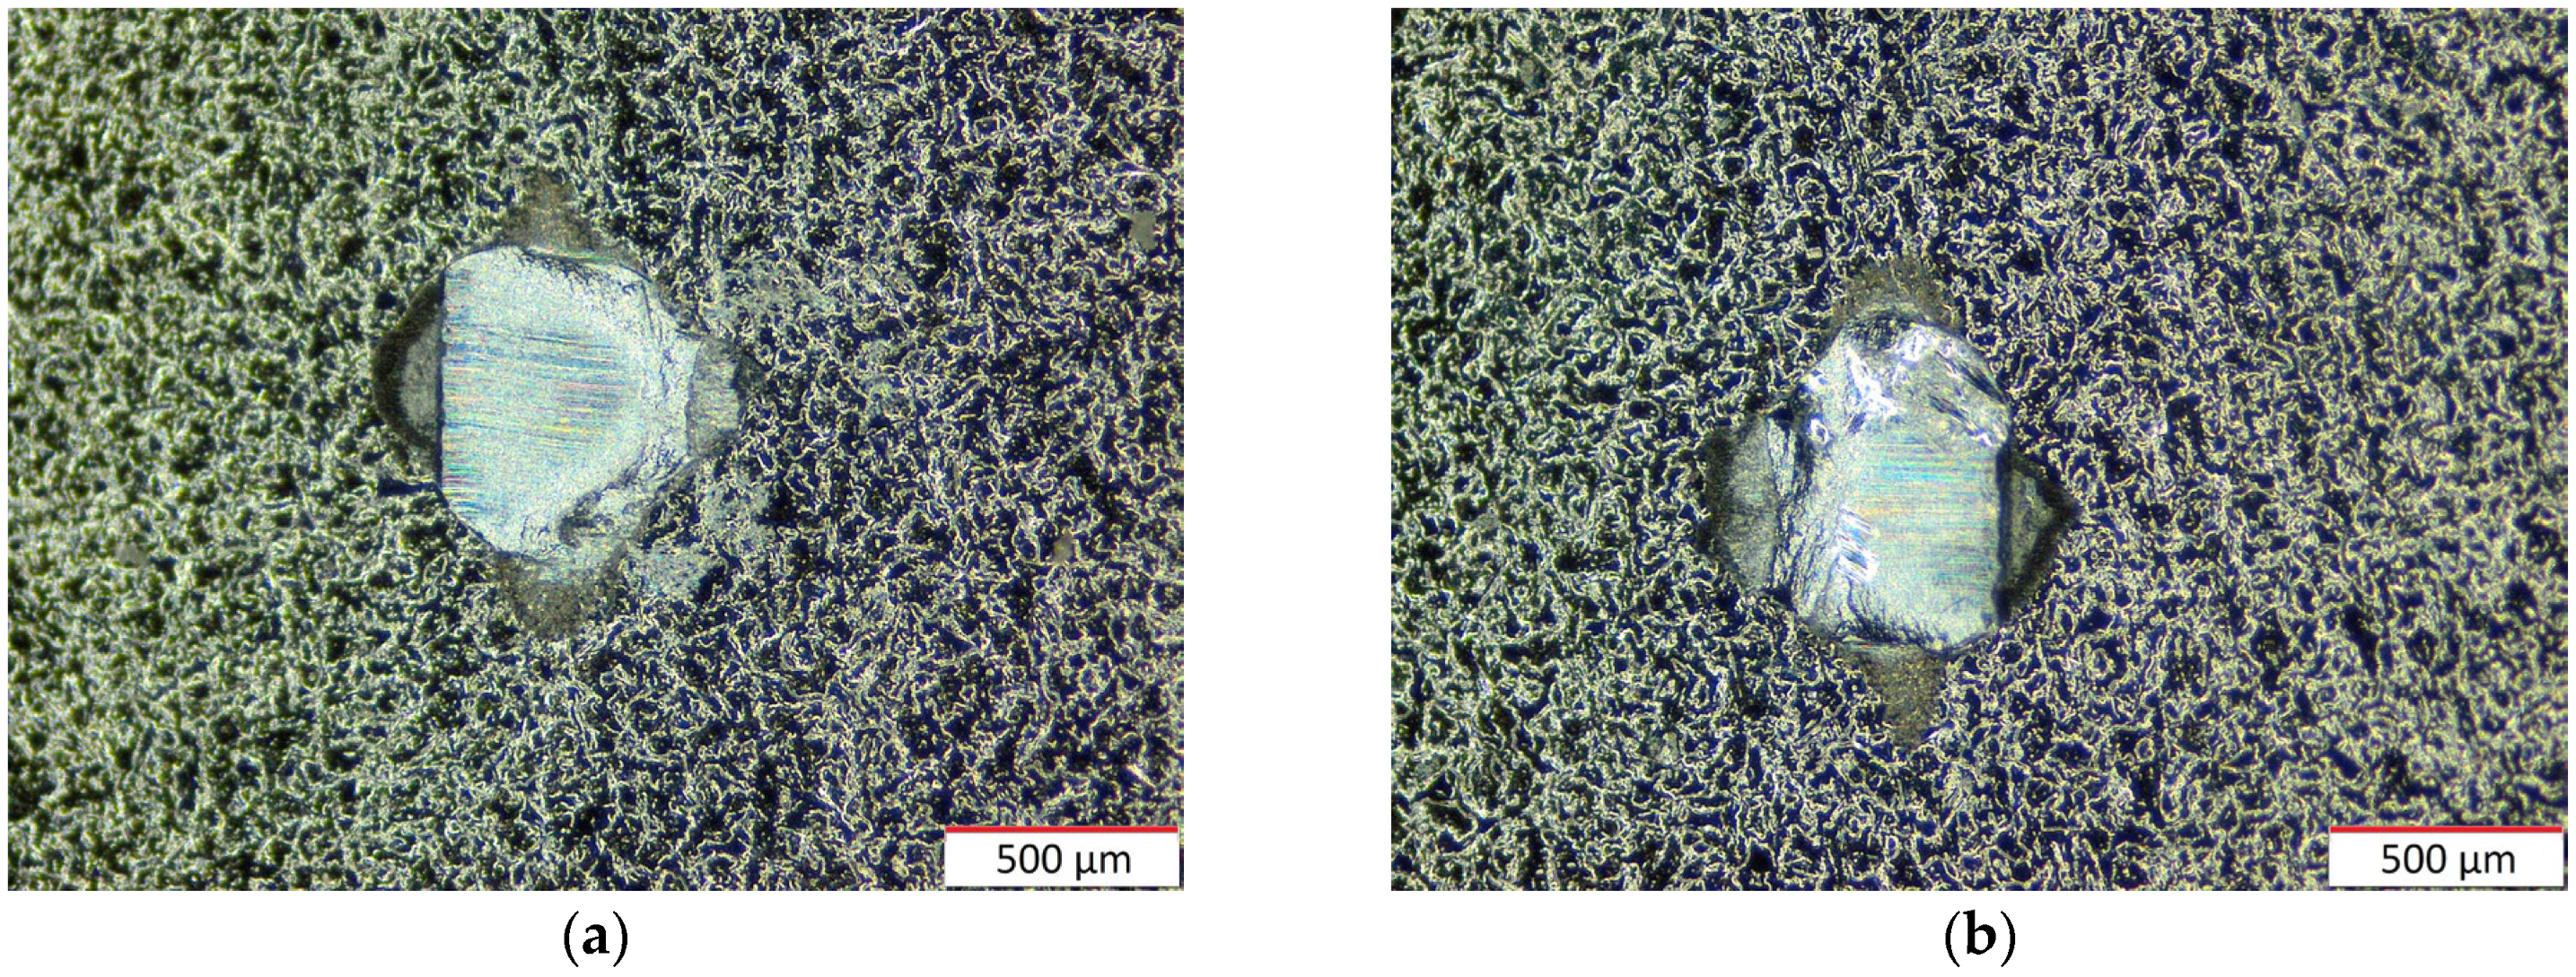
Figure 19.
Bonded nugget after shear testing for samples without laser cleaning with 45× magnification of samples 1–6 (a–f).
Figure 19.
Bonded nugget after shear testing for samples without laser cleaning with 45× magnification of samples 1–6 (a–f).
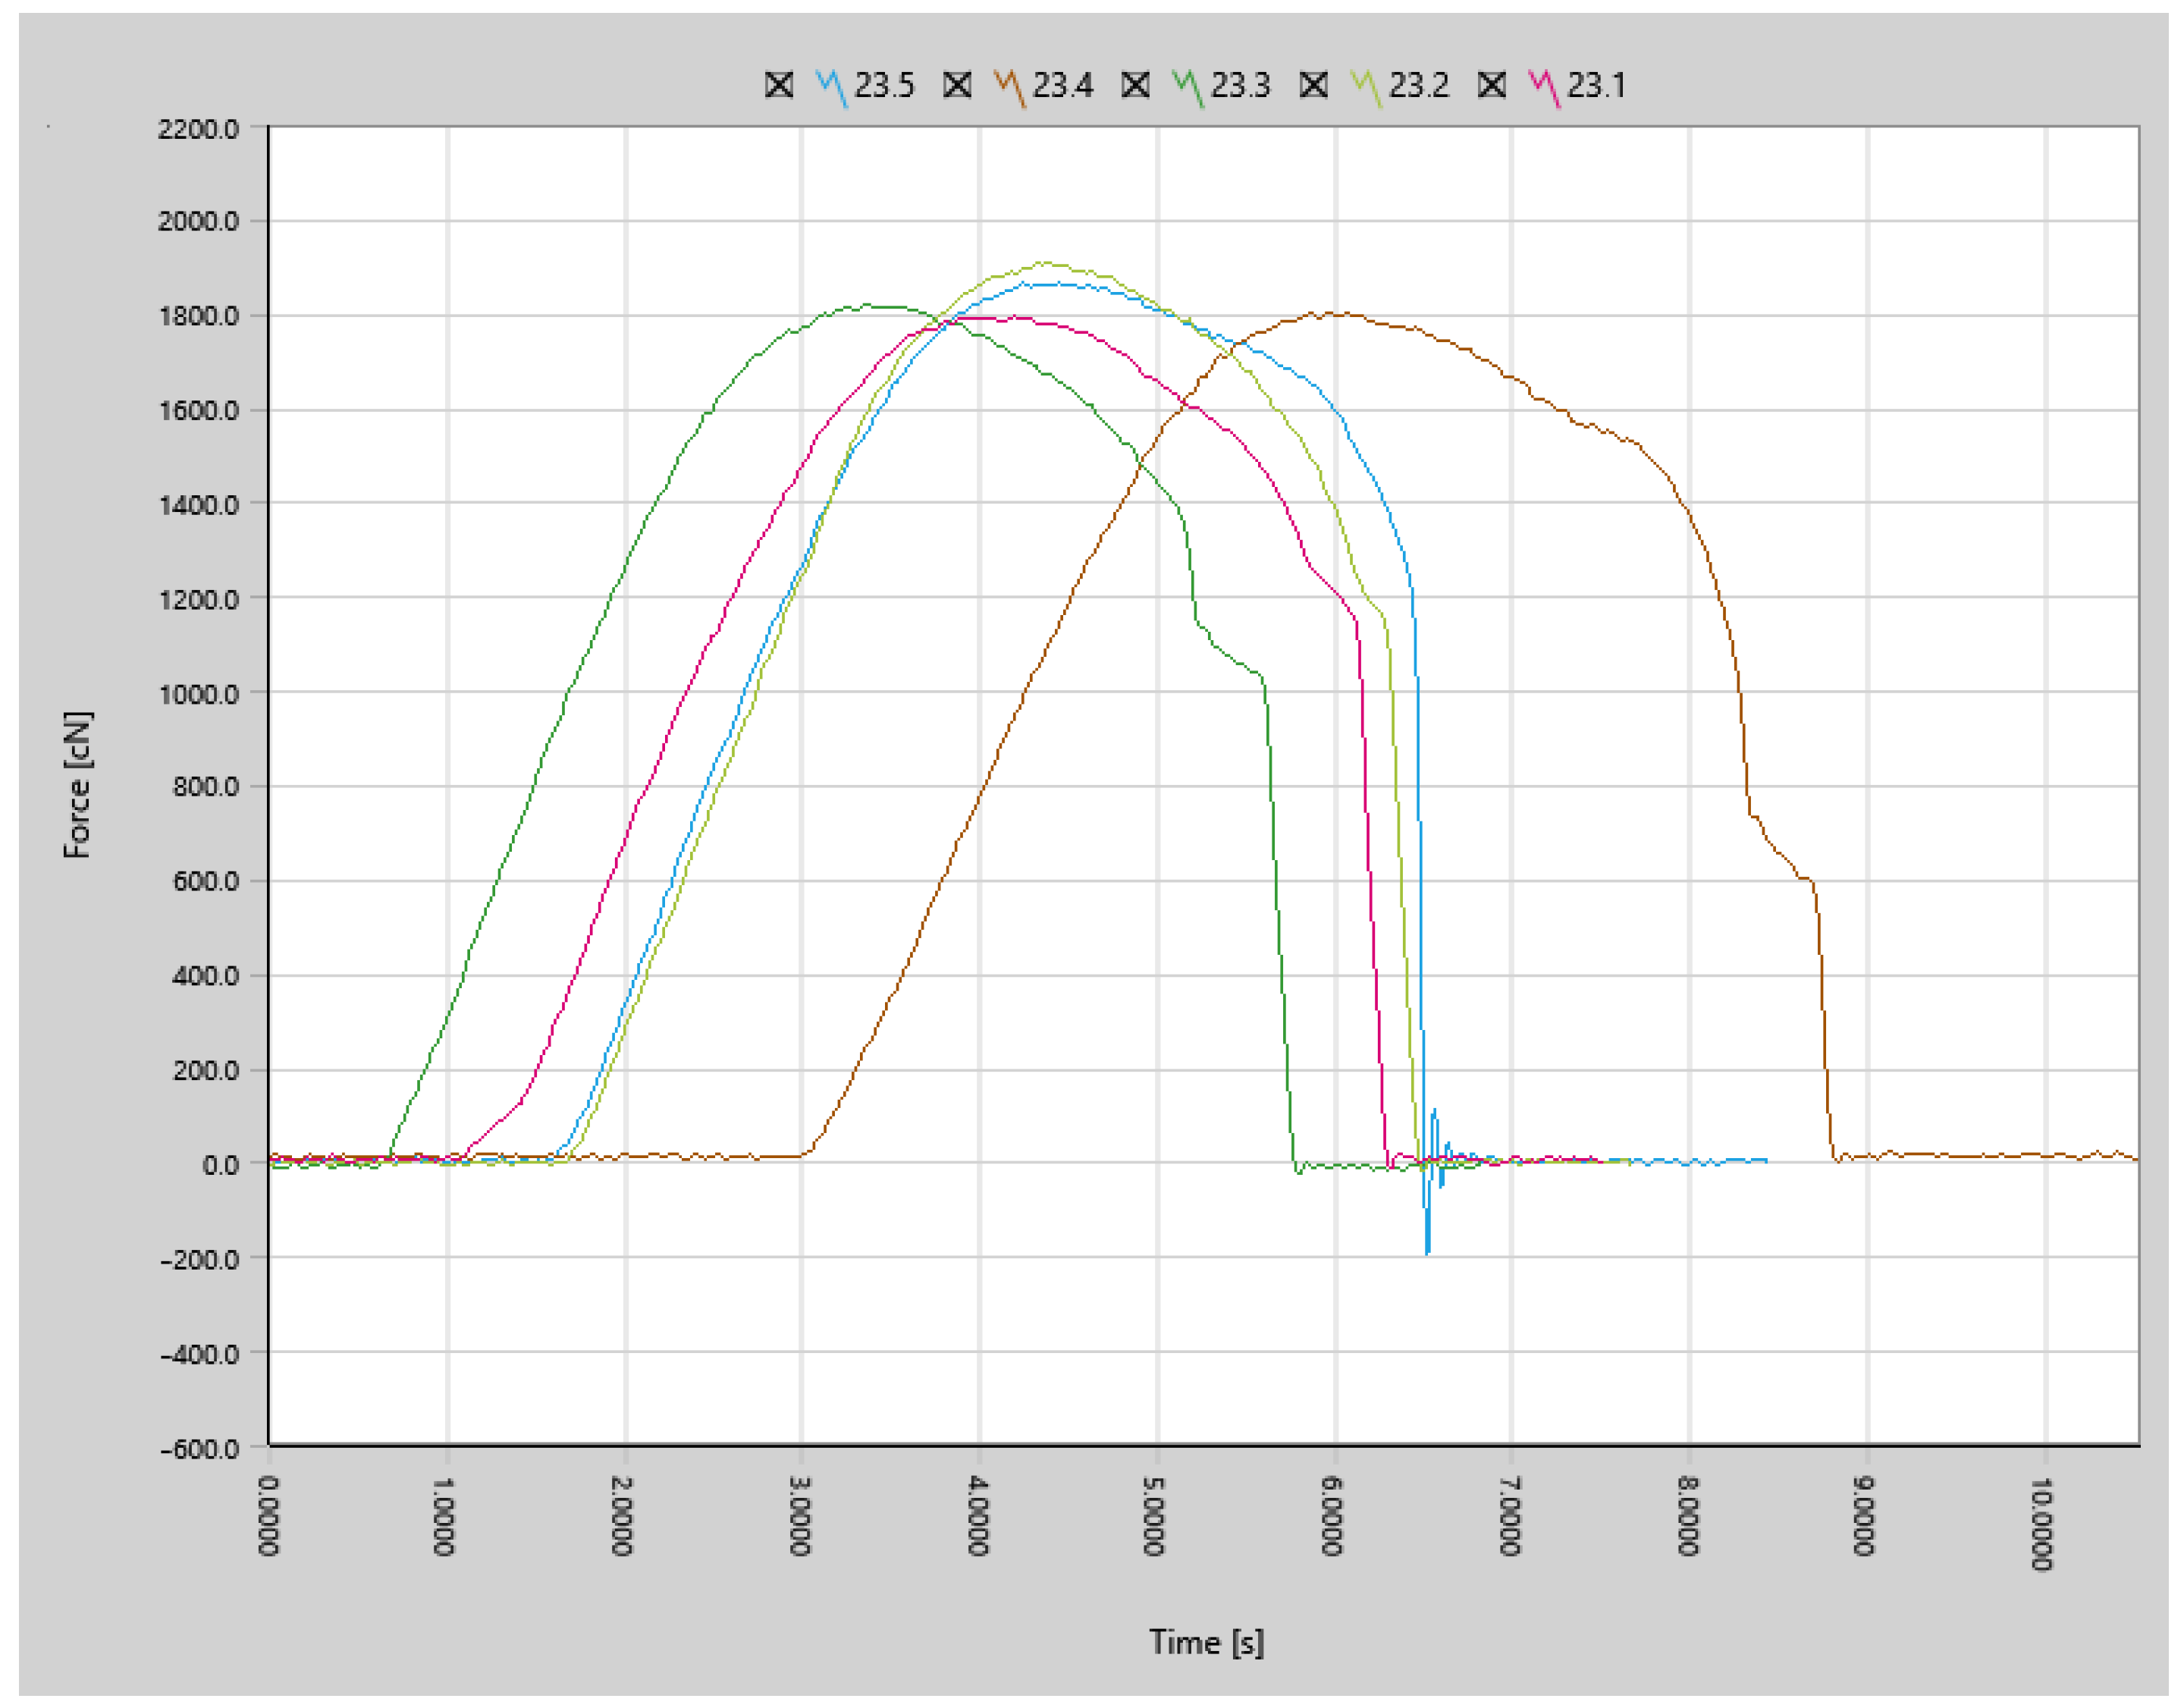
Figure 20.
Shear test force plots for 5 samples cleaned with 40% of the laser power.
Figure 20.
Shear test force plots for 5 samples cleaned with 40% of the laser power.
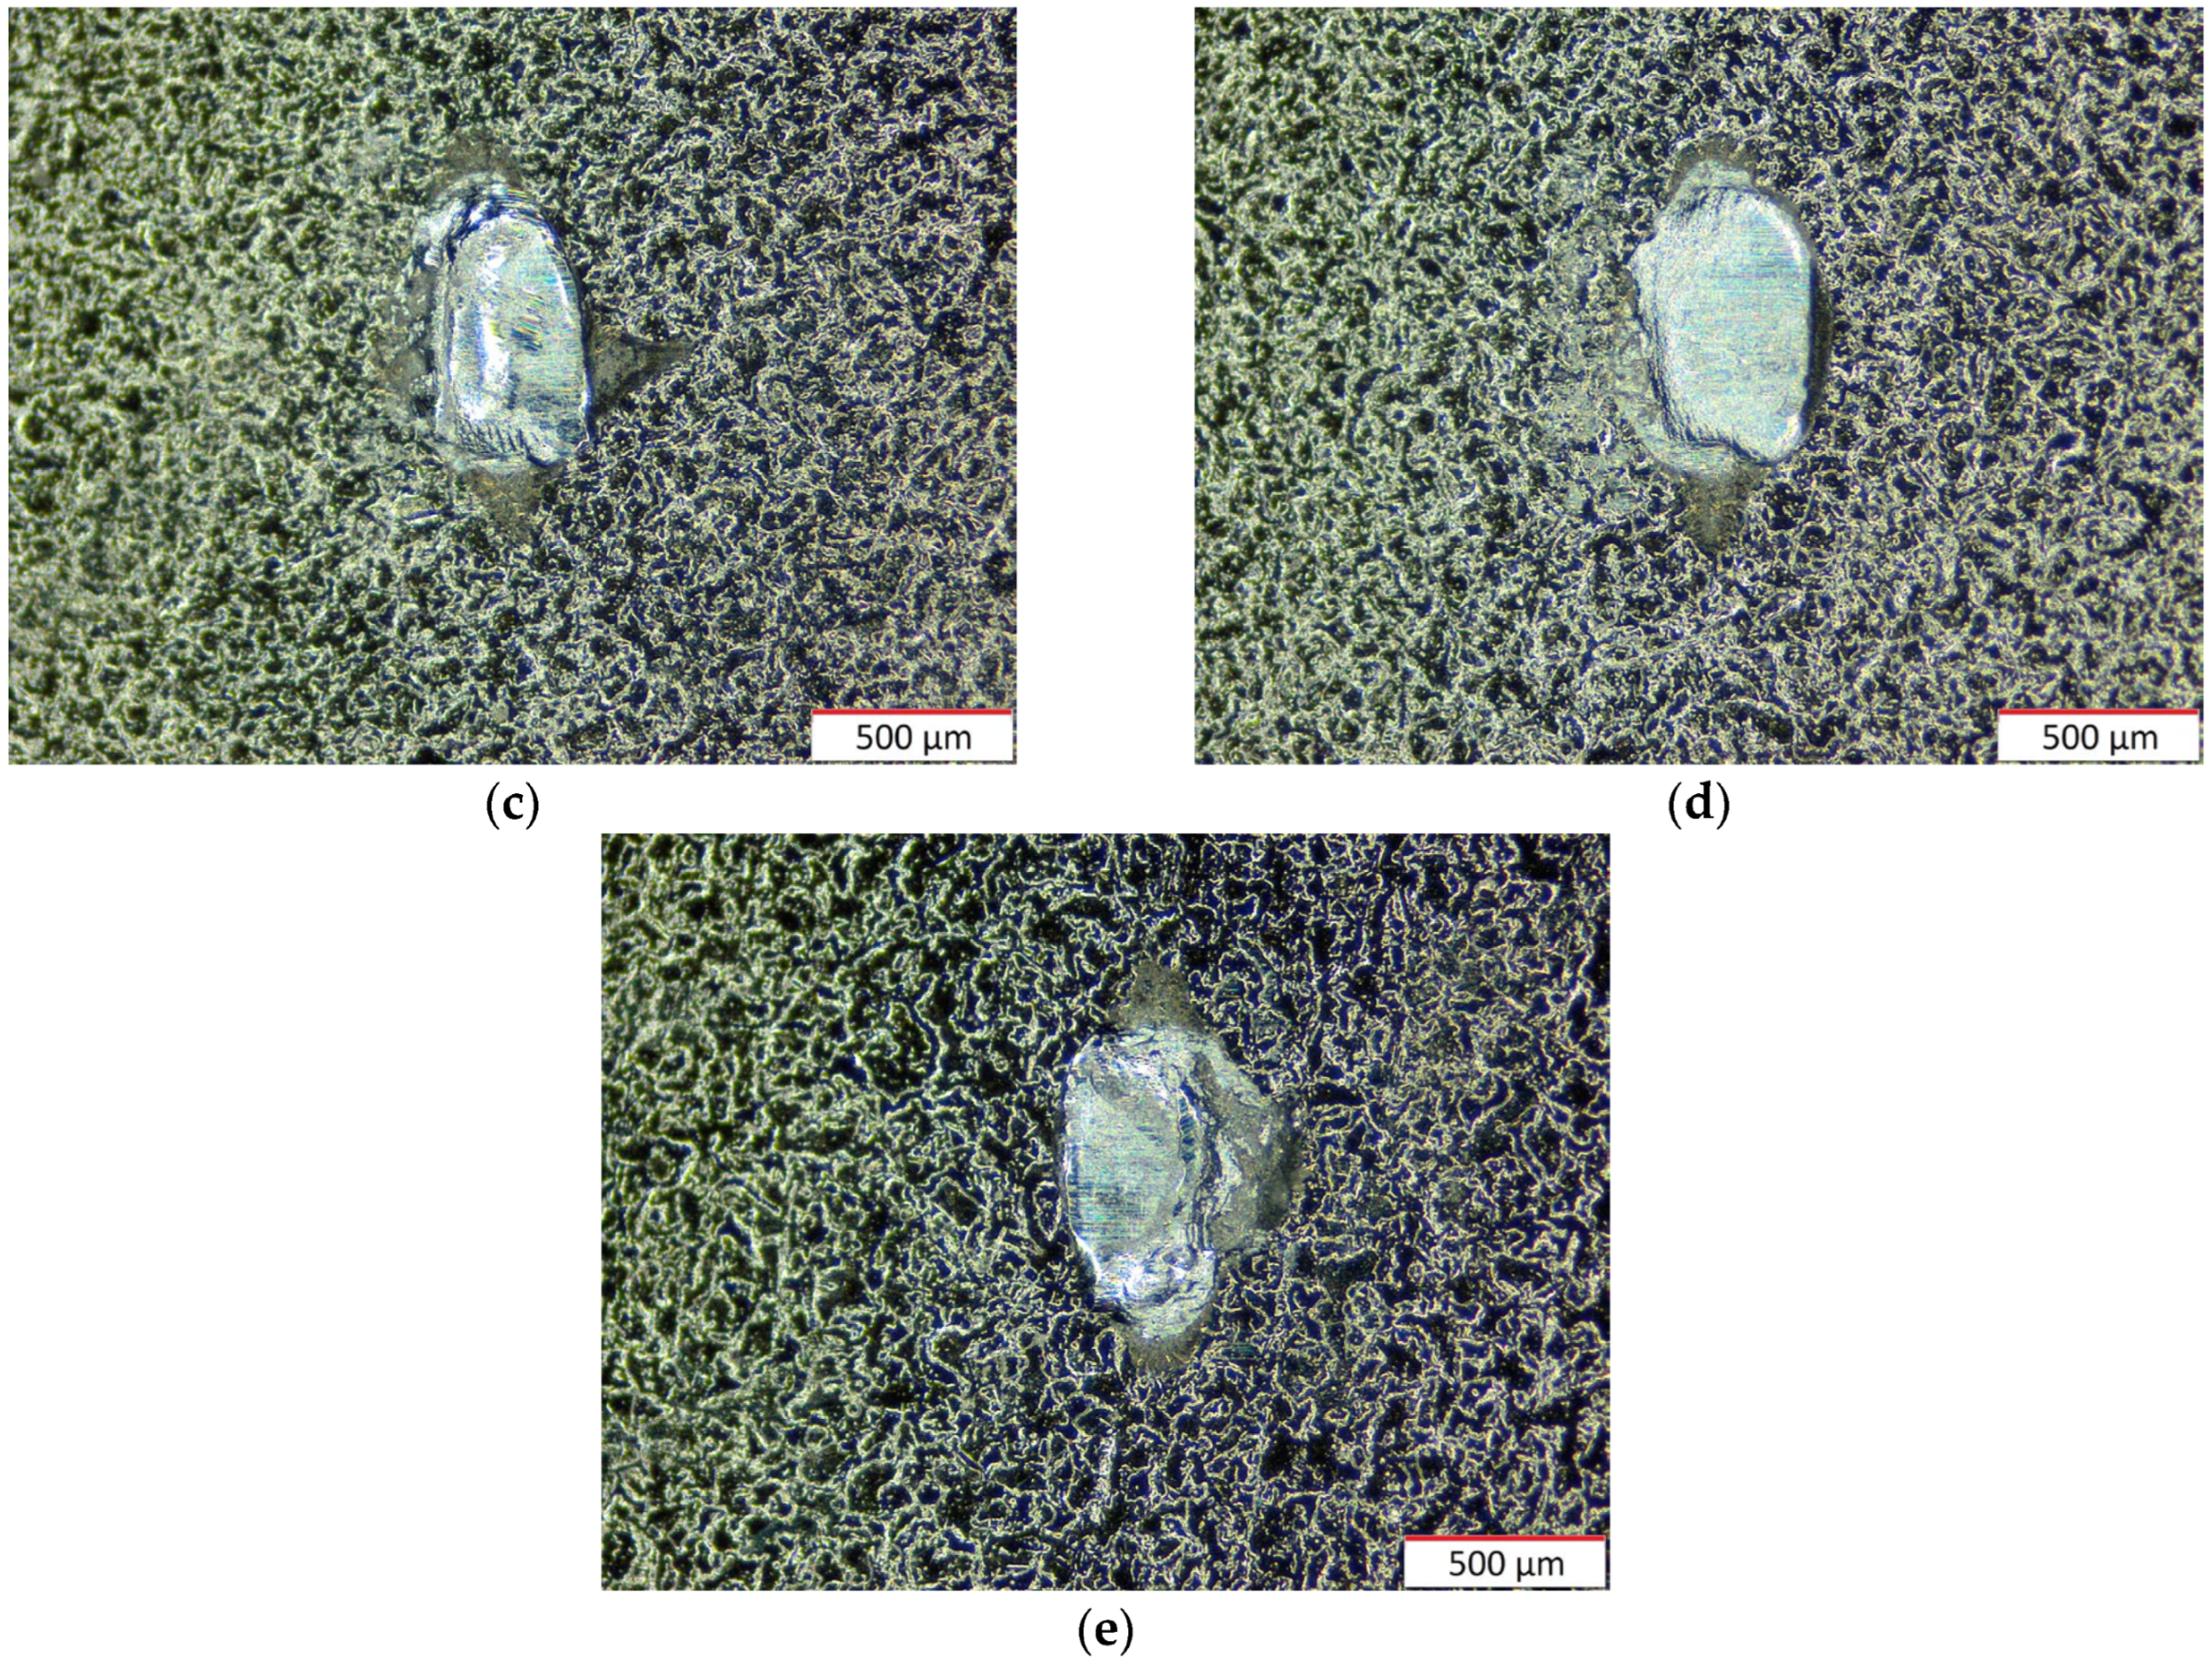
Figure 21.
Bond nugget after shear testing for samples with 40% laser cleaning with 45× magnification for samples 1–5 (a–e).
Figure 21.
Bond nugget after shear testing for samples with 40% laser cleaning with 45× magnification for samples 1–5 (a–e).
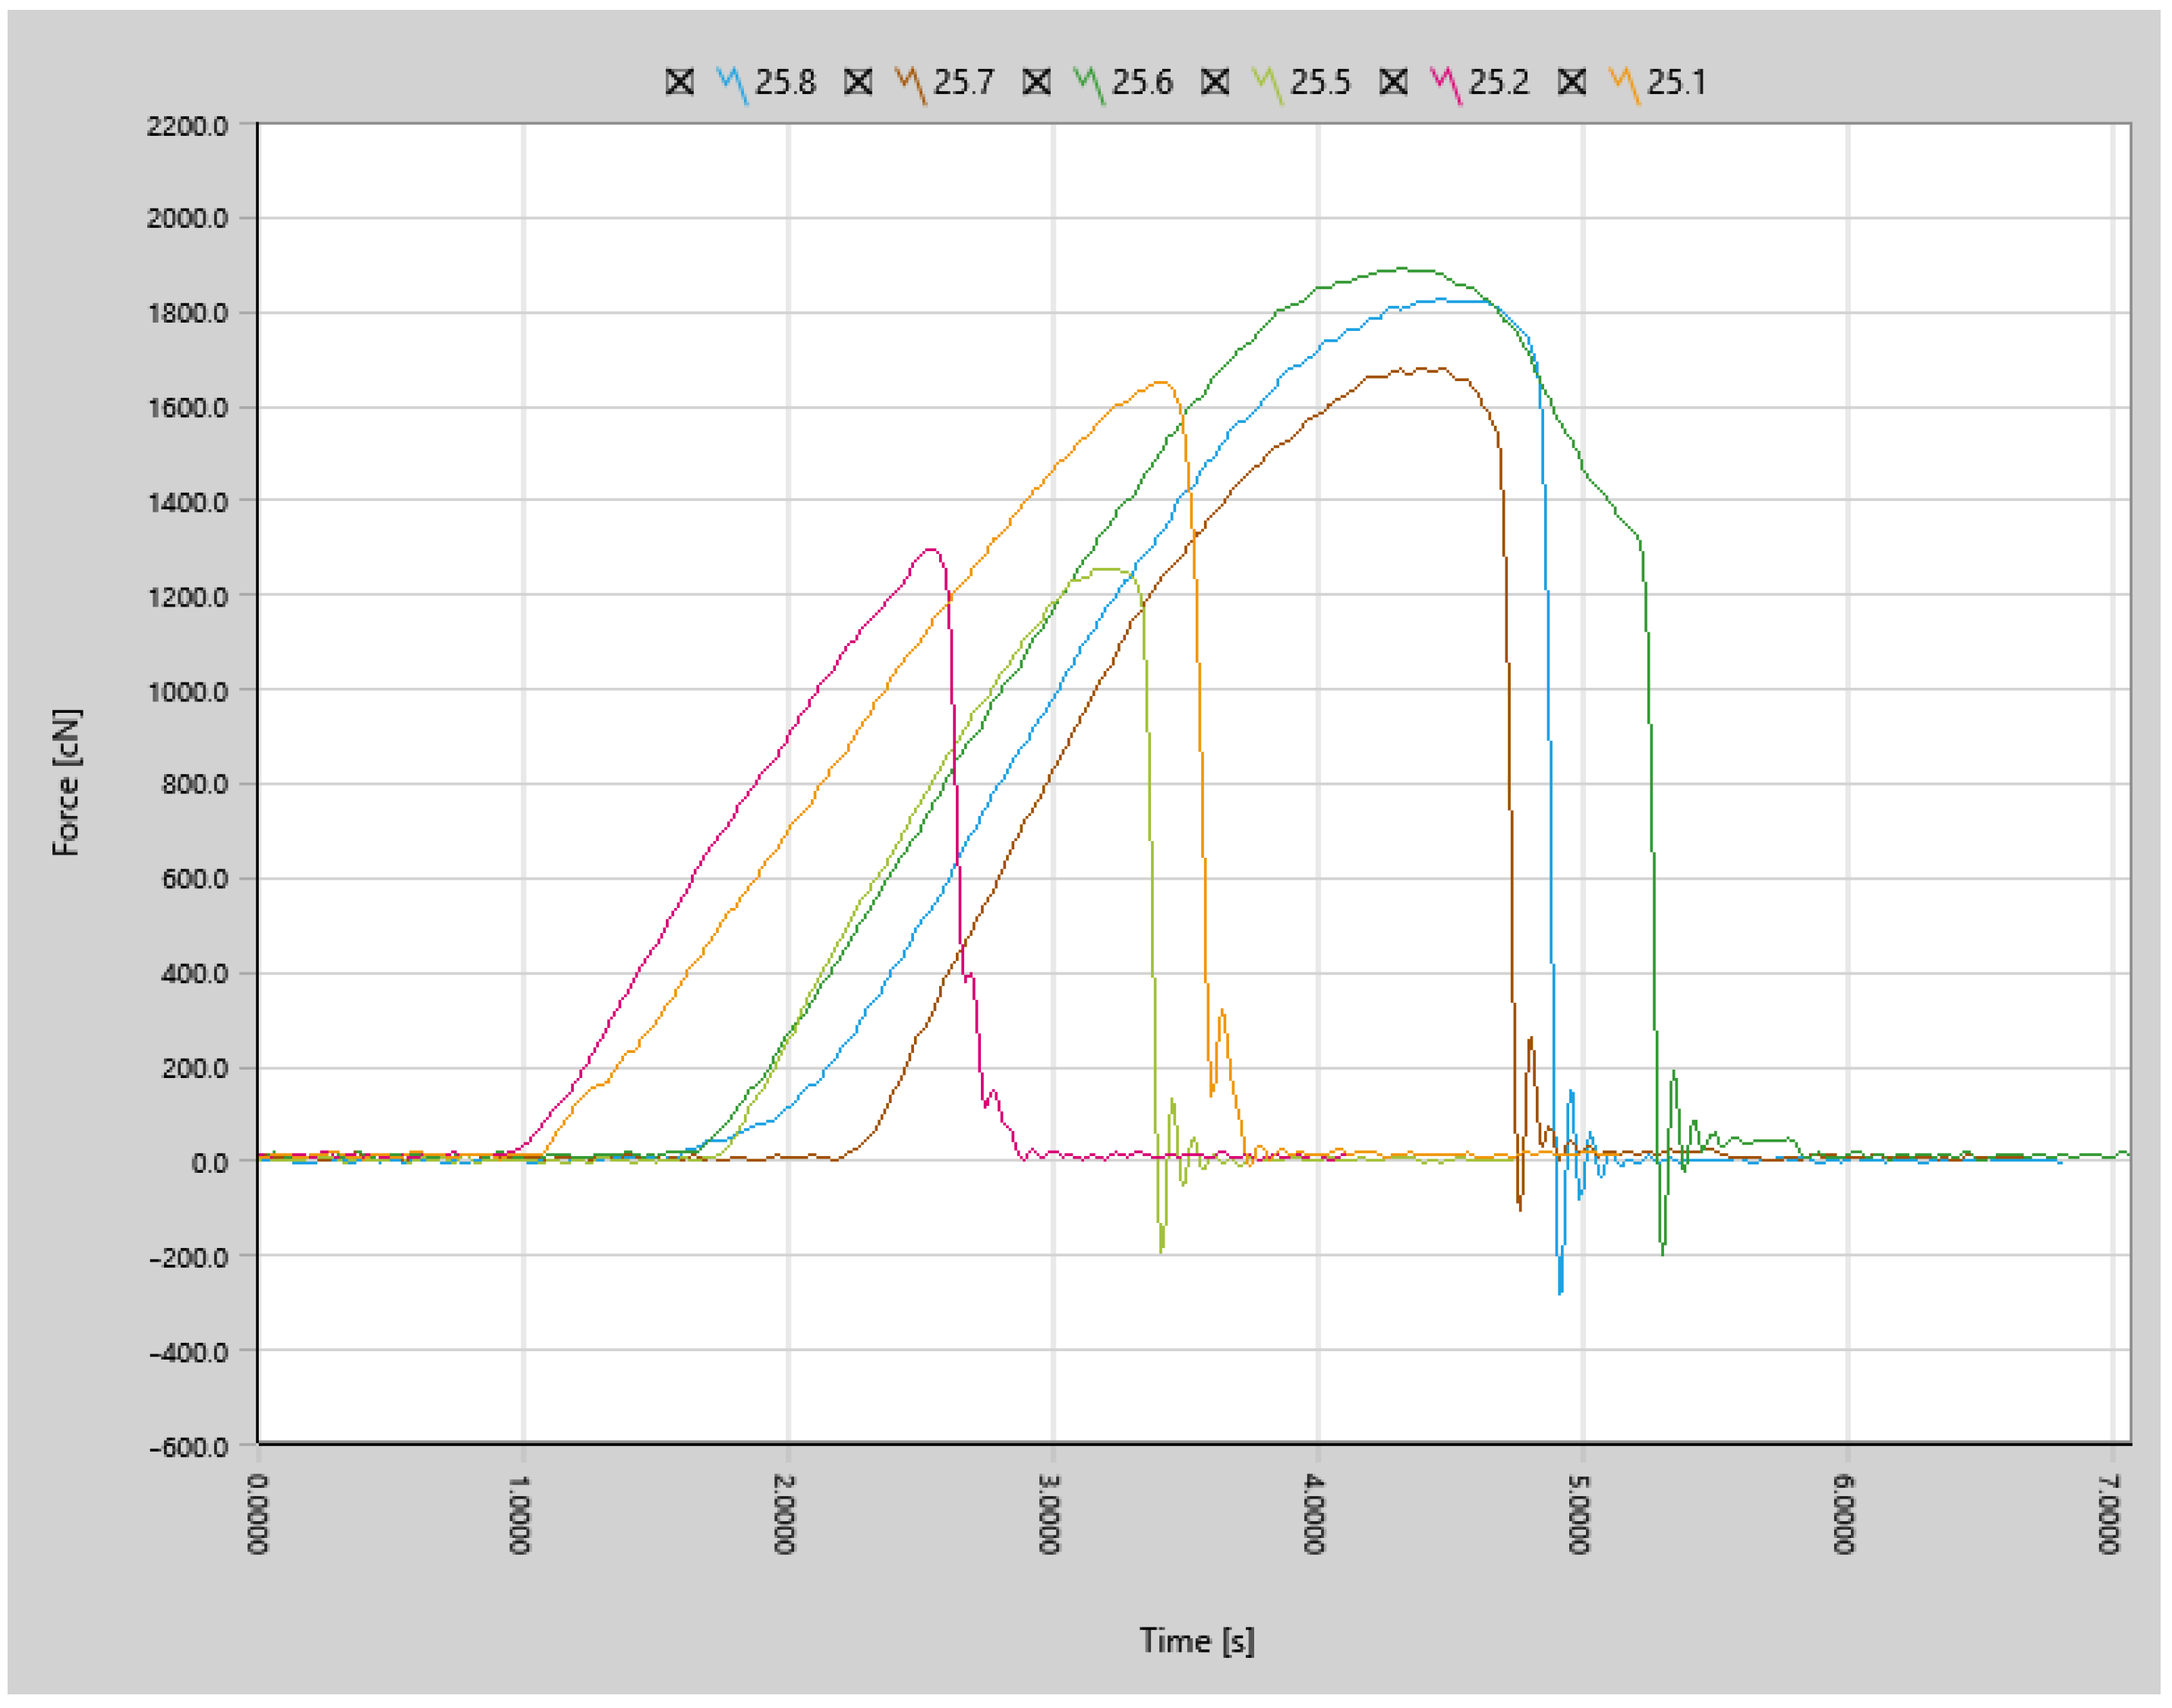
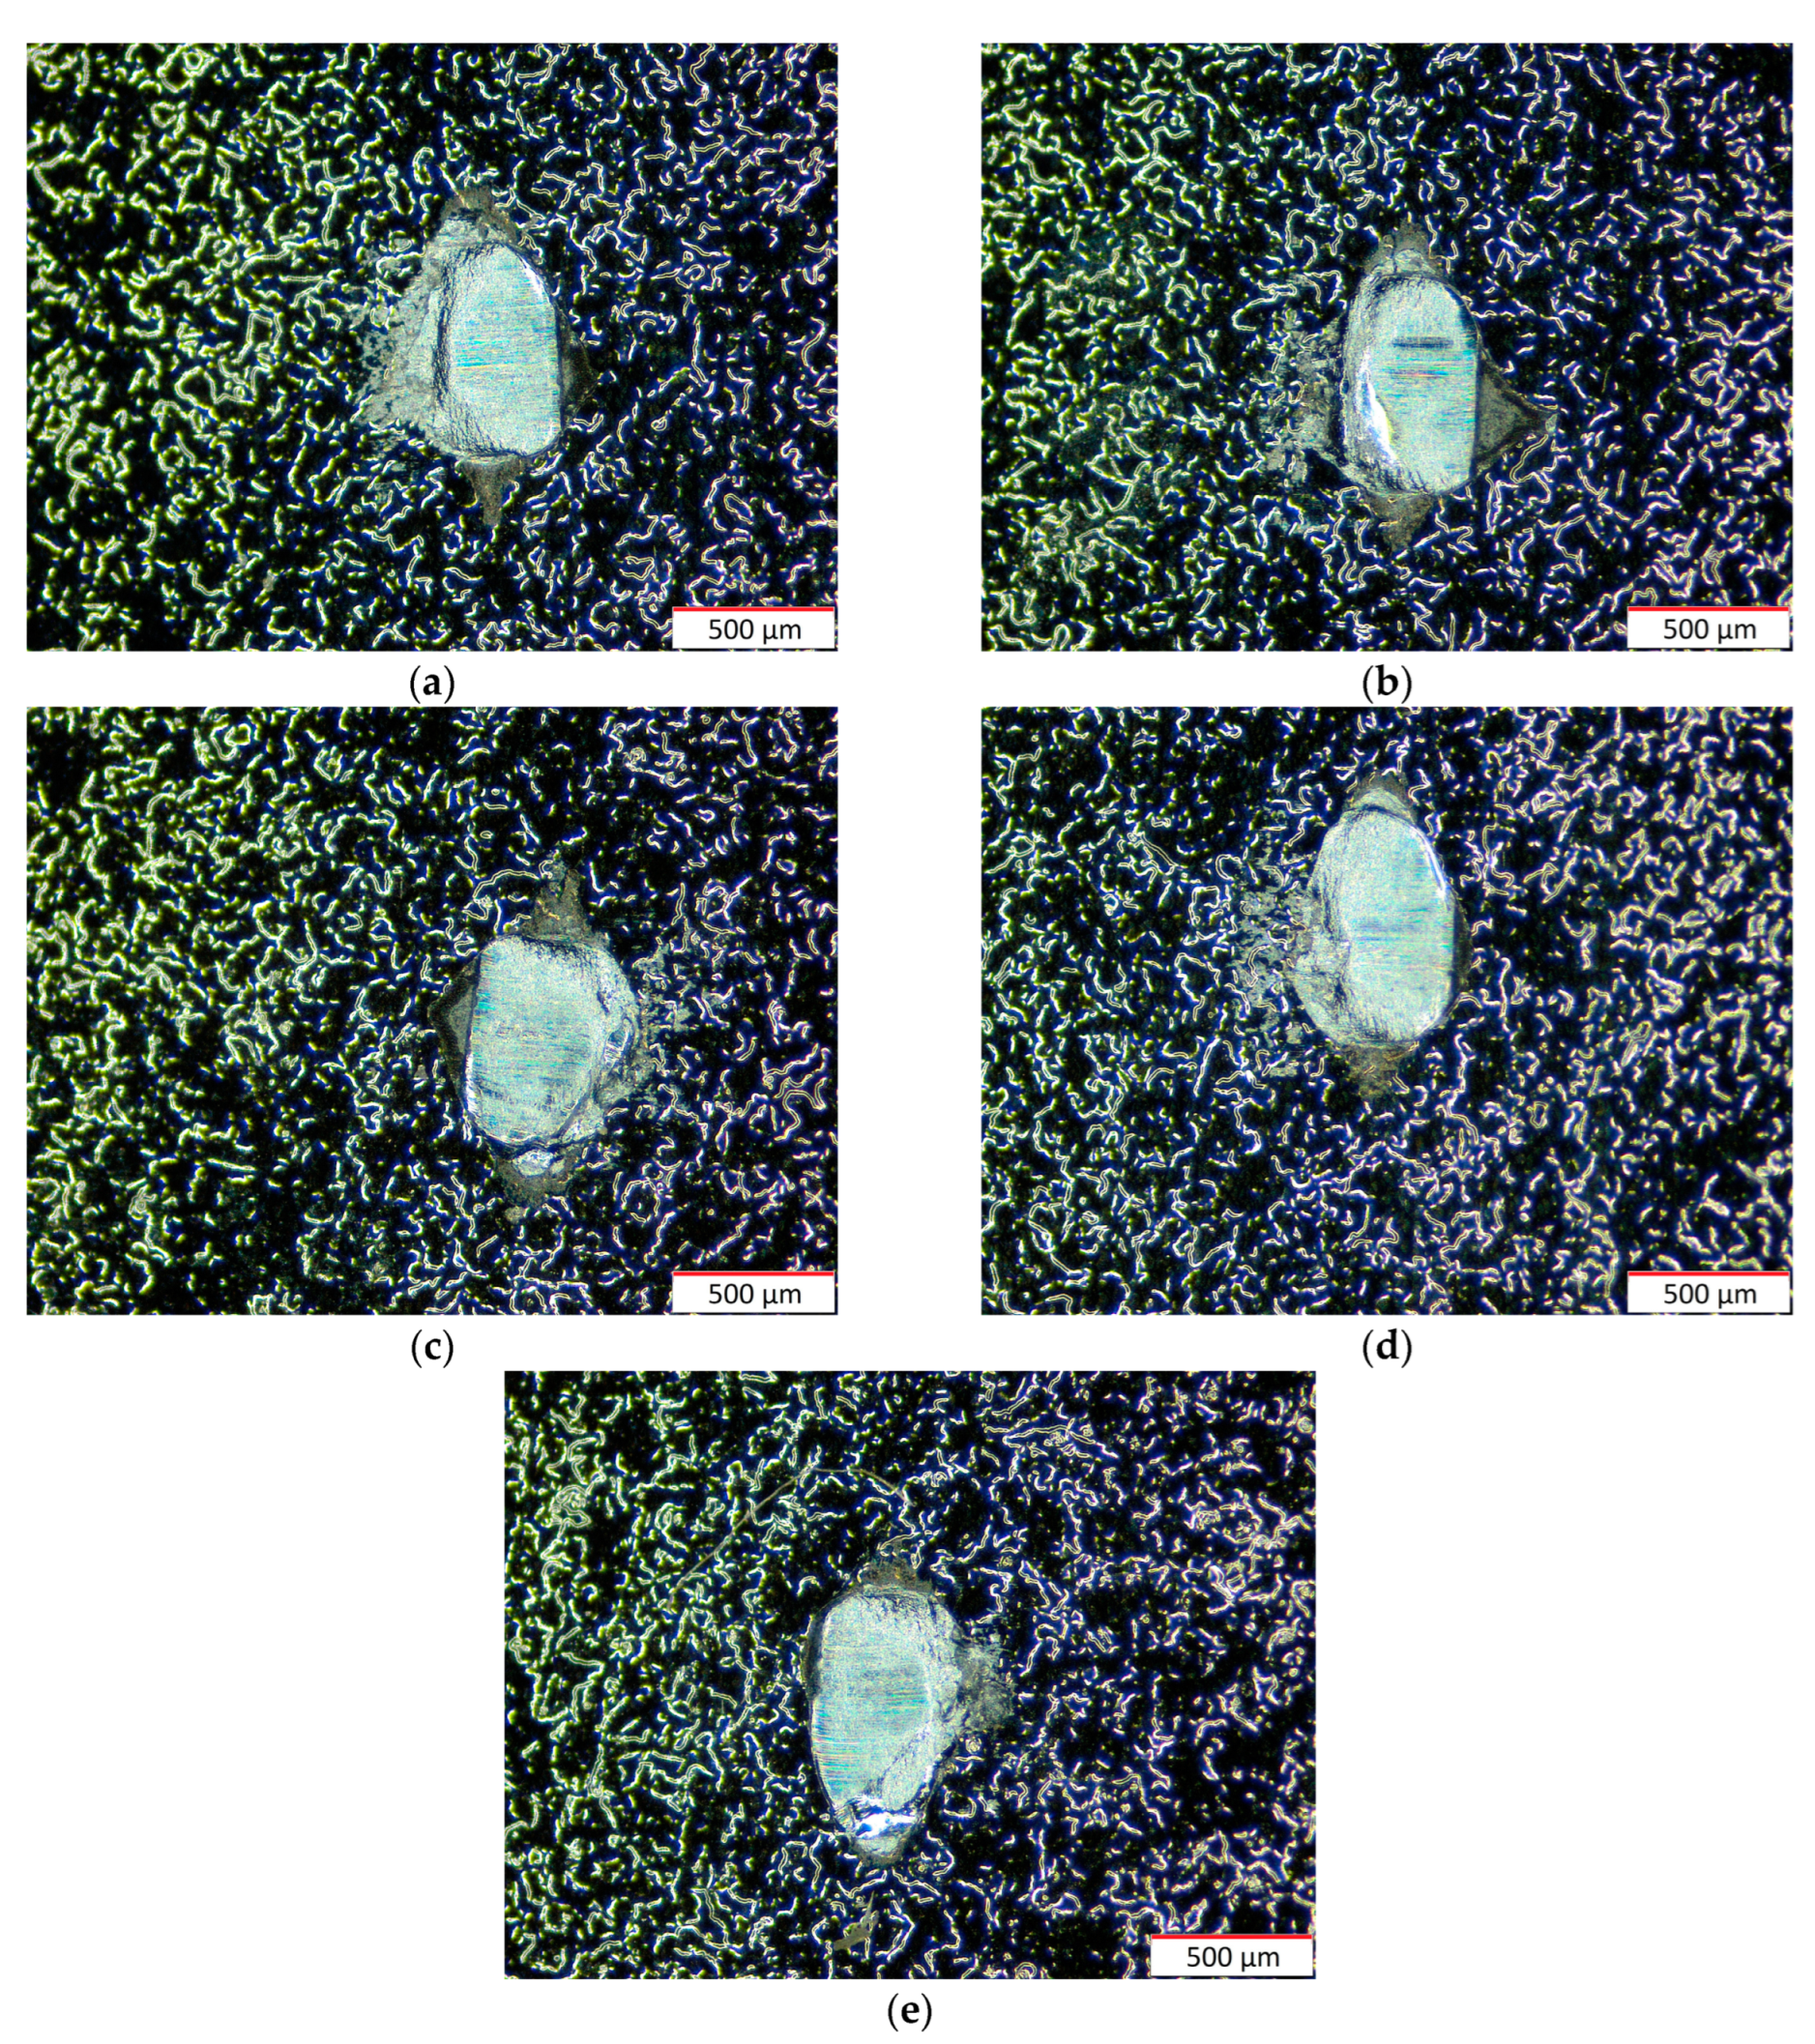
Figure 22.
Shear test force plots for 5 samples cleaned with 80% of the laser power.
Figure 22.
Shear test force plots for 5 samples cleaned with 80% of the laser power.
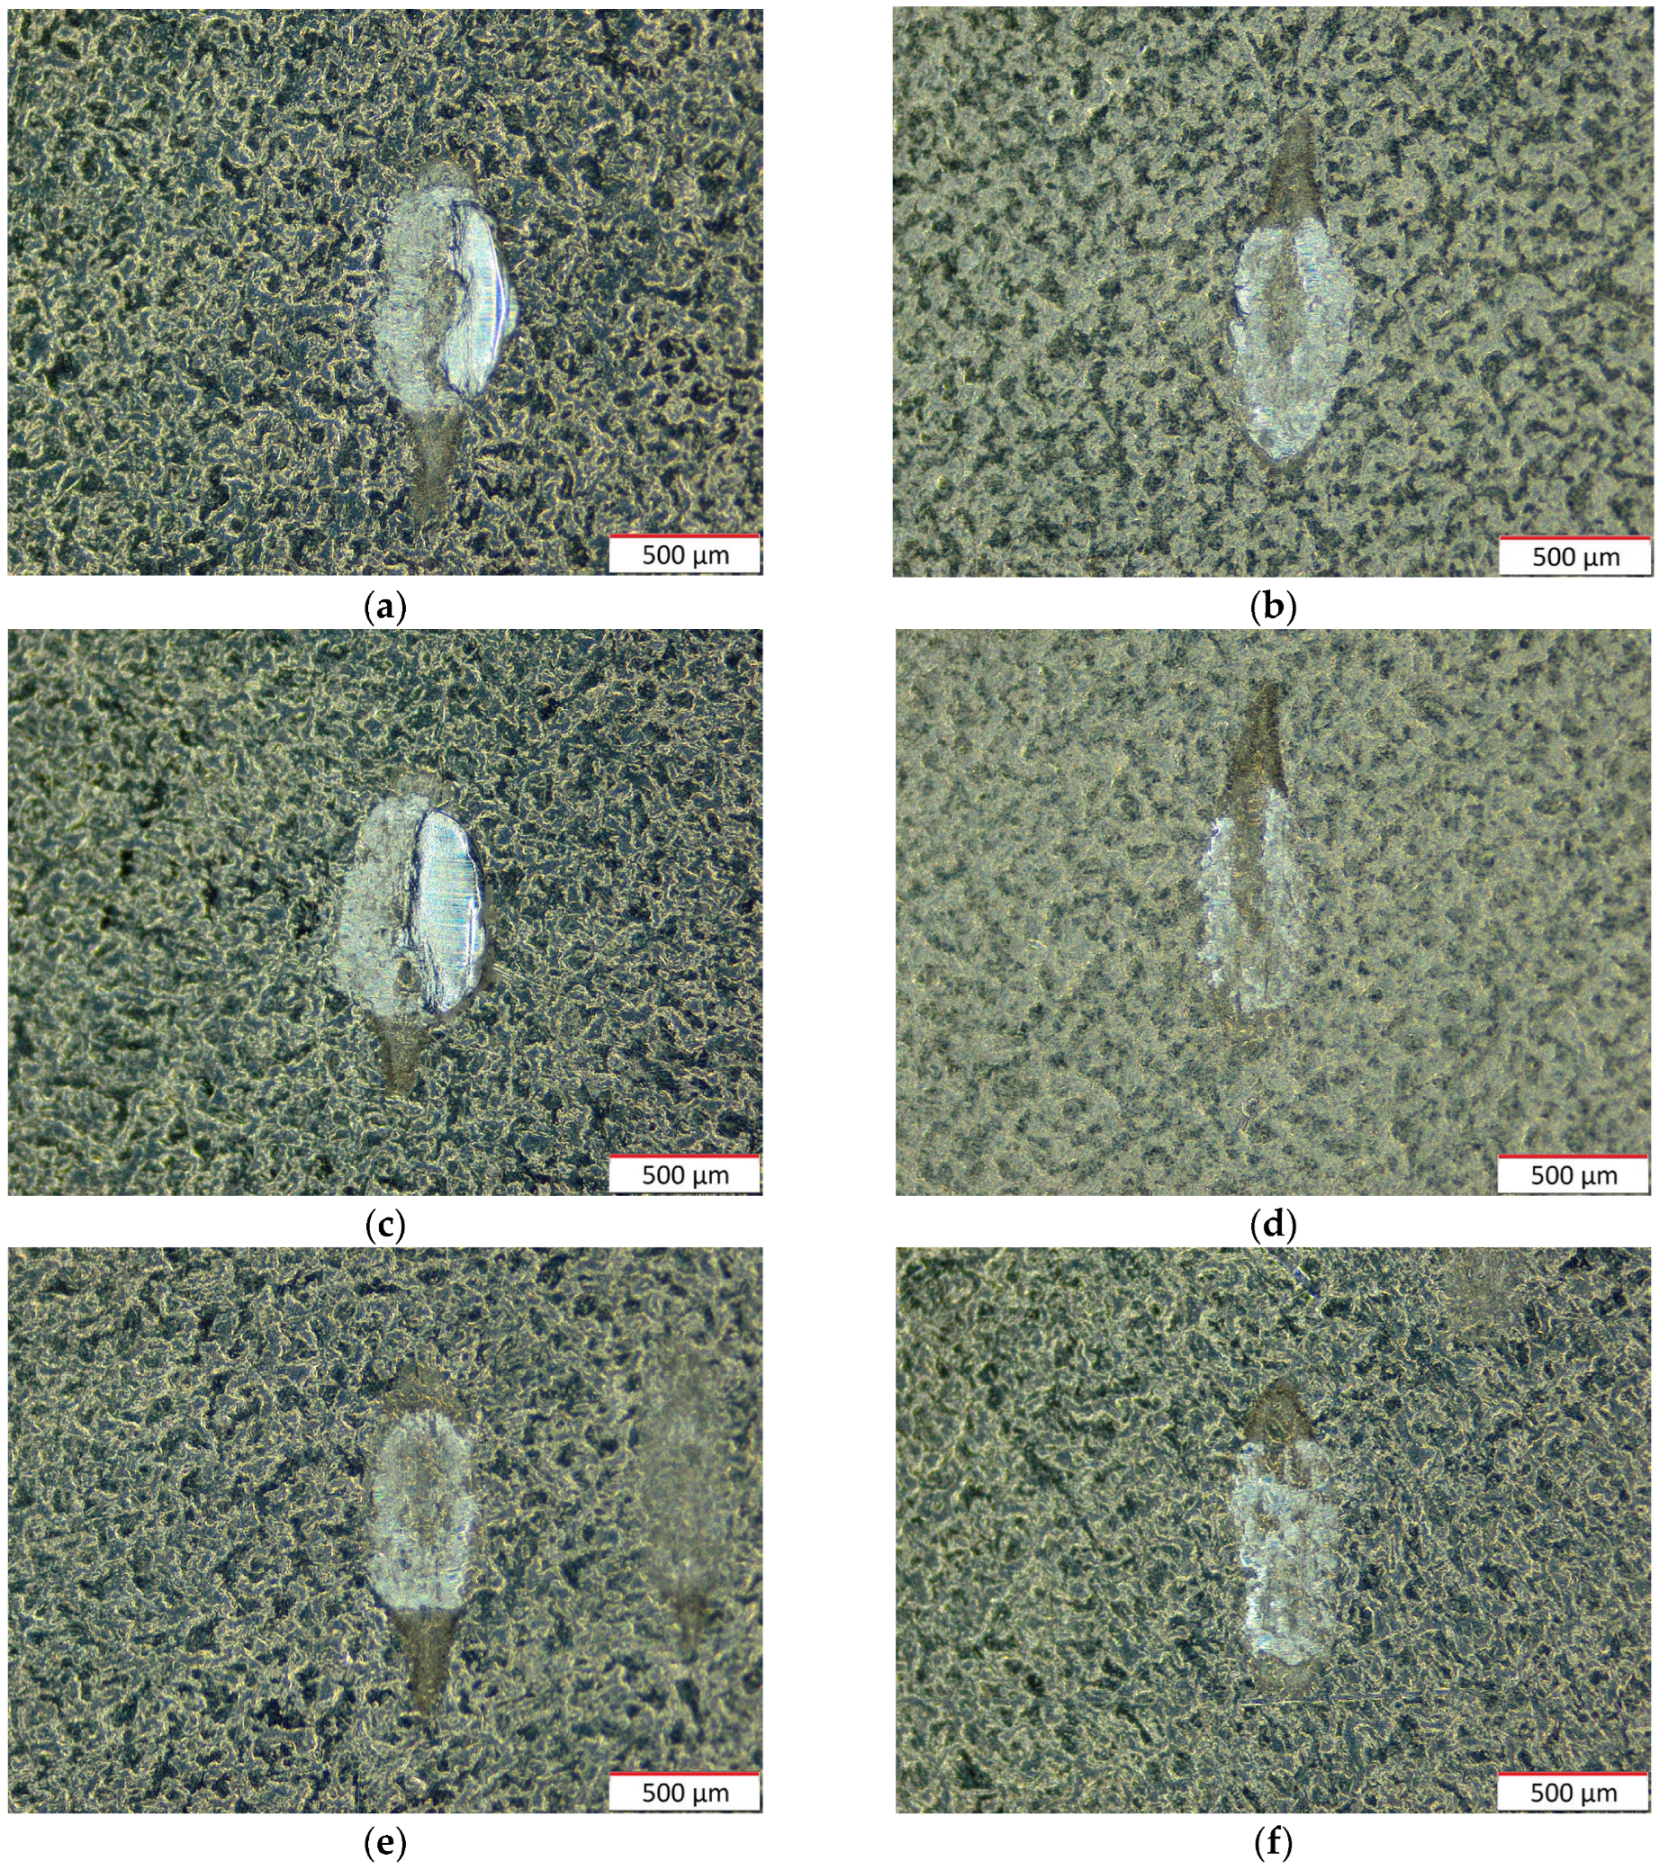
Figure 23.
Bond nugget after shear testing for samples with 80% laser cleaning with 45× magnification for samples 1–5 (a–e).
Figure 23.
Bond nugget after shear testing for samples with 80% laser cleaning with 45× magnification for samples 1–5 (a–e).
Table 1.
Chemical composition (wt.%) of AluBond Pure H11 bonding wire (Heraeus specification).
Table 1.
Chemical composition (wt.%) of AluBond Pure H11 bonding wire (Heraeus specification).
| | Al | Cu | Si | Fe |
|---|
| Tested | 99.99919 | 0.00040 | 0.00030 | 0.00011 |
| Spec limit | ≥99.99700 | ≤0.00180 | ≤0.00050 | ≤0.00200 |
Table 2.
Mechanical properties of AluBond Pure H11 bonding wire (Heraeus specification).
Table 2.
Mechanical properties of AluBond Pure H11 bonding wire (Heraeus specification).
| | Breaking Load [cN] | Elongation Limit [%] |
|---|
| Tested | 576.1 | 17.7 |
| Spec limit | 500.0–670.0 | >5.0 |
Table 3.
Fiber ATMS 4060 laser specifications.
Table 3.
Fiber ATMS 4060 laser specifications.
| Parameter | Value |
|---|
| Laser source type | Fiber |
| Laser power | 30 W |
| Laser wavelength | 1060 nm |
| Laser source max frequency | 100 kHz |
| Lens size | 300 × 300 mm |
Table 4.
Laser cleaning parameters were used in this study.
Table 4.
Laser cleaning parameters were used in this study.
| Parameter | Value | Description |
|---|
| Speed | 2000 mm/s | Speed of the laser beam |
| Power | 0/20/40/80% | Power of the laser (pulse modulation) |
| Start TC | −100 µs | Time between mirror movement and laser on |
| Laser off TC | 300 µs | Time between mirror stop and laser stop at program end |
| End TC | 300 µs | Time between mirror stop and laser stop at polygon end |
| Polygon TC | 100 µs | Time wait in vector connection point of polygon |
| Line space | 0.01 mm | Distance between consecutive laser lines |
| Frequency | 20 kHz | Laser source switching frequency |
Table 5.
Shear test parameters.
Table 5.
Shear test parameters.
| Parameter | Value | Description |
|---|
| Test distance | 800 µm | Shear tool travel during testing |
| Test speed | 100 µm/s | Speed of the sheer tool |
| Touchdown force | 20 cN | Force required for substrate surface detection |
| Shear height | 40 µm | Height from substrate level at which shear test takes place |
Table 6.
Shear test results for 6 samples without laser cleaning.
Table 6.
Shear test results for 6 samples without laser cleaning.
| Sample Number | 1 | 2 | 3 | 4 | 5 | 6 |
|---|
| Force [cN] | 1818.9 | 1672.6 | 1884.5 | 1247.8 | 1286.4 | 1642.3 |
| Median [cN] | 1657.5 |
| Standard deviation [cN] | 267.6 |
| Standard deviation [%] | 16.1 |
Table 7.
Shear test results for 5 samples cleaned with 40% of the laser power.
Table 7.
Shear test results for 5 samples cleaned with 40% of the laser power.
| Sample Number | 1 | 2 | 3 | 4 | 5 |
|---|
| Force [cN] | 1858.6 | 1796.7 | 1814.7 | 1902.1 | 1786.9 |
| Median [cN] | 1814.7 |
| Standard deviation [cN] | 48.0 |
| Standard deviation [%] | 2.6 |
Table 8.
Shear test results for 5 samples cleaned with 80% of the laser power.
Table 8.
Shear test results for 5 samples cleaned with 80% of the laser power.
| Sample Number | 1 | 2 | 3 | 4 | 5 |
|---|
| Force [cN] | 1886.6 | 1822.6 | 1901.1 | 1805.6 | 1803.8 |
| Median [cN] | 1822.6 |
| Standard deviation [cN] | 46.4 |
| Standard deviation [%] | 2.5 |


