Article

Optimization of Milling Process Parameters for Fe45 Laser-Clad Molded Parts Based on the Nondominated Sorting Genetic Algorithm II

School of Mechanical Engineering, Shaanxi University of Technology, Hanzhong 723000, China
*
Author to whom correspondence should be addressed.
Coatings 2024, 14(4), 449; https://doi.org/10.3390/coatings14040449
Submission received: 3 March 2024 / Revised: 28 March 2024 / Accepted: 3 April 2024 / Published: 9 April 2024

Abstract

:
The milling process parameters of laser-clad molded parts have an essential influence on improving the surface quality of the coating. Generally speaking, optimizing a single property often leads to a reduction in another property. In this paper, we systematically investigated a milling process parameter optimization method for Fe45 laser-clad molded parts, and designed L9 (33) sets of orthogonal experiments by taking the spindle speed, feed rate, and cutting depth as input variables, and taking the milling force and material removal rate as optimization indices. The significance ranking of the milling process was analyzed by using the extreme difference method. Then, the multi-objective optimization of the milling process was realized by using the NSGA-II algorithm with the empirical index model as the objective function. The optimum milling parameters obtained were N = 2000 r/min, V = 120.0266 mm/min, and P = 0.45 mm. Finally, the reliability of the optimization results of the algorithm was proved by comparing and verifying the optimal results obtained from the algorithm with the optimal process obtained from the extreme difference analysis. The results provide a theoretical basis for the selection of milling parameters and parameter optimization of laser fusion-coated Fe45 alloys.

1. Introduction

As a medium-carbon high-quality structural steel, 40Cr steel is widely used in the manufacture of high-strength components such as air compressors, steam engine impellers, connecting rods, etc., owing to its good plasticity, weldability, and wear resistance [1,2,3]. However, long-term work in a harsh working environments leads to serious wear on the surface of the parts. Laser cladding technology, as an important part of the surface-strengthening process, offers the advantages of a fast repair speed, saving energy, and environmental protection, as well as high economic benefits, which can provide a good solution for solving the problem of part wear and prolong the service life of parts [4,5,6]. At present, the main cladding powders used are iron-based [7], nickel-based [8], and high-entropy alloys [9], among which iron-based powders can not only realize low costs but also obtain good metallurgical bonding [10,11]. Wang et al. [12] and Wei et al. [13] have successfully prepared iron-based alloy coatings, and found that their performance was significantly improved. However, Shu et al. [14] found that the surface finish of the coatings after laser cladding is reduced due to factors such as channel overlap and the degree of powder melting, and precision machining is usually required to meet the requirements of service conditions. Dry machining, especially in milling, as an effective means of precision machining, can significantly improve the surface roughness and geometrical accuracy of parts to achieve their use function and assembly requirements [15,16].
In recent years, many scholars have conducted research to improve the surface accuracy of forming coatings through laser cladding using the machining technology of milling. Liu et al. [17] conducted single-zone milling experiments on Ni60 cladding coatings, which showed that the average value and fluctuation of milling force in the intermediate zone were minimized, and the machined surface quality was the best. Wang et al. [18] reported the effect of the milling process parameters on the laser coating of a Ti-6Al-4V titanium alloy. Their results showed that the milling force and surface roughness increased and then decreased with an increase in the cutting speed; the milling force and surface roughness increased with increases in the feed per tooth, axial depth of the cut, and width of the cut. Zhao et al. [19] developed a new type of laser cladding powder to address the problems of machining vibration in the milling process. It was found that the addition of La2O3 powder significantly reduced the machining vibration and avoided the occurrence of chattering. Cang et al. [20] investigated the residual stress mechanism and distribution of the milling process, and found that there are compressive residual stresses on the subsurface of the workpiece, and their experimental results were consistent with the simulation results. Although research on milling has made some progress in the machining of cladding molded parts, the milling process still suffers from high cutting forces, high cutting temperatures, easily worn tools, low material removal rates, and the poor quality of milled surfaces [21,22,23]. The reason for most of these problems is that the milling process parameters are not properly controlled, and process optimization can provide the right parameters for experimentation. At present, the optimization of processes has been gradually developed and matured. The main methods include the orthogonal method [24], the Taguchi method [25], the response surface method (RSM) [26], and intelligent algorithms such as the BP neural network (BPNN) [27] and the nondominated sorting genetic algorithm II (the NSGA-II algorithm) [28]. Compared with other methods, the NSGA-II algorithm has the advantages of fast speed, high search accuracy, and the ability to optimize multiple objectives at the same time. Peng et al. [29] and Zhang et al. [30] have also successfully applied the NSGA-II algorithm to optimize the prediction of the quality of laser-clad coatings. However, the optimization effect of the NSGA-II algorithm on the milling parameters of the post-treatment milling process of the fusion coating is still unclear.
In this study, the optimization effect of the NSGA-II algorithm is explored to obtain the optimum parameters for the milling of Fe45 laser cladding alloy coatings prepared on a 40Cr steel surface. An experiment involving the milling processing of laser-clad molded parts with three factors and three levels was designed based on the orthogonal method. The spindle speed, feed rate, and cutting depth were used as the input variables, and the cutting force and material removal rate were used as the optimization indices. The significance ordering of the milling process was analyzed by using the extreme deviation method. A regression model between the milling process and optimization indices was established by using the empirical exponential model. Finally, the regression model was imported into the NSGA-II algorithm for optimization, and the optimization results of the algorithm were examined using the comparative validation method. The results of this study aim to provide a basis for parameter selection in subsequent milling processes.

2. Experiment

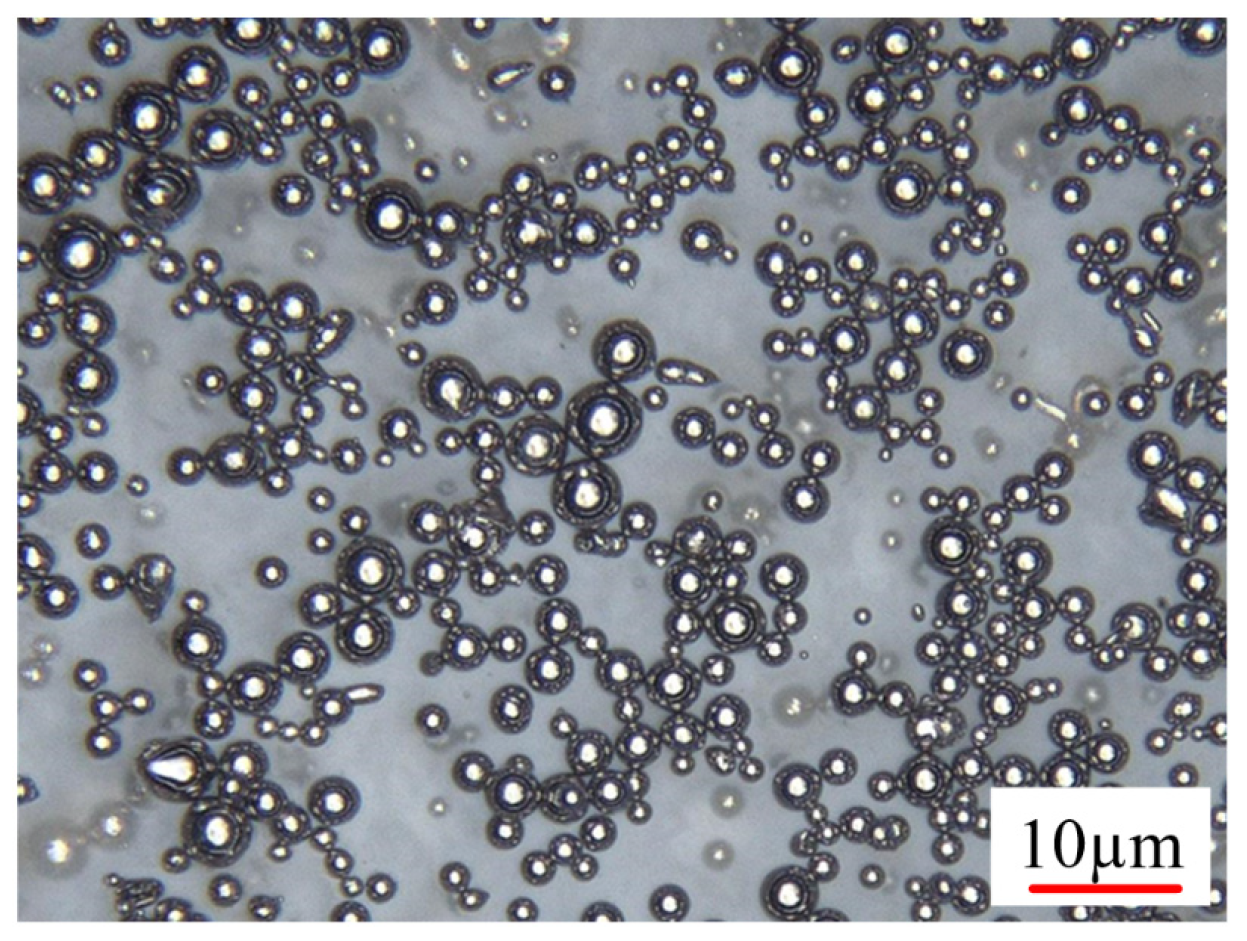
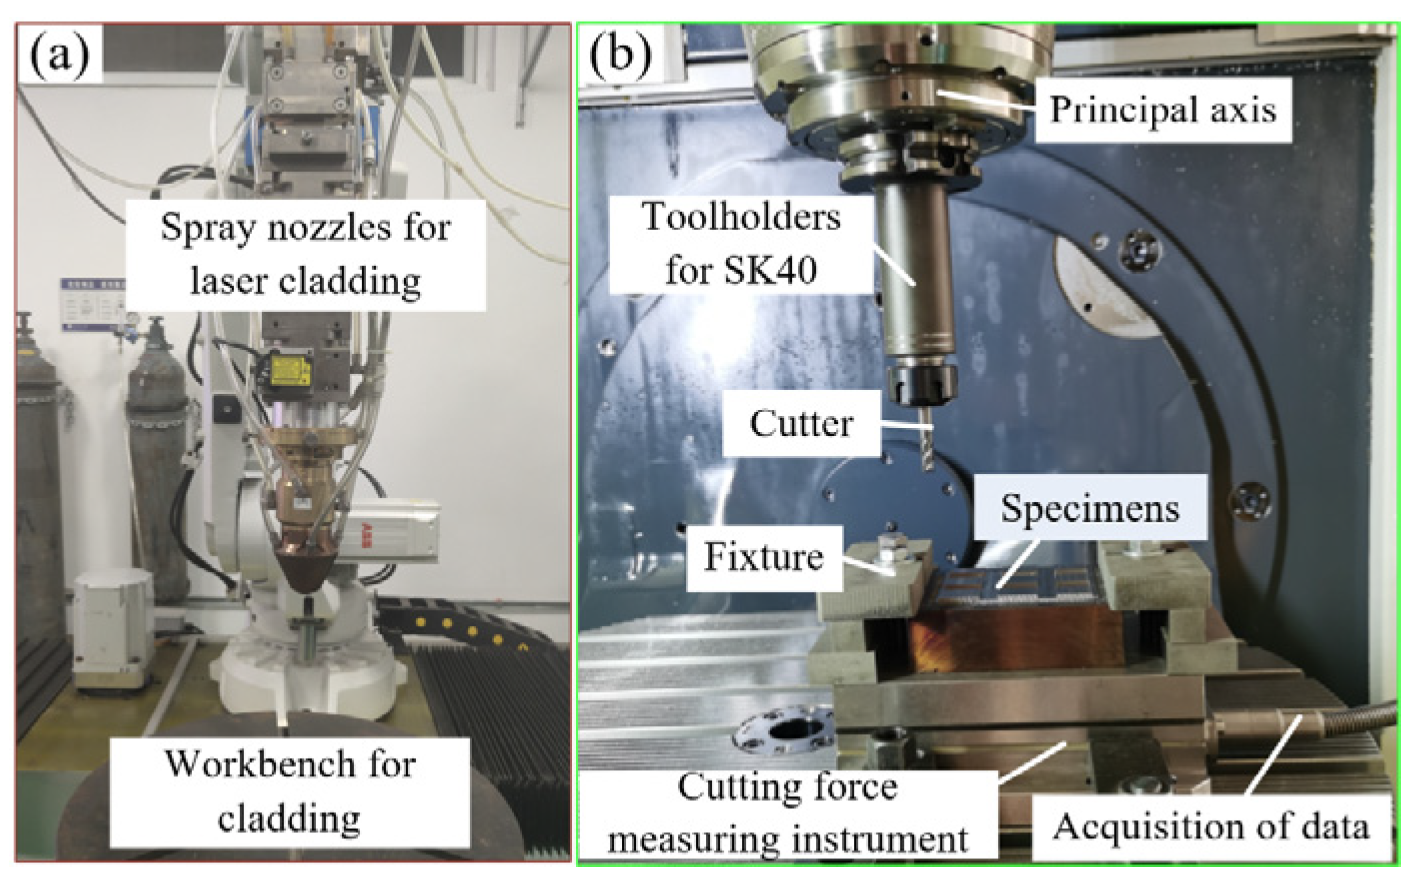
2.1. Materials and Equipment

The experiments were conducted on a 40Cr steel plate with a size of 100 mm × 80 mm × 30 mm. Before cladding, the surface of the substrate was pre-treated with a grinder to remove impurities and oxides on the surface. The substrate material was provided by Shanghai Lingjing Metal Co. (Shanghai, China). Fe45 powder was chosen as the cladding powder, which has excellent wear resistance and toughness. The Fe45 powder was offered by China Shaanxi Guizidan New Material Co. (Hanzhong, China). The powder should be dried in a vacuum drying oven before coating to ensure its fluidity. The morphology of the powders is shown in Figure 1, which shows that the powders are distributed in a spherical shape with particle sizes ranging from 3 to 29 μm. The chemical compositions of 40Cr and Fe45 are shown in Table 1.
The laser cladding system for the test and the milling machining center used for the post-cladding treatment are shown in Figure 2. The laser cladding system used in this test (Figure 2a) was manufactured in China and consisted of an RFL-3000D laser, an ABB control system, a dual-compartment powder-feeding system, a water-cooling system, and synchronized powder feeding with argon as the protective gas. The process parameters selected based on the group’s previous experimental research were a laser power of 1800 W, scanning speed of 18 mm/s, powder feeding speed of 1.8 g/min, and defocusing amount of 0 mm [31]. Since the cladding molded parts required for milling were coated in multiple passes, 45% was chosen as the overlap rate on a single-pass basis, and the paths were reciprocating scans. The milling experimental platform for the experiment was a Demagi 5-axis machining center DMU50, which has a maximum spindle speed of 14,000 r/min and a spindle drive power of 23 KW. The cutting tool used was a straight-shank solid carbide 4-flute end mill with a diameter of 6 mm from Walther MC377-06.0A4BC-WK40EA. The feed per tooth was set to 0.075 mm/tooth, the axial depth of the selected cutting tooth was 5 mm, and the milling length was 15 mm, all of which were preset as input dry milling parameters. The dry cutting method of smooth milling was used to avoid the effect of cutting heat on the experimental results. During the milling experiments, the specimens were fixed on a special fixture, while the cutting force was measured using a 9257B force gauge (Kistler, Switzerland), as shown in Figure 2b.

2.2. Experimental Program

The milling of laser-clad molded parts is subject to interactions between machining parameters that often make the milling results difficult to determine. Therefore, the selection of key process factors for parameter optimization is an indispensable part of obtaining high-precision milled parts. Due to the rough surface of the laser cladding specimen, the cladding was first processed with rough milling before the test, so that the surface was smooth and flat. In this study, the spindle speed (N), feed rate (V), and cutting depth (P) were selected as the main factors affecting the machining results to ensure the reliability of the process optimization results. The range of these three factors was determined based on a previous study [14], and nine groups of experiments with three factors and three levels were designed using the orthogonal test method, as shown in Table 2, which presents a table of the experimental factor levels.
The milling force and material removal rate are often chosen as important indicators in milling processes to ensure the accuracy of the machining quality as well as the machining efficiency. The milling force is an important indicator of machine tool performance. An excessive value of the milling force can easily cause machining errors, and can also lead to a decrease in tool life and even damage to the machine tool. If the milling force is too small, it is necessary to increase the spindle speed to ensure the same amount of cutting, which may affect the machining accuracy and increase the wear of the tool [32]. Selecting the appropriate milling force (Fc) is critical for improved machining quality and longer tool life. The milling force signals were collected using a force gauge (KISTLER 9272A) with the sampling frequency set to 20,000 Hz. The material removal rate was used to characterize the efficiency of the milling process as a function of parameters such as the spindle speed, number of milling cutter teeth, and depth of the cut. The material removal rate (Q) is the volume of metal removed through the milling process per unit time, which can also be approximated and defined by the advance distance of the milling cutter along the feed direction per unit time, as shown in Equation (1) for the calculation of the material removal rate. According to the characteristics of the milling force and material removal rate, the cutting force should be as small as possible and the material removal rate should be as large as possible during the actual machining process.
Q = v f × a p × a e 1000
where vf is the feed speed, mm/min; ap is the cutting depth, mm; and ae is the milling width, mm.

3. Analysis of Results

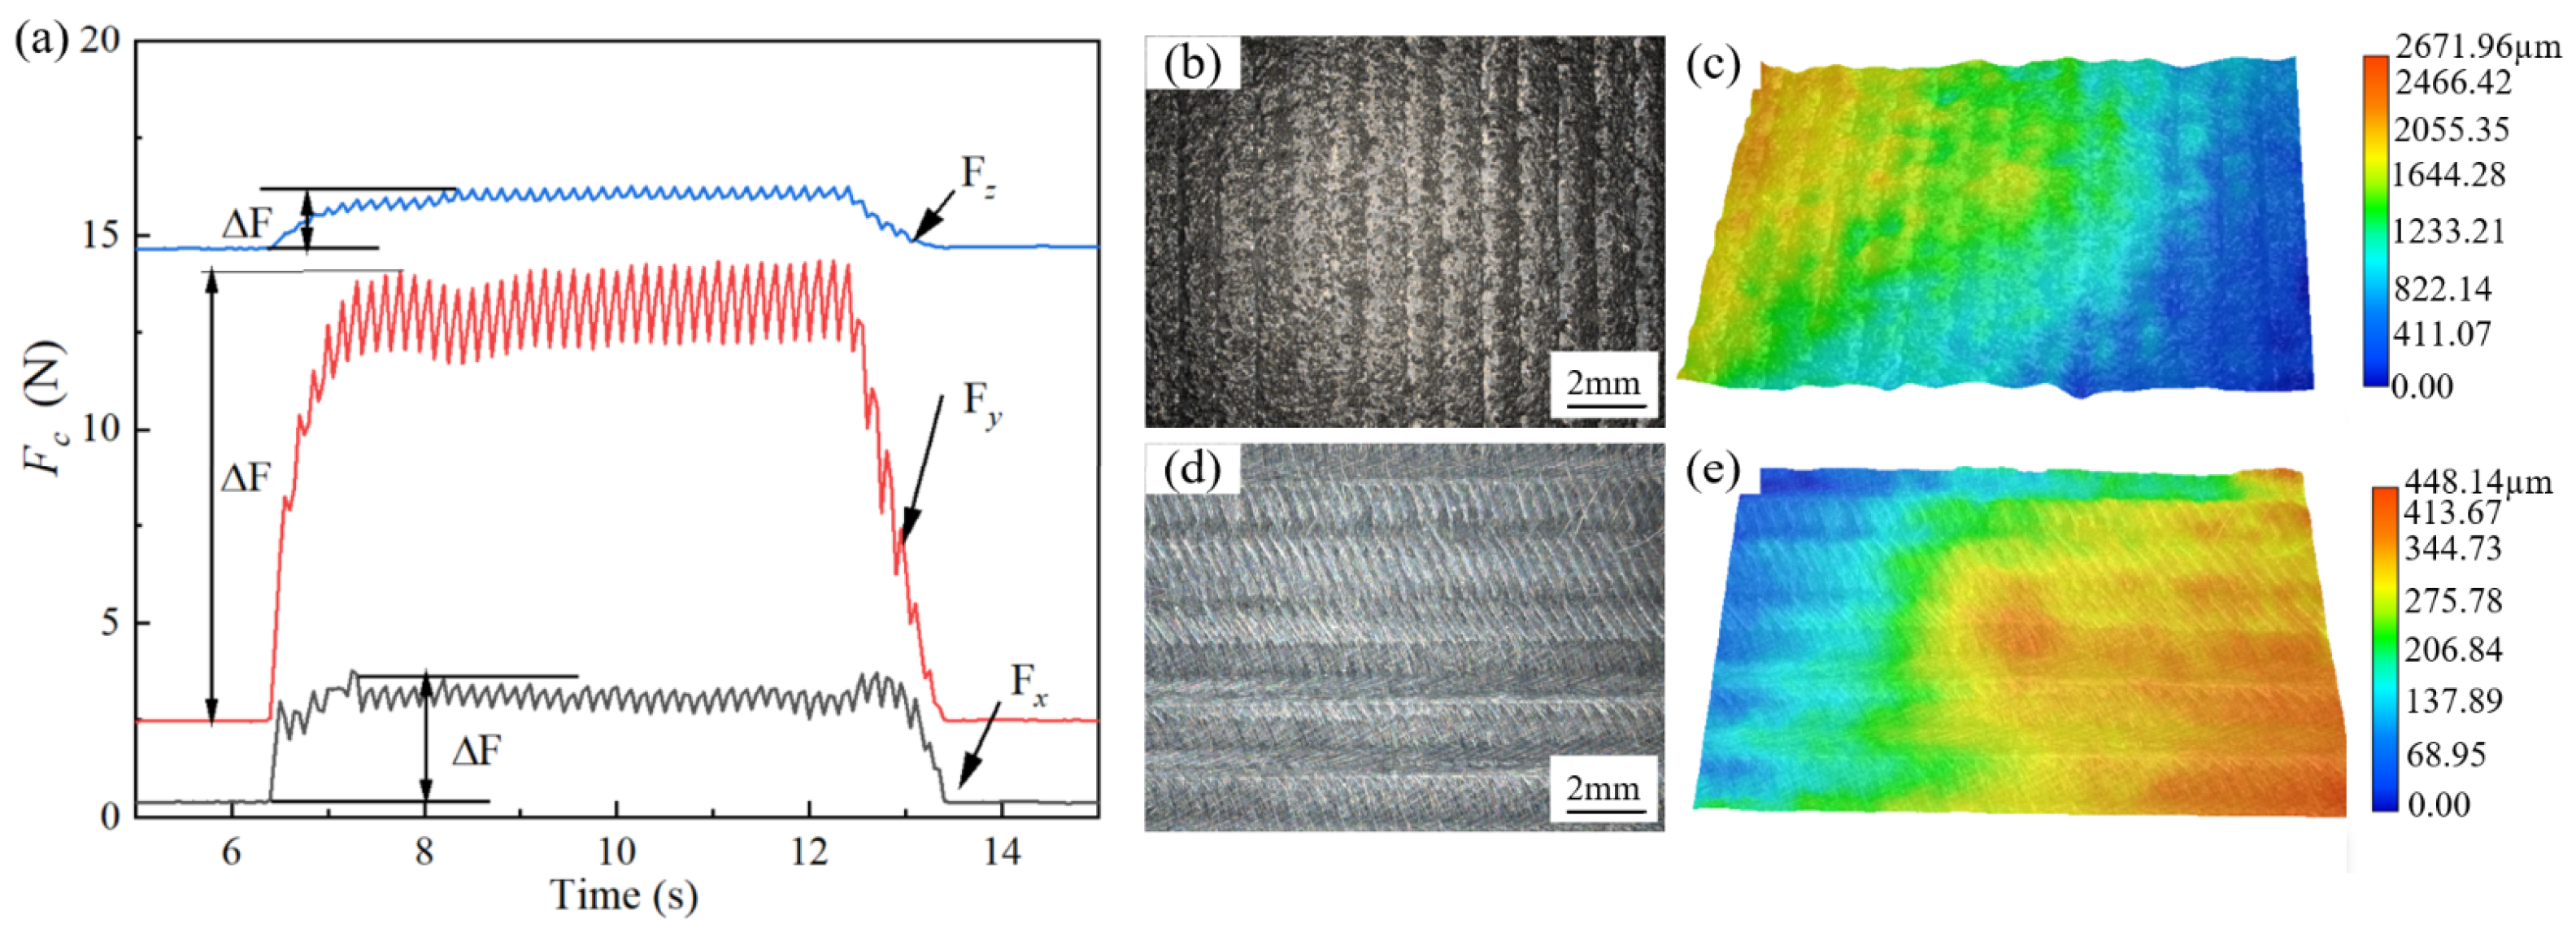
3.1. Experimental Results

The milling force curve of the machining process can be divided into three stages: when the tool is first fully engaged in cutting, when the tool is cutting smoothly, and when the teeth are cutting out of the workpiece. Hence, the milling force of its machining process was analyzed by selecting one of the nine groups of tests, as shown in Figure 3 for the milling force curves and before- and after-milling profiles of the machining process of group 2. As can be seen from Figure 3a, the radial component force Fx, the main cutting force Fy, and the axial component force Fz gradually increase in the first stage. In the second stage, the milling force remains stable with minor fluctuations. The reason for this is that in the stable cutting process, the teeth of the cutter continuously cut into and out of the workpiece; when the chips are stripped from the workpiece, the cutting force decreases, and with the feed movement of the tool, a new cutting layer is involved in the cutting, and the cutting force increases, and so on with cyclic fluctuations. In the third stage, when the tool is gradually detached from the workpiece, only part of the teeth are involved in the cutting, so the cutting force is gradually reduced. To eliminate the interference of various external factors on the measurement results, the measured value of the cutting force is taken as the mean value of the increment of the cutting force ΔF. From the two-dimensional topography before and after milling shown in Figure 3b,d, it can be seen that there are obvious particle attachments and grooves generated by channel overlap on the surface before milling. From the three-dimensional topography before and after milling shown in Figure 3c,e, it can be seen that the maximum depth of the surface after milling is reduced by 83.23% compared with that before milling. The results of the calculation of the milling force are shown in Table 3. The material removal rate can be obtained from Equation (2).

3.2. Analysis of Process Significance Ranking

The analysis of the significance of the process also plays an important role in the adjustment of the machining process parameters, and the process significance of the milling machining process was analyzed by ranking the process using the extreme deviation method. In general, the value of the extreme difference can be used to analyze the degree of influence of the parameter on the indicator: if the value of the extreme difference is larger, then the degree of influence is larger. On the contrary, if the value of the extreme difference is smaller, it means that the degree of influence is small. At the same time, the optimal combination of parameters for the measured indicator can be obtained according to the magnitude of the extreme value difference. Table 4 shows the results of a polar analysis of the milling force and material removal rate. From Table 4, it can be seen that among the influencing factors of the milling force, the cutting depth is the largest and the feed rate is the smallest. It shows that the cutting depth has the most significant effect on the milling process of fusion coating, with the spindle speed being second, and the feed speed has the least effect on the milling force. When observing the factors affecting the material removal rate in Table 4, it can be seen that the cutting depth value has the greatest effect on the material removal rate, followed by the feed rate, and the spindle speed has the least effect on the material removal rate. According to the results of the polar analysis, it can be seen that the combination of process parameters is N3V3P3 to obtain a milling force that is small enough and N1V3P3 to obtain a material removal rate that is large enough. The larger the extreme value difference, the greater the degree of influence of the factor on the indicator being measured. Conversely, a smaller difference in extreme values for a factor means a smaller degree of influence.

3.3. Model Construction Based on Experience

For the ability to accurately express the relationship of the spindle speed, feed rate, and cutting depth with the cutting force Fc and material removal rate Q, an empirical formula for Fe45 alloy coating milling is established based on the principle of metal cutting, assuming that there exists an exponential relationship between each parameter of milling and the milling force and material removal rate, as shown in Equation (2):
y = C + i = 1 k b i e x i + i k j k b i j e x i + x j + i k b i i e x i 2
where C is the coefficient related to the workpiece’s material properties, tool geometry parameters, etc.; xi, xij, and xj denote the coded values of the variables; bi, bij, and bii are the indices of each milling parameter.
The conversion of the exponential function into the linear function is required to calculate the empirical formulas for Fc and Q. The exponential function is then transformed into the linear function. Taking logarithms on both sides of Equation (2) simultaneously gives the following:
ln y = ln C + i = 1 k x i ln b i + i k j k x i j ln b i j + x i i 2 i = 1 k ln b i i
If we let Y = lny, B0 = lnC, Bi = lnbi, Bij = lnbij, and Bii = lnbii, it is then transformed into a linear function, as Equation (4):
Y = B 0 + i = 1 k B i x i + i k j k B i j x i j + i = 1 k B i i x i i 2
Due to the existence of the error in the test process, the e is introduced as an error index to fix Equation (4), and the corrected formula is shown in Equation (5):
Y = e ε 0 B 0 + i = 1 k e ε i B i x i + i k j k e ε i j B i j x i j + i = 1 k e ε i i B i i x i i 2
The experimental results shown in Table 3 were utilized in conjunction with Equation (5) to develop an empirical regression model for the milling force Fc and the material removal rate Q.
F c = 16.61 + 1.22 e N + 1.30 e V + 2.89 e P + 1.28 e N V 1.17 e N P 1.36 e V P + 1.02 e N 2 + 1.01 e V 2
Q = 0.0249 + 0.748 e N + 0.913 e V + 0.059 e N V 0.015 e N P + 0.011 e V P + 1.33 e N 2 0.006 e V 2

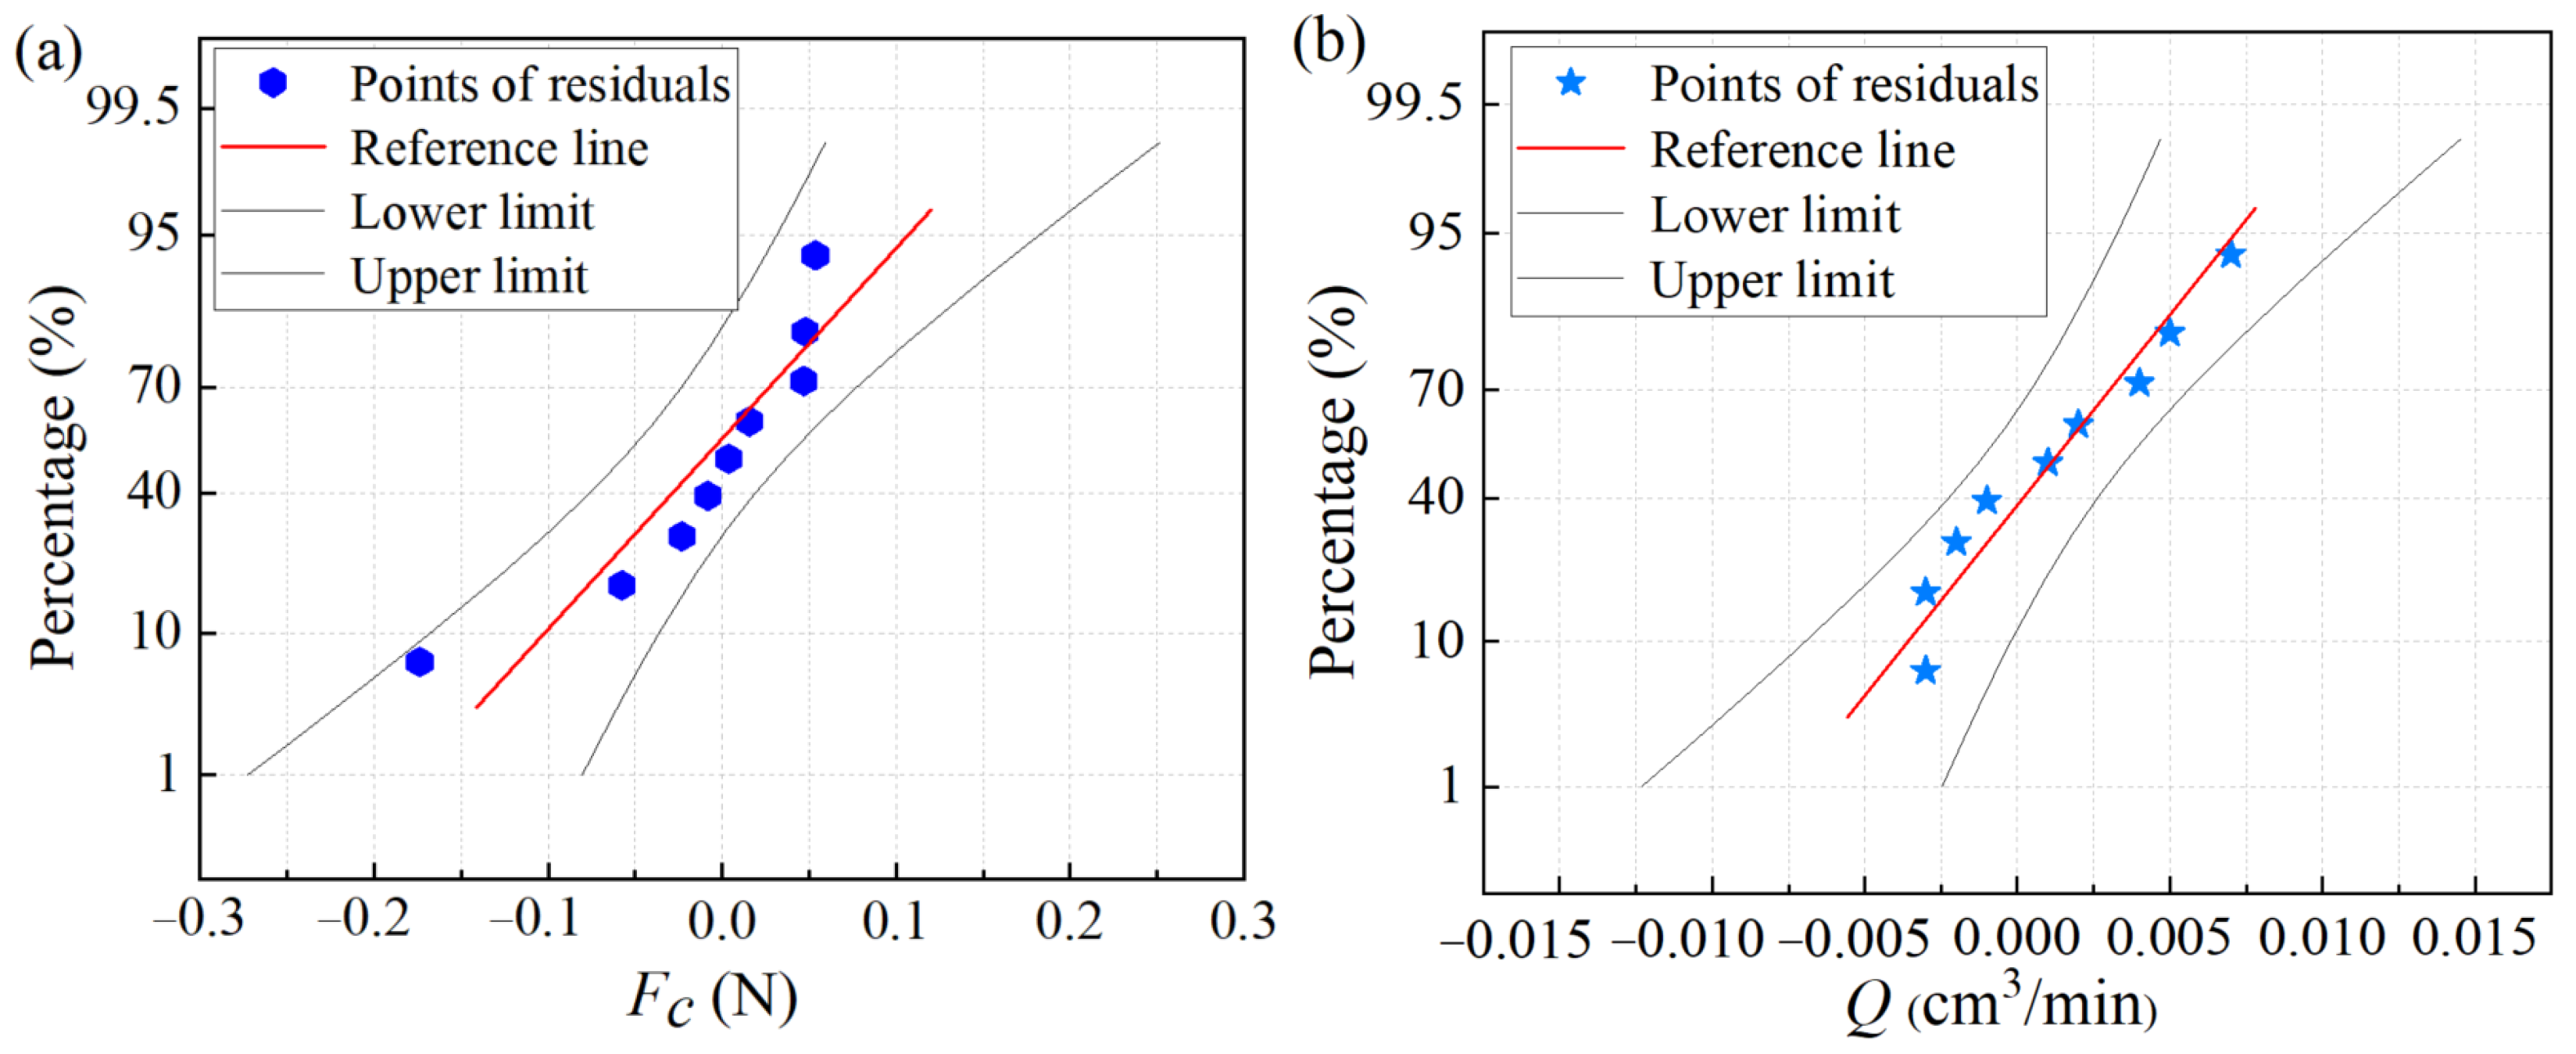
3.4. Significance Test of the Model

The significance of the prediction model has an important influence on the subsequent optimization results. The more significant the model is, the more reliable the optimization results are, and vice versa. The optimization results will deviate from the desired values. Table 5 shows the significance of the test of the milling force and material removal rate. The t1, t2, and t3 represent values of t for N, V, and P, respectively. The R2 values of Fc and Q during milling were 0.860 and 0.979, respectively. The R2 values of the predictive models for the regression analysis were both greater than 0.8, which indicated the higher significance of the predictive models for the milling force and material removal rate. The F-values of Fc and Q were and 58.521 and 7.312, respectively, and it was found by checking the F-value table that the F-values of Fc and Q are greater than F0.01 and the fit is highly significant.
The empirical prediction model for the milling force was fitted and tested based on MATLAB R2022b. The probability plots of the residual normal distribution of Fc and Q are shown in Figure 4. As can be seen from the figure, all of the values are distributed along both sides of the reference line, which indicates that they conform to a normal distribution and the fit is high. It is also clear from Table 5 that the empirical prediction models of Fc and Q are better and can be used for further optimization of the parameters studied.

4. Optimization of Processes

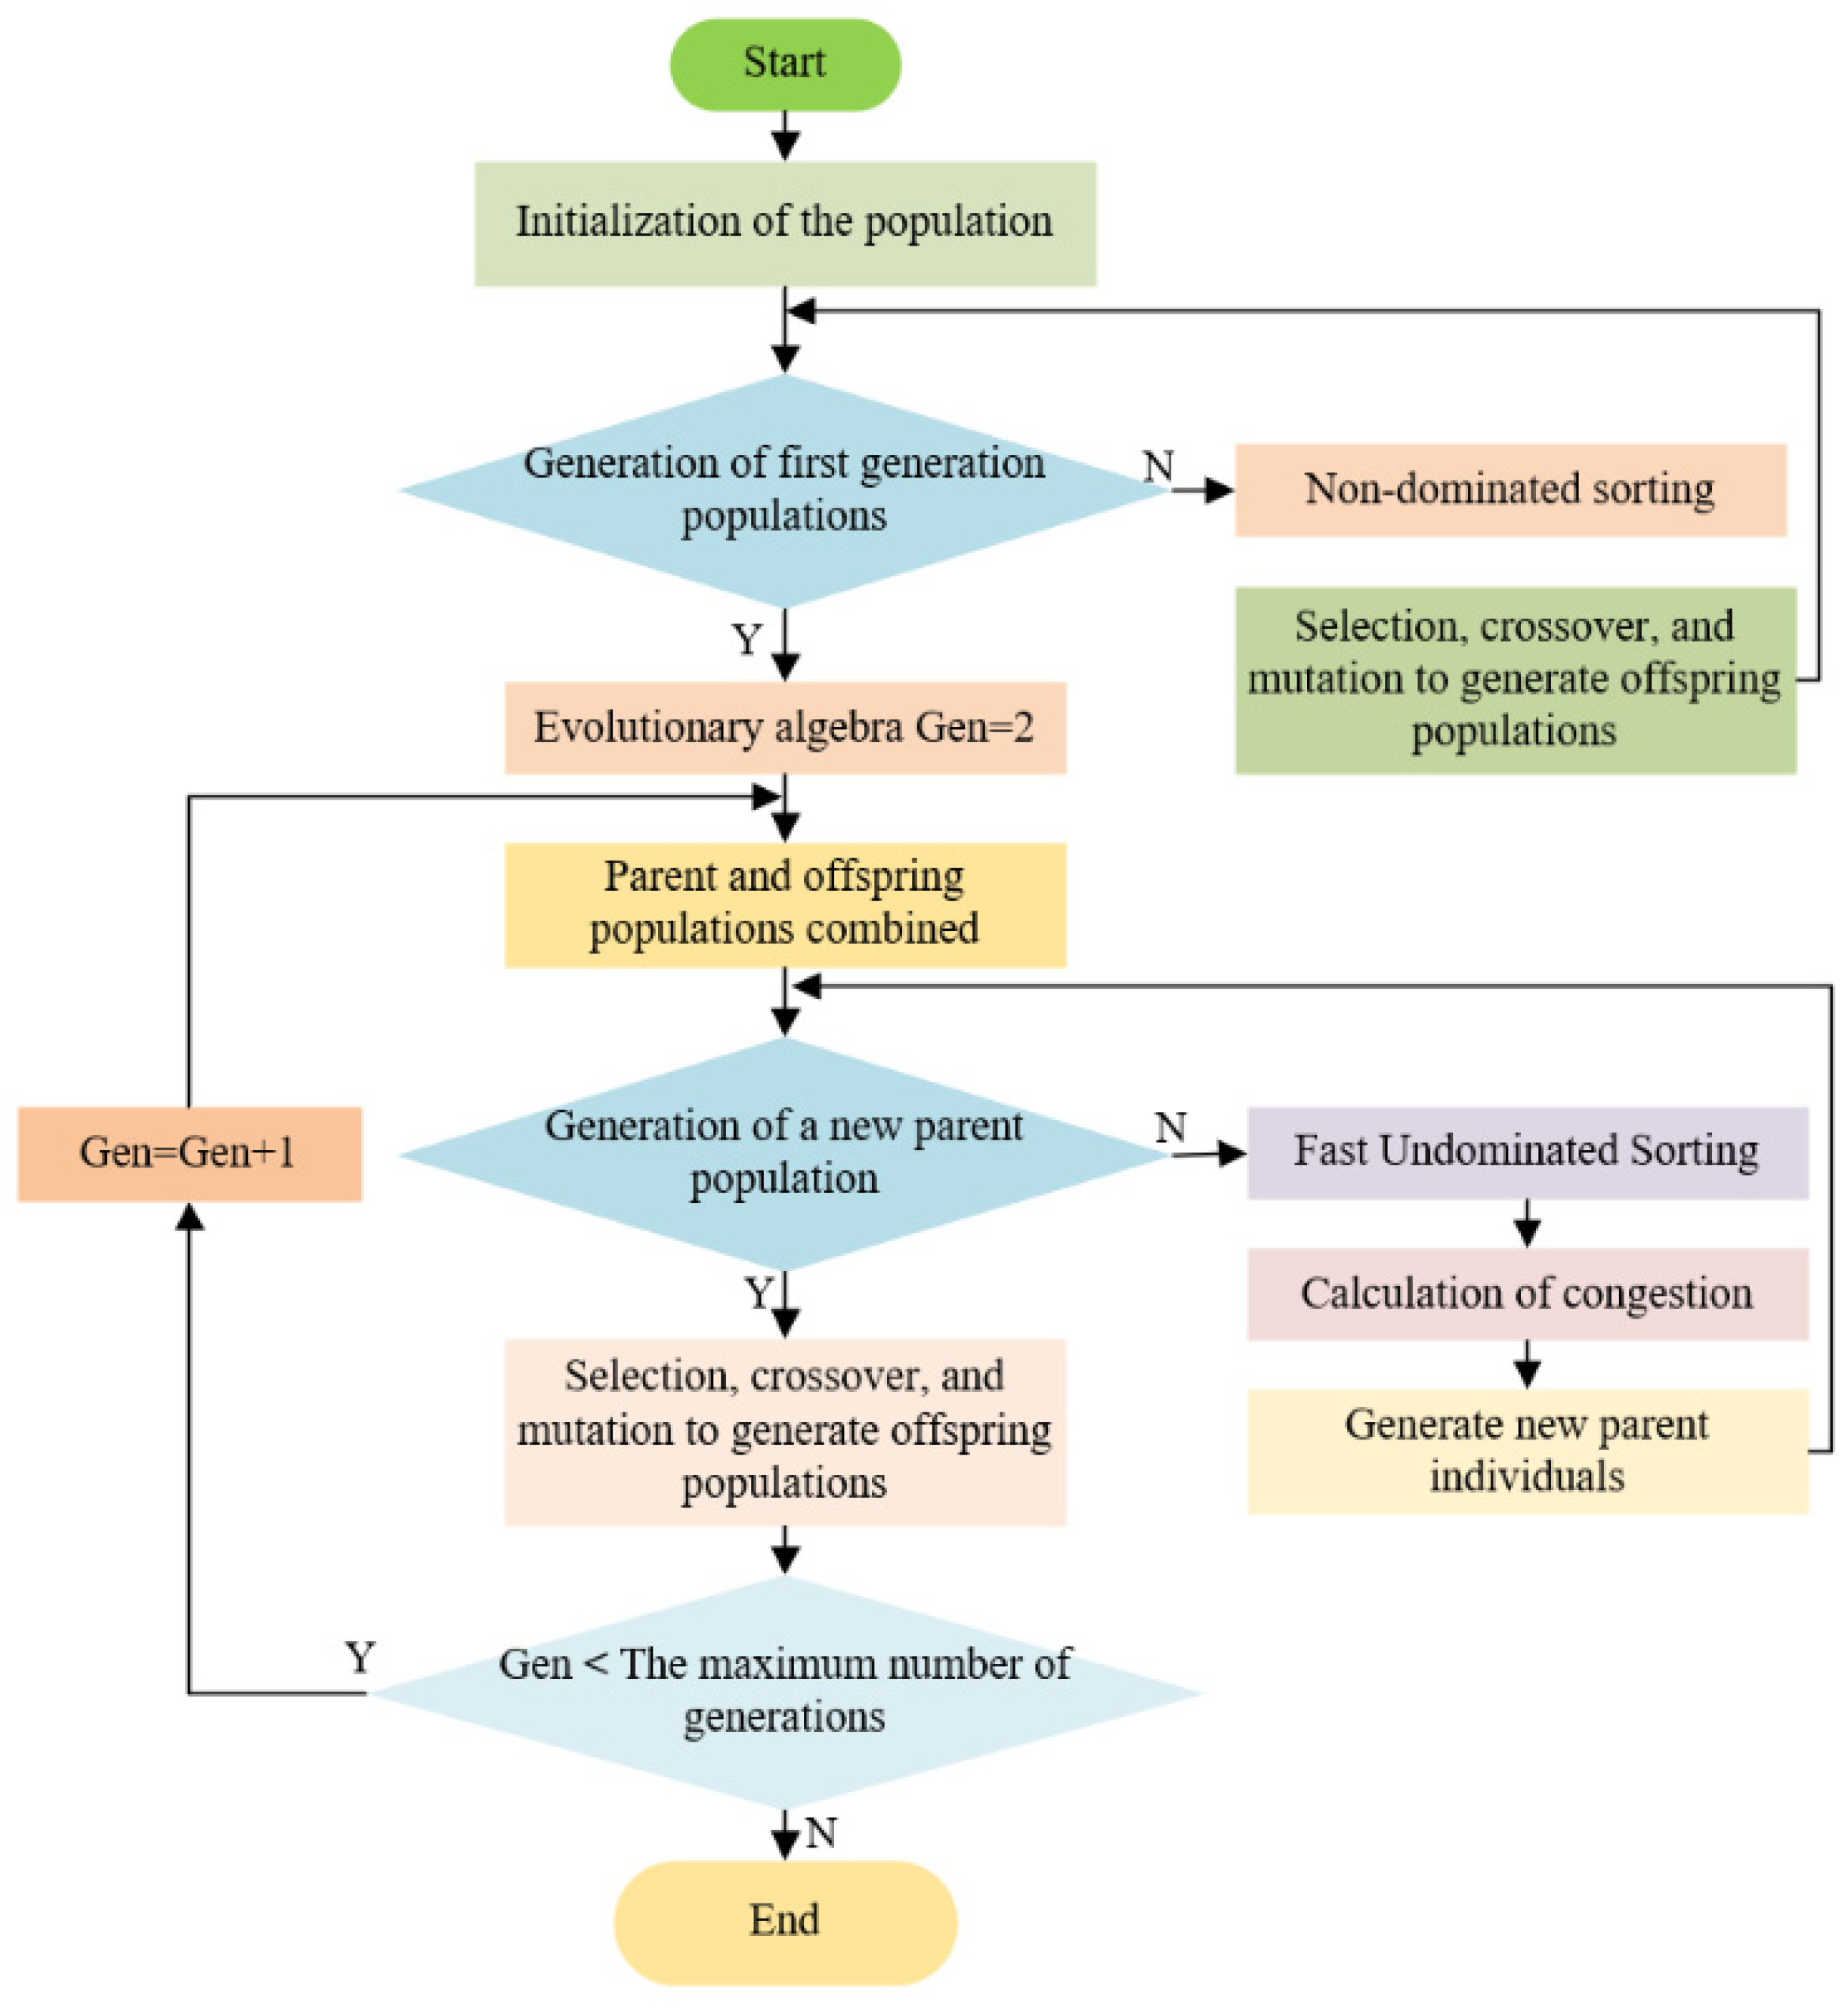
4.1. Principle of the NSGA-II Algorithm

The NSGA-II algorithm is developed on the basis of genetic algorithms, which reduces the complexity of non-inferiority sorting genetic algorithms and improves the running speed of the algorithms as well as the convergence of the solution set through the concepts of fast nondominated sorting, aggregated distance sorting, and elite strategy [33]. A schematic diagram of the NSGA-II algorithm is shown in Figure 5. The genetic operation is used to generate the offspring population, which will be merged with the parent population and will be subjected to congestion distance sorting and non-inferiority sorting to form a new population. This process will be iterated until the termination condition is satisfied. The neighboring points of the same dominance order in the target space are congested distances, and their introduction helps to maintain the diversity of Pareto optimal solutions. The elite strategy is to perform non-dominated sorting and aggregation computation on the current population and select the optimal individuals as the new parent population. The population generated after multiple generations of selection, crossover, and mutation will be uniformly distributed to converge on the Pareto optimal front end, resulting in improved algorithm convergence.

4.2. Model for Multi-Objective Optimization

The milling model for laser-clad molded parts should be based on the lowest possible milling force and the highest possible material removal rate, which contributes to the stability of the milling process and reducing the tool wear. The multi-objective optimization model using Equations (6) and (7) is shown in Equation (8).
{ min F c ( N , V , P ) max Q c ( N , V , P )
When the optimization of parameters is carried out, the milling parameters cannot be taken as infinitely large or infinitely small due to the range of parameters of machine tools and cutting tools. So, it is necessary to constrain the range of milling parameters. The objective function will also be constrained by many factors in the actual machining process, meaning that when formulating the optimal combination of parameters, it is also necessary to consider the actual situation to increase the constraints of each parameter, including the feed rate, the axial depth of the cut, and so on. The specific constraints of each parameter are as follows:
(1)
Spindle speed:
{ g 1 ( N ) = 2000 N 0 g 2 ( N ) = N 3200 0
(2)
Feed rate:
{ g 3 ( x ) = 120 V 0 g 4 ( x ) = V 180 0
(3)
Cutting depth:
{ g 5 ( x ) = 0.1 P 0 g 6 ( x ) = P 0.5 0

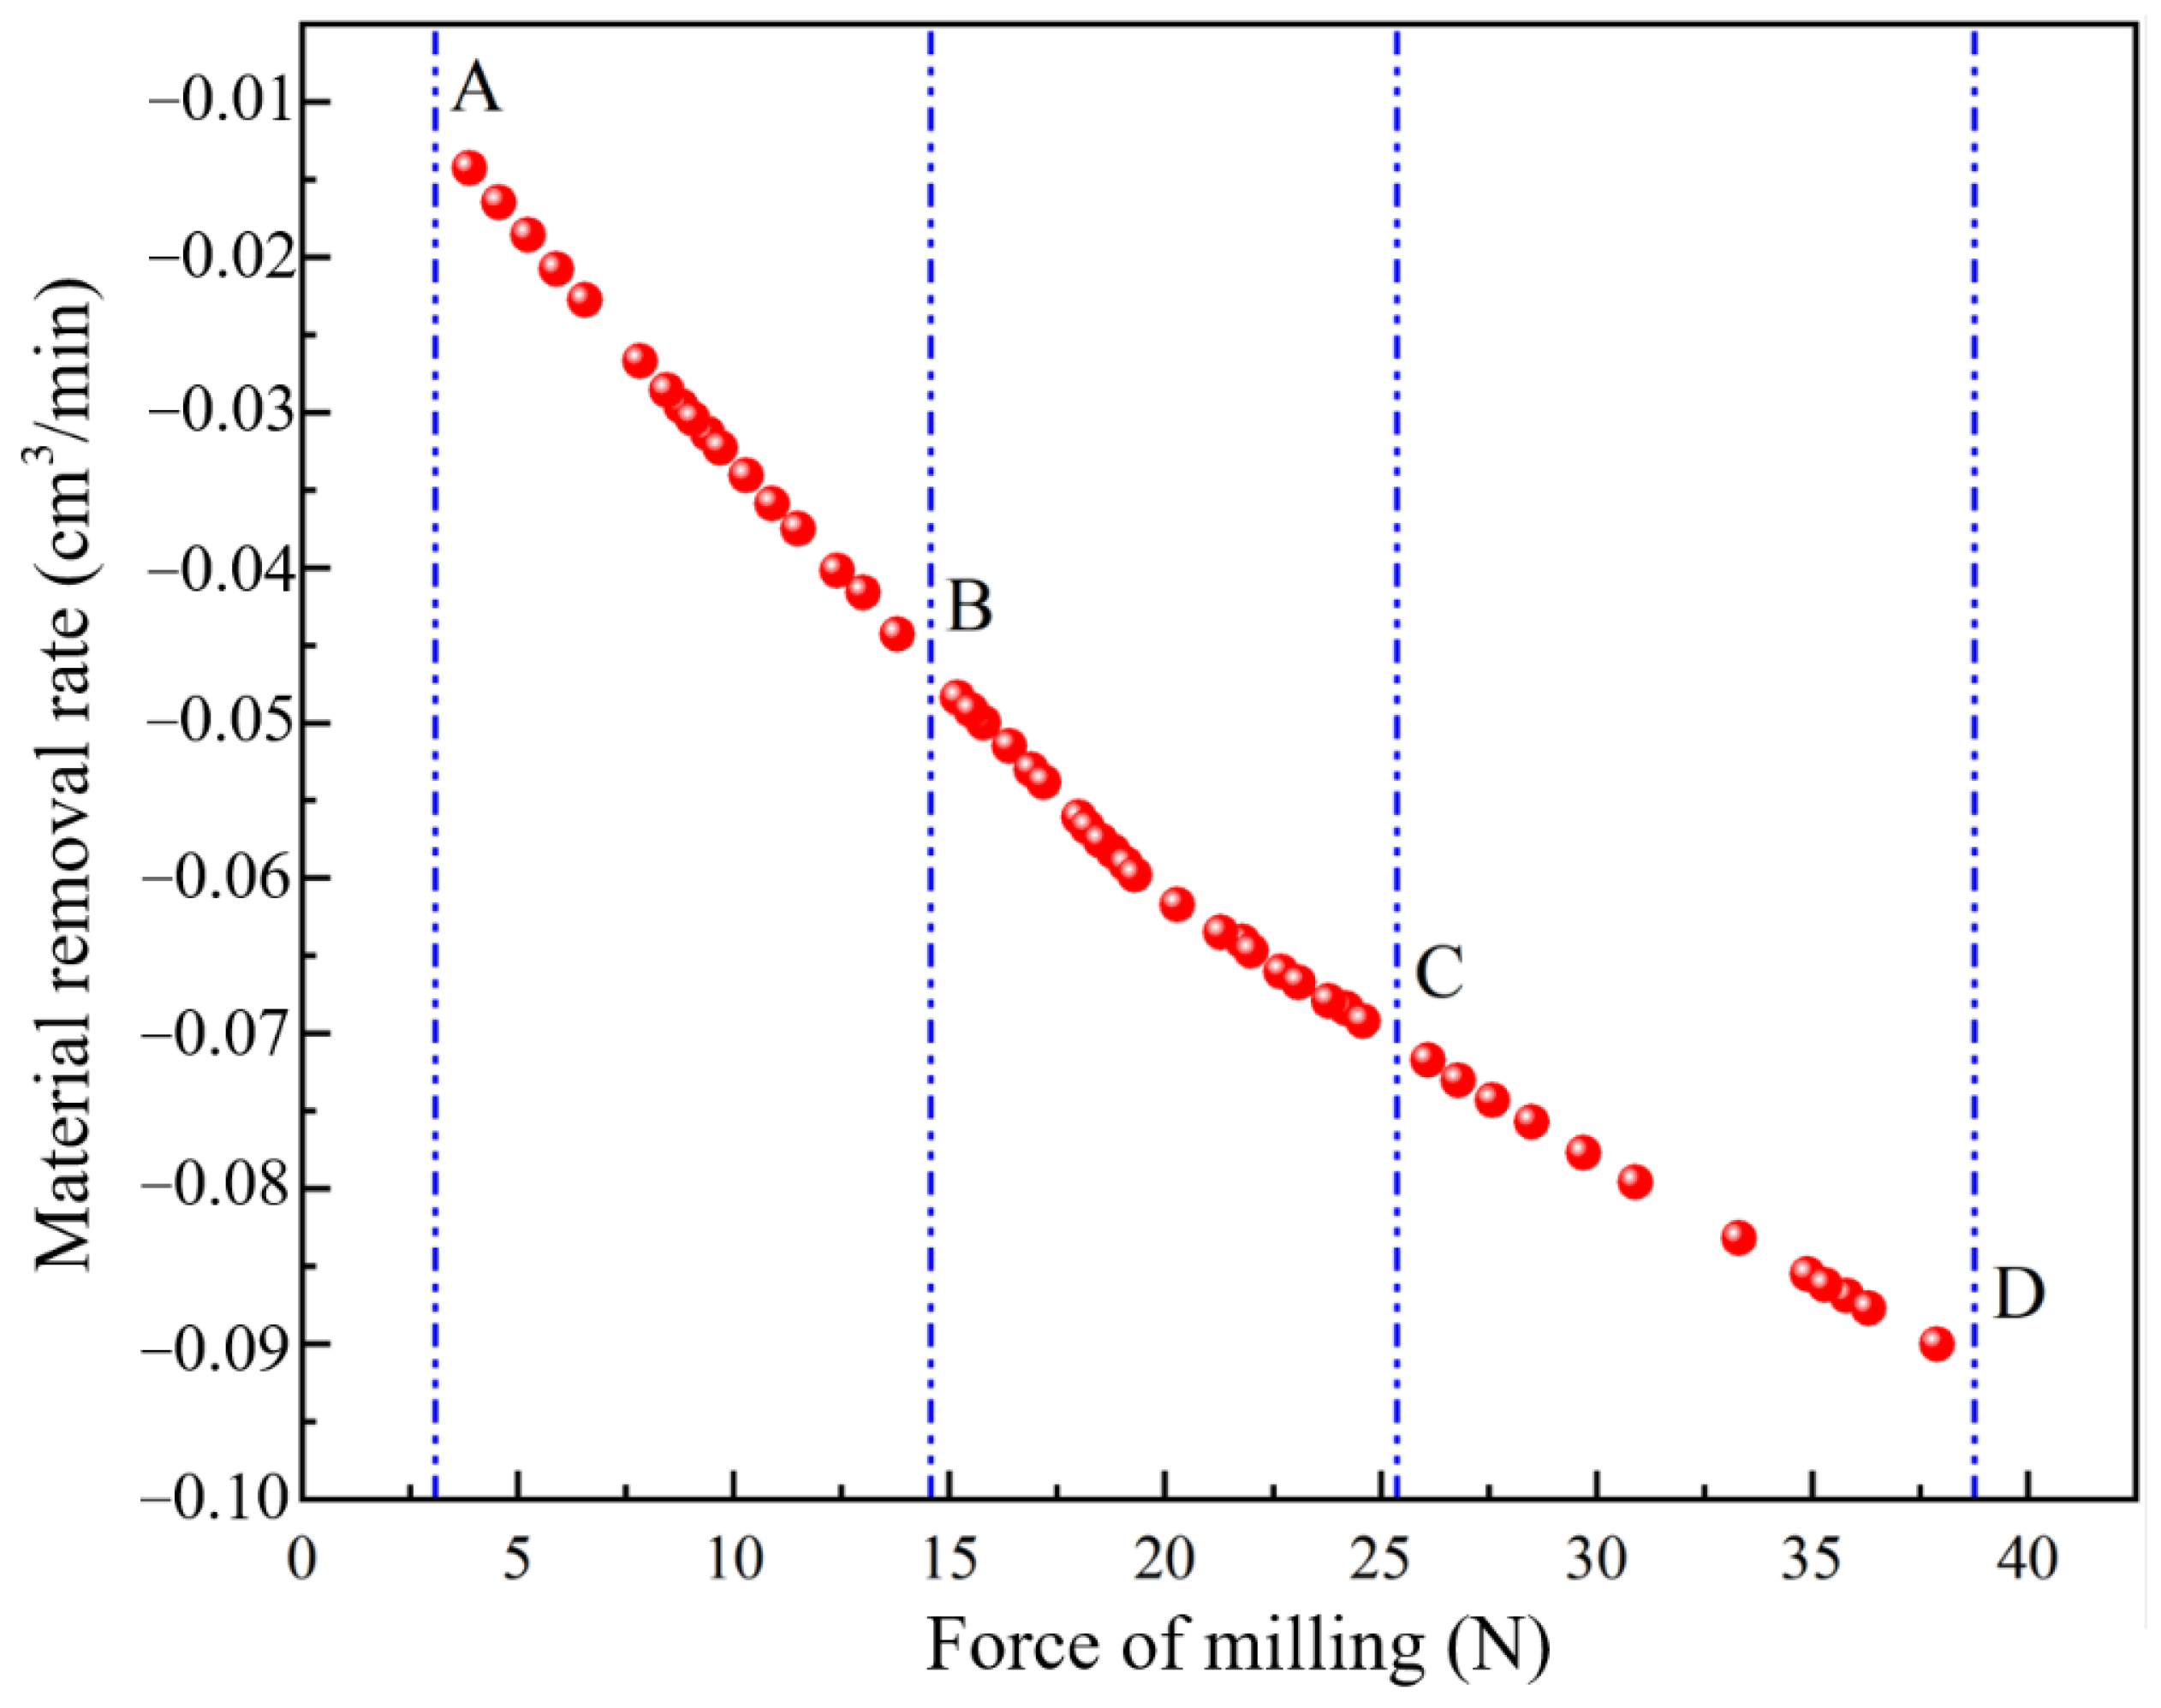
4.3. Results of the Optimization and Validation

The NSGA-II optimization algorithm was programmed using Python 3.10 software, and the parameters and the initial values set during the computation are shown in Table 6. The front-end variation trend graph for the Pareto optimal solution was obtained through Python calculation, as shown in Figure 6.
From Figure 6, it can be seen that the variation in the material removal rate is more significant in the AB section. In the CD section, the variation in the material removal rate decreases, but the variation in the milling force is larger. As the optimization objective here is to simultaneously reduce the milling force as well as to increase the material removal rate, the BC segment is the most reasonable solution set in theory. The Pareto solution for the BC segment is thus extracted, as shown in Table 7.
From the data in the table, it can be seen that the change range of the parameters of the optimal solution set and the response index is small, because the influence trend of the milling parameters on the milling force and material removal rate is consistent. A proper increase in the milling depth improves the material removal rate, increasing the machining efficiency and reducing the machining cost. When using the NASG-II algorithm to optimize the milling parameters, there are an infinite number of Pareto optimal solution sets obtained. Considering the convenience of parameter selection in the milling process, the recommended milling parameter combinations are as follows: N = 2000 r/min, V = 120.0266 mm/min, P = 0.45 mm. The optimal parameter combinations are experimentally verified, and the obtained milling force is 18.42 N, while the material removal rate is 0.0498 cm3/min. The errors with the calculated milling force and material removal rate are 5.74% and 8.79%, which are both less than 10%, and meet the actual processing requirements.
For the further verification of the improvement of the milling performance after process optimization, two groups of optimal process combinations (group 3 and group 9) from the extreme variance analysis were selected for comparison with the optimal parameter combinations, as shown in Figure 7. From Figure 7, it can be noticed that the milling force of the optimal group was reduced by 51.3% and 51.8% compared to groups 3 and 9, respectively. The material removal rate of the optimal group was reduced by 17% and 7.8% compared to groups 3 and 9. From the comparative results, it can be seen that although the material removal rate was reduced, the milling force was greatly improved. Based on engineering experience, it is known that this parameter can provide a reference for the selection of subsequent milling processing parameters [20]. As the accuracy of this optimization result is still insufficient, the subsequent development of new hybrid intelligent optimization methods should be continued to avoid problems such as locally optimal solutions arising from a single algorithm.

5. Conclusions

In this study, the selection of milling process parameters for laser fusion cladding coating of Fe45 alloys was investigated, the significance of the process was analyzed using the orthogonal method, a regression model between the milling process and the milling force and material removal rate was established by using the exponential empirical model, and the milling parameters were optimized using the NGSA-II optimization algorithm. The main conclusions are as follows:
(1)
The process effects of milling force were significantly ranked as cutting depth > spindle speed > feed rate. For the material removal rate, the significance was ranked as cutting depth > feed rate > spindle speed.
(2)
Reliable regression models for the spindle speed, feed rate, and cutting depth with the milling force and material removal rate were developed using empirical exponential models.
(3)
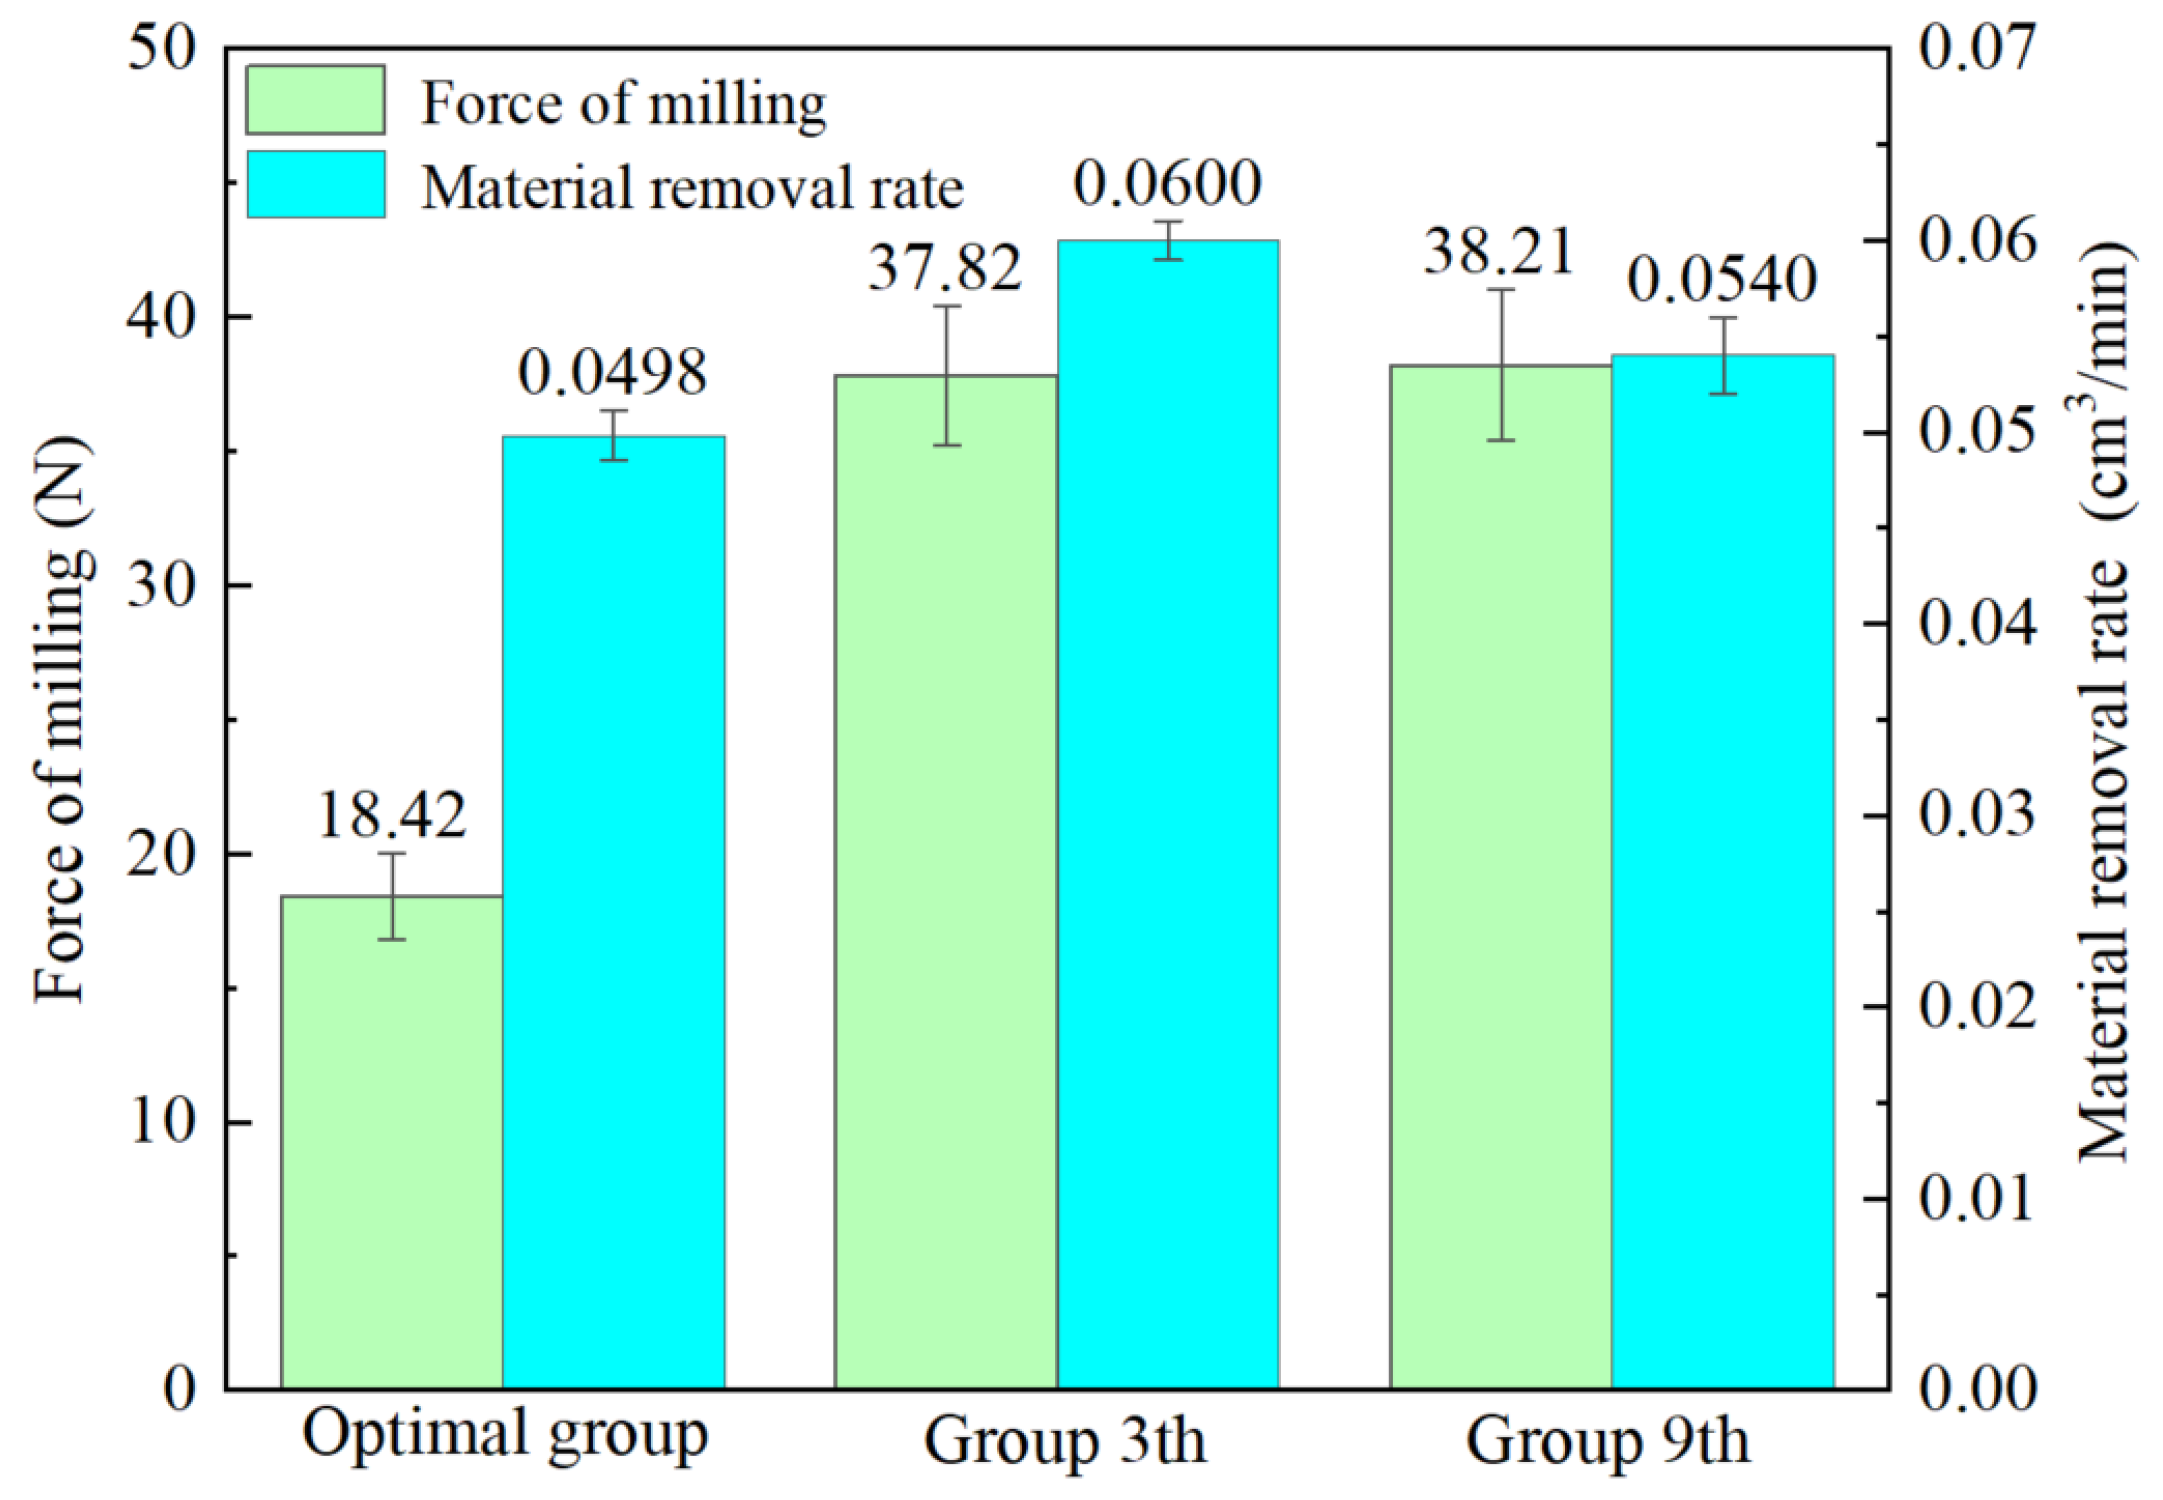
The NSGA-II algorithm was used to optimize the milling parameters and the optimum process parameters were N = 2000 r/min, V = 120.0266 mm/min, and P = 0.45 mm. The results obtained with the algorithm were found to be better by comparing them with the two sets of results from the extreme variance analysis.
(4)
The results of this study can provide some technical support for the control and prediction of the milling process for laser-melted Fe45-forming coatings. Further research should continue to develop efficient hybrid intelligent optimization methods to improve the optimization accuracy in the future.

Author Contributions

J.Z.: writing. L.S.: methodology. A.L.: data processing. N.H.: experimentation. J.G.: experimentation. All authors have read and agreed to the published version of the manuscript.

Funding

This work was supported by the research projects of the Shaanxi Provincial Department of Education 2023 General Special Scientific Research Program (23JK0357) and the research project of Shaanxi University of Technology (SLGKYXM2306).

Institutional Review Board Statement

Not applicable.

Informed Consent Statement

Not applicable.

Data Availability Statement

The original contributions presented in the study are included in the article, further inquiries can be directed to the corresponding author.

Conflicts of Interest

The authors declare that they have no known competing financial interests or personal relationships that could have appeared to influence the work reported in this paper.

References

  1. Wang, X.J.; Liu, M.H.; Li, Z.H.; Yao, B.B.; Wang, B.; Wang, N. Finite element simulation and experimental study of selective laser melted 40Cr steel forming process. Opt. Laser Technol. 2024, 169, 110080. [Google Scholar] [CrossRef]
  2. Wang, S.H.; Zheng, Z.Y.; Li, T.L.; Du, A.; Ma, R.N.; Fan, Y.Z.; Zhao, X.; Cao, X.M. Microstructure and properties of a YG18/40Cr joint vacuum–brazed by Cu–Sn–Ti filler metal. Vacuum 2023, 217, 112511. [Google Scholar] [CrossRef]
  3. Chen, B.; Li, X.M.; Tian, L.Y.; Jia, H.Y.; Li, H.; Li, Y. The CrFeNbTiMox refractory high-entropy alloy coatings prepared on the 40Cr by laser cladding. J. Alloys Compd. 2023, 966, 171630. [Google Scholar] [CrossRef]
  4. Gong, J.T.; Shu, L.S.; Zhang, C.M.; Qin, J.P.; He, W.; Li, A.J. Co-Optimization of the Preparation Process of Ni-Based Self-Lubricating Coatings by Magneto-Thermal-Assisted Laser Cladding. Coatings 2023, 13, 1749. [Google Scholar] [CrossRef]
  5. Lei, K.Y.; Qin, X.P.; Liu, H.M.; Ni, M. Analysis and modeling of melt pool morphology for high power diode laser cladding with a rectangle beam spot. Opt. Lasers Eng. 2018, 110, 89–99. [Google Scholar] [CrossRef]
  6. Cui, G.J.; Feng, X.G.; Han, W.P.; Liu, Y.P.; Kou, Z.M. Microstructure and high temperature wear behavior of in-situ synthesized carbides reinforced Mo-based coating by laser cladding. Surf. Coat. Technol. 2023, 467, 129713. [Google Scholar] [CrossRef]
  7. Weng, Z.K.; Wang, A.H.; Wang, Y.Y.; Xiong, D.H.; Tang, H.G. Diode laser cladding of Fe-based alloy on ductile cast iron and related interfacial behavior. Surf. Coat. Technol. 2016, 286, 64–71. [Google Scholar] [CrossRef]
  8. Lu, S.S.; Wang, L.Q.; Zhou, J.S.; Liang, J. Microstructure and tribological properties of laser-cladded Co-Ti3SiC2 coating with Ni-based interlayer on copper alloy. Tribol. Int. 2022, 171, 107549. [Google Scholar] [CrossRef]
  9. Wu, X.Q.; Zhou, G.H.; Sun, D.J.; Chen, L.Y.; He, J.Y.; Wang, S.Q.; Xie, F. Cultivating a comprehensive understanding of microstructural attributes and wear mechanisms in FeCrCoNiAlTix high-entropy alloy coatings on TC6 substrates through laser cladding fabrication. J. Alloys Compd. 2024, 984, 173865. [Google Scholar] [CrossRef]
  10. Ouyang, C.; Wang, R.; Zhao, C.; Wei, R.; Li, H.; Deng, R.; Bai, Q.; Liu, Y. Multi-layer laser cladding analysis and high-temperature oxidative wear behavior of cast iron with a low expansion coefficient. Surf. Coat. Technol. 2023, 474, 130079. [Google Scholar] [CrossRef]
  11. Zhu, L.; Xue, P.; Lan, Q.; Meng, G.; Ren, Y.; Yang, Z.; Xu, P.; Liu, Z. Recent research and development status of laser cladding: A review. Opt. Laser Technol. 2021, 138, 106915. [Google Scholar] [CrossRef]
  12. Wang, R.; Ouyang, C.Y.; Zhao, C.J.; Wei, R.Z.; Deng, R. Effect of high-temperature heat treatment on electrochemical corrosion behavior of laser cladding Fe-based alloy coating in H2SO4 solution. Mater. Lett. 2023, 346, 134560. [Google Scholar] [CrossRef]
  13. Wei, R.Z.; Ouyang, C.Y.; Wang, R.; Zhao, C.J.; Deng, R.; Li, H. Effect of chromic acid anodization on the corrosion resistance of Fe-based alloy coatings by high-speed laser cladding. Mater. Lett. 2023, 350, 134887. [Google Scholar] [CrossRef]
  14. Shu, L.S.; Cang, X.Y.; Zhou, J.; Heng, Z.; Wu, H.; He, W. Study on machinability and grain deformation of laser cladding manufactured and wrought IN718 alloys in dry milling process. Mater. Today Commun. 2023, 34, 105066. [Google Scholar] [CrossRef]
  15. Zhang, W.; Zhang, X.; Zhao, W.H. Research on the multi-physical coupling characteristics of the machine tool and milling process based on the systematically integrated model. J. Manuf. Process. 2023, 105, 46–69. [Google Scholar] [CrossRef]
  16. Wang, X.Q.; Wei, Z.C.; Wang, D.; Zhang, D.B.; Wang, X.Y.; Wang, M.J. A supplementary processing method of residual material in impeller plunge milling. J. Manuf. Process. 2023, 108, 1–11. [Google Scholar] [CrossRef]
  17. Liu, M.; Duan, C.; Li, G.; Cai, Y.; Wang, F. Friction property and milling machinability of Ni60 cladding layer in hybrid additive-subtractive manufacturing. J. Manuf. Process. 2023, 93, 162–172. [Google Scholar] [CrossRef]
  18. Wang, T.; Li, Y.; Liu, J.; Qin, L.; Wang, N.; Zhang, L.; Wang, H.; Li, Z. Milling Force and Surface Topography of Ti-6Al-4V Titanium Alloy Cladded by the Laser. Surf. Rev. Lett. 2018, 26, 1850185. [Google Scholar] [CrossRef]
  19. Zhao, Y.H.; Sun, J.; Li, J.F. Effect of rare earth oxide on the properties of laser cladding layer and machining vibration suppressing in side milling. Appl. Surf. Sci. 2014, 321, 387–395. [Google Scholar] [CrossRef]
  20. Cang, X.Y.; Shu, L.S.; Hu, N.; Yu, H.L. Establishment and experimental verification of a three-dimensional finite element model for residual stress in surface processing of Inconel 718 alloy by laser cladding. Mater. Today Commun. 2023, 37, 107088. [Google Scholar] [CrossRef]
  21. Gong, H.H.; Ma, B.J.; Zhu, Y.P.; Yang, H. Enhancement of machinability and surface quality of Ti-6Al-4V by longitudinal ultrasonic vibration-assisted milling under dry conditions. Measurement 2022, 187, 110324. [Google Scholar] [CrossRef]
  22. Brehl, D.E.; Dow, T.A. Review of vibration-assisted machining. Precis. Eng. 2008, 32, 153–172. [Google Scholar] [CrossRef]
  23. Jiang, Z.G.; Zhou, F.; Zhang, H.; Wang, Y.; Sutherland, J.W. Optimization of machining parameters considering minimum cutting fluid consumption. J. Clean. Prod. 2015, 108, 183–191. [Google Scholar] [CrossRef]
  24. Adaan-Nyiak, M.A.; Alam, I.; Tiamiyu, A.A. Ball milling process variables optimization for high-entropy alloy development using design of experiment and genetic algorithm. Pow. Technol. 2023, 427, 118766. [Google Scholar] [CrossRef]
  25. Xu, Z.Y.; Yuan, J.F.; Wu, M.Y.; Arif, A.F.M.; Li, D.Y. Effect of laser cladding parameters on Inconel 718 coating performance and multi-parameter optimization. Opt. Laser. Technol. 2023, 158, 108850. [Google Scholar] [CrossRef]
  26. Wu, S.; Liu, Z.H.; Huang, X.F.; Wu, Y.F.; Gong, Y. Process parameter optimization and EBSD analysis of Ni60A-25% WC laser cladding. Int. J. Refract. Met. Hard Mater. 2021, 101, 105675. [Google Scholar] [CrossRef]
  27. Cao, H.J.; Liu, L.; Wu, B.; Gao, Y.; Qu, D. Process optimization of high-speed dry milling UD-CF/PEEK laminates using GA-BP neural network. Compos. Part B Eng. 2021, 221, 109034. [Google Scholar] [CrossRef]
  28. Huang, R.J.; Ma, Y.S.; Li, H.; Sun, C.Y.; Zhang, J.L.S.; Wang, H.Q.; Hao, B. Operation parameter multi-objective optimization method of large vertical mill based on CFD-DPM. Adv. Powder Technol. 2023, 34, 104014. [Google Scholar] [CrossRef]
  29. Peng, S.T.; Li, T.; Zhao, J.L.; Lv, S.P.; Tan, G.Z.; Dong, M.M.; Zhang, H.C. Towards energy and material efficient laser cladding process: Modeling and optimization using a hybrid TS-GEP algorithm and the NSGA-II. J. Clean. Prod. 2019, 227, 58–69. [Google Scholar] [CrossRef]
  30. Zhang, D.Y.; Liu, Z.S.; Song, K.W.; Zhai, Z.Y.; Zhang, Y.C.; Gao, Z.Q. Parameters optimization for laser-cladding CoCrFeNiMn high-entropy alloy layer based on GRNN and NSGA-II. Mater. Today Commun. 2024, 39, 108615. [Google Scholar] [CrossRef]
  31. Shu, L.S.; Heng, Z.; Li, P.Y.; Wu, H.; Li, J.; Feng, J. Effect of laser powers on the mechanical properties 27SiMn steel with Inconel 718 cladding coatings. Mater. Res. Express 2022, 9, 096511. [Google Scholar] [CrossRef]
  32. Chakradhar, B.; Singaravel, B.; Ugrasen, G.; Kumar, A.K. Prediction of cutting forces using MRA, GMDH and ANN techniques in micro end milling of titanium alloy. Mater. Today Proc. 2023, 72, 1943–1949. [Google Scholar] [CrossRef]
  33. Zheng, W.J.; Doerr, B. Mathematical runtime analysis for the non-dominated sorting genetic algorithm II (NSGA-II). Artif. Intell. 2023, 325, 104016. [Google Scholar] [CrossRef]
Figure 1. Powder morphology.
Coatings 14 00449 g001
Figure 2. Experimental cladding system and experimental platform for milling; (a) laser cladding systems; (b) milling centers.
Coatings 14 00449 g002
Figure 3. Milling force curves and milling profiles. (a) Graph of milling force; (b) two-dimensional morphology before milling; (c) three-dimensional morphology before milling; (d) two-dimensional morphology after milling; (e) three-dimensional morphology after milling.
Coatings 14 00449 g003
Figure 4. Effect of fitting the empirical model for the milling force: (a) Fc; (b) Q.
Coatings 14 00449 g004
Figure 5. Flowchart of the NSGA-II algorithm.
Coatings 14 00449 g005
Figure 6. Pareto optimization frontier solution.
Coatings 14 00449 g006
Figure 7. Comparison of response indicators.
Coatings 14 00449 g007
Table 1. Chemical compositions of 40Cr and Fe45.
ElementCrCSiMnNiWFe
40Cr0.80.370.170.5---
Fe4518.00.152.00.21.01.0Bal.
Table 2. Table of experimental factor levels.
LevelLevel 1Level 2Level 3
N (r/min)200026003200
V (mm/min)120150180
P (mm)0.10.30.5
Table 3. Experimental results.
OrderN (r/min)V (mm/min)P (mm)Fx (N)Fy (N)Fz (N)Fc (N)Q (cm3/min)
120001200.11.3852.24472.06643.35070.012
220001500.32.791613.43162.28613.90780.045
320001800.54.857837.48571.187637.81780.06
426001200.31.788113.66553.05414.11630.036
526001500.51.937247.44126.207847.88480.075
626001800.11.51087.97177.655911.15540.018
732001200.50.984844.64016.505245.11230.06
832001500.11.09775.60136.1938.42220.015
932001800.31.034536.4911.288238.21010.054
Table 4. Polarization analysis results.
NormFactorK1K2K3R
FcN18.35924.38630.58212.223
V20.86023.40529.0618.201
P7.64322.07843.60535.962
QN0.0490.0430.0430.006
V0.0360.0450.0540.018
P0.0150.0450.0750.060
Table 5. Significance test of the regression analysis prediction model.
Model R 2 FFitting Degree t 1 t 2 t 3 The Significance of Factors
Fc0.86058.521*−4.6494.94013.557 t 0.001 ( 5 ) > t 3 > t 2 > t 1
Q0.9797.312**5.2321.9152.307 t 3 > t 0.001 ( 5 ) > t 1 > t 2
Note: F 0.05 ( 3 , 5 ) = 5.409 ; F 0.01 ( 3 , 5 ) = 12.060 is highly significant when F > F 0.01 , denoted as ** ; F 0.01 ( 3 , 5 ) = 12.060 is significant when F 0.01 > F > F 0.05 , denoted as * . t 0.001 ( 5 ) = 6.869 ,   t 0.01 ( 5 ) = 3.365 .
Table 6. Parameter settings.
Name of the ParameterSetting Options
Types of populationsDouble vector
Size of the group100
Maximum number of iterations100
Initial population[2000, 120, 0.1]
Intersection functionDual-node
Options for plottingPareto
Evaluation of the fitness function Two-way traffic
Range of valuesMin [2000, 120, 0.1]
Max [3200, 180, 0.5]
Table 7. Partial BC data for the Pareto front end.
NumberN
(r/min)
V
(mm/min)
P
mm
Fc
(N)
Q
(cm³/min)
12000120.02660.45481517.430.0546
22000120.00260.46120317.710.0553
32000120.13820.46684617.970.0563
42000120.06660.47398318.250.0571
52000120.22130.47886618.560.0579
62000.0011200.48613318.820.0585
72000120.22920.49117419.050.0591
820001200.49832419.380.0600
92000120.91210.519.610.0606
102000122.14450.519.950.0612
Disclaimer/Publisher’s Note: The statements, opinions and data contained in all publications are solely those of the individual author(s) and contributor(s) and not of MDPI and/or the editor(s). MDPI and/or the editor(s) disclaim responsibility for any injury to people or property resulting from any ideas, methods, instructions or products referred to in the content.

