Influence of a UVA-Activated TiO2 Coating on Bacterial Surface Colonization in Water-Bearing Systems


Fraunhofer-Institute for Organic Electronics, Electron Beam and Plasma Technology FEP, Winterbergstraße 28, 01277 Dresden, Germany
*
Author to whom correspondence should be addressed.
Coatings 2024, 14(4), 454; https://doi.org/10.3390/coatings14040454
Submission received: 4 March 2024
/
Revised: 4 April 2024
/
Accepted: 7 April 2024
/
Published: 10 April 2024
(This article belongs to the Section Plasma Coatings, Surfaces & Interfaces)
Abstract
:This study focuses on the use of superhydrophilic titanium dioxide (TiO2) coatings applied to the surfaces of water-bearing systems to prevent surface colonization and biofilm formation. Biofilms in water-bearing systems are a problem in many industrial areas and are associated with risks to hygiene and health, material damage, and high costs for cleaning and maintenance. We investigated the suitability of TiO2 coatings activated by UVA irradiation to achieve a superhydrophilic surface. The well-adherent coatings were deposited on flat and curved substrates (stainless steel, Al2O3) by pulsed magnetron sputtering. Surface characteristics, wettability, and the influence on microbial surface colonization were evaluated by WCA measurements, SEM, and XRD. For microbiological evaluation, Escherichia coli and Staphylococcus warneri were used. An adapted and specialized regime for sample conditioning and testing was developed that allows comparability with upcoming studies in this field. The superhydrophilicity was stable for up to 4 days, and an additional UVA reactivation step revealed comparable results. The microbiological studies proved a successful prevention of bacterial colonization on the activated coatings, which is attributed to their superhydrophilicity. The results demonstrate the potential of UV-activated TiO2 as a long-term coating of water-bearing systems, like pipes, on which it assists in avoiding biofilm formation.
1. Introduction
Titanium dioxide (TiO2) is a suitable candidate for superhydrophilic surface equipment as it is a well-known photocatalyst. It can be deposited by sol–gel processes but also by various physical vapor deposition methods, such as pulsed magnetron sputtering [1,2,3]. The photoactive phases of TiO2 can be activated by the absorption of ultraviolet (UV) radiation, which results in the formation of electron–hole pairs. This can initiate two mechanisms on the surface: (1) photocatalytic oxidative decomposition, often described as photocatalysis, and (2) photo-induced hydrophilicity or superhydrophilicity [4,5]. Photocatalysis refers to various oxidation and reduction reactions induced by the electron–hole pairs reacting with molecules adsorbed on the surface. As a result, radicals and ions are formed, which leads to the decomposition of organic matter present at the surface. The final products of photocatalytic decomposition reactions are carbon dioxide, water, and inorganic ions [4,6,7]. In addition to photocatalytic decomposition, UV radiation induces hydrophilicity. Superhydrophilicity describes a condition where a water contact angle (WCA) of less than 10° can be observed on a surface [5,8]. The underlying mechanisms are still not fully understood, and various mechanisms have been proposed that attempt to explain photo-induced hydrophilicity [5,8,9,10]. One theory describes a superhydrophilic surface in its initial state directly after TiO2 deposition that becomes more hydrophobic by the adsorption of organic molecules from its surroundings. By photocatalytically driven degradation of these adsorbed organic molecules, the surface can return to its initial superhydrophilic state [9]. Another proposed theory connects the occurrence of superhydrophilicity to the thermal effect of irradiation. In this theory, the infrared component of the UV radiation source heats the surface, causing water molecules bound by hydrogen bonds to desorb and additionally causing adsorbed hydrocarbons to be partially degraded by photocatalysis. This increases the surface energy and, thus, the hydrophilicity of the surface. If the surface cools down after irradiation, water and hydrocarbons reabsorb, which results in the formation of the original structure of the hydrated layer and a reduction in surface energy and hydrophilicity [9]. The oldest and most widely accepted theory relies on the photoexcitation of electrons and the associated formation of surface defects or vacancies in terms of electron–hole pairs caused by UV irradiation [5,8,9,10]. Water molecules are bound to the surface due to the reaction of oxygen and water with the electron–hole pairs (surface defects), which results in an increase in the hydrophilicity of the surface [5,8].
Both photo-induced mechanisms, photocatalytic degradation and hydrophilization, have the potential to contribute to the sanitation of surfaces. Photocatalytic oxidative decomposition is a frequently used mechanism for the partial removal or even inactivation of microorganisms and other organic contamination. Currently, research focuses on nanostructured TiO2 materials, composite coatings with additional photocatalysts, or doping of the coatings to improve the photocatalytic activity [2,3,11].
However, we consider the effect of superhydrophilicity to be the most suitable for use in water-bearing systems. No permanent activation by irradiation but only intervals of reactivation are necessary. For this reason, we investigated the superhydrophilicity of TiO2 and its long-term stability as a means to enable the permanent prevention of microorganism adhesion and, hence, subsequent biofilm formation. We also checked whether the superhydrophilic behavior could be reactivated after a certain time. This fact is rarely considered in the literature but represents a key factor when addressing a long-term stable effect.
Adhesion and adsorption of microorganisms to a surface are influenced by physico-chemical and morphological parameters as well as by molecular and cellular interactions. Significant influence on bacterial adhesion can be achieved by controlling any of the related surface parameters, such as charge, roughness, topography, or wetting properties [12]. Therefore, superhydrophilic surfaces can be used to develop easy-to-clean surfaces. Influencing microbial adhesion can help to prevent biofilm formation, as biofilm formation always has its origin in the adhesion of single microorganisms [12,13,14].
Biofilms on surfaces in general, and especially fluid-carrying systems, are a widespread problem and occur in many industries, such as the food and dairy, marine, medical supplies, water, optical, paper, and oil industries [13]. For example, biofilms are involved in the contamination of food processing equipment, which can impair food quality and safety [15,16]. In the oil industry, corrosion caused by biofilms is responsible for 40% of all corrosion events in oil pipelines [17]. From a medical point of view, biofilms have critical implications, as they are major contributors to infection transmission and are estimated to be responsible for the development of 65% of all nosocomial infections [16]. Especially disease spreading through the water systems of hospitals, which is directly connected with biofilm formation in these systems, is a significant risk to the health of hospitalized patients [18,19].
Biofilm formation enables microorganisms to survive in adverse environmental and nutritional conditions, as well as in the presence of high concentrations of antimicrobial agents such as antibiotics and disinfectants [16,20]. Additionally, microorganisms are more persistent in humid settings than on dry surfaces, where they may already live for months [21]. Thus, biofilm growth and its negative effects lead to high costs for cleaning and maintenance, especially in water-bearing systems like pipes, where mechanical cleaning is often impossible. This demonstrates the need for the development of materials that help to prevent bacterial adhesion and the formation of biofilms [13]. Due to limited access to many pipe systems, the mechanical cleaning of them is considerably impaired. It has been shown that after chemical disinfection of such difficult-to-clean systems, microbiological contamination was still apparent [22].
To counteract the formation of biofilms in water-bearing systems, it is reasonable to prevent microbial adhesion in the first place, as the adhesion of microorganisms is assumed to be the start of biofilm formation [12,13,14]. This can be achieved by adapting the surface wettability using TiO2 coatings and their activation by UV irradiation to establish superhydrophilic surfaces for microbial adhesion prevention, as described above. This is the aim of our study. For this purpose, we investigated microbial colonization on superhydrophilic TiO2-coated half pipes and the time-dependent stability of superhydrophilicity. We chose half pipes with a diameter of 36 mm as a model system for biofilm-burdened water-bearing pipe systems. Initial microbial adhesion has its origins usually in the lower half of pipes due to gravity effects and a continuous abundance of liquid residue. The half pipes were coated with TiO2 by pulsed magnetron sputtering. The coated samples were activated using UVA irradiation with a wavelength of 365 nm until superhydrophilicity was confirmed. For the evaluation of the influence of superhydrophilicity on microbial colonization, a specialized test regime was developed to represent the usual loading and unloading of liquid in a pipe-based water-bearing system. As test organisms, both Gram-negative and Gram-positive bacteria strains were used: Escherichia coli (E. coli) and Staphylococcus warneri (S. warneri). Both strains are reported to be involved in healthcare-associated infections [18,23,24]. S. warneri was chosen as a representative for Staphylococcus aureus (S. aureus) and its methicillin-resistant variant (MRSA), one of the most dangerous hospital germs. MRSA and human pathogenic strains of E. coli are among the most common biofilm-forming bacteria that cause hospital-related infections [24]. S. warneri likewise tends to form biofilms and, hence, is a suitable representative to investigate the initial events of biofilm formation, in particular microbial adhesion [23]. E. coli is a commonly identified organism in water-bearing system-related outbreaks in hospitals and was therefore selected as a second microorganism to be investigated [18].
2. Materials and Methods
2.1. UV Irradiation Setup for Surface Activation
Two UV irradiation setups (planar and curved) using UVA LEDs were constructed to activate the coatings on flat (Figure 1a) and curved samples (Figure 1b). The setup for flat samples in Figure 1a uses a 365 nm LED (NDU1104ESE-365-TR, Stanley Electric, Meguro, Japan), and the setup for curved samples in Figure 1b uses two 365 nm LEDs (ELUA3535OGB series, Everlight Electronics, New Taipei, Taiwan). The irradiation distance, the distance between the UVA LED and the sample surface, was 36 mm. This was based on the standardized diameter of a common drainage pipe (DN 40) according to standard specification [25].
2.2. Determination of UV Dose Distribution
For surface activation, the coated samples were irradiated with UVA radiation using the setup described in Section 2.1 and Figure 1. UVA irradiation results in dose application onto the sample surface. To evaluate the relative dose distribution during sample irradiation, B3 film dosimeters (WINdose B3, GEX Corporation, Palm City, FL, USA) were applied to several positions on the samples (see Figure 2). The film dosimeters (10 mm × 10 mm) were irradiated for 25 min and afterwards stored in the dark under ambient conditions for 24 h. During this storage time, irradiation-induced color development took place. The film dosimeters were scanned (Epson Perfection 4490 Photo, Seiko Epson Corporation, Suwa, Japan), and their resonance was determined via gray shades (Risø Scan, Risø High Dose Reference Laboratory, Roskilde, Denmark). The resonance was used as measure for the applied UVA dose. To evaluate the relative dose distribution, the central measurement point was set to 100%, and all other points were normalized to this one.
The irradiance of the LEDs on the center of the sample surface was measured by UV radiometer equipped with a UVA sensor (RMD Pro, UV Messtechnik Opsytec Dr. Göbel, Ettlingen, Germany). This point represents the measurement point “c” (see Figure 2) and was set to 100%, as described above.
2.3. Sample Coating, Conditioning, and Activation
Sample Coating: The coating deposition process was bipolar pulsed magnetron sputtering in the medium frequency range (some 10 kHz) [26]. The plant UNIVERSA of Fraunhofer FEP was used for coating the samples used in this study. A pair of rectangular magnetron sources arranged side by side were equipped with titanium (Ti) targets of dimensions 508 mm × 127 mm and reactively sputtered in an argon–oxygen atmosphere at pressures in the range of 1.03–1.13 Pa.
The TiO2 coating was deposited on flat substrates by rotating the substrates around an axis parallel to the target surface in front of the magnetrons, as described by Fietzke and Zywitzki (deposition parameters in Table 1) [27]. The flat samples were used to determine the effect of UVA irradiation during coating activation in terms of surface hydrophilization, investigated by WCA measurements. Pieces of aluminum oxide ceramic (Al2O3; Rubalit® 710, 50 mm × 50 mm) and stainless steel (X5CrNi18-10, material No. 1.4301, surface finish 2R: cold rolled and bright annealed, 100 mm × 60 mm) with a thickness of 0.95 mm were selected as substrates. These two substrate materials with differences in surface roughness and chemical composition were chosen to evaluate coating deposition on strongly varying substrates and its influence on layer properties. Stainless steel represents a relevant material type for application in water-bearing pipes. The TiO2 coating was deposited on these substrates directly or with an additional adhesion-promoting Ti interlayer. For coating of the curved samples (X5CrNi18-10, 0.5 mm thickness), the concave side was coated using analog process parameters (Table 1).
Sample Conditioning: To obtain a comparable initial state of the coating surface, the TiO2-coated samples were conditioned by 90 min UVA irradiation using the irradiation setup described in Section 2.1. Afterwards, the samples were stored in water under dark conditions for 24 h. Then, the water was drained off, and the samples were stored for a further 5 days under ambient conditions in the dark. This procedure for optimal sample conditioning was evaluated in preliminary tests to achieve similar initial wetting characteristics (see Section 3.2). Until usage, the samples were stored under ambient conditions in the dark. No further change in WCA was observed under these storage conditions.
For microbiological investigations, the samples were autoclaved (121 °C, 20 min, 210 kPa) before use and stored under sterile conditions.
Sample Activation: The TiO2-coated samples were activated by UVA irradiation directly before the start of the respective microbiological experiments using the setup described in Section 2.1 and underwent continuous irradiation for 30 min.
2.4. Sample Characterization
2.4.1. Determination of Layer Thickness
The layer thickness was determined by weighing the samples on an analytical balance (AT261 DeltaRange, Mettler-Toledo, Greifensee, Switzerland) before and after coating. The weight gain after the coating process was normalized to the overall coated surface per sample, and, considering the estimated density of the coating (anatase: 3.89 g/cm3 [28]), the layer thickness was calculated.
2.4.2. Atomic Force Microscopy (AFM), Scanning Electron Microscopy (SEM), and X-ray Diffraction (XRD) Measurement
AFM: The surface roughness was determined by AFM measurements in non-contact mode at the center of the flat samples according to [29] using NaniteAFM (Nanosurf, software: C3000 controller (version 3.8.4.2), Liestal, Switzerland). The evaluation of the measurements was performed in the program MountainsSPIP Expert (version 8.0.9286, DigitalSurf, Besançon, France).
SEM: Characterization of the surface morphology and layer structure of the TiO2 coatings was performed using a field emission scanning electron microscope (SU8000, Hitachi, Tokyo, Japan). Cross sections were obtained by breaking the substrates, which, in individual cases, was followed by ion polishing. This method was also used to determine the approximate lateral size of the anatase crystals.
XRD: Measurements were performed using a D8 Discover (Bruker Corporation, Billerica, MA, USA) with a grazing incidence of 1° and copper Kα-radiation on one representative sample of each coating deposited on flat substrates. Measurements were conducted to determine the effects of the substrate and/or the interlayer on the composition and phase of the final TiO2 surface. The JCPDS-International Center for Diffraction standard plots #21-1272 (anatase) and #21-1276 (rutile) were used to evaluate the crystal phases [30].
2.4.3. Contact Angle Measurement, Superhydrophilicity, and Stability
WCA measurements were used to examine the wetting behavior of the TiO2 coatings. The measurements were performed using an OCA 20/6 (software: SCA20.2 (version 4.1.16 build 1023), DataPhysics, Filderstadt, Germany) and the sessile drop method with a drop volume of 0.3 µL of deionized water. The water contact angle was measured ten times in the middle of the flat samples; the average value and standard deviation were calculated. The OCA 20/6 device has a minimum measurable contact angle of 4°, meaning that actual contact angles below 4° are presented as 4° as well.
WCA measurements were used to determine the optimal sample conditioning procedure, to evaluate hydrophilicity upon UVA activation, and to investigate the long-term stability. Samples were activated by 90 min UVA irradiation. Stability investigations regarding the hydrophilicity were conducted for up to 8 days at the following intervals: before UVA irradiation, directly after irradiation, 0.5 h and 1.0 h after irradiation, and every 24.0 h after irradiation.
According to the literature, samples were designated as superhydrophilic if the WCA was below or equal to 10° [5,8].
Each type of sample was measured in triplicate in three independent experiments.
2.5. Microbiological Evaluation
2.5.1. Stock Culture and Sample Inoculation
Microbiological tests were performed using E. coli (Gram-positive bacteria) and S. warneri (Gram-negative bacteria).
Cultivation of E. coli: For the stock culture, 100 mL of standard I nutrient broth (15 g/L peptone, 3 g/L yeast extract, 6 g/L sodium chloride, 1 g/L glucose, Carl Roth, Karlsruhe, Germany) were inoculated with a stock aliquot of E. coli K12 (DSM 498) (stored at −80 °C) in a 300 mL Erlenmeyer flask and incubated for 24 h at 37 °C under ambient conditions in a shaking incubator at 125 rpm.
Cultivation of S. warneri: For the stock culture, 100 mL of CASO broth (16 g/L peptone from casein, 3 g/L peptone from soy, 2.5 g/L di-potassium hydrogen phosphate, 5 g/L sodium chloride, 2.5 g/L glucose monohydrate, Carl Roth) were inoculated with a stock aliquot of S. warneri (DSM 20036) (stored at −80 °C) in a 300 mL Erlenmeyer flask and incubated for 24 h at 37 °C under ambient conditions in a shaking incubator at 125 rpm.
To determine bacterial density, after 24 h, the cultures were diluted 1:100 with the respective culture medium, and 10 µL aliquots each were pipetted into a Neubauer counting chamber (Neubauer-Improved, Paul Marienfeld, Lauda-Königshofen, Germany). The number of apparent bacteria in the counting grid was counted under a light microscope (B3 professional series, MoticEurope, Barcelona, Spain), and bacterial density in the stock was calculated considering the dilution.
For impedance calibration (Section 2.5.2) as well as for every experiment during microbiological investigation of the coated curved samples (Section 3.3), a new stock of E. coli and S. warneri was grown for each.
For inoculation of the coated curved samples (curSS-TiO2), the stock cultures were diluted with 1× PBS (Dulbecco’s, Capricorn Scientific, Ebsdorfergrund, Germany) to a bacterial density of 103 mL−1.
Curved samples were inoculated (after their activation) with bacterial suspension, which was dropped centrally onto the concave side of the sample. For a detailed explanation of the sample preparation and subsequent microbiological procedures, please see Section 3.3.
2.5.2. Impedance Measurement
Impedance describes the resistance to flow of an alternating electric current through a conducting material. It is a complex quantity consisting, amongst others, of a conductive component [31]. In microbiology, impedance measurement can be used to determine initial bacterial concentration in solutions by recording the change in impedance of the solution over time and relating the results to a calibration. The change in impedance is caused by the release of ionic metabolites from viable bacteria in the solution. It is usually measured by the so-called direct method, with a pair of electrodes in direct contact with the solution and the bacteria therein [31,32]. Impedance meters measure the relative or absolute changes in impedance, capacitance, or conductivity at a given temperature (incubation temperature) at regular time intervals. The impedance meter used in the experiments, BacTrac 4100 (software: Y1.49r/D7 (5.10.2004), SY-LAB, Neupurkersdorf, Austria), uses the impedance splitting method. The total impedance is the sum of two components, the electrode or interface impedance (E value) and the electrolyte or media impedance (M value), which can be measured in different frequency ranges. The BacTrac systems are capable of measuring both components at 1 kHz [33]. Due to its higher sensitivity to changes as well as its reliability in media within a wide range of salt concentrations, the E value was selected for our experiments [32].
It has already been shown that this method is suitable for the detection of E. coli and S. warneri, e.g., to record the delay in impedance curves of microorganism suspensions with different initial densities of microorganisms [34]. The usual detection limit of the device is 1 bacteria/mL, which therefore allows the detection of low bacterial concentrations in liquids.
The time the impedance value of a sample needs to reach or exceed the previously defined threshold is called the detection time. It depends directly on the used microbial strain and the initial number of viable bacteria. The detection thresholds were chosen in such a way that the exceedance occurs in the lower third of the impedance curves for all bacterial concentrations according to [35,36]. Within preliminary investigations, thresholds of E% = 10 (E. coli) and E% = 7 (S. warneri) were determined.
Direct impedance measurement was used to determine the amount of viable bacteria on the sample surface after activation and UVA irradiation. The method was calibrated for both bacterial strains.
Calibration was performed separately for both bacteria strains in the respective culture medium (see Section 2.5.1) in the impedance meter. Stock cultures were diluted in a 1:10 series with the respective medium from 109 to 100 bacteria/mL. Each impedance cell was filled with 6 mL of the dilution. Each dilution was measured in triplicate. As the negative control, triplicates of 6 mL of the respective sterile culture medium were used. All impedance samples were incubated in the impedance meter for 24 h at 37 °C, recording the impedance value every 10 min. In parallel, an aliquot of all dilutions was plated in triplicate on nutrient agar to determine the actual number of viable bacteria by counting colony-forming units (CFUs) after incubation (for details, see Section 2.5.3).
For each dilution, the obtained detection times were plotted against the viable number of bacteria achieved by the plate count method to obtain the calibration curve for both bacterial strains. The calibration curves can be found in Figure 3.
By using the acquired detection time for a solution of unknown bacterial load, this calibration allows the calculation of the initial number of viable bacteria in the solutions and on the investigated samples.
For investigations on coated samples, impedance measurement was used to determine the remaining concentration of viable bacteria on the sample surface after performing the developed experimental regime described in Section 3.3. Five aliquots per sample, with a volume of 6 mL each, were transferred into impedance cells. A triplicate of 6 mL sterile culture medium was used as negative control, and a triplicate of 6 mL stock culture diluted to 103 CFU/mL as positive control. The measurement cells remained in the impedance meter for up to 5 days, or until bacterial activity was detected by exceeding the previously defined threshold. Investigations were performed in triplicate, with three independent experiments per sample.
2.5.3. Plate Count Method
The plate count method was used as a reference to determine the amount of viable bacteria for the calibration of the impedance measurement. A total of 100 µL of all calibration suspensions added to the impedance measurement cells were plated in triplicate on nutrient agar after dilution to 103 bacteria/mL with the respective nutrient medium. The post-dilutions were done in 1:10 or 1:100 steps with a final volume of 10 mL. The 102, 101, and 100 bacteria/mL suspensions were also plated in triplicate with a volume of 100 µL each. Positive controls were 100 µL of the stock solution diluted to 103 bacteria/mL in triplicate, and negative controls were 100 µL of sterile nutrient medium on nutrient agar and pure nutrient agar. E. coli was grown on standard I nutrient agar (15 g/L peptone, 3 g/L yeast extract, 6 g/L sodium chloride, 1 g/L glucose, 12 g/L agar, Carl Roth), and S. warneri was grown on CASO agar (15 g/L peptone from casein, 5 g/L peptone from soy, 5 g/L sodium chloride, 15 g/L agar, Carl Roth) with 3 g/L yeast extract (Carl Roth). For E. coli, the agar plates were incubated for 20 h at 27 °C under ambient conditions and 70% humidity, followed by 5 h at 37 °C under ambient conditions and 70% humidity. For S. warneri the agar plates were incubated for 24 h at 37 °C under ambient conditions and 70% humidity. The number of CFUs was determined afterwards by optical counting of apparent colonies. The number of viable cells in the sample medium was calculated according to the following formula:
CFU/mL = (mean value colonies of all plates of one dilution level × dilution factor)/(plated volume of bacterial suspension [mL]).
2.6. Statistics
Microsoft 365 Excel (version 2401) was used for the calculation of the mean values and standard deviations within evaluations of the radiation characteristics of the LEDs, the water contact angle measurements, the calculation of the impedance calibrations, and the microbiological analysis of the coatings.
BacEval (version Y1.25r/D7 (19.08.2004), SY-LAB, Neupurkersdorf, Austria) is an analysis program for impedance meters that was used to evaluate the detection times and corresponding concentrations of viable bacteria.
For testing the statistical significance, the data were checked for Gaussian distribution (Kolmogorov/Smirnov test, Lilliefors test: p-value) after exclusion of outliers (ROUT, Q = 5%). If the data were normally distributed, statistical significance was tested with an unpaired, two-tailed t-test (Welch’s correlation, confidence level: 95%). If there was no normal distribution or it could not be tested, the unpaired, two-tailed Mann–Whitney test (confidence level: 95%) was used. Statistically significant differences are highlighted with *.
3. Results and Discussion
3.1. Dose Distribution and Influence of UV Wavelength on Sample Activation
The determined dose distribution on the curved sample is shown in Figure 2. The measured values are expressed in percent, and the value of the central point of the sample was set to 100%. As can be seen from Figure 2, the highest dose is applied to the uppermost point of the side walls of the curved surface and is 9–10% higher compared to the central point. The reasons for this are the smaller distance to the LEDs compared to the other measurement points and that, due to the central positioning between both LEDs, radiation from both LEDs contributes to the dose input (see Figure 1). The lowest dose is applied in a vertical direction beside the central point at a distance of 15 mm. On these points, the two LEDs do not contribute equally to the applied dose. Accordingly, a dose loss of up to 11% is measured at a vertical distance of 15 mm to the central point. For the envisioned application, the homogeneity of dose distribution on the surface seems acceptable.
It is known that both the light irradiance and the wavelength of the light have a decisive influence on the process of photocatalytic degradation [7]. It is also a known theory that short UV wavelengths increase the photocatalytic efficiency of TiO2, as it is supposed that the formation of electron–hole pairs is efficiently promoted by suppressing their recombination to a greater extent than at longer UV wavelengths [37,38]. Thus, there is a higher probability of recombination of electron–hole pairs with our experimental setup due to the chosen wavelength of 365 nm, which is longer compared to UVC radiation with wavelengths below 280 nm. It was reported by Herrmann as a hypothesis that the recombination of electron–hole pairs formed by UV radiation is negligible at low light irradiances (far below 25 mW/cm2) [39]. In our experimental setup, the UVA LEDs apply an irradiance of 8.2 ± 0.6 mW/cm2 (flat samples) and 9.8 ± 0.7 mW/cm2 (curved samples, central point). These values are far below the above-mentioned irradiance level of 25 mW/cm2 described by Herrmann [39]. Therefore, it can be assumed that the electron–hole pair recombination in our experiments will be correspondingly low. Furthermore, Venkatchalam et al. found that wavelengths of 365 nm enable better activation of TiO2 than wavelengths of 254 nm, as the longer wavelengths enable deeper penetration of absorbed contaminations on the surface [38]. In our envisioned application, water-bearing pipe systems, it can be expected that other contaminants besides bacteria are present. These could absorb the UV radiation before it reaches the surface of the TiO2 coatings. With the relatively long wavelength chosen for our setup, this impairment of UV activation is mitigated to some extent.
Assuming the most accepted theory that superhydrophilicity on TiO2 is caused by the formation of electron–hole pairs upon UV irradiation and avoiding recombination, the superhydrophilicity of the investigated coatings should not be significantly impaired by the chosen wavelength and the irradiance of the UV sources, since the recombination of electron–hole pairs should be low, as explained above.
3.2. Surface Characterization and Superhydrophilicity
The AFM, SEM, and XRD measurements used for surface characterization revealed surface morphological and structural differences between the samples coated on different substrates. This affects the activation of the different coatings and the associated superhydrophilicity.
The AFM measurements reveal that the coatings on ceramic substrates show higher roughness than on stainless steel (Table 2). In addition, the deposition of the Ti interlayer leads to an increased roughness of the final TiO2 coating. Thus, comparing all coatings, SS-TiO2 has the lowest roughness with Ra = 21.3 nm, and Al2O3-Ti-TiO2 has the highest with Ra = 67.4 nm. Accordingly, the SEM images of the different samples show comparable differences in the surface structure (Figure 4).
The layer thicknesses given in Table 2 were determined by weighing. Compared with the SEM cross sections in Figure 4, there are deviations of a maximum of 20%, which are attributed to the porosity of the coatings.
The SEM images reveal significant differences in the layer structure that depend on the substrate material and the deposition of an interlayer (Figure 4). The substrate material has the greatest impact on the layer formation, as it affects the structure of the Ti interlayer and, as a result, the structure of the final coating. The stainless steel substrate has a lower roughness, in the range of Ra = 5 nm, while the Al2O3 ceramic has a higher roughness, in the range of Ra = 120 nm, due to its grain structure (manufacturer’s data). This leads to the formation of gaps in the TiO2 layer, which are wider and deeper than those between the individual crystallites (Figure 4d). These gaps extend into the Ti interlayer on Al2O3 substrates, while the interlayer on stainless steel is uniformly dense and pore-free (Figure 4h).
The interlayer influences the grain growth of the final coating and thus affects the lateral grain size of the crystallites. On the Al2O3 substrate, this influence is less pronounced than on stainless steel, on which at least a doubling of the lateral expansion of the crystallites and thus an increase in surface roughness is observed (Figure 4 and Table 2).
TiO2 occurs in different phases with different facets of the crystallites. XRD measurements can be used to investigate the layer composition with respect to these two aspects [3,40]. The results of the XRD measurements show that TiO2 consisting of pure anatase is deposited on both substrate materials without interlayers (Figure 5a,c). The final coating on stainless steel substrates (Figure 5a) shows a very strong texture; for the coatings on ceramic substrates, this effect is less pronounced (Figure 5c). The texturing is also evident on the coating surface visualized by SEM (Figure 4). TiO2 coatings deposited on Ti interlayers (Figure 5b,d) are predominantly anatase phase but contain an amount of rutile phase that appears to be independent from the substrate material. Accordingly, the Ti interlayer has a significant effect on the texture and phase of the TiO2 coating. The texture of anatase deposited on Ti interlayers is clearly visible only on stainless steel substrates (Figure 5b), whereas no preferred orientation of anatase is observed on the ceramic substrates (Figure 5d).
It is also evident from the diagrams in Figure 5 that the faceting of the anatase crystallites is influenced by both the substrate material and the interlayer. The (101) facets occur on stainless steel only in combination with the Ti interlayer, while they are observed on ceramic substrates independently from the interlayer.
In summary, the substrate material leads to differences in the surface morphology of the final coatings, but the greater influence results from the deposition of a Ti interlayer, which additionally influences the phase of the final TiO2 coating.
The layer formation on flat or curved geometries is strongly affected by the substrate geometry. The geometry influences the angular distribution of incident particles during layer deposition as well as the associated energy distribution. A complex geometry like the one used for the curved samples can induce shadowing effects and lead to alterations in the deposited coatings. This results in an inhomogeneity of the layer thickness, roughness, and crystallite structure (Figure 4i,j and Table 2). Taking changes in interference color as a qualitative sign for inhomogeneity in coating thickness, a slight but symmetrical decrease in coating thickness from the center to the top and bottom of the curved samples was observed.
Compared to the TiO2 coating on flat samples, no gaps formed between the crystallites in the curved geometry (Figure 4k,l).
WCA measurements were performed to investigate the wetting behavior and superhydrophilicity of the TiO2 coatings after UVA activation. From the literature, it is known that major problems for the investigation of photo-induced hydrophilicity on TiO2 are the non-reproducibility of the initial state of a coating and the different methods for the pretreatment of the coatings (“sample conditioning”) as well as conditions during sample storage. All of this leads to WCA variations in the range of 20–60°. This severely compromises the determination of relevant factors influencing the hydrophilicity of the surface and a comparison with results obtained by different research groups [9]. By conditioning all our coatings in a defined procedure (see Section 2.3), we created comparability of all samples per sample type and additionally enabled the reproduction of this way of sample conditioning in other studies. This good comparability within our own study is supported by very low standard deviations in WCA measurements before UVA activation, i.e., at point “−1.5 h” (max. 4° for each sample type (Figure 6)).
In the first step, we investigated the initial WCA of our conditioned samples. With 12° (Al2O3-Ti-TiO2) and 9° (Al2O3-TiO2), the initial WCAs of the conditioned TiO2 coatings on ceramic substrate are lower than the WCA of the coatings on stainless steel substrate with 19° (SS-Ti-TiO2) and 13° (SS-TiO2) (“−1.5 h” in Figure 6). Additionally, the WCA is higher on the samples with Ti interlayer. It is well known that surface morphology has a great influence on the contact angle [10,41]. It has been shown that rough TiO2 surfaces have a lower contact angle than smooth TiO2 surfaces (roughness approx. ≤10 nm) [10,14]. In our case, this relationship can be generally confirmed: TiO2 coatings (SS-TiO2, SS-Ti-TiO2) with lower roughness show higher WCA than coatings (Al2O3-TiO2, Al2O3-Ti-TiO2) with higher roughness (Table 2 and Figure 6). However, when comparing the coatings regarding the presence of the Ti layer, the opposite trend is observed. The coatings with higher roughness (due to the interlayer) show a higher WCA. The surface roughness thus cannot be the sole cause of these observed WCAs. In addition, the chemical composition has a major influence on surface hydrophilicity. With increasing amounts of chemisorbed OH groups, the hydrophilicity increases as well [42].
After activation by UVA irradiation, all coatings show a WCA below 4° (“0 h” in Figure 6), which is below the defined threshold for superhydrophilicity. This superhydrophilicity manifests as a strongly increased spreading of aqueous fluids on the surface (Figure 7b). During 8 days of storage, the WCAs almost recovered, and after 8 days, the second activation by UVA irradiation was performed (Figure 6, “192 h”), and again, WCAs below the threshold for superhydrophilicity were observed. Thus, reproducible activation of superhydrophilicity by multiple UVA irradiation is possible for all TiO2 coatings investigated, regardless of the coating composition and the existence of an interlayer.
Furthermore, the long-term stability of the achieved superhydrophilic effect was investigated by WCA measurements (Figure 6). In the first hour after UVA activation, the WCA increases only by a few degrees for all coatings. In the following four days, the WCA of the TiO2 coating on stainless steel substrates (SS-TiO2) continues to increase slightly, up to about 10°. After exceeding this threshold for superhydrophilicity, the coating’s WCA further increases slowly, reaching a value of 12° after 7 days (“168 h”). The WCA of SS-Ti-TiO2 already reaches the threshold for superhydrophilicity after 24 h. Up to 96 h, this coating shows no further increase in WCA; afterwards, an increase up to 17° is observed (“144 h” in Figure 6).
The coatings on Al2O3 ceramic substrates also show a further increase in WCA. The samples of Al2O3-Ti-TiO2 are superhydrophilic up to 48 h after activation by UVA irradiation; after 72 h, the threshold of 10° is exceeded. For Al2O3-TiO2, the WCA reaches the threshold for superhydrophilicity 48 h after activation by UVA irradiation, but during the following two days (“72 h” and “96 h” in Figure 6), the WCA decreases again and reaches values below this threshold. After 6 days (“144 h”), the WCA increases up to 15° and stagnates in this range. No further change in WCA was observed for any coating 7 days (“168 h”) after irradiation. After the second activation by UVA irradiation, similar observations of the WCA for all coatings are made (see Figure 6). Due to the low standard deviations of the WCA measurements after the two activations, we assume that the reproducibility of the wetting behavior is also given with further reactivations of the coatings. TiO2 coatings with constant wetting behavior during cyclic reactivation have already been described in the literature [43,44]. Therefore, we assume that our coatings offer the prospects of long-term use by periodic reactivation.
It is known that the anatase phase of TiO2 has better photocatalytic efficiency compared to other pure phases, such as rutile, brookite, amorphous TiO2, and mixed anatase/rutile phases [3]. With regard to the formation of superhydrophilicity, coatings of rutile, but also anatase and mixtures of the two phases, have been increasingly investigated in the past [40,41,42,45]. Due to the fast electron–hole pair recombination of pure TiO2 coatings, these surfaces lose their hydrophilic properties immediately when UV radiation is turned off [10,46]. For example, Watanabe et al. showed that their polycrystalline anatase coatings and rutile single-crystal coatings on glass reach the superhydrophilic state, but the effect lasts only a few minutes [45]. Lv et al. observed on thin TiO2 coatings that, for the same irradiation time, the superhydrophilicity of the anatase coating could be activated by UV radiation, while the WCA of the rutile coating increased, i.e., no superhydrophilicity was observed [40]. The group of Vrakatseli et al. investigated anatase–rutile mixed coatings. Superhydrophilicity was observed for all coatings, with the most stable superhydrophilicity lasting up to 2 days on coatings with the lowest rutile fraction (2%). Both the pure rutile layer and the other mixed layers exhibited superhydrophilicity only for a few hours [41]. Yu et al. showed on thin anatase, rutile, and anatase (77%) and rutile (23%) mixed coatings that the mixed layer maintained superhydrophilicity for up to 24 h, followed by pure anatase and rutile. They explained the differences in the long-term stability of superhydrophilicity with the fact that fine roughness or porous structures and the number of hydroxyl groups on the surface favor the adsorption of water molecules and reduce the rate of conversion from the photo-induced hydrophilic to the hydrophobic state. Accordingly, the lowest hydrophobicity rate of the mixed layer is due to the synergistic effects of the chemical and geometric properties of the surface. Rutile exhibited the lowest stability because, first, the hydroxyl content on the surface was the lowest, and second, water evaporated more easily from the comparably larger pores of rutile [42].
Compared with the literature, our coatings show good properties in terms of superhydrophilicity, as even the coatings with the lowest stability showed superhydrophilicity for up to 24 h (SS-Ti-TiO2, Figure 6). Lasting up to 4 days, SS-TiO2 shows significantly better stability in terms of superhydrophilicity than the coatings discussed in the literature. It is remarkable that apparently pure anatase coatings or a very high anatase content in mixed coatings normally show the highest stability [40,41,42]. This observation also correlates with our findings, as the pure anatase coatings (coatings without Ti interlayer) show a longer stability of superhydrophilicity than the coatings with rutile fraction. Based on the statements of Yu et al., the lower stability in our investigations of superhydrophilicity can be attributed to the larger pores (higher roughness) of the coatings with rutile fraction, and the 4-day-stable superhydrophilicity can be attributed to the absence of these pores and the absence of rutile.
In addition to the phases of TiO2, the facets of the crystallites have an influence on the photoactivity of TiO2 [10,45,47]. It has been proven both theoretically and experimentally that the (101) facets of anatase surfaces are expected to be rather unreactive. Furthermore, the (001) facets are expected to have higher reactivity due to their larger size compared to the (101) facets. Because of the higher reactivity of (001) facets, an increased formation of electron–hole pairs is expected [47]. For rutile TiO2, the crystal planes (110) and (100) with bridging oxygen sites were found to have higher efficiency for hydrophilic conversion than (001) planes without bridging oxygen sites [10]. In addition, the adsorbed OH groups on surfaces without bridging oxygen are considered unstable, so they tend to desorb more easily, and the surface hydrophilicity decreases [45]. Thus, our coatings consist of rutile with higher reactivity, but unreactive anatase was also proportionally deposited in the cases of SS-Ti-TiO2, Al2O3-Ti-TiO2, and Al2O3-TiO2, as can be seen from Figure 5. The fact that anatase (101) is rather unreactive is supported by our findings. Samples of SS-TiO2 that revealed no anatase (101) have the highest reactivity and the most stable superhydrophilicity. This also applies to the reactivation of these samples (Figure 6). Therefore, the SS-TiO2 system was chosen for deposition on curved samples and application in microbiological studies (see Section 3.3 and Section 3.4).
3.3. Development of the Microbiological Test Regime for the Application-Oriented Evaluation of Bacterial Colonization in Water-Bearing Pipes
The aim of our study was to investigate whether microbial colonization in water-bearing systems (such as pipes) can be prevented by equipping the surface with superhydrophilic characteristics using TiO2 coatings. Therefore, the coating with the longest superhydrophilic activity (SS-TiO2, see Section 3.2) was chosen and deposited on curved substrates (curSS-TiO2). The microbiological test regime was adapted to the application scenario of water-bearing pipes: the samples for microbiological evaluation are TiO2-coated half pipes, as persistent water contact and microbial adhesion are more likely to take place in the lower half of pipes.
In the literature, bacterial adhesion behavior in relation to the wetting characteristics of surfaces is controversially discussed [48,49]. However, it has been demonstrated by a variety of research groups that extreme hydrophilic surfaces can prevent bacterial adhesion [14,50,51,52,53,54]. Therefore, our microbiological test regime focuses on detecting viable bacteria on the sample surface.
The complete microbiological evaluation was designed as follows: In the first step, the coated and conditioned samples were placed under the LEDs and activated by UVA irradiation (see Section 2.3, Figure 1b). The second step of our microbiological test regime simulated the bacterial contamination of the pipe, with subsequent retention of the contaminated liquid on the surface. Therefore, the samples were removed from the irradiation setup after activation, and the surface was inoculated with 1 mL of bacteria suspension of E. coli (103 CFU/mL) or S. warneri (103 CFU/mL). Although in the literature higher concentrations of 103–1010 CFU/mL have also been reported [19,55,56], we chose this concentration as we assumed, for the envisioned application, a new and clean pipe where bacterial contamination principally arises from the inflow of liquid, e.g., after hand washing (max. 102 CFU/mL) [57,58,59]. The bacteria suspension was dropped centrally onto the concave side of the sample (Figure 7c). The sample was then incubated for 45 min in the dark at room temperature and under ambient conditions. As there is no liquid flow during the incubation, this setup represents a worst-case scenario where microbial adhesion is very likely due to sedimentation and the absence of shear stresses caused by continuous liquid flow. Additionally, S. warneri tends to form biofilms and hence can be assumed as representative of biofilm formation in a pipe, where microorganism dislocation is impeded due to the good adhesion of the microorganisms to each other and to the substrate [23].
After this incubation, the sample surface was immediately rinsed with 20 mL of sterile deionized water using a sterile syringe. Afterwards, a second activation of the still-moist samples by UVA irradiation was conducted, simulating the step of reactivation of the surface. For non-activated control samples, the irradiation periods were replaced by storage in darkness. Assuming the superhydrophilic surface prevents bacterial adhesion, there should be no viable bacteria remaining on the sample surface. To confirm this assumption, in the next step of our microbiological test regime, we tested for viable bacteria on the surface.
To evaluate the number of viable bacteria on the sample surface, the samples were overlaid with 40 mL of sterile culture medium and incubated for 22 h at 17 °C and 70% humidity under ambient and sterile conditions in the dark. After incubation, the overlaid medium was investigated concerning bacterial concentration using the direct impedance measurement (see Section 2.5.2). The calibrations created for this purpose are shown in Figure 3.
The results of the study of bacterial colonization on the surface using this test regime can be found in Section 3.4.
In this regime, reactivation of the coating by a second irradiation was conducted since regular reactivation of the coating will also be necessary for the envisioned application of water-bearing pipes to enable long-term use. Based on the results of the WCA measurements (see Section 3.2, Figure 6), it is confirmed that the coatings show superhydrophilicity upon activation by UVA irradiation. The superhydrophilicity was maintained for up to 4 days. Nevertheless, we assume a daily activation would be suitable to guarantee a constantly superhydrophilic surface and avoid bacterial adhesion. Hence, we defined a daily reactivation of the coating by UVA irradiation.
3.4. Investigation of Bacterial Colonization on TiO2 Coatings
In the microbiological studies, we evaluated whether viable bacteria were present on the surface of the inoculated curved samples. The evaluation was performed using E. coli and S. warneri, with S. warneri as a representative of a biofilm former and E. coli as a common pathogen in waterborne system-related outbreaks in hospitals [18,23]. For some samples, no viable bacteria were detected. On the other samples, small amounts were detected (Figure 8 and Table 3). On the positive controls and the samples without UVA activation, both E. coli and S. warneri were detected using the impedance measurement (example impedance curves, see Figure 8). The detected bacterial concentrations of the non-activated samples were 0.939 CFU/mL (S. warneri) and 0.015 CFU/mL (E. coli) (Table 3). Thus, the bacterial contamination with the Gram-positive S. warneri is 100-fold higher than the Gram-negative E. coli., which can be attributed to the tendency of aggregation and preferred biofilm formation of Staphylococcus species [60].
The low number of viable bacteria on the sample without UVA activation (Table 3) indicates that generally only a small fraction of the inoculated bacteria colonizes the surface. From the literature, it is known that the characteristics of the material, such as the surface wettability, the properties of the bacteria, and the environmental conditions, significantly affect bacterial adhesion on the surface [12,14,49,61]. If microbiological adhesion is considered in relation to the wetting properties of a surface, very different statements can be found in the literature [12,13,14,48,50,61,62,63,64,65]. In general, superhydrophobic (WCA > 150°) and superhydrophilic (WCA < 10°) surfaces have been reported to have an adverse effect on bacterial adhesion, as bacteria are more likely to adhere to moderately wettable surfaces (WCA 40–130°) than to extremely wettable surfaces like superhydrophilic surfaces [12,14,48,63]. Studies with a wetting range of WCA between 54° and 130° showed that the adhesion of bacteria is favored with an increasing WCA because an increase in surface hydrophobicity promotes the adsorption of adhesive proteins like peptidoglycans [61,64]. For E. coli, it is known that hydrophobic surfaces are preferred for adhesion due to the hydrophobic lipopolysaccharide bacterial surface [48,50]. In contrast, Koubali et al. showed that the adhesion of the hydrophilic bacterium S. aureus is better on very hydrophilic surfaces (WCA 15–36°) than on moderately hydrophilic surfaces (WCA 46–68°) [48,62]. Based on the WCA measurements of our samples (Figure 6), an initial WCA below 20° is to be expected for all our samples. Thus, even without UVA activation, the samples show a strongly hydrophilic surface, which, based on the above-mentioned results of other research groups, explains the higher bacterial concentration of S. warneri on the samples compared to E. coli. E. coli, as a hydrophobic bacterium, preferentially binds to hydrophobic surfaces, while S. warneri seems to preferentially adhere to hydrophilic surfaces similar to S. aureus [50,62]. The adhesion of microorganisms to a surface is furthermore influenced by hydration effects, which are a result of the balance between hydrophilicity and hydrophobicity between microorganisms and the surface as well as the hydrophobic–hydrophilic properties of the surface [13,65]. The prevention of microbial adhesion on superhydrophilic TiO2 surfaces is attributed to the hydration layer formed on the TiO2 surface, as this inhibits the interaction between the bacterium and the surface [14,51,52,53,54]. This explains the result of no bacterial colonization on the UVA-activated samples in our studies.
Additionally, surface roughness has an influence on bacterial adhesion to the surface. High values of roughness (values above the lateral size of relevant bacteria) can lead to an increase in surface area, which facilitates adhesion for bacteria [12,14,49,63,65]. In addition, the surface morphology (size and spacing of features) at the scale of the bacterial cells provides protection from the shear forces of fluids and supports initial adhesion on the surface [12,63]. But as the size and shape of bacteria vary and environmental conditions are also subjected to variations, there is reportedly no consistent relationship between bacterial adhesion and surface roughness [12,14,48]. In addition, differences in surface nano-roughness can lead to fundamental changes in adhesion behavior [63]. Since the roughness of the investigated surfaces (<100 nm) is two dimensions smaller than the size of the bacteria used (≥1 µm), we assume that bacterial adhesion is impaired by these rather smooth surfaces.
However, for our study, we cannot exclude that, besides superhydrophilicity, other mechanisms influence microbial colonization of the surface. Besides surface roughness/smoothness, the effect of photocatalysis due to UVA activation and the inactivating effect of UVA irradiation itself (during the second activation step) might influence the adhesion and abundance of viable bacteria on the sample surface. For this reason, we want to address these points in the subsequent section.
In our setup, we used UVA irradiation with a wavelength of 365 nm. UVA irradiation can inactivate microorganisms by oxidative stress through the formation of reactive oxygen species, but the mechanisms are much less effective and more time-consuming than the damage mechanisms by UVB or UVC radiation, which damage the DNA directly and lead to the effective inactivation of bacteria [66,67,68]. Since no literature data for the inactivation of S. warneri with UVA radiation were found, we discuss inactivation values for the closely related bacterium S. aureus. Regarding the inactivation doses at 365 nm for S. aureus and E. coli (our second model organism), controversial statements can be found in the literature [66,67,68,69,70]. It has been reported that, for a 1 log reduction of viable bacteria in suspensions containing E. coli, doses of 55.2 [68], 13.8 [67], 62.6 [66], and 122.2 J/cm2 [70] had to be applied. For S. aureus, a required dose of 44.2 J/cm2 was found [68]. However, inactivation below 1 log at 720.0 J/cm2 has also been reported for both microorganisms [69]. Prasad et al. also found that the doses required for inactivation depended additionally on the irradiance of the UVA source. The higher the irradiance, the lower the doses required for inactivation. The reported inactivation doses were obtained with higher irradiances (17–70 mW/cm2) [66,67,68,69,70] than the irradiance in our setup (9.8 mW/cm2). Thus, we assume, based on the reported correlation between irradiance and dose, that the doses applied to our samples (17.6 J/cm2 to 19.4 J/cm2) are not sufficient for inactivation by 1 log of both bacteria strains investigated. Hence, direct inactivation by UVA radiation within our experiments has a negligible effect.
Even though photocatalysis and superhydrophilicity are two different processes, it is assumed that they occur simultaneously on the surface of TiO2 coatings upon activation with UVA radiation and the subsequent formation of electron–hole pairs [5,7,8]. The generated electron–hole pairs can either increase hydrophilicity or support photocatalysis. Therefore, it is concluded that one of these two processes is preferred, which in turn depends on the processing and composition of the coating [7]. Thus, it is possible that photocatalysis occurs during the second UVA irradiation in our microbiological regime, which contributes to the inactivation of the bacteria as well. When comparing UVA, UVB, and UVC radiation of the same irradiance, it has been reported in the literature that the efficiency of photocatalytic inactivation of bacteria on TiO2 is the highest for UVC and UVB [71]. Considering this fact and the observation that our surfaces preferably seem to have a strongly hydrophilic character (Figure 6 and Figure 7), the reduction of bacteria on TiO2 in our experiments can be attributed mainly to the prevention of adhesion due to superhydrophilicity. However, even if photocatalytic behavior might contribute in small amounts to the inactivation of bacteria, this would pose an advantageous effect for the envisioned application in water-bearing systems, as it additionally assists the cleanliness of the surface by photocatalytic decomposition of adhered particles or other sorts of dirt and organic contaminants. Possible photocatalytic effects only occur during irradiation with UV light [10,40,42]. In the time between two steps of UVA irradiation for activation, the superhydrophilicity provides the long-term sanitation of the surfaces by adhesion prevention, as it lasts more than 24 h to up to 4 days, as shown in Section 3.2 (Figure 6).
We showed with our study that the investigated TiO2 coatings on stainless steel can be activated by UVA irradiation. This leads to hydrophilization of the surface and thus prevents microbial adhesion and colonization, which are the initial steps of biofilm formation. The stability of superhydrophilicity upon surface activation by UVA irradiation and regular reactivation within 24 h allows this setup to be used for the selective sanitation of water-bearing pipes by the prevention of biofilm formation or spread in pipes. Thus, biofilm-induced problems in pipe systems, such as the spread of infections in hospitals [18,19], the corrosion of pipelines [17], or the contamination of food processing equipment [15,16] can be prevented.
4. Conclusions
Within our study, TiO2 films were deposited on various substrates, and their surface characteristics were analyzed by WCA, SEM, and XRD. Samples were conditioned for our experiments in a defined manner to guarantee reproducible initial conditions. Using WCA measurements, we demonstrated that the deposited TiO2 coatings can be activated by UVA irradiation, resulting in superhydrophilicity. Superhydrophilicity (WCA < 10°) appears regardless of the substrate material or the presence of a Ti interlayer. However, the differences in the coatings, such as roughness, microscopic morphology, and composition, affect the stability of superhydrophilicity. The longest-lasting superhydrophilicity was observed up to 4 days for TiO2 on stainless steel substrates. Reactivation of the coatings by UVA showed reproducible wetting behavior, which highlights the potential for the long-term stability of superhydrophilicity by periodic reactivation. However, this point should be confirmed by several reactivation cycles in further studies. Because of the good results of TiO2 coated on stainless steel, this coating–substrate combination was selected for further microbiological investigations on curved samples. In the microbiological studies with a specially developed regime adapted to the envisioned application in water-bearing pipes, we inoculated the activated samples with 103 CFU/mL of E. coli and S. warneri and showed that the selected TiO2 coating completely prevents microbial surface colonization for the waterborne pathogen E. coli and the biofilm former S. warneri. With these results, we were able to show that our developed setup provides a good basis for the envisioned application. To confirm the benefits for other use cases and more complex systems, further application-relevant microorganisms, such as Legionella or Pseudomonas aeruginosa, could be tested in future studies. Although our coating has shown very good superhydrophilic performance, to confirm its efficacy in different applications, it should be tested whether application-dependent parameters of water chemistry (pH, organics, salts) affect the performance of the coating.
The presented results and the long-term stability of superhydrophilicity that can be achieved by reactivation demonstrate the potential of the TiO2 coating to sanitize water-bearing pipes in terms of preventing microbial surface colonization and biofilm formation.
Author Contributions
Conceptualization, L.S., G.G. and U.K.; methodology, L.S. and G.G.; validation, G.G. and F.F.; formal analysis, L.S.; investigation, L.S. and F.F.; data curation, L.S.; writing—original draft preparation, L.S.; writing—review and editing, G.G., F.F. and U.K.; visualization, L.S.; supervision, G.G. and U.K.; project administration, G.G. and U.K. All authors have read and agreed to the published version of the manuscript.
Funding
This research was funded by the German Federal Ministry for Economic Affairs and Energy (BMWi) as AiF project “Siphon”, grant number ZF4597702BA8.
Institutional Review Board Statement
Not applicable.
Informed Consent Statement
Not applicable.
Data Availability Statement
Data are contained within the article.
Acknowledgments
The authors would like to thank Jessy Schönfelder for funding acquisition, Lara Nolting and Christina Partheymüller for their practical work on this topic, Daniel Weile for the additional project management, Olaf Zywitzki and his team at Fraunhofer FEP for providing the SEM images and performing the XRD measurements, Nic Gürtler for carrying out the AFM measurements, and Jan-Michael Albrecht from MoveoMed GmbH for the cooperation and provision of the irradiation constructions.
Conflicts of Interest
The authors declare no conflicts of interest.
References
- Frach, P.; Glöß, D.; Metzner, C.; Modes, T.; Scheffel, B.; Zywitzki, O. Deposition of photocatalytic TiO2 layers by pulse magnetron sputtering and by plasma-activated evaporation. Vacuum 2006, 80, 679–683. [Google Scholar] [CrossRef]
- Kang, X.; Liu, S.; Dai, Z.; He, Y.; Song, X.; Tan, Z. Titanium Dioxide: From Engineering to Applications. Catalysts 2019, 9, 191. [Google Scholar] [CrossRef]
- Wang, Y.-H.; Rahman, K.H.; Wu, C.-C.; Chen, K.-C. A Review on the Pathways of the Improved Structural Characteristics and Photocatalytic Performance of Titanium Dioxide (TiO2) Thin Films Fabricated by the Magnetron-Sputtering Technique. Catalysts 2020, 10, 598. [Google Scholar] [CrossRef]
- Wold, A. Photocatalytic properties of titanium dioxide (TiO2). Chem. Mater. 1993, 5, 280–283. [Google Scholar] [CrossRef]
- Permpoon, S.; Fallet, M.; Berthomé, G.; Baroux, B.; Joud, J.C.; Langlet, M. Photo-Induced Hydrophilicity of TiO2 Films Deposited on Stainless Steel via Sol-Gel Technique. J. Sol.-Gel. Sci. Technol. 2005, 35, 127–136. [Google Scholar] [CrossRef]
- Kawai, T.; Sakata, T. Conversion of carbohydrate into hydrogen fuel by a photocatalytic process. Nature 1980, 286, 474–476. [Google Scholar] [CrossRef]
- Armaković, S.J.; Savanović, M.M.; Armaković, S. Titanium Dioxide as the Most Used Photocatalyst for Water Purification: An Overview. Catalysts 2023, 13, 26. [Google Scholar] [CrossRef]
- Fujishima, A.; Rao, T.N.; Tryk, D.A. Titanium dioxide photocatalysis. J. Photochem. Photobiol. C Photochem. Rev. 2000, 1, 1–21. [Google Scholar] [CrossRef]
- Rudakova, A.V.; Emeline, A.V. Photoinduced Hydrophilicity of Surfaces of Thin Films. Colloid J. 2021, 83, 20–48. [Google Scholar] [CrossRef]
- Banerjee, S.; Dionysiou, D.D.; Pillai, S.C. Self-cleaning applications of TiO2 by photo-induced hydrophilicity and photocatalysis. Appl. Catal. B Environ. 2015, 176–177, 396–428. [Google Scholar] [CrossRef]
- Nasirian, M.; Lin, Y.P.; Bustillo-Lecompte, C.F.; Mehrvar, M. Enhancement of photocatalytic activity of titanium dioxide using non-metal doping methods under visible light: A review. Int. J. Environ. Sci. Technol. 2018, 15, 2009–2032. [Google Scholar] [CrossRef]
- Achinas, S.; Charalampogiannis, N.; Euverink, G.J.W. A Brief Recap of Microbial Adhesion and Biofilms. Appl. Sci. 2019, 9, 2801. [Google Scholar] [CrossRef]
- Garrett, T.R.; Bhakoo, M.; Zhang, Z. Bacterial adhesion and biofilms on surfaces. Prog. Nat. Sci. 2008, 18, 1049–1056. [Google Scholar] [CrossRef]
- Yang, K.; Shi, J.; Wang, L.; Chen, Y.; Liang, C.; Yang, L.; Wang, L.-N. Bacterial anti-adhesion surface design: Surface patterning, roughness and wettability: A review. J. Mater. Sci. Technol. 2022, 99, 82–100. [Google Scholar] [CrossRef]
- Brooks, J.D.; Flint, S.H. Biofilms in the food industry: Problems and potential solutions. Int. J. Food Sci. Technol. 2008, 43, 2163–2176. [Google Scholar] [CrossRef]
- Satpathy, S.; Sen, S.K.; Pattanaik, S.; Raut, S. Review on bacterial biofilm: An universal cause of contamination. Biocatal. Agric. Biotechnol. 2016, 7, 56–66. [Google Scholar] [CrossRef]
- Liu, T.; Cheng, Y.F.; Sharma, M.; Voordouw, G. Effect of fluid flow on biofilm formation and microbiologically influenced corrosion of pipelines in oilfield produced water. J. Pet. Sci. Eng. 2017, 156, 451–459. [Google Scholar] [CrossRef]
- Parkes, L.O.; Hota, S.S. Sink-Related Outbreaks and Mitigation Strategies in Healthcare Facilities. Curr. Infect. Dis. Rep. 2018, 20, 42. [Google Scholar] [CrossRef] [PubMed]
- Geyter, D.D.; Blommaert, L.; Verbraeken, N.; Sevenois, M.; Huyghens, L.; Martini, H.; Covens, L.; Piérard, D.; Wybo, I. The sink as a potential source of transmission of carbapenemase-producing Enterobacteriaceae in the intensive care unit. Antimicrob. Resist. Infect. Control 2017, 6, 24. [Google Scholar] [CrossRef] [PubMed]
- Kishen, A.; Haapasalo, M. Biofilm models and methods of biofilm assessment. Endod Top. 2010, 22, 58–78. [Google Scholar] [CrossRef]
- Kramer, A.; Schwebke, I.; Kampf, G. How long do nosocomial pathogens persist on inanimate surfaces—A systematic review. BMC Infect. Dis. 2006, 6, 130. [Google Scholar] [CrossRef] [PubMed]
- Hofmaenner, D.A.; Wendel Garcia, P.D.; Duvnjak, B.; Chakrakodi, B.; Maier, J.D.; Huber, M.; Huder, J.; Wolfensberger, A.; Schreiber, P.W.; Schuepbach, R.A.; et al. Bacterial but no SARS-CoV-2 contamination after terminal disinfection of tertiary care intensive care units treating COVID-19 patients. Antimicrob. Resist. Infect. Control 2021, 10, 11. [Google Scholar] [CrossRef] [PubMed]
- Szczuka, E.; Krzymińska, S.; Kaznowski, A. Clonality, virulence and the occurrence of genes encoding antibiotic resistance among Staphylococcus warneri isolates from bloodstream infections. J. Med. Microbiol. 2016, 65, 828–836. [Google Scholar] [CrossRef] [PubMed]
- Assefa, M.; Amare, A. Biofilm-Associated Multi-Drug Resistance in Hospital-Acquired Infections: A Review. Infect. Drug Resist. 2022, 15, 5061–5068. [Google Scholar] [CrossRef] [PubMed]
- DIN EN 12056-2; Gravity Drainage Systems Inside Buildings—Part 2: Sanitary Pipework, Layout and Calculation. Deutsches Institut für Normung: Berlin, Germany, 2001.
- Schiller, S.; Goedicke, K.; Reschke, J.; Kirchhoff, V.; Schneider, S.; Milde, F. Pulsed magnetron sputter technology. Surf. Coat. Technol. 1993, 61, 331–337. [Google Scholar] [CrossRef]
- Fietzke, F.; Zywitzki, O. Structure and properties of magnetron-sputtered manganese ferrite films. Thin Solid Film. 2017, 644, 138–145. [Google Scholar] [CrossRef]
- Anderson, O.; Ottermann, C.R.; Kuschnereit, R.; Hess, P.; Bange, K. Density and Young’s modulus of thin TiO2 films. Fresenius’ J. Anal. Chem. 1997, 358, 315–318. [Google Scholar] [CrossRef]
- ISO 4287; Geometrical Product Specifications (GPS)—Surface Texture: Profile Method—Terms, Definitions and Surface Texture Parameters. ISO Publishing: Geneve, Switzerland, 2010.
- Swanson, H.E.; McMurdie, H.F.; Morris, M.C.; Evans, E.H. Standard X-ray Diffraction Powder Patterns: Monograph 25, Section 7; U.S. Department of Commerce National Bureau of Standards: Washington, DC, USA, 1969; pp. 82–83.
- Silley, P.; Forsythe, S. Impedance microbiology—A rapid change for microbiologists. J. Appl. Bacteriol. 1996, 80, 233–243. [Google Scholar] [CrossRef]
- Futschik, K.; Pfutzner, H. Electrode and media impedance for detection and characterization of microorganisms. In Proceedings of the IEEE Engineering in Medicine and Biology Society and 14th Conference of the Biomedical Engineering Society of India, New Delhi, India, 15–18 February 1995; IEEE: Piscataway, NJ, USA, 1995; pp. 1/75–1/76, ISBN 0-7803-2711-X. [Google Scholar]
- Yang, L.; Bashir, R. Electrical/electrochemical impedance for rapid detection of foodborne pathogenic bacteria. Biotechnol. Adv. 2008, 26, 135–150. [Google Scholar] [CrossRef] [PubMed]
- Schopf, S.; Gotzmann, G.; Dietze, M.; Gerschke, S.; Kenner, L.; König, U. Investigations Into the Suitability of Bacterial Suspensions as Biological Indicators for Low-Energy Electron Irradiation. Front. Immunol. 2022, 13, 814767. [Google Scholar] [CrossRef] [PubMed]
- DIN 10115; Fundamentals for Detection and Determination of Microorganisms in Foodstuffs with Impedance-Method. Deutsches Institut für Normung: Berlin, Germany, 2020.
- DIN 10122; Analysis of Foodstuffs—Enumeration of Microorganisms by Means of Impedance-Method—Determination of Aerobic Mesophile Bacterial Count. Deutsches Institut für Normung: Berlin, Germany, 2018.
- Nguyen, V.-H.; Lin, S.D.; Wu, J.C.-S.; Bai, H. Artificial sunlight and ultraviolet light induced photo-epoxidation of propylene over V-Ti/MCM-41 photocatalyst. Beilstein J. Nanotechnol. 2014, 5, 566–576. [Google Scholar] [CrossRef]
- Venkatachalam, N.; Palanichamy, M.; Murugesan, V. Sol–gel preparation and characterization of alkaline earth metal doped nano TiO2: Efficient photocatalytic degradation of 4-chlorophenol. J. Mol. Catal. A Chem. 2007, 273, 177–185. [Google Scholar] [CrossRef]
- Herrmann, J.-M. Heterogeneous photocatalysis: Fundamentals and applications to the removal of various types of aqueous pollutants. Catal. Today 1999, 53, 115–129. [Google Scholar] [CrossRef]
- Lv, L.; Li, K.; Xie, Y.; Cao, Y.; Zheng, X. Enhanced osteogenic activity of anatase TiO2 film: Surface hydroxyl groups induce conformational changes in fibronectin. Mater. Sci. Eng. C Mater. Biol. Appl. 2017, 78, 96–104. [Google Scholar] [CrossRef]
- Vrakatseli, V.; Farsari, E.; Mataras, D. Wetting Properties of Transparent Anatase/Rutile Mixed Phase Glancing Angle Magnetron Sputtered Nano-TiO2 Films. Micromachines 2020, 11, 616. [Google Scholar] [CrossRef] [PubMed]
- Yu, J.; Yu, J.C.; Ho, W.; Jiang, Z. Effects of calcination temperature on the photocatalytic activity and photo-induced super-hydrophilicity of mesoporous TiO2 thin films. N. J. Chem. 2002, 26, 607–613. [Google Scholar] [CrossRef]
- Kang, H.; Lai, H.; Cheng, Z.; Liu, Y.; Jiang, L. Restoration of superwetting switching on TiO2 coated shape memory polymer arrays. Chem. Eng. J. 2020, 394, 124996. [Google Scholar] [CrossRef]
- Xu, Q.F.; Liu, Y.; Lin, F.-J.; Mondal, B.; Lyons, A.M. Superhydrophobic TiO2-polymer nanocomposite surface with UV-induced reversible wettability and self-cleaning properties. ACS Appl. Mater. Interfaces 2013, 5, 8915–8924. [Google Scholar] [CrossRef] [PubMed]
- Watanabe, T.; Nakajima, A.; Wang, R.; Minabe, M.; Koizumi, S.; Fujishima, A.; Hashimoto, K. Photocatalytic activity and photoinduced hydrophilicity of titanium dioxide coated glass. Thin Solid Film. 1999, 351, 260–263. [Google Scholar] [CrossRef]
- Gan, W.Y.; Lam, S.W.; Chiang, K.; Amal, R.; Zhao, H.; Brungs, M.P. Novel TiO2 thin film with non-UV activated superwetting and antifogging behaviours. J. Mater. Chem. 2007, 17, 952. [Google Scholar] [CrossRef]
- Selloni, A. Crystal growth: Anatase shows its reactive side. Nat. Mater. 2008, 7, 613–615. [Google Scholar] [CrossRef] [PubMed]
- Hemmatian, T.; Lee, H.; Kim, J. Bacteria Adhesion of Textiles Influenced by Wettability and Pore Characteristics of Fibrous Substrates. Polymers 2021, 13, 223. [Google Scholar] [CrossRef] [PubMed]
- Shao, H.; Ma, M.; Wang, Q.; Yan, T.; Zhao, B.; Guo, S.; Tong, S. Advances in the superhydrophilicity-modified titanium surfaces with antibacterial and pro-osteogenesis properties: A review. Front. Bioeng. Biotechnol. 2022, 10, 1000401. [Google Scholar] [CrossRef] [PubMed]
- Yuan, Y.; Hays, M.P.; Hardwidge, P.R.; Kim, J. Surface characteristics influencing bacterial adhesion to polymeric substrates. RSC Adv. 2017, 7, 14254–14261. [Google Scholar] [CrossRef]
- Madeira, M.D.P.; Gusmão, S.B.; Lima, I.S.D.; Lemos, G.M.; Barreto, H.M.; Abi-chacra, É.D.A.; Vega, M.L.; Hidalgo, A.A.; Santos, F.E.; Silva-Filho, E.C.; et al. Depositation of sodium titanate nanotubes: Superhydrophilic surface and antibacterial approach. J. Mater. Res. Technol. 2022, 19, 2104–2114. [Google Scholar] [CrossRef]
- Park, S.; Park, J.; Heo, J.; Lee, S.-E.; Shin, J.-W.; Chang, M.; Hong, J. Polysaccharide-based superhydrophilic coatings with antibacterial and anti-inflammatory agent-delivering capabilities for ophthalmic applications. J. Ind. Eng. Chem. 2018, 68, 229–237. [Google Scholar] [CrossRef]
- Hwangbo, S.; Jeong, H.; Heo, J.; Lin, X.; Kim, Y.; Chang, M.; Hong, J. Antibacterial nanofilm coatings based on organosilicate and nanoparticles. React. Funct. Polym. 2016, 102, 27–32. [Google Scholar] [CrossRef]
- Mahanta, U.; Khandelwal, M.; Deshpande, A.S. Antimicrobial surfaces: A review of synthetic approaches, applicability and outlook. J. Mater. Sci. 2021, 56, 17915–17941. [Google Scholar] [CrossRef] [PubMed]
- Cyprowski, M.; Stobnicka-Kupiec, A.; Ławniczek-Wałczyk, A.; Bakal-Kijek, A.; Gołofit-Szymczak, M.; Górny, R.L. Anaerobic bacteria in wastewater treatment plant. Int. Arch. Occup. Environ. Health 2018, 91, 571–579. [Google Scholar] [CrossRef] [PubMed]
- Kjølen, H.; Andersen, B.M. Handwashing and disinfection of heavily contaminated hands—Effective or ineffective? J. Hosp. Infect. 1992, 21, 61–71. [Google Scholar] [CrossRef] [PubMed]
- Kampf, G.; Löffler, H.; Gastmeier, P. Hand hygiene for the prevention of nosocomial infections. Dtsch. Arztebl. Int. 2009, 106, 649–655. [Google Scholar] [CrossRef] [PubMed]
- Oughton, M.T.; Loo, V.G.; Dendukuri, N.; Fenn, S.; Libman, M.D. Hand hygiene with soap and water is superior to alcohol rub and antiseptic wipes for removal of Clostridium difficile. Infect. Control Hosp. Epidemiol. 2009, 30, 939–944. [Google Scholar] [CrossRef] [PubMed]
- Eggers, M.; Terletskaia-Ladwig, E.; Enders, M. How effective is hand washing against influenza virus? Hyg. Med. 2009, 34, 492–498. (In German) [Google Scholar]
- Crosby, H.A.; Kwiecinski, J.; Horswill, A.R. Staphylococcus aureus Aggregation and Coagulation Mechanisms, and Their Function in Host-Pathogen Interactions. Adv. Appl. Microbiol. 2016, 96, 1–41. [Google Scholar]
- Wen, L.; Tian, Y.; Jiang, L. Bioinspired super-wettability from fundamental research to practical applications. Angew. Chem. Int. Ed Engl. 2015, 54, 3387–3399. [Google Scholar] [CrossRef]
- Koubali, H.; EL Louali, M.; Zahir, H.; Soufiani, S.; Mabrouki, M.; Latrache, H. Physicochemical characterization of glass and polyethylene surfaces treated with different surfactants and their effects on bacterial adhesion. Int. J. Adhes. Adhes. 2021, 104, 102754. [Google Scholar] [CrossRef]
- Sterzenbach, T.; Helbig, R.; Hannig, C.; Hannig, M. Bioadhesion in the oral cavity and approaches for biofilm management by surface modifications. Clin. Oral Investig. 2020, 24, 4237–4260. [Google Scholar] [CrossRef] [PubMed]
- Dou, X.-Q.; Zhang, D.; Feng, C.; Jiang, L. Bioinspired Hierarchical Surface Structures with Tunable Wettability for Regulating Bacteria Adhesion. ACS Nano 2015, 9, 10664–10672. [Google Scholar] [CrossRef]
- Samonin, V.V.; Elikova, E.E. A study of the adsorption of bacterial cells on porous materials. Microbiology 2004, 73, 696–701. [Google Scholar] [CrossRef]
- Prasad, A.; Gänzle, M.; Roopesh, M.S. Inactivation of Escherichia Coli and Salmonella Using 365 and 395 nm High Intensity Pulsed Light Emitting Diodes. Foods 2019, 8, 679. [Google Scholar] [CrossRef]
- Mori, M.; Hamamoto, A.; Takahashi, A.; Nakano, M.; Wakikawa, N.; Tachibana, S.; Ikehara, T.; Nakaya, Y.; Akutagawa, M.; Kinouchi, Y. Development of a new water sterilization device with a 365 nm UV-LED. Med. Biol. Eng. Comput. 2007, 45, 1237–1241. [Google Scholar] [CrossRef] [PubMed]
- Hamamoto, A.; Mori, M.; Takahashi, A.; Nakano, M.; Wakikawa, N.; Akutagawa, M.; Ikehara, T.; Nakaya, Y.; Kinouchi, Y. New water disinfection system using UVA light-emitting diodes. J. Appl. Microbiol. 2007, 103, 2291–2298. [Google Scholar] [CrossRef] [PubMed]
- Amariei, G.; Valenzuela, L.; Iglesias-Juez, A.; Rosal, R.; Visa, M. ZnO-functionalized fly-ash based zeolite for ciprofloxacin antibiotic degradation and pathogen inactivation. J. Environ. Chem. Eng. 2022, 10, 107603. [Google Scholar] [CrossRef]
- Tyrrell, R.M.; Peak, M.J. Interactions between uv radiation of different energies in the inactivation of bacteria. J. Bacteriol. 1978, 136, 437–440. [Google Scholar] [CrossRef] [PubMed]
- Benabbou, A.K.; Derriche, Z.; Felix, C.; Lejeune, P.; Guillard, C. Photocatalytic inactivation of Escherischia coli. Appl. Catal. B Environ. 2007, 76, 257–263. [Google Scholar] [CrossRef]
Figure 1.
UV LED irradiation setup for sample activation on (a) flat and (b) curved samples.
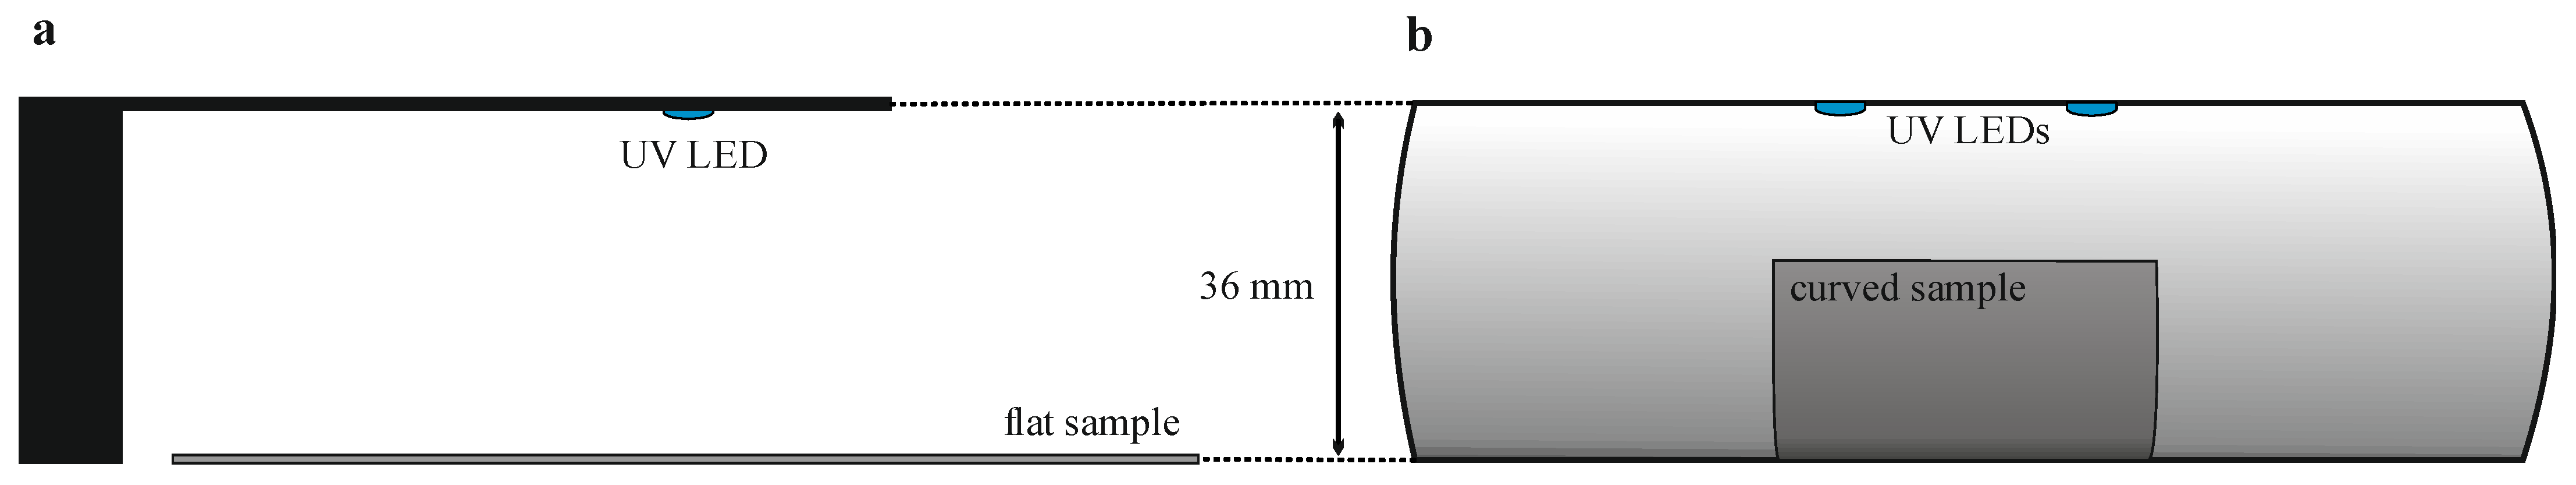
Figure 2.
Relative dose distribution of the 365 nm LEDs on curved samples (left) and schematical drawing of the setup (right). The measured values were normalized to the dose measured at the central point (100%).
Figure 2.
Relative dose distribution of the 365 nm LEDs on curved samples (left) and schematical drawing of the setup (right). The measured values were normalized to the dose measured at the central point (100%).

Figure 3.
Calibrations of the direct impedance methodology for (a) Escherichia coli (E. coli) and (b) Staphylococcus warneri (S. warneri). The blue diamonds represent individual measuring points on the basis of which the calibration (black line) was created.
Figure 3.
Calibrations of the direct impedance methodology for (a) Escherichia coli (E. coli) and (b) Staphylococcus warneri (S. warneri). The blue diamonds represent individual measuring points on the basis of which the calibration (black line) was created.
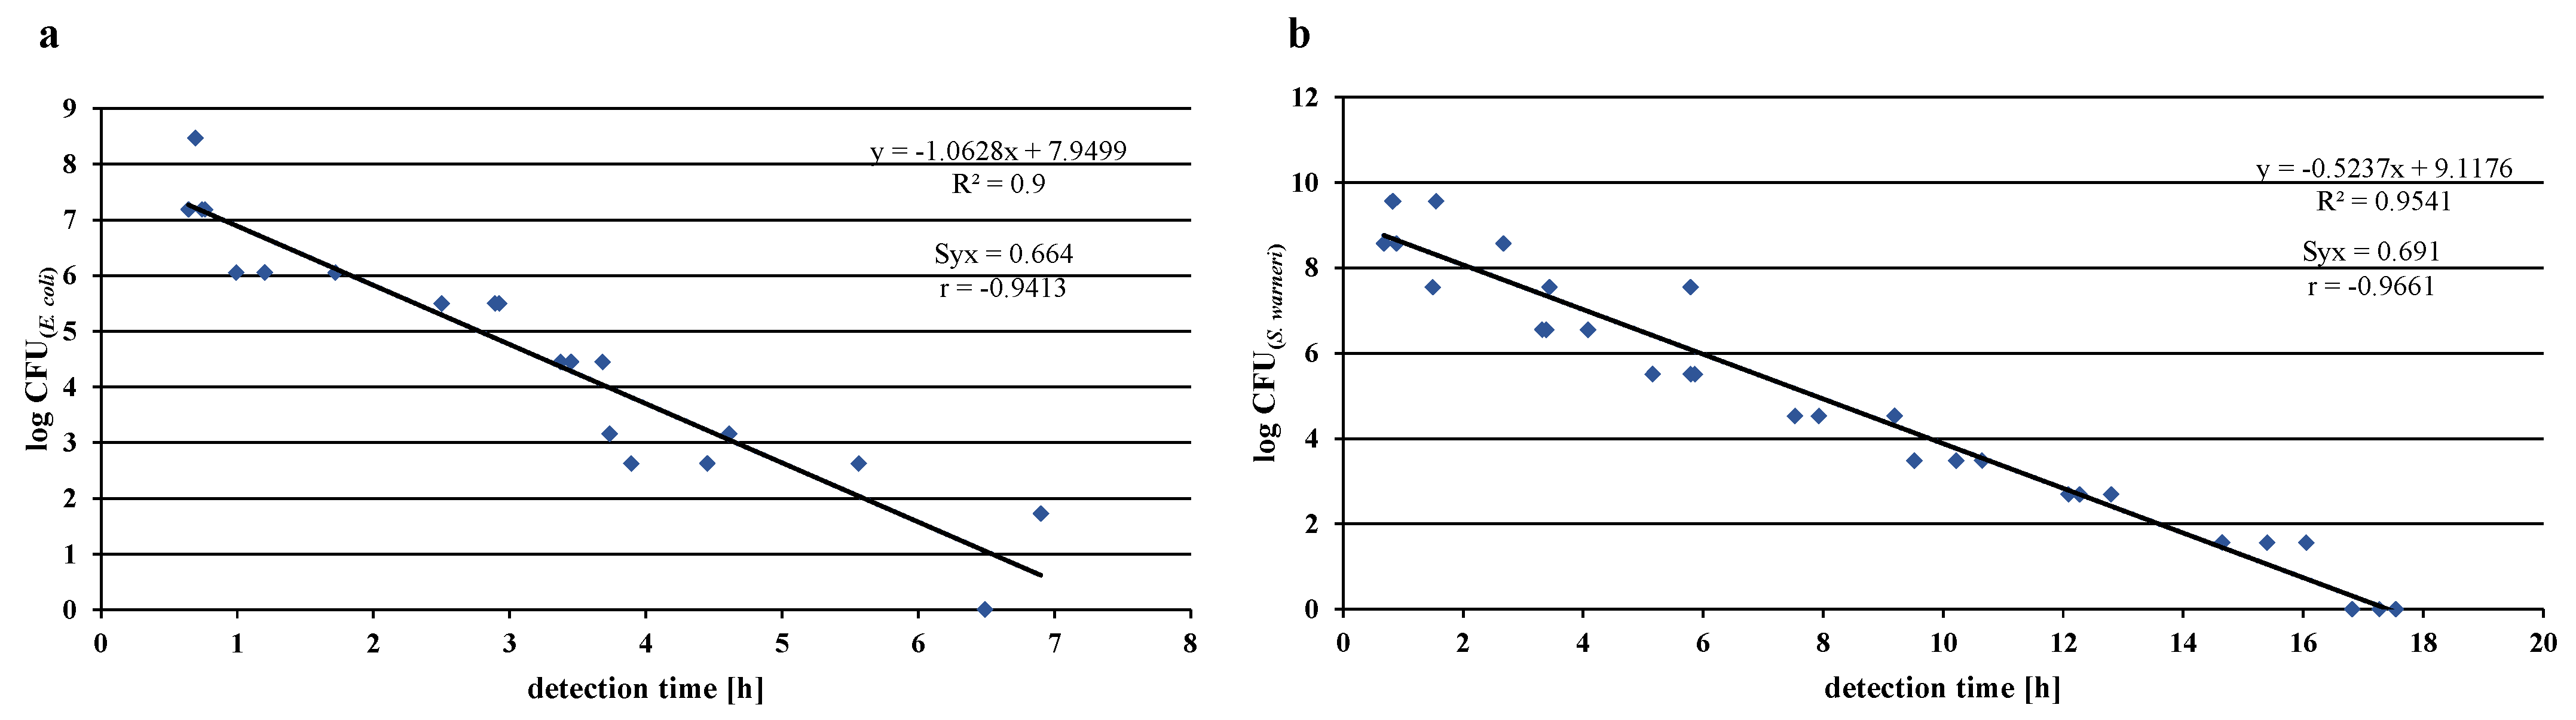
Figure 4.
Scanning electron microscope (SEM) images of TiO2 coating on (a,b) aluminum oxide ceramic substrate (Al2O3); (c,d) Al2O3 substrate with Ti interlayer; (e,f,l) stainless steel substrate; (g,h) stainless steel substrate with Ti interlayer; (i–k) curved stainless steel substrates. (k,l) Higher magnifications of the coatings on the geometrically different stainless steel substrates (flat and curved) for better comparison of the influence of substrate geometry (flat (l) or curved (k)) on coating formation. The red arrows in (d) mark gaps in the coating.

Figure 5.
X-ray diffraction (XRD) determined composition of TiO2 coatings on (a) stainless steel substrate, (b) stainless steel substrate with Ti interlayer, (c) Al2O3 substrate, (d) Al2O3 substrate with Ti interlayer.
Figure 5.
X-ray diffraction (XRD) determined composition of TiO2 coatings on (a) stainless steel substrate, (b) stainless steel substrate with Ti interlayer, (c) Al2O3 substrate, (d) Al2O3 substrate with Ti interlayer.

Figure 6.
Water contact angle (WCA) before and after activation by UVA irradiation of the samples. Activation was performed a second time after 8 days (192 h). Samples: TiO2 on stainless steel substrate (SS-TiO2, triangle, blue) and with Ti interlayer (SS-Ti-TiO2, circle, red), TiO2 on Al2O3 ceramic substrate (Al2O3-TiO2, diamond, green) and with Ti interlayer (Al2O3-Ti-TiO2, square, yellow). Significant differences are marked with an * and assigned to the color of the respective sample.
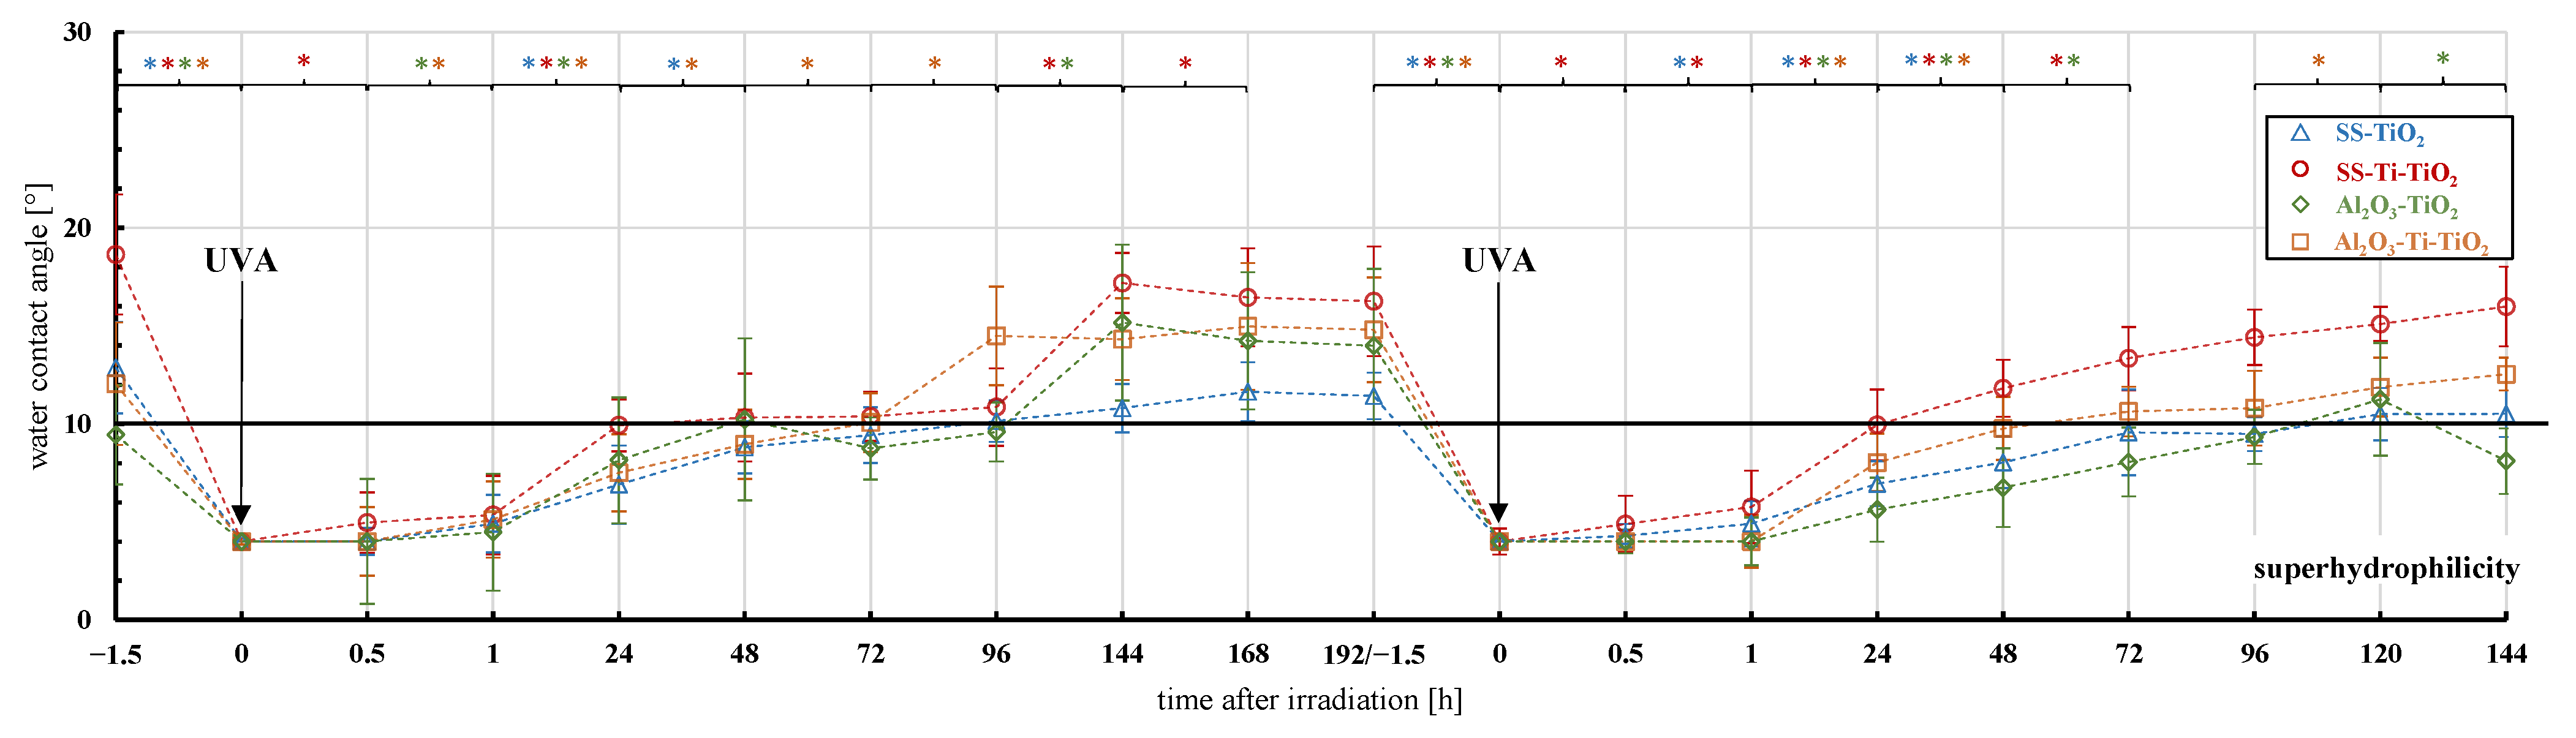
Figure 7.
Spreading behavior of water on the TiO2 coating on stainless steel before (left) and after (right) activation: (a) WCA measurement with 0.3 µL H2O; 1 mL H2O (b) on flat samples and (c) curved geometries.
Figure 7.
Spreading behavior of water on the TiO2 coating on stainless steel before (left) and after (right) activation: (a) WCA measurement with 0.3 µL H2O; 1 mL H2O (b) on flat samples and (c) curved geometries.
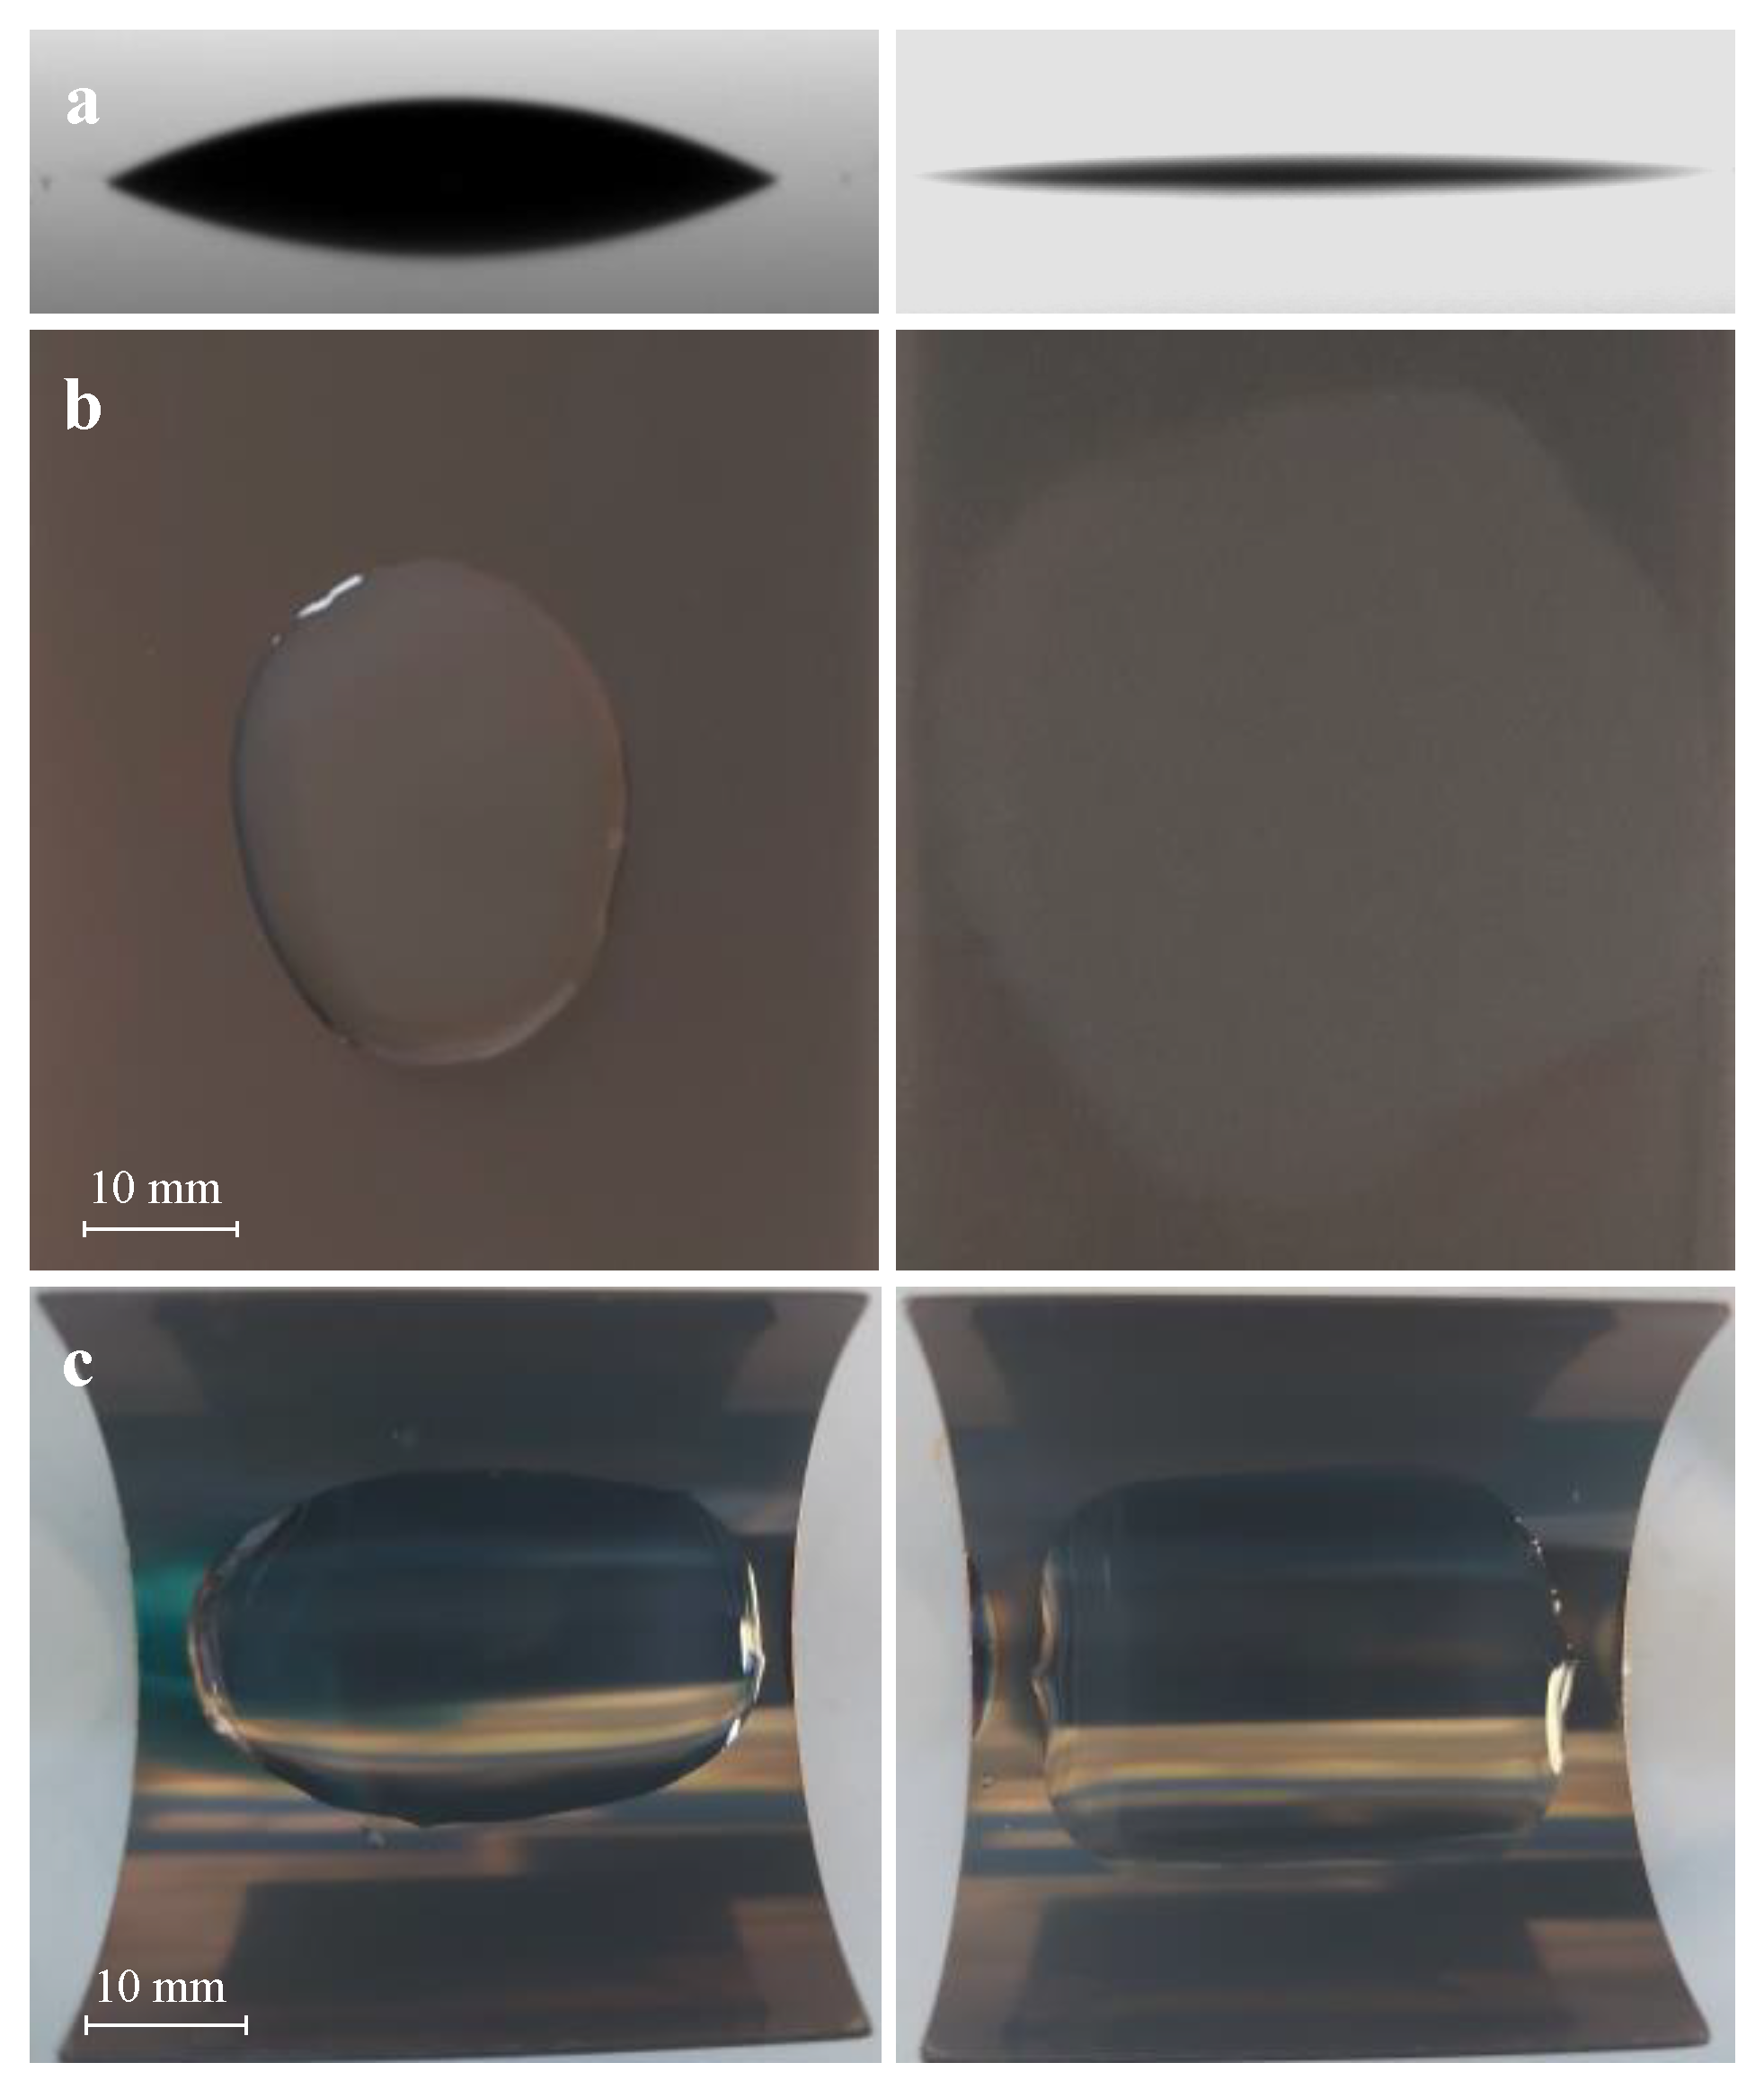
Figure 8.
Representatives of impedance curves of incubated liquids recorded by direct impedance measurement on E. coli: 103 concentrated bacterial culture (orange), sterile culture medium (red), curSS-TiO2 + bacteria (blue), UVA-activated curSS-TiO2 + bacteria (green). The black line represents the detection threshold (E% = 10).


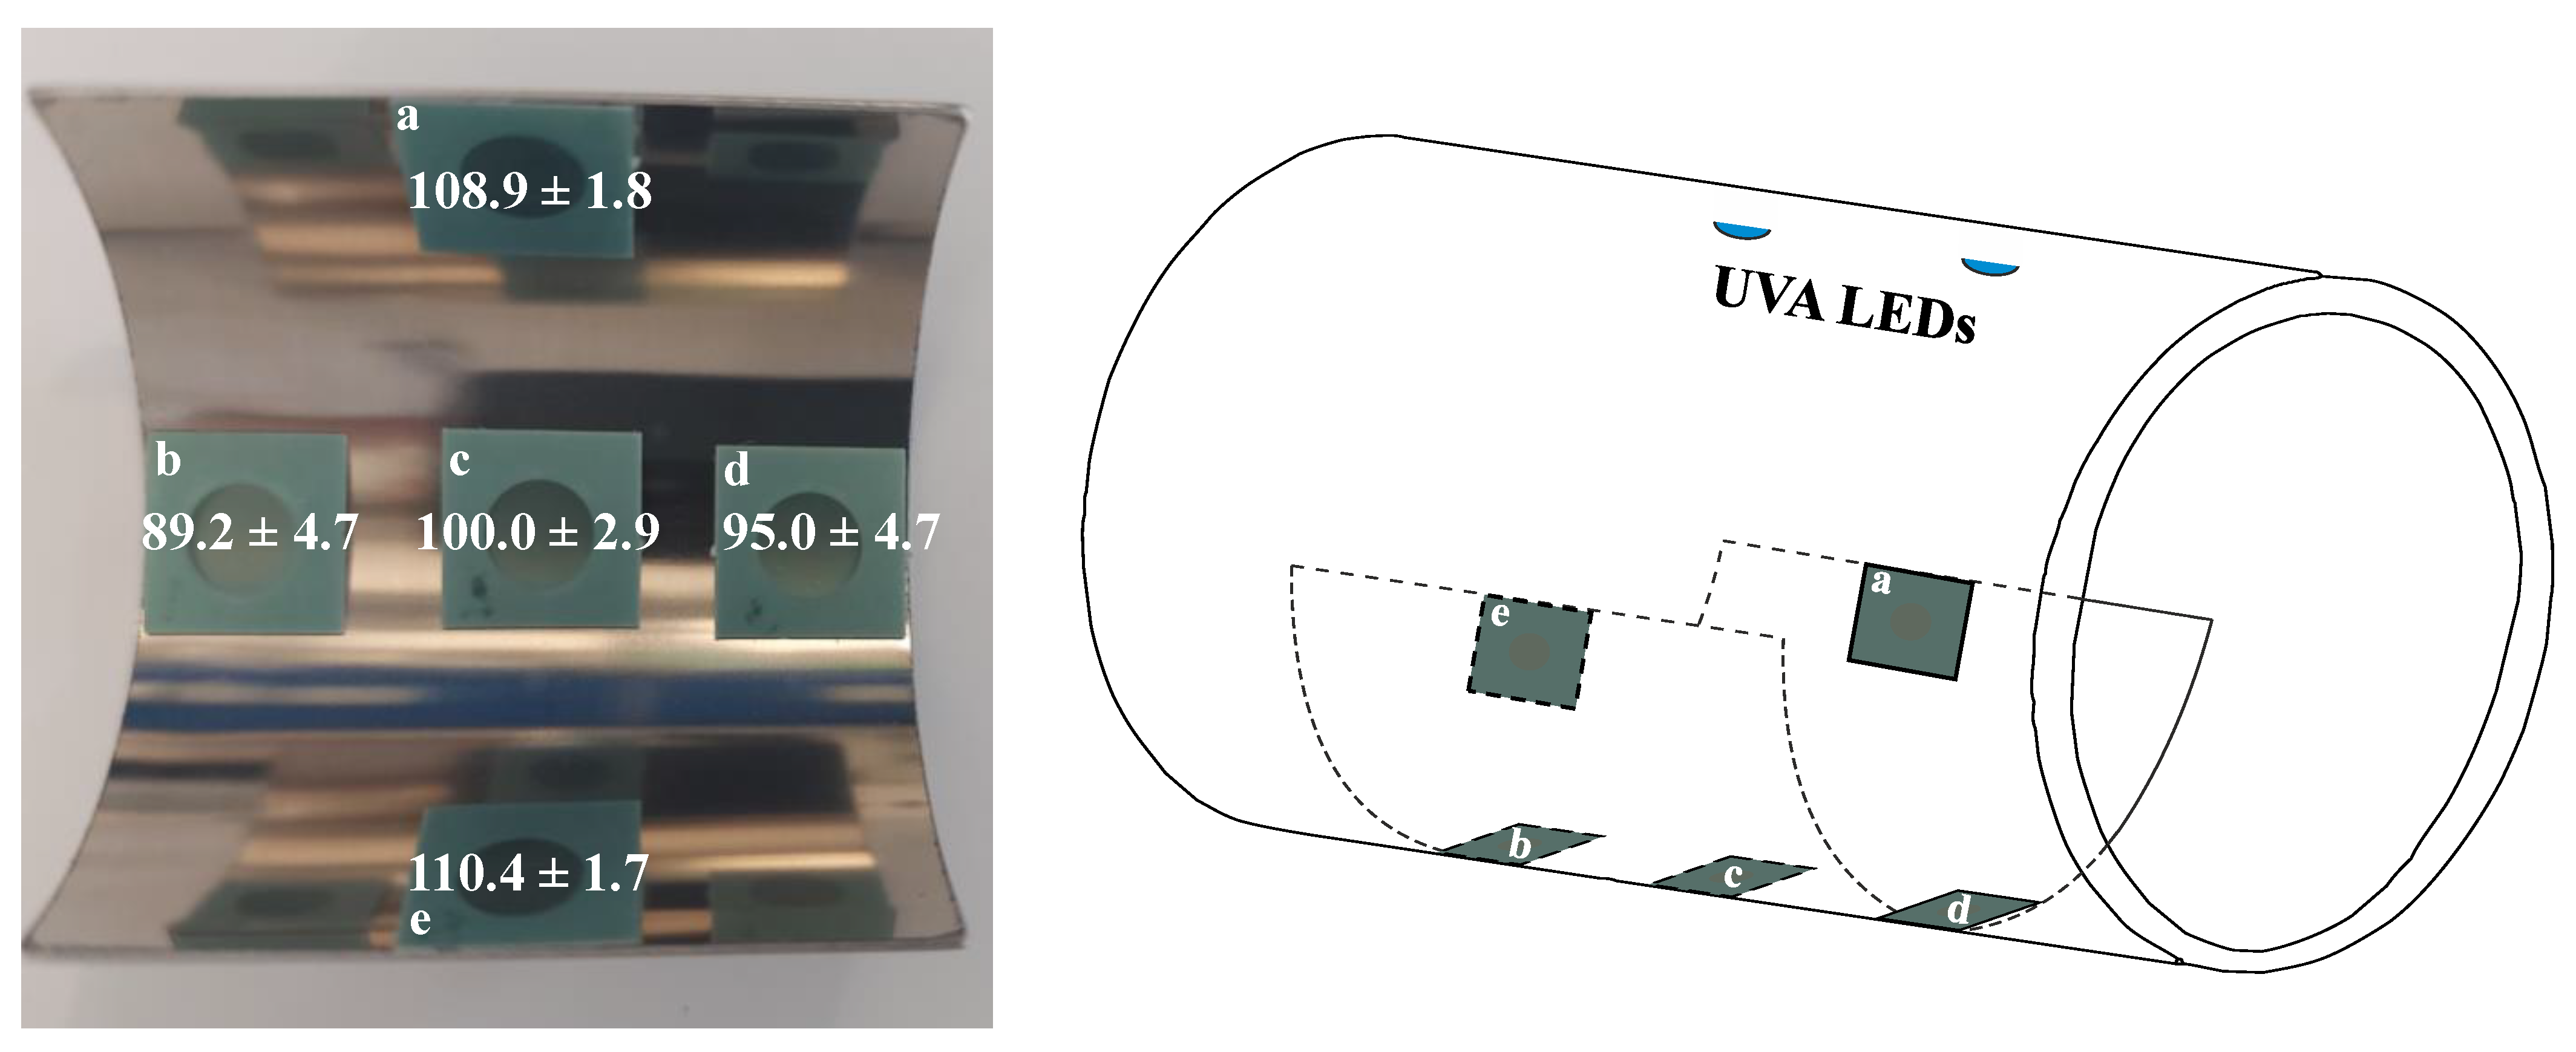
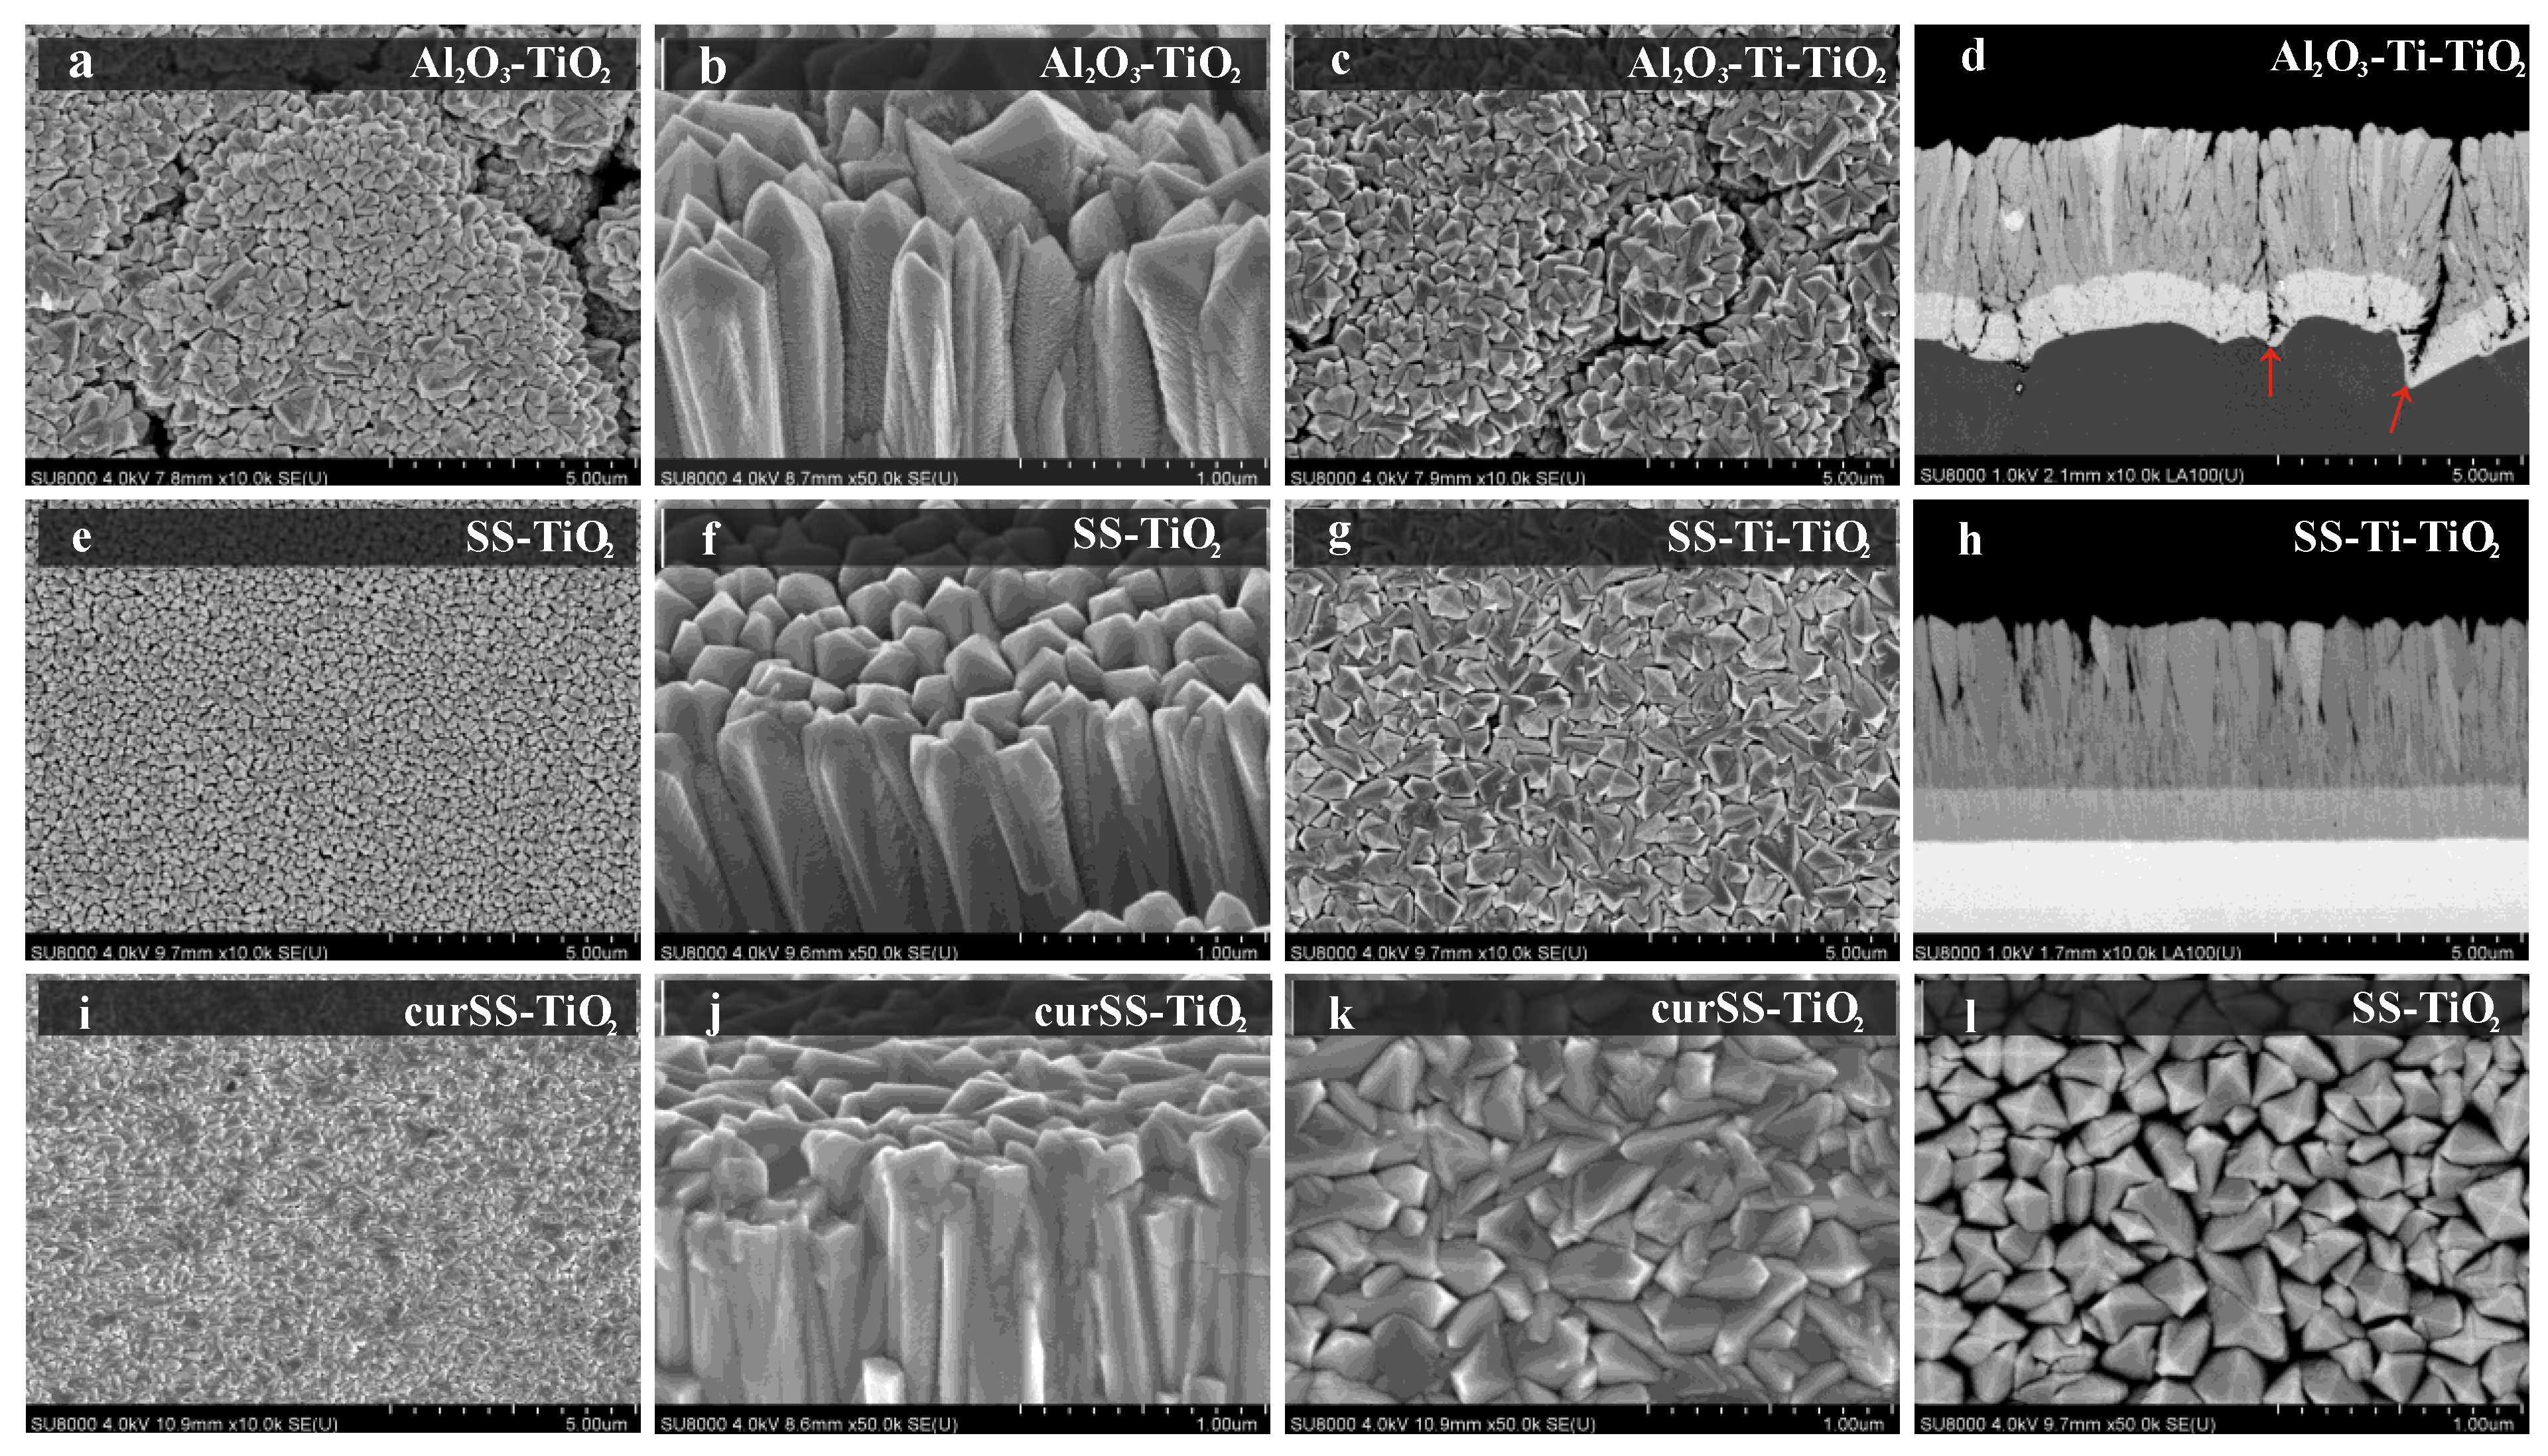
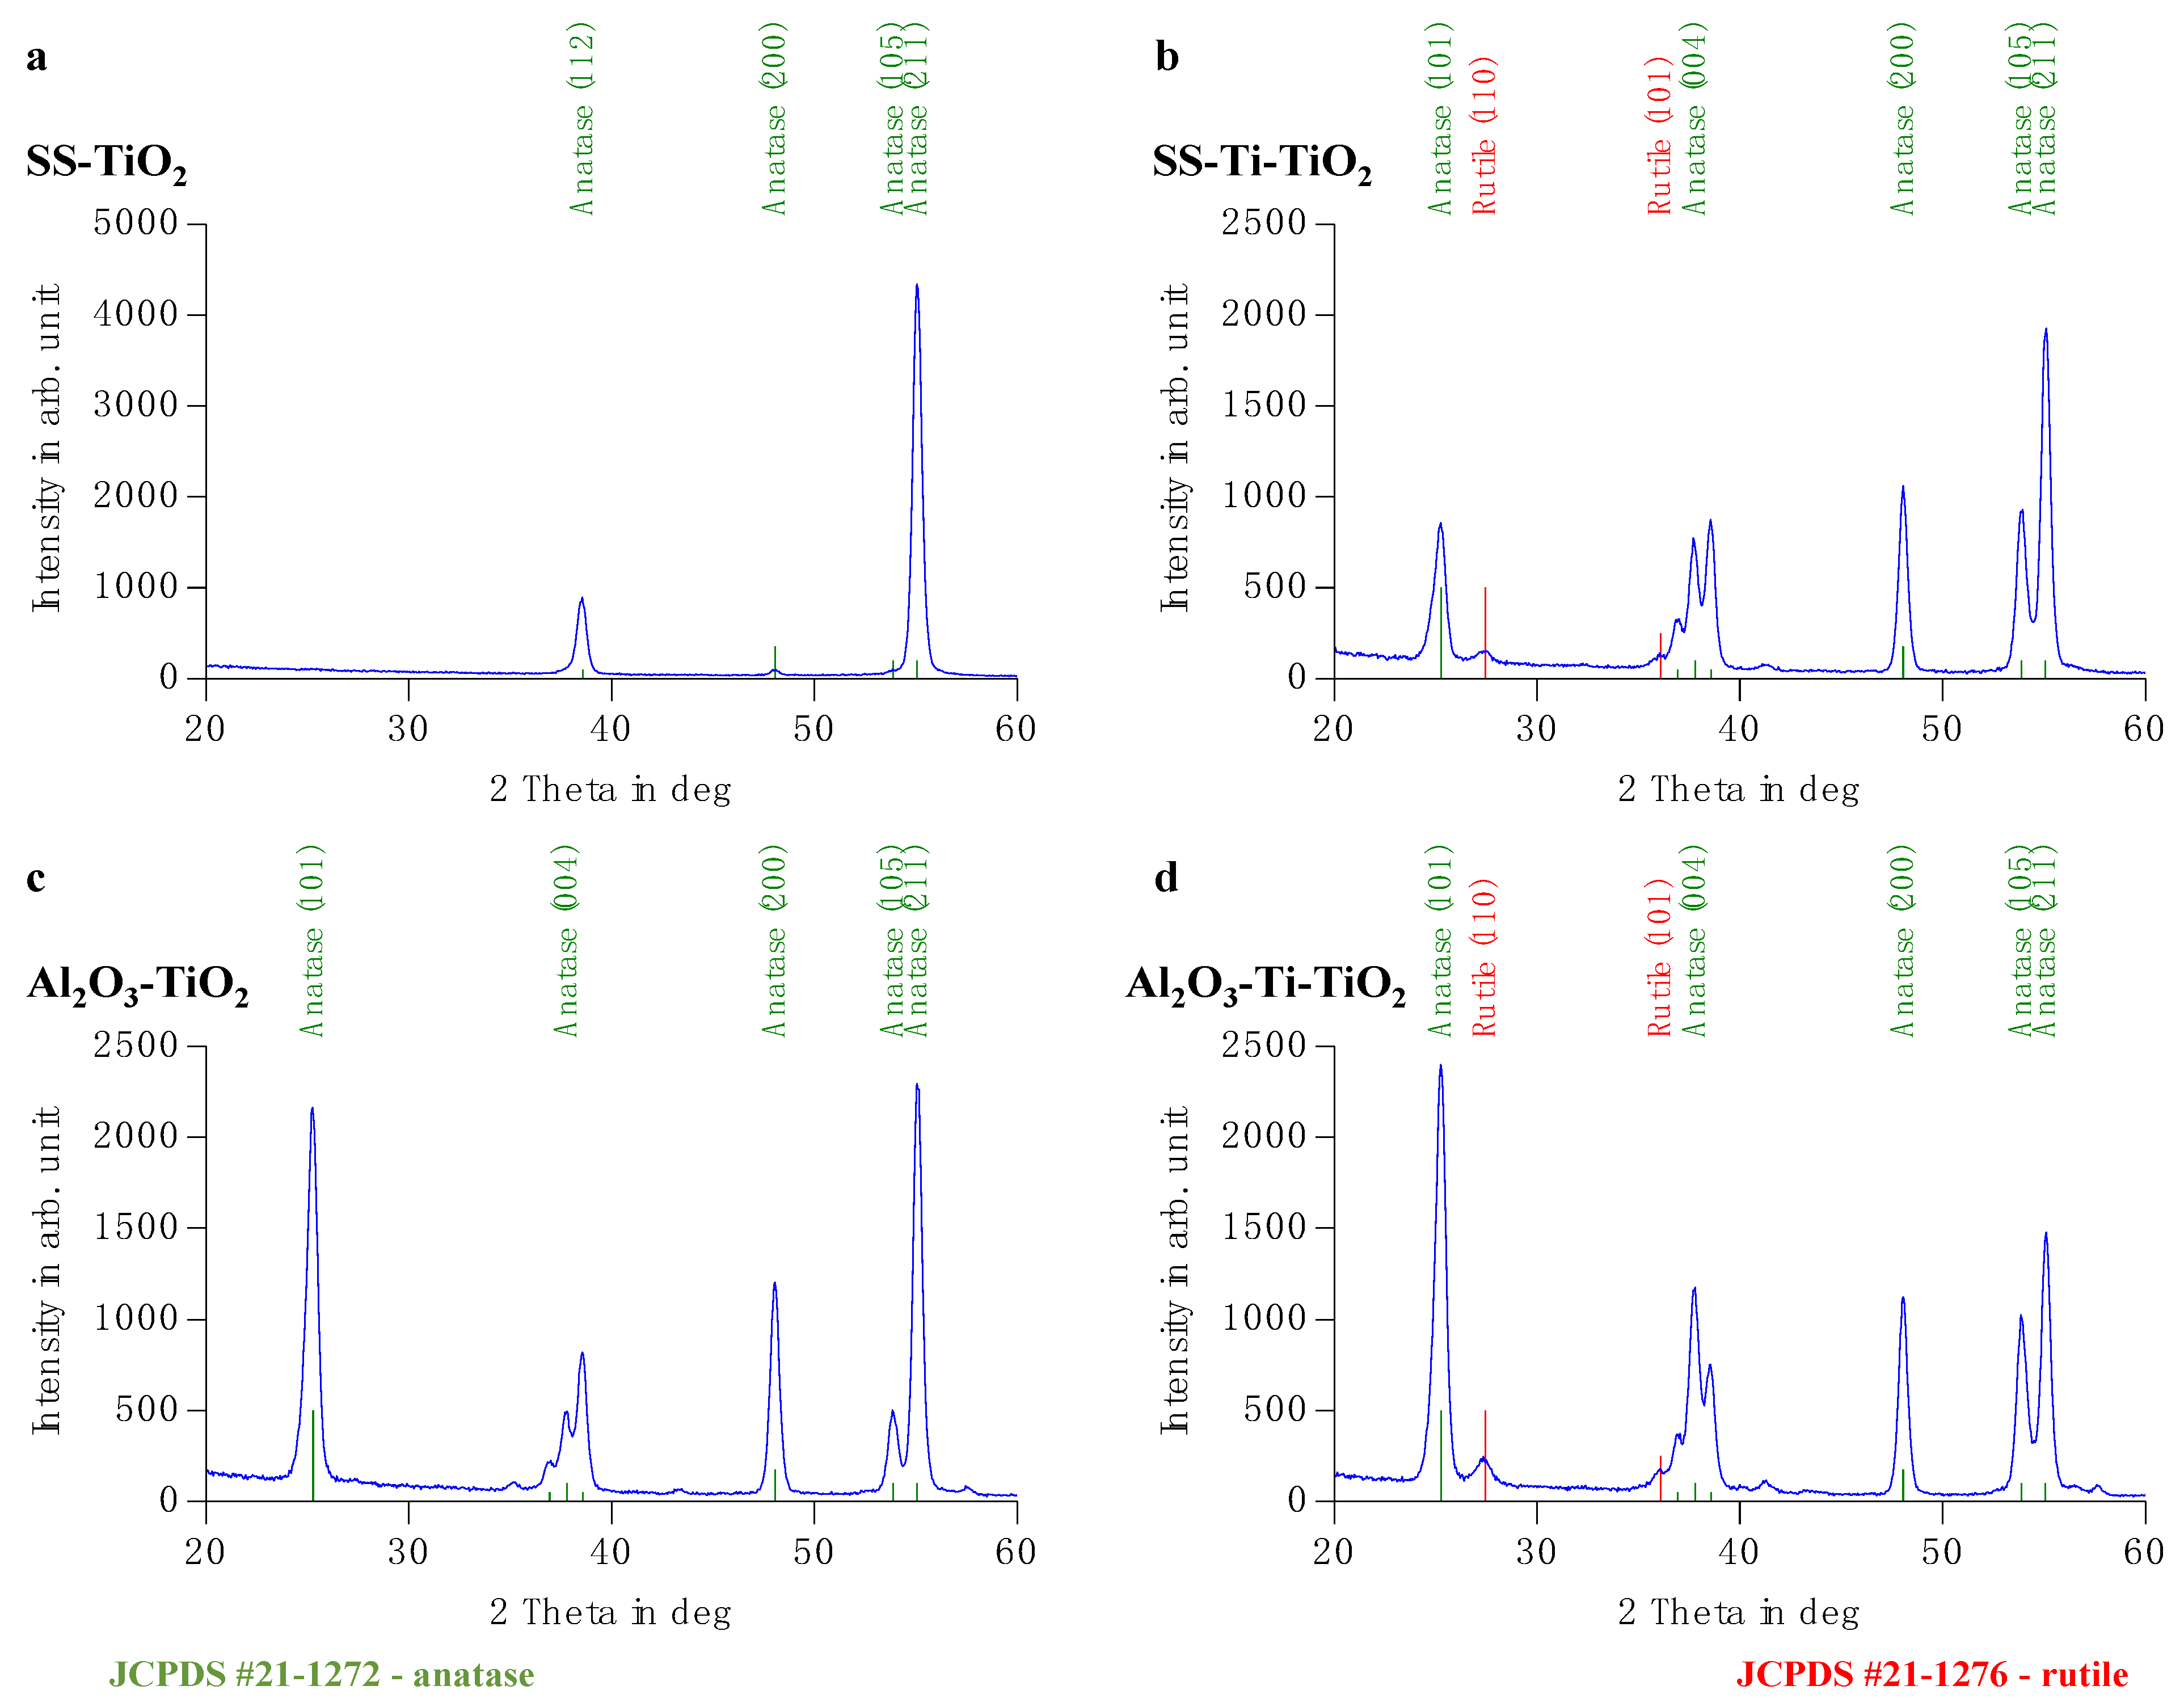
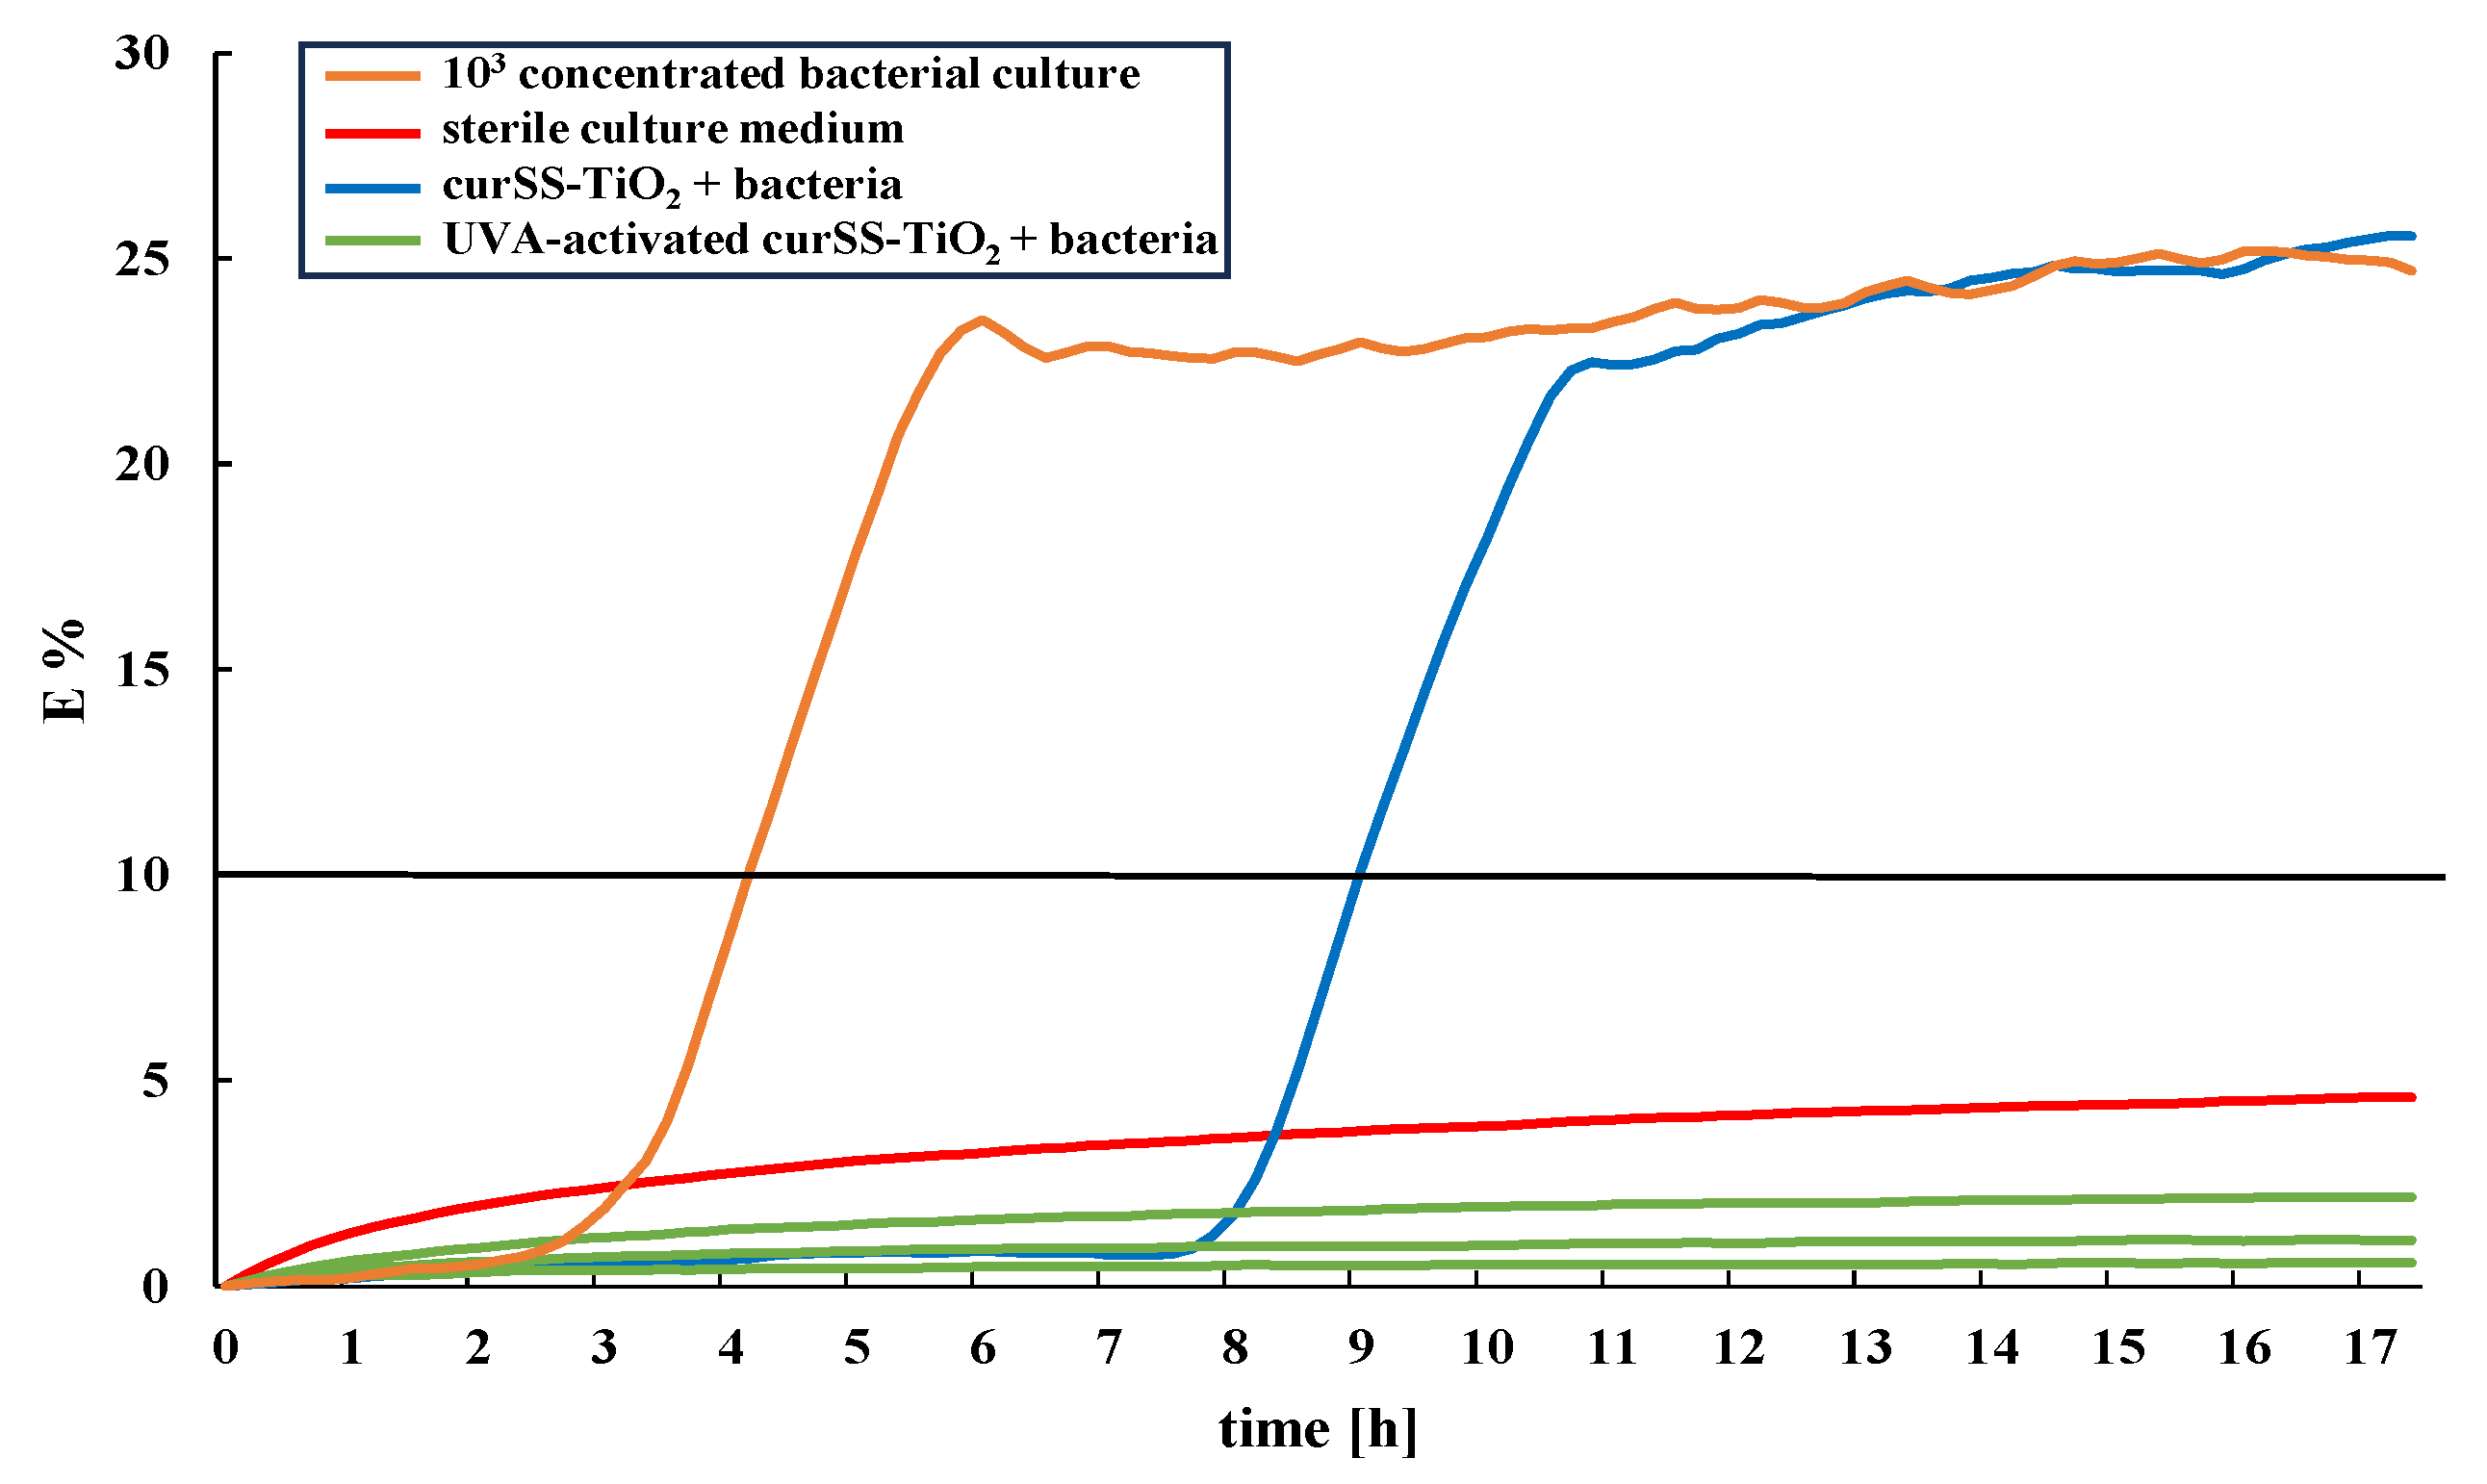
Table 1.
Data of the titanium dioxide (TiO2)-coated samples and the coating parameters for deposition by pulse magnetron sputtering. Coating times for the TiO2 coatings were 55–60 min (flat and curved) and 5 min for the Ti interlayer.
Table 1.
Data of the titanium dioxide (TiO2)-coated samples and the coating parameters for deposition by pulse magnetron sputtering. Coating times for the TiO2 coatings were 55–60 min (flat and curved) and 5 min for the Ti interlayer.
| Sample Type | Substrate | T Heater [°C] | Pulse Pattern [µs] | ΓAr [sccm] | ΓO2 [sccm] | p [Pa] | Coating Rate [nm/min] | Coating |
|---|---|---|---|---|---|---|---|---|
| SS-TiO2 | stainless steel | 250 | 16:10 | 100 | 38–39 | 1.12 | 47–51 | pure TiO2 |
| SS-Ti-TiO2 | stainless steel | 250 | 16:10 | 100 | 40 | 1.03 | 50–51 | Ti interlayer |
| 39 | 1.13 | 200–210 | TiO2 coating | |||||
| Al2O3-TiO2 | Al2O3 ceramic | 250 | 16:10 | 100 | 38–39 | 1.12–1.13 | 47–51 | pure TiO2 |
| Al2O3-Ti-TiO2 | Al2O3 ceramic | 250 | 16:10 | 100 | 40 | 1.03 | 50–51 | Ti interlayer |
| 1.13 | 200–210 | TiO2 coating | ||||||
| curSS-TiO2 | stainless steel | 250 | 15.5:10: 16.5:10 | 100 | 38 | 1.12 | 53 | pure TiO2 on curved samples |
Table 2.
Thickness of deposited coatings, arithmetic average deviation of the roughness profile, and lateral size of TiO2 crystallites.
Table 2.
Thickness of deposited coatings, arithmetic average deviation of the roughness profile, and lateral size of TiO2 crystallites.
| Sample Type | Coating Thickness [nm] | Roughness Ra [nm] | Lateral Size TiO2 Crystallites [nm] | |
|---|---|---|---|---|
| SS substrate | - | 5.0 | - | |
| Al2O3 substrate | - | 120.0 | - | |
| SS-TiO2 | 2600 | 21.3 | ≈150 | |
| SS-Ti-TiO2 | 1200 | (Ti interlayer) | 44.5 | ≈500 |
| 2800 | (TiO2 coating) | |||
| Al2O3-TiO2 | 2600 | 56.4 | ≈200 | |
| Al2O3-Ti-TiO2 | 1200 | (Ti interlayer) | 67.4 | ≈350 |
| 2800 | (TiO2 coating) | |||
| curSS-TiO2 | 3200 | - | ≈200 | |
Table 3.
Viable bacteria determined by direct impedance measurement.
| Sample Type | Microorganism | UVA Dose [J/cm2] | Viable Bacteria [CFU/mL] |
|---|---|---|---|
| curSS-TiO2 | E. coli | 17.6 ± 1.2 | 0.000 ± 0.000 |
| no activation | 0.015 ± 0.002 | ||
| S. warneri | 17.6 ± 1.2 | 0.000 ± 0.000 | |
| no activation | 0.939 ± 1.359 |
Disclaimer/Publisher’s Note: The statements, opinions and data contained in all publications are solely those of the individual author(s) and contributor(s) and not of MDPI and/or the editor(s). MDPI and/or the editor(s) disclaim responsibility for any injury to people or property resulting from any ideas, methods, instructions or products referred to in the content. |
© 2024 by the authors. Licensee MDPI, Basel, Switzerland. This article is an open access article distributed under the terms and conditions of the Creative Commons Attribution (CC BY) license (https://creativecommons.org/licenses/by/4.0/).
Share and Cite
MDPI and ACS Style
Steinhäußer, L.; König, U.; Fietzke, F.; Gotzmann, G. Influence of a UVA-Activated TiO2 Coating on Bacterial Surface Colonization in Water-Bearing Systems. Coatings 2024, 14, 454. https://doi.org/10.3390/coatings14040454
AMA Style
Steinhäußer L, König U, Fietzke F, Gotzmann G. Influence of a UVA-Activated TiO2 Coating on Bacterial Surface Colonization in Water-Bearing Systems. Coatings. 2024; 14(4):454. https://doi.org/10.3390/coatings14040454
Chicago/Turabian StyleSteinhäußer, Linda, Ulla König, Fred Fietzke, and Gaby Gotzmann. 2024. "Influence of a UVA-Activated TiO2 Coating on Bacterial Surface Colonization in Water-Bearing Systems" Coatings 14, no. 4: 454. https://doi.org/10.3390/coatings14040454
Note that from the first issue of 2016, this journal uses article numbers instead of page numbers. See further details here.