Article

Magnetron-Deposited FeTiB Films: From Structural Metastability to the Specific Magnetic State

by
Elena N. Sheftel
1,
Valentin A. Tedzhetov
1,
Eugene V. Harin
1,
Philipp V. Kiryukhantsev-Korneev
2,*,
Olga M. Zhigalina
3,4 and
Galina Sh. Usmanova
1
1
Baikov Institute of Metallurgy and Materials Science RAS, Leninsky Prospekt 49, Moscow 119334, Russia
2
Department of Powder Metallurgy & Functional Coatings, National University of Science & Technology “MISIS”, Leninsky Prospect 4, Moscow 119049, Russia
3
National Research Centre “Kurchatov Institute”, Academik Kurchatov Square 1, Moscow 123182, Russia
4
Department of Material Science, Bauman Moscow State University, 2nd Baumansakay Str. 5, Building 1, Moscow 105005, Russia
*
Author to whom correspondence should be addressed.
Coatings 2024, 14(4), 475; https://doi.org/10.3390/coatings14040475
Submission received: 28 February 2024 / Revised: 10 April 2024 / Accepted: 11 April 2024 / Published: 12 April 2024
(This article belongs to the Section Thin Films)

Abstract

:
Results of XRD and TEM studies of a metastable phase state in Fe73Ti5B19O3 and Fe55Ti16B27O2 films, which is formed upon magnetron deposition under preset conditions, and of the evolution of the state in the course of subsequent annealing at 500 °C for 1, 5, and 9 h and experimental data on the magnetic microstructure and magnetic properties are reported. The annealed films were found to be characterized by a nanocrystalline structure, which is represented by two crystalline phases, namely, the ferromagnetic solid solution αFe(Ti), and nonferromagnetic boride FenB. The Ti content in the films determines the grain size of the αFe(Ti) phase, whereas the content of B localized within the grain boundaries determines the ratio of the volume fractions of amorphous and nanocrystalline phases in the structure. In contrast to the ferromagnetic Fe73Ti5B19O3 films, the Fe55Ti16B27O2 films are superparamagnets both in the deposited state and after annealing at 500 °C for 1 and 5 h because of the higher volume fraction of the amorphous phase in the structure. The 9 h annealing of the Fe55Ti16B27O2 films transfers them into the ferromagnets owing to the development of the amorphous phase crystallization, increase in the content of nanocrystalline ferromagnetic phase αFe(Ti) grains, and realization of exchange interaction between them.

1. Introduction

The development of contemporary microelectronics is largely determined by advances in designing soft magnetic alloys characterized by a high saturation induction Bs and low coercive field Hc. Such a combination of magnetic properties can be ensured in Fe-based nanocrystalline alloys [1,2]. In this case, nanocrystalline Fe alloy-based films with the two-phase Fe+MeX structure (where MeX is the most thermodynamically stable and hard phase formed by a metal of the IVa Group of the periodic table and one of the light elements, such as C, N, O, and B), which is formed in the course of the annealing of magnetron-deposited films [3], deserve special attention. The low coercive field Hc of such films is reached at the expense of refining grains to sizes of less than the exchange interaction length [4]; the high Bs values are reached at the expense of the high Fe content.
Earlier, by an example of soft magnetic bulk alloys prepared by casting, we showed that the two-phase Fe+MeIVX state ensuring the high level of functional characteristics can be formed in alloys, the phase state of which is described by equilibrium quasi-binary Fe-MeIVX phase diagrams with eutectic solidification [5]. The development of the approach for soft magnetic film alloys [6,7,8,9] prepared under conditions of rapid solidification from vapor (magnetron deposition) should assume the formation of a metastable phase structural state caused by (i) the formation of an amorphous phase, (ii) the shift of eutectic composition toward the more refractory constituent MeX, (iii) changing the concentration range of existence of the two-phase Fe+MeX equilibrium in the ternary Fe-Me-X system [10,11], and a number of other factors. The adequate qualitative and quantitative estimations of the formed metastable state and its “shift” toward the equilibrium in the course of subsequent annealing are the important stage of the investigations aimed at finding the preparation conditions of two-phase Fe+MeIVX film material ensuring the required level of properties.
To study the metastable phase state of film materials, experimental methods, such as X-ray diffraction (XRD) analysis [12,13,14] and transmission electron microscopy (TEM) [15,16,17], along with electron diffraction (ED), high-resolution TEM [15,16,17], synchrotron X-ray diffraction (SXRD) [18,19], neutron diffraction [20,21], nuclear magnetic resonance [22,23], and atomic probe tomography [24,25], are used.
Taking into account the fact that the magnetic properties are most structure-sensitive [26], in the present study, with respect to the Fe-TiB2 system films, which belong to the considered class of materials, results of investigations of the metastable phase state formed upon magnetron deposition and its evolution in the course of subsequent annealing, which were investigated using traditional structural methods (XRD, ED, and TEM), and experimental data on the magnetic microstructure and magnetic properties of the Fe-Ti-B films are reported for the first time.

2. Materials and Methods

Films Fe73Ti5B19O3 and Fe55Ti16B27O2 (hypereutectic compositions of the equilibrium Fe-TiB2 system [27]) were prepared by magnetron sputtering of composite targets, which consist of an Fe disk (110 cm2 in area) uniformly coated with TiB2 ceramic segments 21 cm2 (Fe73Ti5B19O3) and 37 cm2 (Fe55Ti16B27O2) in total area (the ceramic was manufactured by self-propagation high-temperature synthesis, SHS). The preparation conditions of the targets are described in detail in [27]. The films 1.0 µm (Fe73Ti5B19O3) and 0.6 µm (Fe55Ti16B27O2) thick were deposited on glass and metallic (Ni-Cr alloy) substrates for 10 min in an Ar atmosphere at a pressure of 0.2 Pa, at a cathode voltage of 500 V, and a current of 1.5 A. The films were annealed at 500 °C for 1 h (Fe73Ti5B19O3 films) and 1, 5, and 9 h (Fe55Ti16B27O2 films) in a vacuum of 2·10−4 Pa. For this class of film materials, an annealing temperature equal to 500 °C ensures the lowest values of the coercive field [7].
The chemical composition of the films on glass substrates was determined by energy dispersive X-ray spectroscopy using a Hitachi S-3400N (Hitachi High-Technologies, Tokyo, Japan) scanning electron microscope equipped with a Noran 7 Thermo attachment. The film thickness was estimated using cross-sectional electron micrographs. An accurate assessment of the content of light elements (B, O) was carried out for the films deposited on metallic (Ni-Cr) substrates by glow discharge optical emission spectroscopy (GDOES) using a Horiba Jobin Yvon Profiler 2 (Horiba Jobin Yvon, Longjumeau, France). The Ni-Cr substrates were used exclusively for GDOES measurements on the as-deposited films. The rest of the measurements were performed on the glass substrates.
The phase-structural state of the films was studied by XRD analysis, TEM, and ED. XRD patterns were taken in Bragg–Brentano geometry in a 2θ angular range of 20 to 90° at a step of 0.04° using a Rigaku Ultima IV diffractometer (Rigaku Corporation, Tokyo, Japan) equipped with a graphite monochromator and CuKα radiation; a scintillation detector was used to record radiation. To exclude the contribution of the substrate material to the diffraction patterns, the diffraction pattern of substrate was subtracted from experimental patterns. The obtained difference patterns were approximated by Voigt (crystalline phases) and Lorentz (amorphous phase) functions. Qualitative phase analysis was performed using the PHAN program [28] and JCPDS (ICDD) data. Quantitative phase analysis and determination of the grain size were performed using the full-profile Rietveld refinement method and PHAN% program [28].
The structure of the films was studied by TEM and ED using Tecnai G2 30ST and FEI Osiris electron microscopes (FEI Company, Hillsboro, OR, USA). Samples for the electron-microscopic studies were prepared in the form of cross sections and in-plane samples. The thinning was performed with specific pasts, sprays, and argon ions with an energy of 3–5 keV and an incident angle of 3–5° using a Gatan PIPS 691 system (Gatan Inc., Pleasanton, CA, USA). The processing and analysis of TEM images was fulfilled using Digital Micrograph and TEM Imaging & Analysis ver. 4.15 software. The grain-size distribution was estimated using ImageScope 2002 software.
The magnetic properties (ferromagnetic hysteresis, saturation magnetization Ms, and coercive field Hc) of the films in the initial (as-deposited) and annealed states were studied by vibrating-sample magnetometry using a LakeShore 7407 magnetometer (Lake Shore Cryotronics Inc., Woburn, MA, USA). The error of determination of Ms, which is related to the accuracy of the measurements of the shape and sizes of Ni standard ball and film samples, did not exceed 10%.

3. Results and Discussion

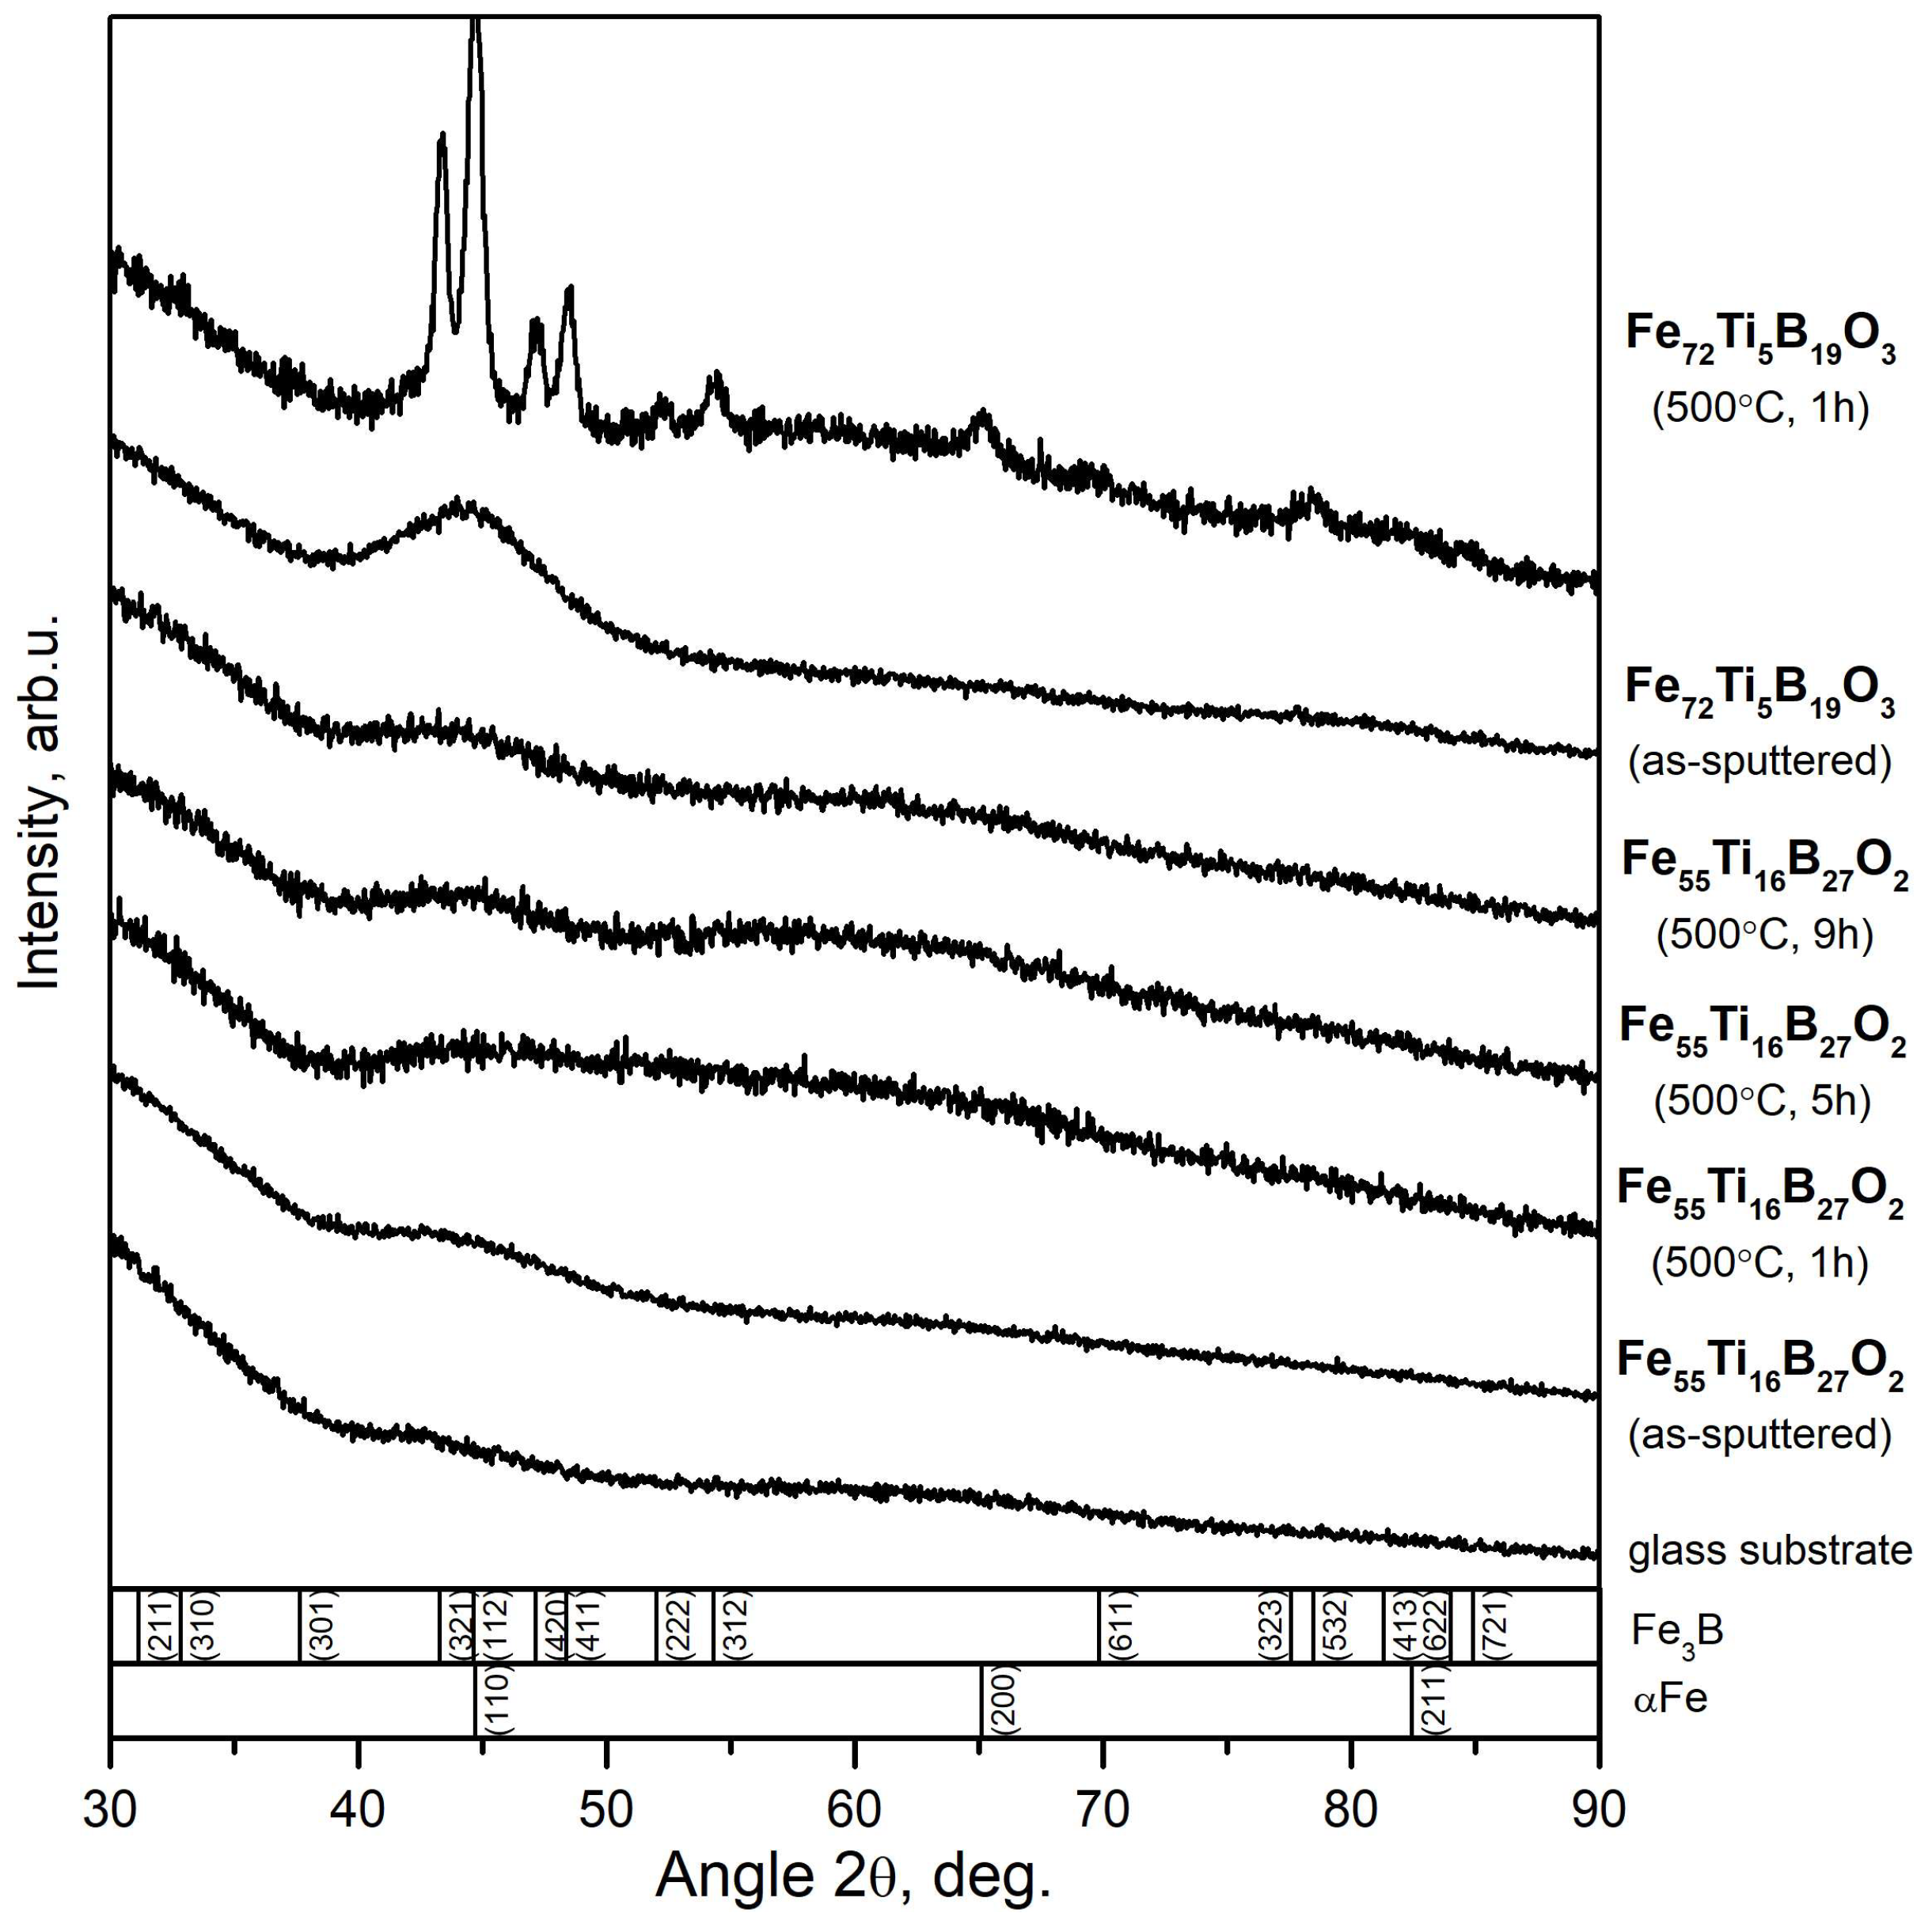
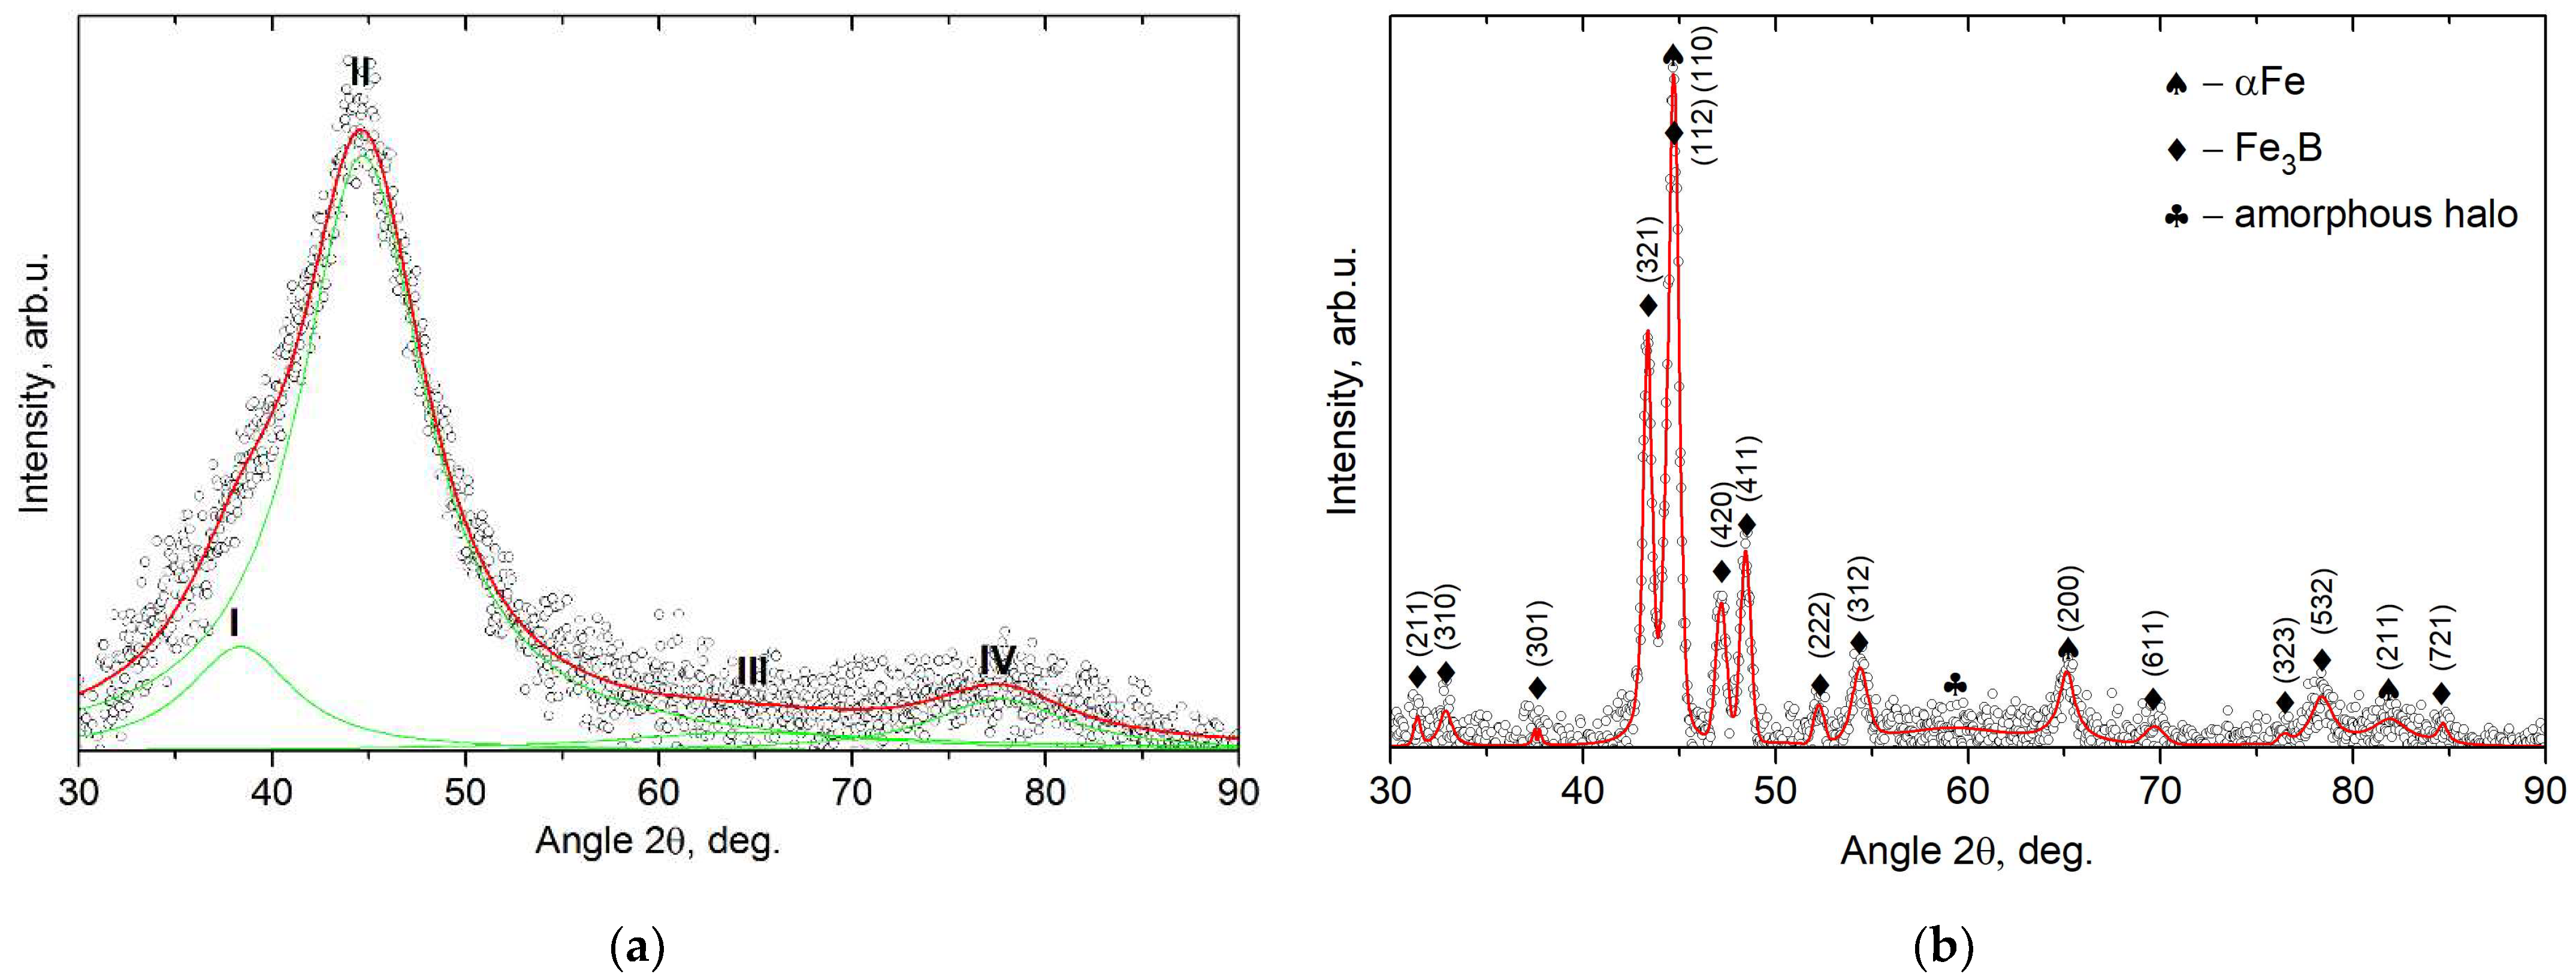
3.1. Phase Composition and Structure of As-Deposited Films

Figure 1 shows experimental XRD patterns taken for the films under study. The XRD patterns demonstrate wide, in particular for the Fe55Ti16B27O2 films, diffuse reflections, which are centered in the angular range corresponding to the most intense reflections of the αFe-based phase (I(110) = 100%, 2θ(110) = 44.71°) with the bcc crystal lattice and the phases with the FenB stoichiometry (reflections of the Fe2B phase are I(211) = 100%, 2θ(211) = 45.13° and those of the Fe3B phase are I(321) = 100%, 2θ(321) = 43.27°) with the bct lattice (Table 1). As is known [29,30], the substantial (more than 10°) broadening of an XRD reflection can mean the formation of an amorphous or mixed (nanocrystalline + amorphous) structure.
The XRD patterns observed for the films under study indicate the formation of a mixed structure comprising crystallites (from here on, grains) of the bcc αFe-based phase and/or one of bct FenB phases, and an amorphous phase. Assuming the formation of one of the above crystalline phases and ignoring microstrains in the phase grains, the grain size can be estimated using the physical broadening of XRD reflections and Scherrer formula:
D = λ β cos θ ,
where D is the grain size, λ is the wavelength of CuKα-radiation (0.154059 nm), and β is the integral angular width of reflection. The grain size calculated by Equation (1) for the reflection corresponding to an angular position of ~45° is ~1.5 nm (for Fe73Ti5B19O3 films) and ~0.9 nm (for Fe55Ti16B27O films, Table 1).
In order to exclude the effect of substrate on the formed XRD pattern of the films under study, difference XRD patterns were obtained by subtracting XRD patterns of the substrate from the experimental XRD patterns. The difference XRD patterns (shown in Figure 2a for Fe73Ti5B19O3 films) exhibit several wide (the integral width is β > 10°) diffuse reflections corresponding to 2θ angular positions of ~37°(I), ~45°(II), ~64°(III), and ~75°(IV). Table 1 shows parameters of the reflections (2θi angular position and integral angular width βi) obtained by approximation of the difference XRD patterns of the films under study.
In accordance with fundamental concepts [31], X-ray scattering at amorphous solids having a topological order leads to the appearance of a diffuse halo, whose intensity is determined by the Debye scattering equation:
I = m n f m f n sin k R m n k R m n ,
where fm, fn are the atomic scattering factors of atoms m and n, respectively, k is the scattering vector, and R is the nearest interatomic spacing in short-range order areas (the first coordination sphere). The series of the scattering intensity I maxima is determined by the series of the sinkRmn/kRmn function maxima. Analysis of this function shows that it takes maximum values for argument values of kRmn = 7.73, 14.06, 20.46. Taking into account that k = 4πsinθ/λ, we obtain:
4 π s i n θ i λ R = 7.73 ,   14.06 ,   20.46 ,
where θi is the angular position of i-th diffuse maximum. Thus, when substituting the angular position of corresponding reflections in the XRD pattern (Table 1) into Equation (3), the radius of the first coordination sphere R, which characterizes the short-range order of atoms making the maximum contribution to the scattering intensity, can be determined.
When calculating the R value, we use two possible approaches to the interpretation of the XRD pattern of the films:
  • the parameter in the right-hand side of Equation (3) was taken to be equal to 14.06°, and for all reflections (I, II, III, IV), the R1 value was calculated;
  • for reflections III and IV, the parameter in the right-hand side of Equation (3) was taken to be equal to 14.06°and the R2 value was determined.
The obtained R1 and R2 values (Table 1) indicate the formation of areas characterized by short-range order with an interatomic spacing of 0.28–0.30 nm (reflections I and IV), 0.25 nm (II), and 0.18 nm (III). Taking into account the fact that the atomic radii of elements comprising the composition of the films under study are 0.128 nm (Fe), 0.147 nm (Ti), and 0.091 nm (B) [31], the R values estimated from the positions of reflections I and IV, reflection II, and reflection III, can be interpreted as the sum of atomic radii of Fe and Ti (0.275 nm), the doubled radius of Fe (0.256 nm), and the doubled radius of B (0.182 nm), respectively (Table 1). The data obtained testify to the formation of short-range order areas of bcc Fe (reflection II), a bcc phase formed by Fe and Ti atoms (I and IV), and a B-containing phase (III).
It should be noted that previously, for magnetron-deposited Fe-ZrN films (belonging to the Fe-MeX class films considered in the present study) we also observed the formation of a heterogeneous amorphous structure [32].
The visualization of grains in dark-field TEM images of the structure and diffuse wide diffraction rings in the ED patterns, which correspond to the most intense reflections of the bcc αFe-based phase (Figure 3a,c), indicate the formation of a mixed (amorphous + nanocrystalline) structure with the αFe-based phase. Statistical analysis of the TEM images of the structure (the insets in Figure 3a,c) showed that the grain size of the crystalline phase formed upon deposition of the Fe73Ti5B19O3 films is 0.7–2.0 nm; the average size is ~0.7 nm (Figure 3a,c). As is known, grain sizes determined using XRD patterns (Table 1) always slightly exceed the values obtained from the analysis of TEM images. The substantially lower grain size (~0.7 nm) of the crystalline phase in Fe55Ti16B27O2 films characterized by the higher Ti content as compared to grain size in Fe73Ti5B19O3 (~1.3 nm) indirectly indicates the formation of Ti solid solutions in αFe. The higher the Ti content in the films and the higher the enrichment of the bcc phase (αFe(Ti) solid solution) in this element, the more difficult the diffusion determining the grain growth of the phase in the course of the film deposition. TEM and ED data on the formation of the αFe(Ti) solid solution in the films under study agree with those previously obtained for FeTiB films with similar compositions [27].
As for boron, its high content in the films under study and absence of solubility in αFe even under rapid melt-quenching conditions [22,25,33,34,35,36,37,38,39,40,41,42,43,44,45,46,47] predetermine the localization of B in the amorphous structural constituent of the films. In this case, as was shown by analysis of XRD data, B-enriched areas with a short-range order, characterized by an interatomic distance of 0.18 nm (Figure 2a, reflection III), formed in the amorphous structural constituent. The obtained result agrees well with experimental data [25] and NMR and Moessbauer studies [22,41,42,43,44,45,46], which indicate the presence of clusters with the Fe3B short-range order in the amorphous phase of rapidly quenched Fe- and B-containing alloys.
It should be noted that all films contain the impurity oxygen (no more than 3 at %), which may originate from either the residual gas in the vacuum chamber (residual pressure is ~10–3 Pa), the working gas (Ar 99.9995% purity), or the cathode materials (SHS-prepared ceramic plates). Considering a high oxygen solubility in Ti (up to 33 at % in αTi) and a very high affinity of O to Ti (the heat of formation of titanium oxides is −Hf298 = 543–3405 kJ/mol), the influence of oxygen on the phase composition of the studied films cannot be neglected. Indeed, a small amount of the oxygen solid solution in titanium, αTi(O), was identified by us previously in the FeTiB film containing a small amount of Ti (2–3 at %) and O (1.1–3.8 at %) [27]. In the present study there are the films with the sufficiently higher Ti content (5 and 16 at %) and the higher volume fraction of the αFe(Ti) phase, and in this case it is likely that small amounts of the formed αTi(O) phase cannot be determined by XRD.

3.2. Phase Composition and Structure of the Annealed Films

XRD patterns taken for the Fe73Ti5B19O3 films annealed at 500 °C for 1 h demonstrate the (110), (200), and (211) reflections at angular positions of ~45°, ~65°, and ~82°, which are centered near angular positions of αFe, and a number of reflections corresponding to the bct Fe3B phase (Figure 1 and Figure 2b). The lattice parameters of the phases, which were calculated from the angular positions of the reflections, are abcc = 2.878 Å and a/cFe3B = 8.620/4.304 Å, respectively. The fact that the lattice parameter of the bcc phase (2.878 Å) is higher than the tabulated parameter for αFe (2.866 Å) indicates the formation of bcc Ti solid solution in αFe in the films already in the deposited state, the volume fraction of which increases after annealing. The grain sizes of the bcc and bct phases are 16.1 and 18.6 nm, respectively; their volume ratio is ~1:1.
The XRD pattern, taken for these films, exhibits a halo having a weak intensity, which is centered near ~59° (Figure 2b). The calculation of the radius of the first coordination sphere R1 for the halo by Equation (1) gives a value of 0.19 nm (0.182 nm is the doubled radius of B atom, Table 1). This means that the halo (Figure 2b) corresponds to the diffuse scattering from the amorphous phase containing B-enriched short-range order regions.
The ED data obtained for the Fe73Ti5B19O3 films agree well with XRD data. The ED pattern (Figure 3b) demonstrates rings corresponding to the bcc phase (d112 = 1.17 Å, d200 = 1.43 Å, d110 = 2.02 Å) and the Fe3B phase (d = 1.11–1.17 Å, d = 1.85–2.09 Å), and wide diffuse rings indicating the presence of the amorphous phase. The following fact is noteworthy. In all rings corresponding to the crystalline phases, areas with increased brightness indicating the preferred orientation of the grains of both phases in the corresponding plane along the film surface (texture) are observed.
According to TEM data, columnar agglomerates oriented along the film growth direction are observed in the annealed Fe73Ti5B19O3 films (Figure 3b,f). The columns, as is known [47,48], are not structural constituents but are agglomerates of nanocrystalline grains with the same orientation.
XRD patterns taken for the Fe55Ti16B27O2 films annealed at 500 °C for 1, 5, and 9 h (Figure 1) exhibit two wide diffuse reflections, one of which is more intense and centered in an angular range of ~44–48° (II, Table 1); the other reflection is less intense and centered in an angular range of ~61–63° (III, Table 1). Such reflection is usually due to scattering from an amorphous material or from a material in which the main phase is amorphous.
According to ED and TEM data (Figure 3d,e), the mixed structure (amorphous + nanocrystalline) is found in the Fe55Ti16B27O2 films subjected to annealing at 500 °C for all holdings. In this relation, assuming that the XRD reflection centered at an angular range of ~44–48° corresponds to the bcc αFe-based phase, the grain size of the phase was calculated by Equation (1) as 0.7–1.1 nm (Table 1). For the diffuse reflection corresponding to an angular range of ~61–63°, the radius of the first coordination sphere R1 (the nearest interatomic distance in short-range order areas in the amorphous material) was calculated by Equation (3). The obtained value is R1 = 0.18–0.19 nm and corresponds to the doubled atomic radius of B (Table 1).

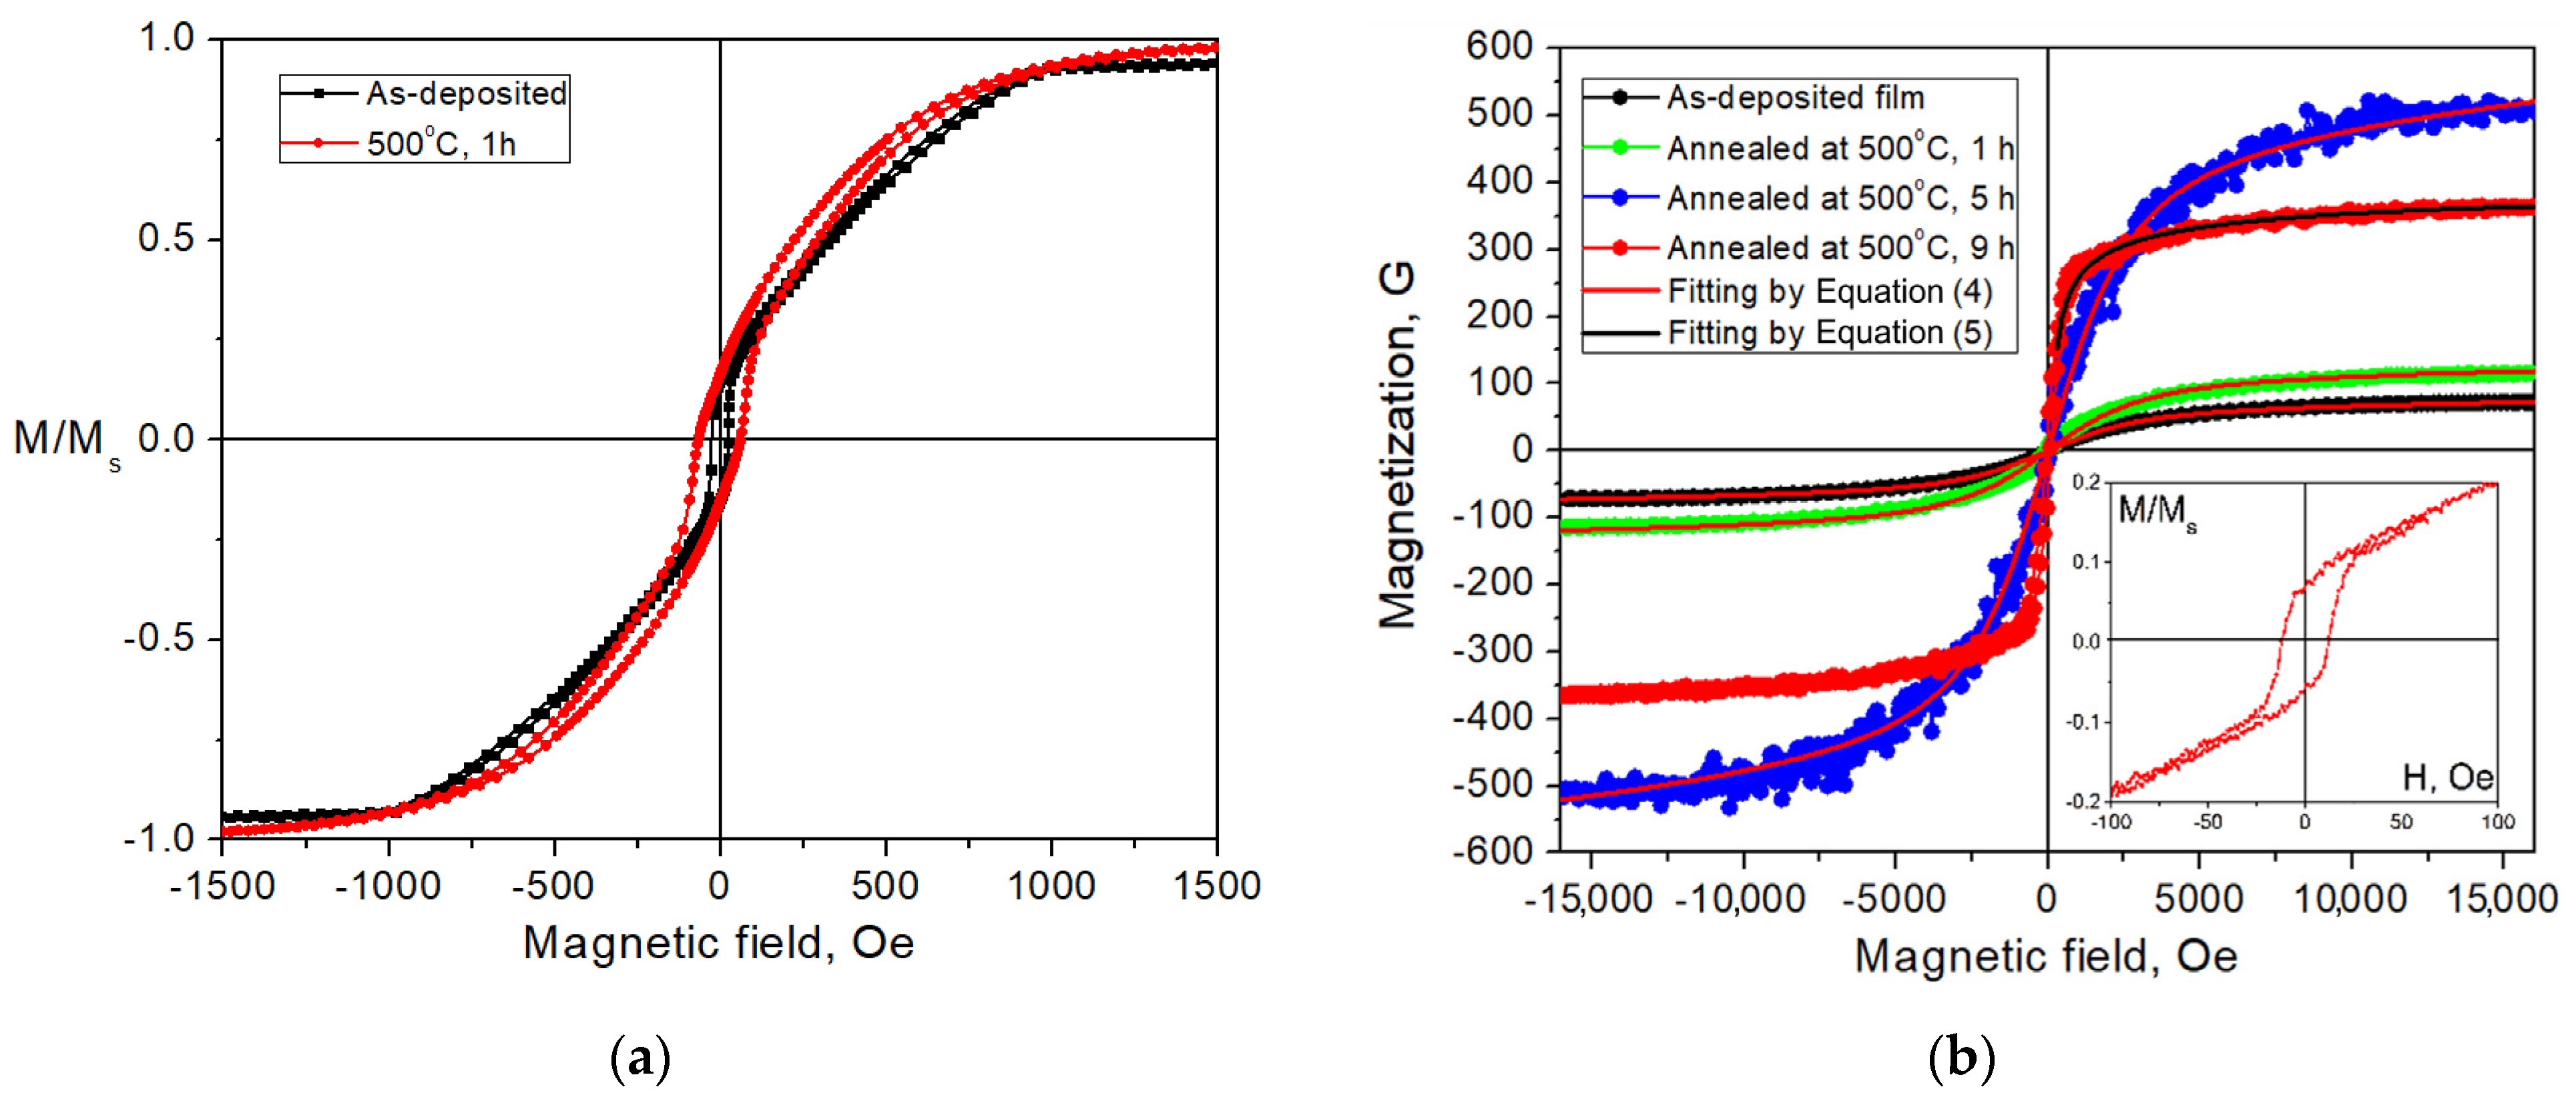
3.3. Magnetic Properties of the Fe73Ti5B19O3 Films

The as-deposited Fe73Ti5B19O3 films are strong ferromagnets (Figure 4a) and characterized by high saturation magnetization Ms = 1390 ± 80 G (1.75 ± 0.1 T) and coercive field Hc = 25 ± 2 Oe (Table 2). These data agree well with the XRD, ED, and TEM data, which shows that the structure of the as-deposited films is characterized by the presence of a ferromagnetic bcc αFe-based phase, an amorphous phase containing short-range order areas of the bcc αFe-based, and ferromagnetic Fe3B phases. The shape of the hysteresis loop of these films (low relative remanence Mr/Ms = 0.15 and almost linear portion of hysteresis loop in the fields above the coercive field, Figure 4a) indicates the existence of strong uniaxial magnetic anisotropy, which is likely to be related to the columnar structure found by TEM after annealing at 500 °C for 1 h (Figure 3b,f).
Annealing at 500 °C of the Fe73Ti5B19O3 films leads to Ms and Hc increasing to 1540 ± 90 G (1.93 ± 0.11 T) and 63 ± 3 Oe, respectively (Table 2); in this case, the shape of the hysteresis loop has not undergone qualitative changes (Figure 4a). The substantial increase in the magnetization of the annealed films indicates an increase in the content of ferromagnetic phases and a decrease in the content of the amorphous phase because of the development of the crystallization process. This result agrees well with the above data on the formation of a heterogeneous amorphous phase upon deposition, which comprises clusters with the short-range order of the ferromagnetic bcc αFe-based phase and ferromagnetic bct Fe3B phase. The decrease in the content of the amorphous phase after annealing leads to the increase in the coercive field of these films.

3.4. Superparamagnetic Structure of the Fe55Ti16B27O2 Films

The magnetization curves of the Fe55Ti16B27O2 films in the deposited state and after annealing at 500 °C for 1 and 5 h (Figure 4b) are typical of superparamagnets [49]. Such magnetization curves mean that the films have a nonferromagnetic matrix (either para- or diamagnetic), in which the ferromagnetic grains, isolated from each other by a matrix phase, are distributed. There is no exchange interaction between ferromagnetic grains, i.e., their volume fraction is below the percolation barrier; the grain size is below the single-domain range (i.e., the ambient thermal energy exceeds the effective energy of magnetic anisotropy of an individual ferromagnetic grain). The magnetization curves of these films were described by the Langevin function [50]:
M ( H ) = M w t a n h 1 π ( 2 R c ) 3 M s H 6 k B T 6 k B T π ( 2 R c ) 3 M s H + χ H
where Mw is the magnetization of an entire film represented as the ratio of the magnetic moment of the film to its volume (it should be noted that, based on the definition of a superparamagnet, the magnetization Ms of ferromagnetic grains in size 2Rc should be substantially higher than that of the entire film Mw because of the substantial volume fraction of the amorphous phase); kB is the Boltzmann constant; χ is the magnetic susceptibility of the matrix phase and substrate; H is the external field; and T is the temperature (300 K).
It should be noted that Equation (4) allows us to reliably determine only the average magnetic moment of ferromagnetic grain π(2Rc)3Ms/6, from which the grain size 2Rc can be estimated in assuming the spherical shape of grain in volume π(2Rc)3/6 and specifying the Ms value. In terms of the present experiment, it is impossible to accurately determine the Ms value since no data on the quantitative composition of the bcc phase are available (the composition can vary from αFe to αFe(Ti) solid solution with different Ti contents). We used Ms = 1000 ± 500 G as the reasonable value for the bcc phase, which makes a weak contribution to the accuracy of approximation by Equation (4). Thus, the description of magnetization curves by Equation (4) allowed us to determine the Mw and 2Rc values (Table 2). In this case, the term χH describes the magnetization process of both the matrix phase in the film and diamagnetic substrate; therefore, the χ value used in Equation (4) as a fitting parameter is the sum of two components.
The magnetization of the deposited Fe55Ti16B27O2 films is only Mw = 80 ± 10 G (0.1 ± 0.01 T). Such low values of Mw are due to the presence of the main amorphous phase. The ordering of atoms in amorphous material holding a short-range order does not have a long-range order typical of crystalline structures [51]. This allows one to consider the amorphous structure as inhomogeneous and a thermodynamically nonequilibrium state relative to a crystalline structure. The appearance of disorder leads to a weakening exchange interaction and, therefore, to a decrease in the magnetic moment. Moreover, as was shown in [52], the topological disorder significantly affects the magnetic moment of Fe atoms, decreasing it by 6 times (from 2.2 to 0.35 μB for “pure” coarse-grained and amorphous Fe, respectively). Besides the features of the amorphous state, the low Mw value of the Fe55Ti16B27O2 films is affected by the high content of nonferromagnetic atoms Ti and B (>45 at %). The increase in the annealing time at 500 °C from 1 to 5 h insignificantly affects the structure of the films; this is indicated by the notable increase in the magnetization Mw from 120 ± 20 G (0.15 ± 0.03 T) to 490 ± 90 G (0.62 ± 0.11 T). The volume fraction of the ferromagnetic phase can be estimated as the Mw/Ms ratio. Thus, the as-deposited Fe55Ti16B27O2 films and as-annealed at 500 °C for 1 and 5 h are characterized by the structure containing a slight amount (≈10–30 vol.%) of ferromagnetic grains in size 2Rc ≈ 4 nm surrounded by a nonferromagnetic amorphous matrix. It should be reminded that 2Rc is the area of structural homogeneity of effective magnetic anisotropy, the size of which is comparable with the ferromagnetic grain size; 2Rc slightly exceeds the grain size determined by XRD and TEM.

3.5. Stochastic Domain Structure of the Fe55Ti16B27O2 Films

Note the fact that the 9 h annealing at 500 °C of the Fe55Ti16B27O2 film leads to crystallization of the amorphous phase with the higher ferromagnetic phase volume fraction as compared to that formed after annealing for 1 and 5 h. As a result, the exchange interaction between grains becomes possible (i.e., the volume fraction of the ferromagnetic phase exceeds the percolation barrier); this is indicated by the shape of hysteresis loop and Hc = 12 ± 1 Oe (inset in Figure 4b).
The physical origin of the exchange interaction between grains in nanocrystalline ferromagnets is explained by the random anisotropy model (RAM) [4,53]. According to RAM, under conditions when the grain size 2Rc (or an area in amorphous phase, which is characterized by uniform magnetic anisotropy) is less than the exchange interaction length (A/K)1/2 (where A is exchange stiffness, K is magnetic anisotropy constant), the randomly oriented local magnetic anisotropy (on a grain scale 2Rc) is suppressed by exchange interaction on a scale of so-called stochastic domain 2RL. A stochastic domain is a magnetization autocorrelation area, the size of which 2RL is determined by competition of the local magnetic anisotropy field D1/2Ha (K = HaMs/2) and exchange stiffness A. The D value, easy-axis magnetic anisotropy dispersion, depends on the symmetry of the local (within a grain) magnetic anisotropy; for the uniaxial magnetic anisotropy, D = 1/15.
For the experimental measurement of the above-mentioned parameters of magnetic microstructure, there is a method for analyzing magnetization curves in high fields, so-called correlation magnetometry. This method was arrived at through the theoretical consideration of the autocorrelation function in the magnetic microstructure of amorphous and nanocrystalline ferromagnets [54]. In relation to measurements of the parameters of the magnetic microstructure from the laws of approach to saturation magnetization, the foundations were laid in [55]. A theoretical consideration of the influence of such a magnetic microstructure on the behavior of various properties was initiated in [56]. Note that during magnetization in high magnetic fields, the structural features of amorphous and nanocrystalline ferromagnets are reflected not only in the behavior of magnetization (on which the method of correlation magnetometry is based), but also in the optical properties [57], magnetoresistance [58,59], magnetocaloric properties [60], and other properties. The current state of the correlation magnetometry method for analyzing magnetic microstructure is given in [53,61]. To date, this method has become quite widespread [62,63,64].
To assess whether there is an exchange interaction between ferromagnetic grains in the Fe55Ti16B27O2 film annealed at 500 °C for 9 h, parameters of the magnetic microstructure, such as the root-mean square fluctuation of the effective local magnetic anisotropy field (at ferromagnetic grain scale) D1/2Ha, exchange field HR, and relative size of stochastic domains RL/Rc, were quantitatively estimated. For this purpose, according to correlation magnetometry theory [56], the experimental magnetization curve measure in high magnetic fields (Figure 4b) was approximated by the equation:
M(H) = Ms [1 − (1/2)(D1/2Ha)2/(H 2 + H 1/2 HR3/2)].
Using the equation, the saturation magnetization Ms = 380 ± 70 G (0.48 ± 0.09 T), Table 2, D1/2Ha = 6200 ± 2400 Oe, and HR = 15,900 ± 8000 Oe were determined (HR = 2A/MsRc2, where Rc is the ferromagnetic grain radius). According to [53], the exchange interaction is realized and the stochastic domains are formed in the case of D1/2Ha < HR.
While the saturation magnetization was determined by Equation (5) to high accuracy (Table 2), the correlation magnetometry method [53] allows us to graphically check the correctness of the determination of D1/2Ha and HR values. For this purpose, the dependence of magnetization dispersion dm = 1 − M/Ms as a function of the external field H should be plotted on the log–log coordinates (Figure 5). In Figure 5, the solid black curve (obtained from Equation (5)) has two asymptotes: the red line obtained from the relation dm = (1/2)(D1/2Ha/H)2, which is known as Akulov’s law and allows us to determine the D1/2Ha field value, and the green line obtained from the relation dm = (1/2)(D1/2Ha)2/(H1/2HR3/2). The last relation indicates the decrease in the stochastic domain size with increasing H (up to the disappearance of exchange interaction between grains at H > HR). The HR value is the field value corresponding to the intersection of the asymptotes.
The value of local magnetic anisotropy field at the grain scale, D1/2Ha, depends on the ferromagnetic grain composition, grain imperfection, and surrounding [65]. The measured value D1/2Ha is 6200 ± 2400 Oe and exceeds the value for pure αFe, 155 Oe [66], by two orders of magnitude. This fact indicates that, even after 9 h annealing at 500 °C, the nonequilibrium state of the film material remains.
The relative size of the stochastic domains RL/Rc = 7 ± 6 was determined from the relation RL/Rc = (HR/D1/2Ha)2. For these films, D1/2Ha < HR; therefore, RL/Rc > 1, which indicates the existence of an exchange interaction between ferromagnetic grains. Thus, the magnetic microstructure can reflect structural peculiarities that cannot be detected by XRD and TEM.

3.6. The Coercive Field of the Studied Films

The coercive field Hc of all the studied films in the deposited and annealed states retains values typical of soft magnetic materials (Table 2 and Figure 4a,b). In the deposited state, the films with the high Ti and B contents, Fe55Ti16B27O2, have the minimum coercive field Hc = 0.3 ± 0.3 Oe (this value is of the order of measurement error of coercive field, which is typical of superparamagnets). The hysteresis loops of the Fe73Ti5B19O3 films (Figure 4a) demonstrate a substantially higher value equal to Hc = 25 ± 2 Oe. According to the random anisotropy model [4], the Hc value depends on the relationship of values determining the competition of the effective local magnetic anisotropy and exchange interaction between ferromagnetic grains in the film. For the majority of the films under study (Fe73Ti5B19O3 and Fe55Ti16B27O2 in the deposited state and Fe55Ti16B27O2 annealed (for 1 and 5 h), which have a mixed structure (very small grain sizes of the bcc αFe-base phase and bct Fe3B located in the Fe-enriched amorphous phase), the weakening of the local anisotropy field is caused by the small sizes of ferromagnetic grains, which determine the low contribution of the magnetic anisotropy to the Hc value.
In the Fe73Ti5B19O3 films annealed for 1 h (with the remarkable ferromagnetic grain growth) and Fe55Ti16B27O2 films annealed for 9 h (retaining the ferromagnetic-phase grain size), the increase in Hc to 63 ± 3 and 12 ± 1 Oe is observed, respectively (Table 2 and inset in Figure 4b). This can be related to (i) the increase in the ferromagnetic grain size (Table 1); (ii) a possible increase in the microstrain in ferromagnetic grains; (iii) the appearance in the films, at least, of two ferromagnetic phases (bcc phase and Fe3B) differing in the saturation magnetization and, therefore, the appearance of additional magnetostatic anisotropy [67]; and (iv) the formation of columnar structure (Figure 3b,f).

4. Conclusions

The Fe73Ti5B19O3 and Fe55Ti16B27O2 films were prepared by magnetron deposition on glass substrates. The XRD, ED, and TEM studies allowed us to find that, upon deposition, the structure represented by amorphous and crystalline phases is formed in the films. The heterogeneous amorphous structure comprises short-range order areas of two combinations: (i) enriched in B and Fe or (ii) B and Fe + Ti. The crystalline structural constituent is represented by nano-sized (0.7–1.5 nm) grains of the bcc solid solution of Ti in αFe, αFe(Ti), and one of the bct borides with the FenB stoichiometry. The ratio of volume fractions of amorphous and nanocrystalline phases in the structure is determined by the content of B, which is located within grain boundaries, whereas the grain size of the αFe(Ti) phase is determined by the Ti content in the films.
The XRD, ED, and TEM data revealed the following:
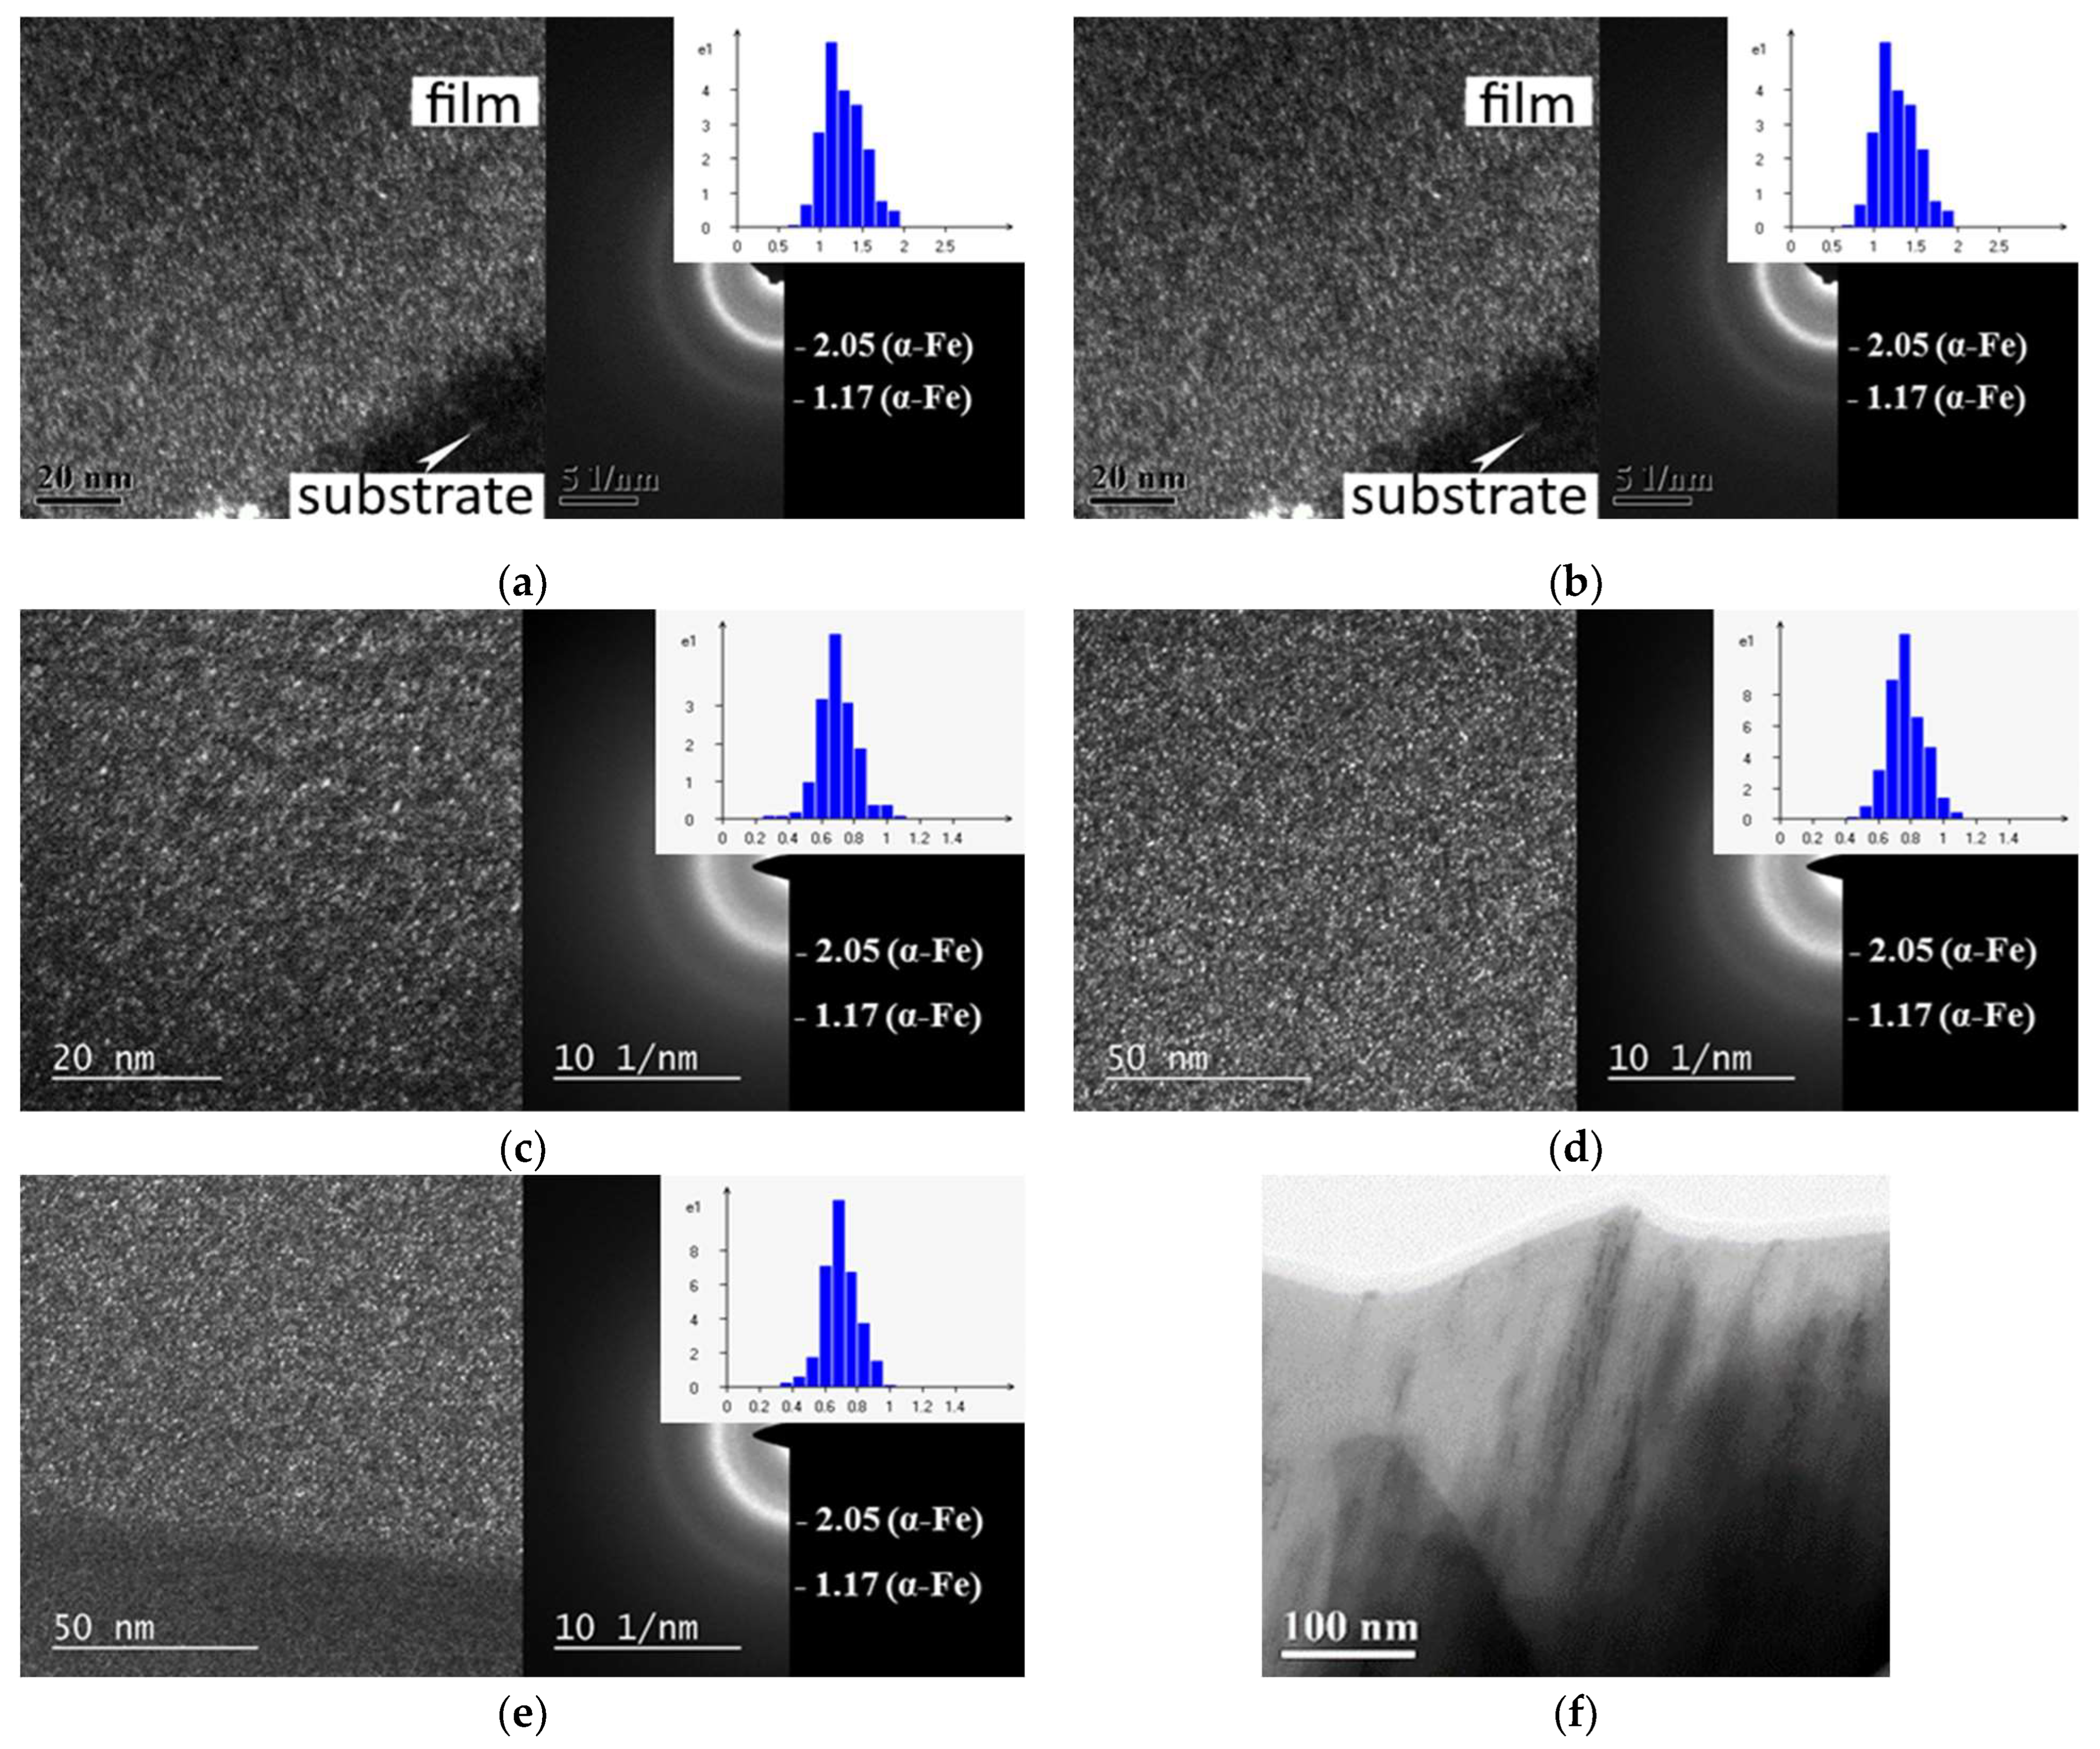
  • The annealing of the Fe73Ti5B19O3 films at 500 °C for 1 h leads to the development of the crystallization of the amorphous phase and an increase in the volume fraction of crystalline phases and grain sizes of these phases (16–19 nm);
  • The Fe55Ti16B27O2 films annealed at 500 °C for 1, 5, and 9 h demonstrate the thermal stability of the amorphous structural constituent and absence of remarkable grain growth of crystalline phases.
The data on the measured static magnetic properties and quantitative estimation of the magnetic microstructure of the films revealed the following:
  • The Fe73Ti5B19O3 films already in the deposited state are strong ferromagnets (the high saturation magnetization is Ms = 1.75 ± 0.1 T and the coercive field is Hc = 25 ± 2 Oe); this is explained by the existence of an exchange interaction between grains of the ferromagnetic phase. The annealing of the films at 500 °C for 1 h leads to the increase in Ms and Hc to 1.93 ± 0.11 T and 63 ± 3 Oe, respectively;
  • The Fe55Ti16B27O2 films in the deposited state are superparamagnets with the coercive field Hc = 0.3 ± 0.3 Oe, the structure of which is represented by a main (according to the volume fraction) nonferromagnetic amorphous phase with fine ferromagnetic phase grains without any exchange interaction between them, which are located in the amorphous phase. After 9 h annealing at 500 °C, the films become ferromagnets (Hc increases to 12 ± 1 Oe); this indicates the development of the crystallization process of the amorphous phase, an increase in the number of ferromagnetic phase grains, and the realization of exchange interaction between them.

Author Contributions

Conceptualization, E.N.S. and E.V.H.; formal analysis, V.A.T. and E.V.H.; investigation, E.V.H., V.A.T. and O.M.Z.; resources, P.V.K.-K. and G.S.U.; writing—original draft preparation, E.N.S., V.A.T. and E.V.H.; writing—review and editing, E.N.S., V.A.T. and E.V.H.; visualization, P.V.K.-K.; project administration, E.N.S. All authors have read and agreed to the published version of the manuscript.

Funding

This research was funded by the Russian Science Foundation (RSF), grant number 23-23-00434 (https://rscf.ru/en/project/23-23-00434/ accessed on 12 April 2024). The TEM investigation was carried out within the state assignment of NRC “Kurchatov Institute”.

Institutional Review Board Statement

Not applicable.

Informed Consent Statement

Not applicable.

Data Availability Statement

The data presented in this study are available in this article.

Conflicts of Interest

The authors declare no conflicts of interest.

References

  1. Liu, C.; Inoue, A.; Kong, F.L.; Zanaeva, E.; Bazlov, A.; Churyumov, A.; Zhu, S.L.; Al-Marzouki, F.; Shull, R.D. Fe-B-Si-C-Cu amorphous and nanocrystalline alloys with ultrahigh hardness and enhanced soft magnetic properties. J. Non Cryst. Solids 2021, 554, 120606. [Google Scholar] [CrossRef]
  2. Yoshizawa, Y.; Oguma, S.; Yamauchi, K. New Fe-based soft magnetic alloys composed of ultrafine grain structure. J. Appl. Phys. 1988, 64, 6044–6046. [Google Scholar] [CrossRef]
  3. Hasegawa, A.; Saito, M. Soft Magnetic Properties of Microcrystalline Fe-M-C (M = V, Nb, Ta) Films with High Thermal Stability. IEEE Transl. J. Magn. Jpn. 1991, 6, 91–100. [Google Scholar] [CrossRef]
  4. Herzer, G. Modern soft magnets: Amorphous and nanocrystalline materials. Acta Mater. 2013, 61, 718–734. [Google Scholar] [CrossRef]
  5. Sheftel, E.N. Soft magnetic nanocrystalline films of alloys of Fe-refractory interstitial phase for application in devices for magnetic recording. Inorg. Mater. Appl. Res. 2010, 1, 17–24. [Google Scholar] [CrossRef]
  6. Sheftel, E.N.; Tedzhetov, V.A.; Harin, E.V.; Kiryukhantsev-Korneev, P.V.; Usmanova, G.S.; Zhigalina, O.M. FeZrN Films: Magnetic and Mechanical Properties Relative to the Phase-Structural State. Materials 2022, 15, 137. [Google Scholar] [CrossRef]
  7. Sheftel, E.N.; Tedzhetov, V.A.; Harin, E.V.; Usmanova, G.S. Films with nanocomposite structure αFe(N) + ZrN for soft magnetic applications. Thin Solid Films 2022, 748, 139146. [Google Scholar] [CrossRef]
  8. Sheftel, E.N.; Harin, E.V.; Tedzhetov, V.A.; Kiryukhantsev-Korneev, P.V.; Rozanov, K.N.; Bobrovskii, S.Y.; Zezyulina, P.A. FeTiB film materials: Dependence of the magnetic properties and magnetic structure on the phase and structural states. J. Magn. Magn. Mater. 2022, 561, 169700. [Google Scholar] [CrossRef]
  9. Sheftel, E.N.; Harin, E.V.; Bobrovskii, S.Y.; Rozanov, K.N.; Tedzhetov, V.A.; Bannykh, I.O.; Kiryukhantsev-Korneev, P.V. FeTiB nanocrystalline films: Static and dynamic magnetic properties in accordance with phase composition and magnetic structure. J. Alloys Compd. 2023, 968, 171981. [Google Scholar] [CrossRef]
  10. Tanaka, K.; Saito, T. Phase Equilibria in TiB2-Reinforced High Modulus Steel. J. Phase Equilibria 1999, 20, 207–214. [Google Scholar] [CrossRef]
  11. Raghavan, V. B-Fe-Ti (Boron-Iron-Titanium). J. Phase Equilibria 2003, 24, 455–456. [Google Scholar] [CrossRef]
  12. Sheng, H.W.; Luo, W.K.; Alamgir, F.M.; Bai, J.M.; Ma, E. Atomic packing and short-to-medium-range order in metallic glasses. Nature 2006, 439, 419–425. [Google Scholar] [CrossRef]
  13. Kelton, K.F.; Lee, G.W.; Gangopadhyay, A.K.; Hyers, R.W.; Rathz, T.J.; Rogers, J.R.; Robinson, M.B.; Robinson, D.S. First X-ray scattering studies on electrostatically levitated metallic liquids: Demonstrated influence of local icosahedral order on the nucleation barrier. Phys. Rev. Lett. 2003, 90, 195504. [Google Scholar] [CrossRef]
  14. Grundy, P.J. The structure and magnetic properties of amorphous magnetic thin films. J. Magn. Magn. Mater. 1980, 21, 1–23. [Google Scholar] [CrossRef]
  15. He, J.; Kaban, I.; Mattern, N.; Song, K.; Sun, B.; Zhao, J.; Kim, D.H.; Eckert, J.; Greer, A.L. Local microstructure evolution at shear bands in metallic glasses with nanoscale phase separation. Sci. Rep. 2016, 6, 25832. [Google Scholar] [CrossRef]
  16. Ichitsubo, T.; Matsubara, E.; Yamamoto, T.; Chen, H.S.; Nishiyama, N.; Saida, J.; Anazawa, K. Microstructure of fragile metallic glasses inferred from ultrasound-accelerated crystallization in Pd-based metallic glasses. Phys. Rev. Lett. 2005, 95, 245501. [Google Scholar] [CrossRef]
  17. Fan, C.; Liu, C.T.; Chen, G.; Chen, G.; Liaw, P.K.; Yan, H.G. Effect of molten quenching temperature on glass-forming ability of nanoquasi-crystal-forming Zr-based metallic glasses. Scr. Mater. 2013, 68, 534–537. [Google Scholar] [CrossRef]
  18. Mattern, N.; Bednarčik, J.; Pauly, S.; Wang, G.; Das, J.; Eckert, J. Structural evolution of Cu–Zr metallic glasses under tension. Acta Mater. 2009, 57, 4133–4139. [Google Scholar] [CrossRef]
  19. Michalik, S.; Michalikova, J.; Pavlovic, M.; Sovak, P.; Liermann, H.-P.; Miglierini, M. Structural modifications of swift-ion-bombarded metallic glasses studied by high-energy X-ray synchrotron radiation. Acta Mater. 2014, 80, 309–316. [Google Scholar] [CrossRef]
  20. Fan, C.; Liu, C.T.; Chen, G.; Liaw, P.K. Quantitatively defining free-volume, interconnecting-zone and cluster in metallic glasses. Intermetallics 2015, 57, 98–100. [Google Scholar] [CrossRef]
  21. Yang, R.; Zuo, X. Synchrotron X-ray and Neutron Diffraction, Total Scattering, and Small-Angle Scattering Techniques for Rechargeable Battery Research. Small Methods 2018, 2, 1800064. [Google Scholar] [CrossRef]
  22. Zhang, Y.D.; Budnick, J.I.; Ford, J.C.; Hines, F.H. Some applications of NMR to the study of magnetically-ordered materials with emphasis on the short-range order in (Fe-B)-based crystalline and amorphous alloys. J. Mang. Magn. Mater. 1991, 100, 13–37. [Google Scholar] [CrossRef]
  23. Tang, X.P.; Geyer, U.; Busch, R.; Johnson, W.L.; Wu, Y. Diffusion mechanisms in metallic supercooled liquids and glasses. Nature 1999, 402, 160–162. [Google Scholar] [CrossRef]
  24. Miller, M.K.; Shen, T.D.; Schwarz, R.B. Atom probe studies of metallic glasses. J. Non-Cryst. Solids 2003, 317, 10–16. [Google Scholar] [CrossRef]
  25. Gorshenkov, M.V.; Glezer, A.M.; Korchuganova, O.A.; Aleev, A.A.; Shurygina, N.A. Effect of γ-(Fe,Ni) crystal-size stabilization in Fe–Ni–B amorphous ribbon. Phys. Met. Metallogr. 2017, 118, 176–182. [Google Scholar] [CrossRef]
  26. Bozorth, R.M. Ferromagnetism; Translated into Russian; Wiley-IEEE Press: Piscataway, NJ, USA, 1993; 992p. [Google Scholar]
  27. Sheftel, E.N.; Tedzhetov, V.A.; Kiryukhantsev-Korneev, F.V.; Harin, E.V.; Usmanova, G.S.; Zhigalina, O.M. Investigation of the Processes of the Formation of a Nonequilibrium Phase-Structural State in FeTiB Films Obtained by Magnetron Sputtering. Russ. J. Non-Ferr. Met. 2020, 61, 753–761. [Google Scholar] [CrossRef]
  28. Shelekhov, E.V.; Sviridova, T.A. Programs for X-ray analysis of polycrystals. Metal Sci. Heat Treat. 2000, 42, 309–313. [Google Scholar] [CrossRef]
  29. Wang, Y.; Murase, K. Short- and Medium-Range Order in Ge-(S,Se) Glasses Using Raman Scattering. In Properties and Applications of Amorphous Materials; NATO Science Series; Thorpe, M.F., Tichý, L., Eds.; Springer: Dordrecht, The Netherlands, 2001; Volume 9, pp. 13–24. [Google Scholar] [CrossRef]
  30. Abrosimova, G.E.; Aronin, A.S. Evolution of the amorphous-phase structure in metal–metal type metallic glasses. J. Surf. Investig. X-ray Synchrotron Neutron Tech. 2015, 9, 887–893. [Google Scholar] [CrossRef]
  31. Warren, B.E. X-ray Diffraction; Addison-Wesley Publishing Company: Reading, MA, USA, 1969; 230p. [Google Scholar]
  32. Sheftel’, E.N.; Blinova, E.N.; Usmanova, G.S.; Bannykh, O.A.; Glezer, A.M.; Krikunov, A.I. Electron-Microscopic Study of the Structure of Films of Soft Magnetic Alloy Fe-8 at. % Zr-N. Phys. Met. Metallogr. 2001, 91, 482–485. [Google Scholar]
  33. Makino, A.; Yamamoto, Y.; Hirotsu, Y.; Inoue, A.; Masumoto, T. Microstructure of nanocrystalline b.c.c. FeMB(M = Nb, Hf) soft magnetic alloys. Mater. Sci. Eng. 1994, A179–180, 495–500. [Google Scholar] [CrossRef]
  34. Makino, A.; Suzuki, K.; Inoue, A.; Hirotsu, Y.; Masumoto, T. Magnetic properties and microstructure of nanocrystalline bcc Fe-M-B (M = Zr, Hf, Nb) alloys. J. Magn. Magn. Mater. 1994, 133, 329–333. [Google Scholar] [CrossRef]
  35. Makino, A.; Yoshida, S.; Masumoto, T. Microstructure and magnetic properties of nanocrystalline bcc Fe-Nb-B soft magnetic alloys. IEEE Trans. Magn. 1994, 30, 4848–4850. [Google Scholar] [CrossRef]
  36. Makino, A.; Inoue, A.; Masumoto, T. Soft magnetic properties of nanocrystalline Fe-M-B(M = Zr, Hf, Nb) alloys with high magnetization. Nanostructured Mater. 1995, 6, 985–988. [Google Scholar] [CrossRef]
  37. Makino, A.; Inoue, A.; Masumoto, T. Nanocrystalline soft-magnetic Fe-M-B (M = Zr, Hf, Nb) alloys produced by crystallization of amorphous phase. Mater. Trans. JIM 1995, 36, 924–938. [Google Scholar] [CrossRef]
  38. Makino, A.; Hatanai, T.; Inoue, A.; Masumoto, T. Nanocrystalline soft magnetic Fe-M-B (M = Zr, Hf, Nb) alloys and their applications. Mater. Sci. Eng. 1997, A226–228, 594–602. [Google Scholar] [CrossRef]
  39. Makino, A.; Bitoh, T.; Kojima, A.; Inoue, A.; Masumoto, T. Magnetic properties of zero-magnetostrictive nanocrystalline Fe-Zr-Nb-B soft magnetic alloys with high magnetic induction. J. Magn. Magn. Mater. 2000, 215–216, 288–292. [Google Scholar] [CrossRef]
  40. Makino, A.; Bitoh, T.; Kojima, A.; Inoue, A.; Masumoto, T. Compositional dependence of the soft magnetic properties of the nanocrystalline Fe-Zr-Nb-B alloys with high magnetic flux density. J. Appl. Phys. 2000, 87, 7100–7102. [Google Scholar] [CrossRef]
  41. Zhang, Y.D.; Budnick, J.I.; Ford, J.C.; Hines, W.A.; Sanches, F.H. Crystallization of Fe-B amorphous alloys: A NMR and X-ray study. J. Appl. Phys. 1987, 61, 3231–3233. [Google Scholar] [CrossRef]
  42. Pokatilov, V.; Djakonova, N. Experimental evidences of clusters with different short range order in amorphous alloys. Hyperfine Interact. 1990, 59, 525–528. [Google Scholar] [CrossRef]
  43. Pokatilov, V.S.; Pokatilov, V.V.; D‘yakonova, N.B. Local structure of amorphous and microcrystalline Fe-B alloys. Bull. Russ. Acad. Sci. Phys. 2007, 71, 1589–1591. [Google Scholar] [CrossRef]
  44. Pokatilov, V.S. NMR study of rapidly quenched crystalline and amorphous Fe-B alloys. Phys. Solid State 2007, 49, 2217–2222. [Google Scholar] [CrossRef]
  45. Pokatilov, V.S. 57Fe NMR study of amorphous and rapidly quenched crystalline Fe-B alloys. Phys. Solid State 2009, 51, 143–149. [Google Scholar] [CrossRef]
  46. Pokatilov, V.; Dmitrieva, T. Short range order in amorphous ferromagnetic Fe–B alloys. Bull. Russ. Acad. Sci. Phys. 2009, 73, 1094–1097. [Google Scholar] [CrossRef]
  47. Barna, P.B.; Adamik, M. Formation and characterization of the structure of surface coatings. In Protective Coatings and Thin Films; Paleau, Y., Barna, P.B., Eds.; Kluwer Academic: Dordrecht, The Netherlands, 1997; pp. 279–297. [Google Scholar] [CrossRef]
  48. Radnóczi, G.; Barna, P. Formation and Characterization of the Structure of Thin Films and Coatings. In Materials Surface Processing by Directed Energy Techniques; Pauleau, Y., Ed.; Elsevier: Amsterdam, The Netherlands, 2006; pp. 443–474. [Google Scholar] [CrossRef]
  49. Bean, C.P.; Livingston, J.D. Superparamagnetism. J. Appl. Phys. 1959, 30, S120–S129. [Google Scholar] [CrossRef]
  50. Komogortsev, S.V.; Denisova, E.A.; Iskhakov, R.S.; Balaev, A.D.; Chekanova, L.A.; Kalinin, Y.E.; Sitnikov, A.V. Multilayer nanogranular films (Co40Fe40B20)50 (SiO2)50/α-Si:H and (Co40Fe40B20)50(SiO2)50/SiO2: Magnetic properties. J. Appl. Phys. 2013, 113, 17C105. [Google Scholar] [CrossRef]
  51. Suzuki, K.; Fujimori, H.; Hashimoto, K. Materials Science of Amorphous Metals; Masumoto, T., Ed.; Ohm-sha: Tokyo, Japan, 1982; 281p. [Google Scholar]
  52. Handrich, K.; Kobe, S. Amorphe Ferro- und Ferrimagnetika (Amorphous Ferro- and Ferrimagnets); Akademie-Verlag: Berlin, Germany, 1980; 250p. [Google Scholar]
  53. Iskhakov, R.S.; Komogortsev, S.V. Magnetic Microstructure of Amorphous, Nanocrystalline, and Nanophase Ferromagnets. Phys. Met. Metallogr. 2011, 112, 666–681. [Google Scholar] [CrossRef]
  54. Ignatchenko, V.A.; Lskhakov, R.S. Spin waves in a randomly inhomogeneous anisotropic medium. J. Exp. Theor. Phys. 1977, 45, 526–532. [Google Scholar]
  55. Ignatchenko, V.A.; Iskhakov, R.S.; Popov, G.V. Law of approach of the magnetization to saturation in amorphous ferromagnets. J. Exp. Theor. Phys. 1982, 55, 878–886. [Google Scholar]
  56. Chudnovsky, E.M.; Saslow, W.M.; Serota, R.A. Ordering in Ferromagnets with Random Anisotropy. Phys. Rev. B Condens. Matter 1986, 33, 251–261. [Google Scholar] [CrossRef]
  57. Abdallah, A.M.; Awad, R. Influence of Ru dopants on the structural, optical, and magnetic properties of nickel oxide nanoparticles. Phys. B Condens. Matter 2022, 629, 413651. [Google Scholar] [CrossRef]
  58. Amral, V.S.; Sousa, J.B.; Moreira, J.M.; Barbara, B.; Filippi, J. Electrical resistivity and local magnetic order in random anisotropy amorphous ferromagnets. J. Appl. Phys. 1994, 75, 6513–6515. [Google Scholar] [CrossRef]
  59. Zhang, H.; Wang, Y.; Wang, H.; Huo, D.; Tan, W. Room-temperature magnetoresistive and magnetocaloric effect in La1−xBaxMnO3 compounds: Role of Griffiths phase with ferromagnetic metal cluster above Curie temperature. J. Appl. Phys. 2022, 131, 043901. [Google Scholar] [CrossRef]
  60. Wang, Y.; Wang, H.; Tan, W.; Huo, D. Magnetization reversal, critical behavior, and magnetocaloric effect in NdMnO3: The role of magnetic ordering of Nd and Mn moments. J. Appl. Phys. 2022, 132, 183907. [Google Scholar] [CrossRef]
  61. Komogortsev, S.V.; Iskhakov, R.S. Law of approach to magnetic saturation in nanocrystalline and amorphous ferromagnets with improved transition behavior between power-law regimes. J. Magn. Magn. Mater. 2017, 440, 213–216. [Google Scholar] [CrossRef]
  62. Devi, E.C.; Soibam, I. Magnetic properties and law of approach to saturation in Mn-Ni mixed nanoferrites. J. Alloys Comp. 2019, 772, 920–924. [Google Scholar] [CrossRef]
  63. Devi, E.C.; Soibam, I. Tuning the magnetic properties of a ferrimagnet. J. Magn. Magn. Mater. 2019, 469, 587–592. [Google Scholar] [CrossRef]
  64. Fersi, R.; Bezergheanu, A.; Patroi, D.; Cizmas, C.B.; Bessais, L.; Mliki, N. Study of exchange interaction, magnetization correlations and random magnetic anisotropy in nanocrystalline Pr2Co7 films deposited on Si substrate. J. Magn. Magn. Mater. 2020, 494, 165816. [Google Scholar] [CrossRef]
  65. Harin, E.V.; Sheftel, E.N. Micromagnetic structure of soft magnetic nanocrystalline Fe-based films. Phys. Met. Metallogr. 2015, 116, 753–759. [Google Scholar] [CrossRef]
  66. Wei, D. Micromagnetics and Recording Materials; Springer: Berlin/Heidelberg, Germany, 2012. [Google Scholar] [CrossRef]
  67. Iwama, Y.; Takeuchi, M. Spinodal Decomposition in Alnico 8 Magnet Alloy. Trans. Jpn. Inst. Met. 1974, 15, 371–377. [Google Scholar] [CrossRef]
Figure 1. Experimental XRD patterns of glass substrate and the films in the as-deposited and annealed states.
Coatings 14 00475 g001
Figure 2. Difference XRD patterns (symbols) of the Fe73Ti5B19O3 films as (a) deposited and (b) annealed at 500 °C for 1 h states and their approximation (red and green solid curves properly).
Coatings 14 00475 g002
Figure 3. Dark-field images and associated ED patterns taken for the Fe73Ti5B19O3 films (a) as-deposited and (b) after 1 h annealing at 500 °C and Fe55Ti16B27O2 films (c) as-deposited and after annealing at 500 °C for (d) 1 h and (e) 9 h. Insets show grain size distribution obtained by statistical analysis of respective images. (f) Columnar structure of the Fe73Ti5B19O3 films (bright-field image).
Coatings 14 00475 g003
Figure 4. Magnetic hysteresis loops of the (a) Fe73Ti5B19O3 and (b) Fe55Ti16B27O2 films in the as-deposited and annealed at 500 °C states.
Coatings 14 00475 g004
Figure 5. Magnetization dispersion dm = 1 − M/Ms for Fe55Ti16B27O2 film annealed at 500 °C for 9 h. Solid black curve is obtained from Equation (5); red and green lines are asymptotes obtained from relations (1/2)(D1/2Ha/H)2 and (1/2)(D1/2Ha)2/(H1/2HR3/2), respectively.
Coatings 14 00475 g005
Table 1. Reflection parameters obtained by approximation of difference XRD patterns and average grain size determined by XRD analysis (DXRD) and TEM (DTEM).
Chemical
Composition
of Films
Heat Treatment ConditionsNo.
Refl.
i, °βi, °R1, nmR2, nmDXRD,
nm
DTEM,
nm
Fe73Ti5B19O3As-depositedI38 ± 111 ± 20.29 ± 0.091.2
II45 ± 113 ± 10.25 ± 0.011.5
III65 ± 227 ± 140.18 ± 0.260.32 ± 0.48
IV78 ± 114 ± 30.15 ± 0.030.28 ± 0.06
500 °C, 1 hIII59 ± 114 ± 30.19 ± 0.10
Fe55Ti16B27O2As-depositedI36 ± 115 ± 30.30 ± 0.140.7
II45 ± 121 ± 20.25 ± 0.070.9
III64 ± 118 ± 100.18 ± 0.170.32 ± 0.32
IV74 ± 115 ± 50.16 ± 0.070.29 ± 0.13
500 °C, 1 hII48 ± 125 ± 20.23 ± 0.040.80.7
III63 ± 139 ± 20.18 ± 0.060.33 ± 0.10
500 °C, 5 hII45 ± 118 ± 10.25 ± 0.041.1
III61 ± 136 ± 10.19 ± 0.030.34 ± 0.06
500 °C, 9 hII44 ± 128 ± 10.25 ± 0.050.70.7
III62 ± 129 ± 20.19 ± 0.040.34 ± 0.08
Table 2. Static magnetic properties of the Fe73Ti5B19O3 and Fe55Ti16B27O2 films.
Chemical Composition
of Films
Heat Treatment
Conditions
Ms, GHc, OeParameters in Equation (4)
Mw, G2Rc, nm
Fe73Ti5B19O3As-deposited1390 ± 8025 ± 2
500 °C, 1 h1540 ± 9063 ± 3
Fe55Ti16B27O2As-deposited0.3 ± 0.380 ± 104 ± 2.6
500 °C, 1 h120 ± 204 ± 0.4
500 °C, 5 h490 ± 904.2 ± 0.1
500 °C, 9 h380 ± 7012 ± 1
Disclaimer/Publisher’s Note: The statements, opinions and data contained in all publications are solely those of the individual author(s) and contributor(s) and not of MDPI and/or the editor(s). MDPI and/or the editor(s) disclaim responsibility for any injury to people or property resulting from any ideas, methods, instructions or products referred to in the content.

