Abstract
To explore the corrosion of Q235 steel in sand containing a simulated haze aqueous solution (HA solution) under a natural air-dried state, the effect of moisture (age) on the corrosion of Q235 steel in sand was comprehensively studied by EIS, polarization curve, SEM, EDS and XPS. The physical and chemical properties of the sand showed that the sand containing the HA solution was basically neutral under natural air drying, and the temperature was around 20 °C. After 14 days, the moisture content gradually decreased from 30% to 0%, and the salinity decreased from 1.26% to 0.04%. With the increase in age, the Eocp gradually positively skews, indicating the corrosion kinetics of the Q235 steel decrease. The impedance spectra showed that in the frequency of 10−2–103 Hz, the impedance spectra exhibited a flat capacitive loop, and the corrosion of Q235 steel was the strongest in the sand containing HA solution on the 8 d. The polarization curves showed that with increasing age, the degree of corrosion of Q235 steel changed from medium or above to slight corrosion in the sand containing HA solution. The pitting characteristics of anode branch for polarization curve also indicate the faster corrosion kinetics of Q235 steel in the early age (1–5 d). The corrosion current density Io first increased and then decreased, and the highest value was 3.44 × 10⁻⁵ A/cm2 at 6 d. The average corrosion rate was 0.1629 mm/a. HA solution accelerates the corrosion of Q235 steel in sand without HA solution (average corrosion rate, 1.51 × 10⁻² mm/a). A large amount of brown-yellow corrosion products (iron oxides, about 70–200 μm) presented on the surface of the Q235 steel. The corrosion of Q235 steel belonged to local corrosion, and the corrosion pits were connected to form a large dimple-like area. The HA solution and the porous structure of sand jointly affect the electrochemical corrosion of Q235 steel.
1. Introduction
Q235 steel has good plasticity, toughness and weldability and is widely used in construction and engineering structures, such as vehicles, boilers, containers, etc. In addition, before the end of the 1940s, ordinary carbon steel (Q235) was used for pipeline steel [1]. However, the corrosion resistance of Q235 steel is poor, and Q235 steel will suffer corrosion in weakly alkaline, neutral and acidic environments (including the atmosphere, water and soil), which will cause significant losses of economy, resources and energy and threaten the safety of the corresponding grounding infrastructure and personnel. The rapid development of urbanization and industrialization has led to the deterioration of the environment. “Smog weather” usually occurs in winter, but pollutants are present in the air all year round. Fine particulate matter (PM 2.5) in the atmosphere enters the soil with rain, which causes the transformation of soil quality [2,3]. Rainfall, growth absorption, water loss from terrain, and human activities all affect changes in the water content in the soil environment and subsequently affect soil corrosion. In addition, soil corrosion is affected by soil resistivity, soluble salts, water content, pH and the interactions of the factors. The factors often vary with time and space, and they are very complex [4]. Therefore, the rules and mechanism of soil corrosion still need to be further explored and studied.
Soil corrosion is one of the main causes of grounding infrastructure failure, and it is hidden and difficult to detect. Soil is a complex electrolyte system. Water provides soil with an electrolyte [5]. There are many kinds of soil in China, and the corrosion resistances of the same material in different soils are very different. Currently, natural environment corrosion test nets have been built in our country. Particles in sand have no adsorption effect on ions, and the corrosion of metal materials has certain characteristics [6]. Studying the electrochemical corrosion mechanism of Q235 steel in sand under a natural air-dried state (moisture from saturated to dry) is helpful for evaluating the corrosion status of Q235 steel through rainfall or human activities to guide engineering application.
In recent years, the corrosion of Q235 steel in soil environments with different properties [6], such as magnesium chloride polluted sandy silt soil, silt soil containing sodium chloride, sand [7], diatomite soil [8], sodium bentonite [9], bentonite clay [10] and alternating wet and dry soil [11] was studied by electrochemical testing techniques and morphological composition testing techniques. The simulated acid rain heavily increased the corrosion rate of Q235 steel in the acidic soil in Yingtan [12]. The Q235 steel in acidic soil in Singapore was mainly corroded locally and with severe corrosion [13]. The electrochemical characteristics of the sand were analyzed from the characteristics of the interfaces of the three phases, the basic model and the equivalent circuit fitting. In sandy soil (gas, liquid, solid multiphase corrosion system), the cathode distribution on the metal surface depends on the total length of the three phases boundary per unit area (Ltpb), which is an important factor affecting the corrosion behavior [14]. To further explore the influence of pore fluid on the electrochemical corrosion of Q235 steel in sand containing simulated haze aqueous solution (HA solution), the electrochemical corrosion of Q235 steel in sand under a natural air-dried state was studied based on electrochemical theory.
2. Materials and Methods
2.1. Materials
The test employed Xiamen ISO standard sand with a SiO2 content exceeding 98%. The maximum dry density (ρdmax) and minimum dry density (ρdmin) were 1.86 g/cm3 and 1.56 g/cm3, respectively. The grain size accumulation curve shows that the gradation of the sand is discontinuous, but the soil is a good grade of coarse sand, which meets the two conditions of Cu ≥ 5 and Cc = 1–3 at the same time [15]. The composition and content of the HA solution are shown in Table 1. The ratio of SO42−, NO3−, NH4+ and Cl− ions is 5:4:1:2 [16]. Pure water was used in this work. The representative pipeline steel Q235 was selected as the working electrode and was characterized by a low carbon content. The components are shown in Table 2. The samples were Q235 steel sheets with dimensions of Φ15 mm × 2 mm. The samples were successively polished with #360, #800 and #1500 SiC sandpapers before testing and subsequently blown dry after ultrasonic cleaning in an acetone solution for 10 min. Afterwards, a working area of 1 cm2 was left on the surface of the working electrode through wax sealing. The electrolytic cell was a rubber soil sample box with an internal volume of 70.7 × 70.7 × 70.7 mm3. The weight of the sand soil was 300 g and the initial weight of the water was 90 g. The precision of the Libra was 0.01.

Table 1.
Composition and content of the simulated haze aqueous solution (HA solution).
Table 2.
Chemical composition of Q235 steel (wt.%).
2.2. Methods
The initial water content was 30% (saturated state), and the test ages were 1 d, 2 d, 3 d, …, until the sand was air-dried. The electrochemical impedance spectra and polarization curves of the Q235 steel in sand were obtained by an electrochemical workstation (CS350H, Wuhan Corrtest Instruments Corp., Ltd., Wuhan, China). A Q235 steel electrode (WE, working electrode), saturated calomel electrode SCE (RE, reference electrode) and titanium mesh (CE, counter electrode) were, respectively, the three electrodes. The open-circuit potential (OCP) was measured for 20 min. Electrochemical impedance spectra were tested under the condition of an AC amplitude of 5 mV and scanning frequency of 10−2–105 Hz. The potentiodynamic polarization test was proceeded under the parameters of a potential range of −1–2 V near the open-circuit potential and a scanning rate of 3 mV/s. The temperature, moisture, salinity and pH of the sand were tested by soil meter (FK-WSYP). The height of 300 g of sand was 3.5 cm, and the soil was loose. The working electrode was buried in sand at a depth of 2 cm. The properties test height of the sand was consistent with the height of the working electrode [15].
An optical digital microscope (Olympus DSX1000, Tokyo, Japan) was used to study the macroscopic corrosion morphology of the corrosion products. A scanning electron microscope (JSM-6510, Japan Electronics Co., Ltd., Hachioji, Japan) was used to observe the micromorphology of the corrosion products and Q235 steel at magnifications of ×50, ×100, ×200, ×500 and ×1000. An energy spectrometer (GENESIS, EDAX, Mahwah, NJ, USA) and X-ray photoelectron energy spectrometer (Thermo Scientific EscaLab Xi+, Thermo Fisher Scientific, Waltham, MA, USA) were used to test the energy dispersive spectroscopy (EDS) and X-ray photoelectron spectroscopy (XPS) of the corrosion products, respectively. The pickling solution used for cleaning rust was a 1000 mL solution consisting of 500 mL hydrochloric acid (HCl, ρ = 1.19 g/mL), 3.5 g hexamethylenetetramine and distilled water. The temperature was 20–25 °C, and the soaking time was 5–10 min.
3. Results
3.1. Properties of Sand Containing HA Solution
The physical and chemical properties of sand containing the HA solution under a natural air-dried state are shown in Table 3. The pH fluctuated in the scope of 6.34–7.01, and the sand was basically neutral. The temperature also changed by approximately 20 °C.
Table 3.
Physical and chemical properties of sand containing HA solution.
The sand containing the HA solution gradually dries from 30% to 0% within 14 days. The salt gradually decreased from 1.26% to 0.04% within 14 days.
3.2. Open-Circuit Potential of Q235 Steel in Sand Containing HA Solution
Figure 1 presents the open-circuit potential (Eocp) of Q235 steel in sand containing HA solution under natural air drying. It is stable with time. With the increase in age, that is, the decrease in moisture content in the sand, the Eocp of Q235 steel in sand gradually-positively skews.
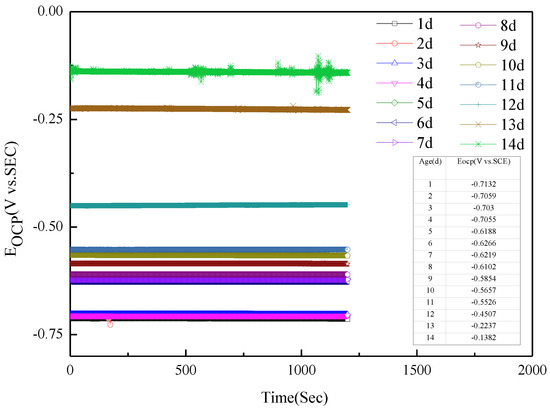
Figure 1.
Open circuit potential of Q235 steel in sand containing HA solution: 1–14 d.
3.3. Electrochemical Impedance Spectra of Q235 Steel in Sand Containing HA Solution
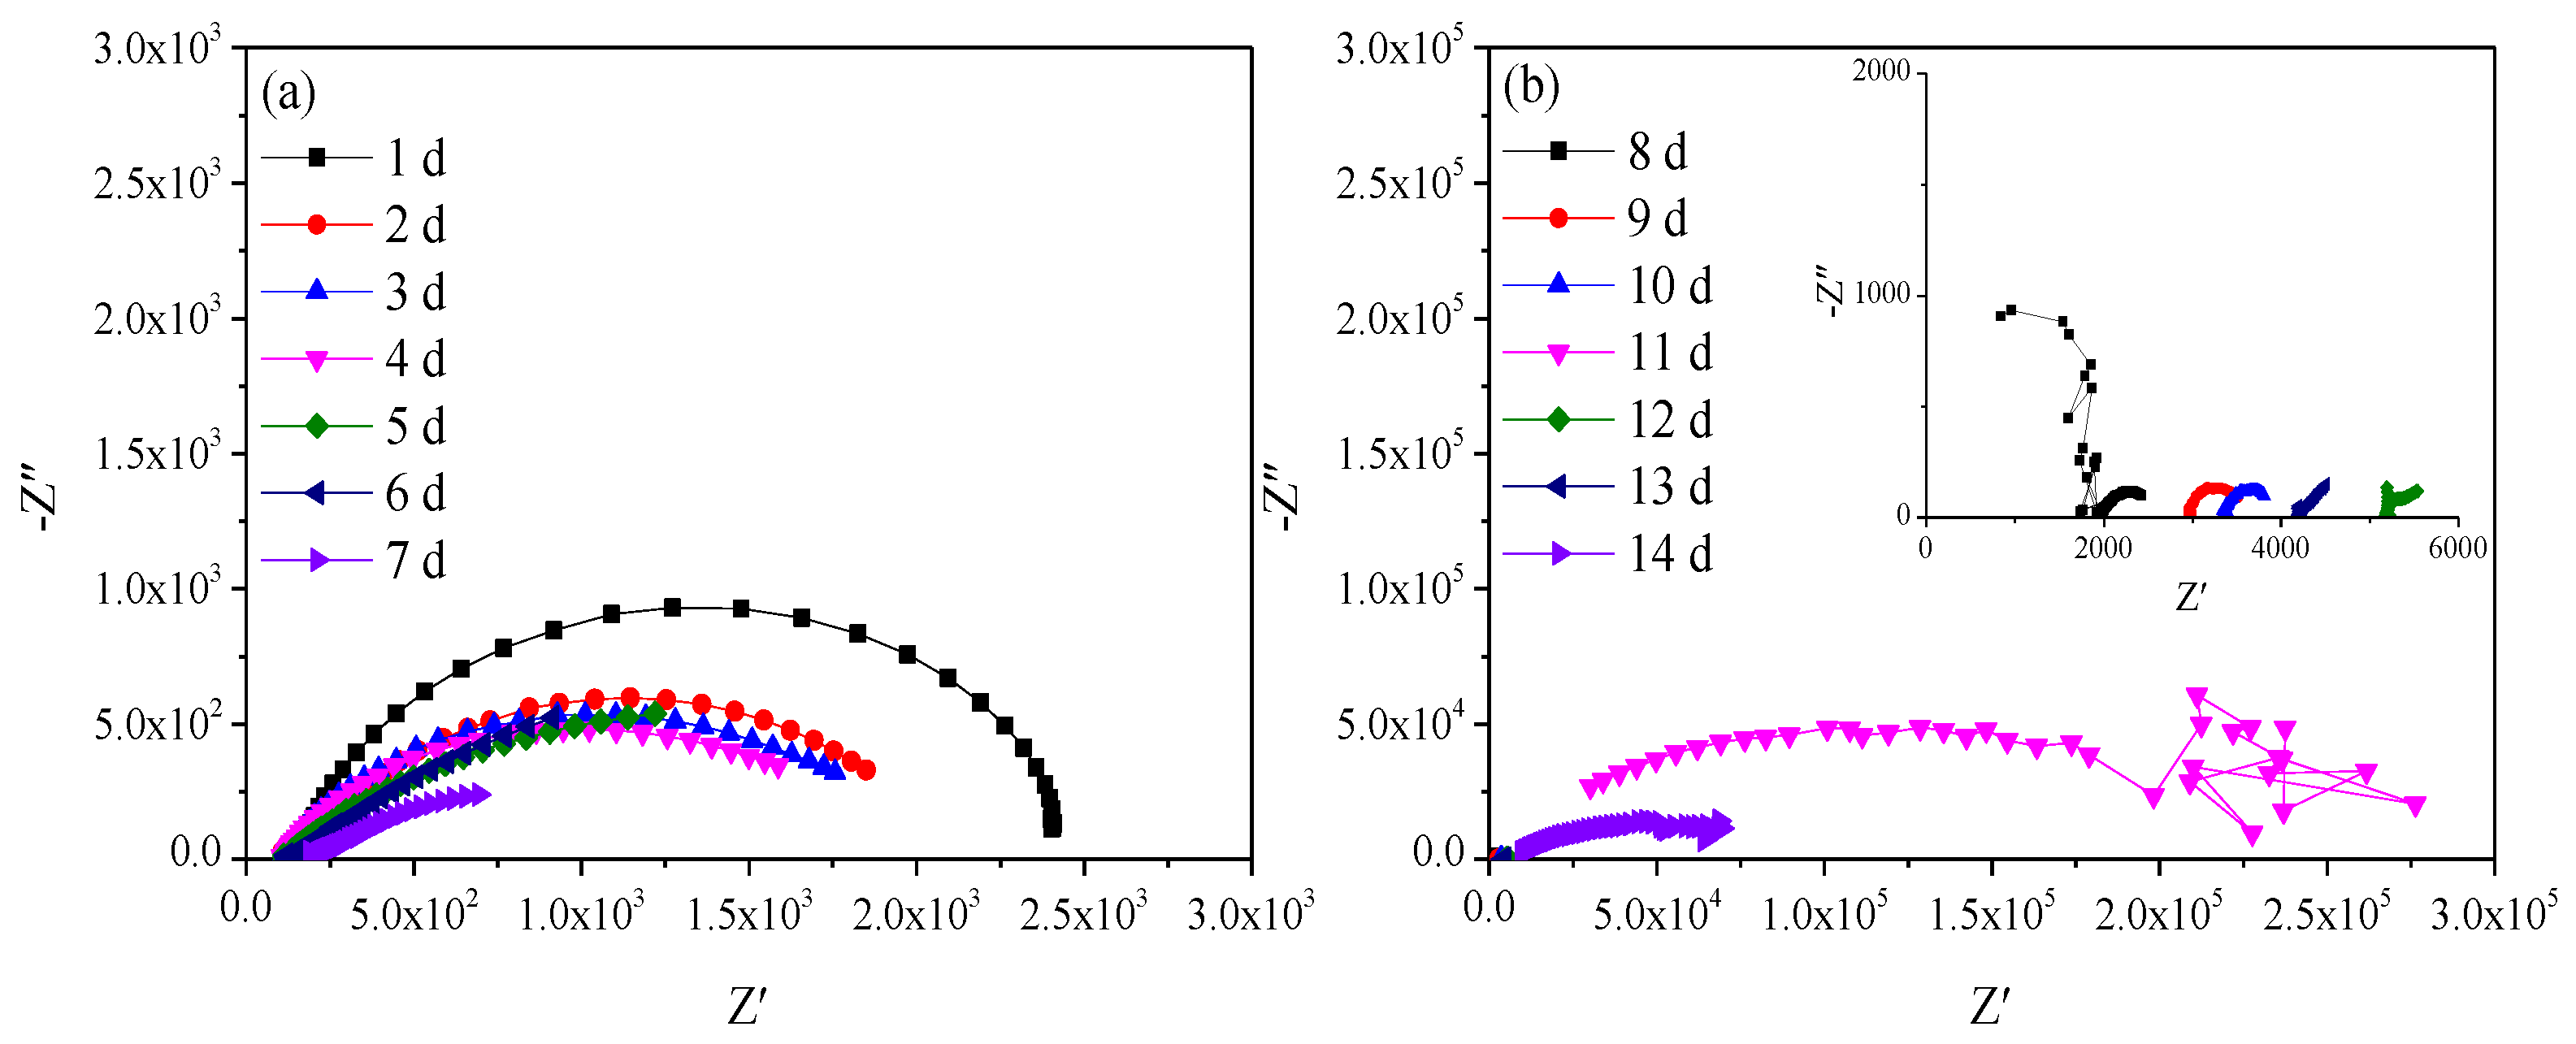
Figure 2 shows the Nyquist diagrams of Q235 steel in sand containing HA solution in the natural air-dried state. With the increasing age, that is, decreasing moisture content, the impedance spectra fluctuate greatly in the frequency area of 103–106 Hz after 8 days. The parts with large fluctuations are not presented and analyzed here. In the frequency area of 10−2–103 Hz, the impedance spectra present a flat capacitive loop, the intersection point with the real axis shifts to the left, and the radius of the capacitive loop decreases first and then increases.
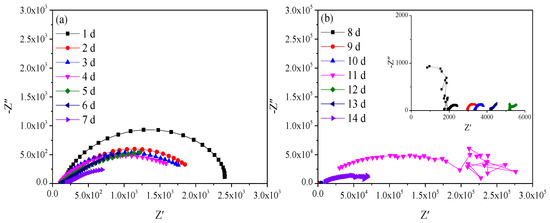
Figure 2.
Nyquist diagram of Q235 steel in sand containing HA solution: (a) 1 d–7 d; (b) 8 d–14 d.
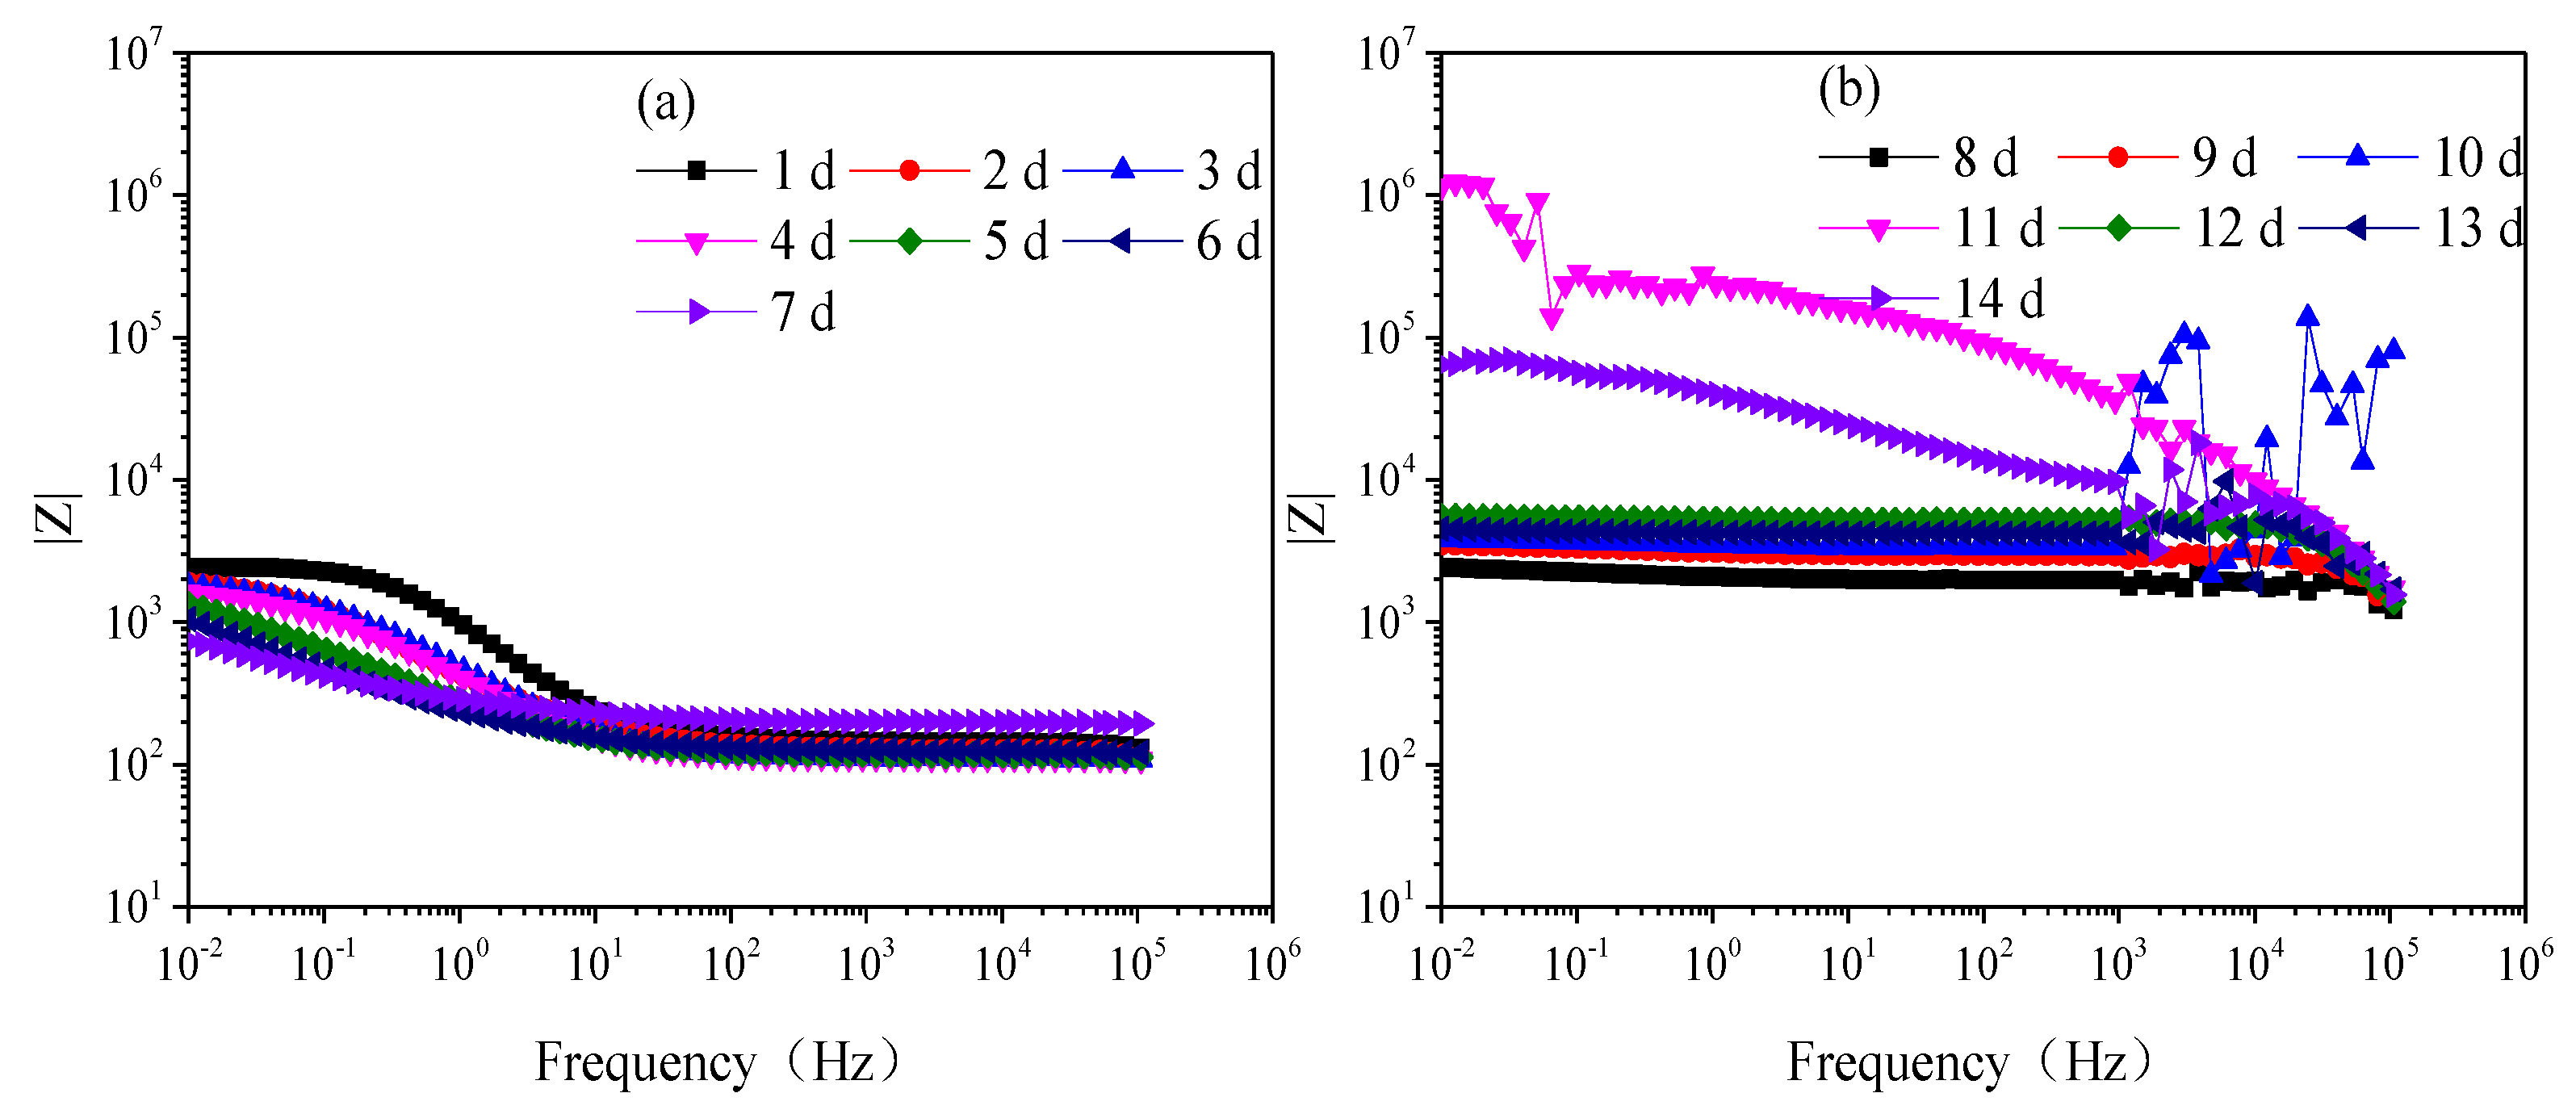
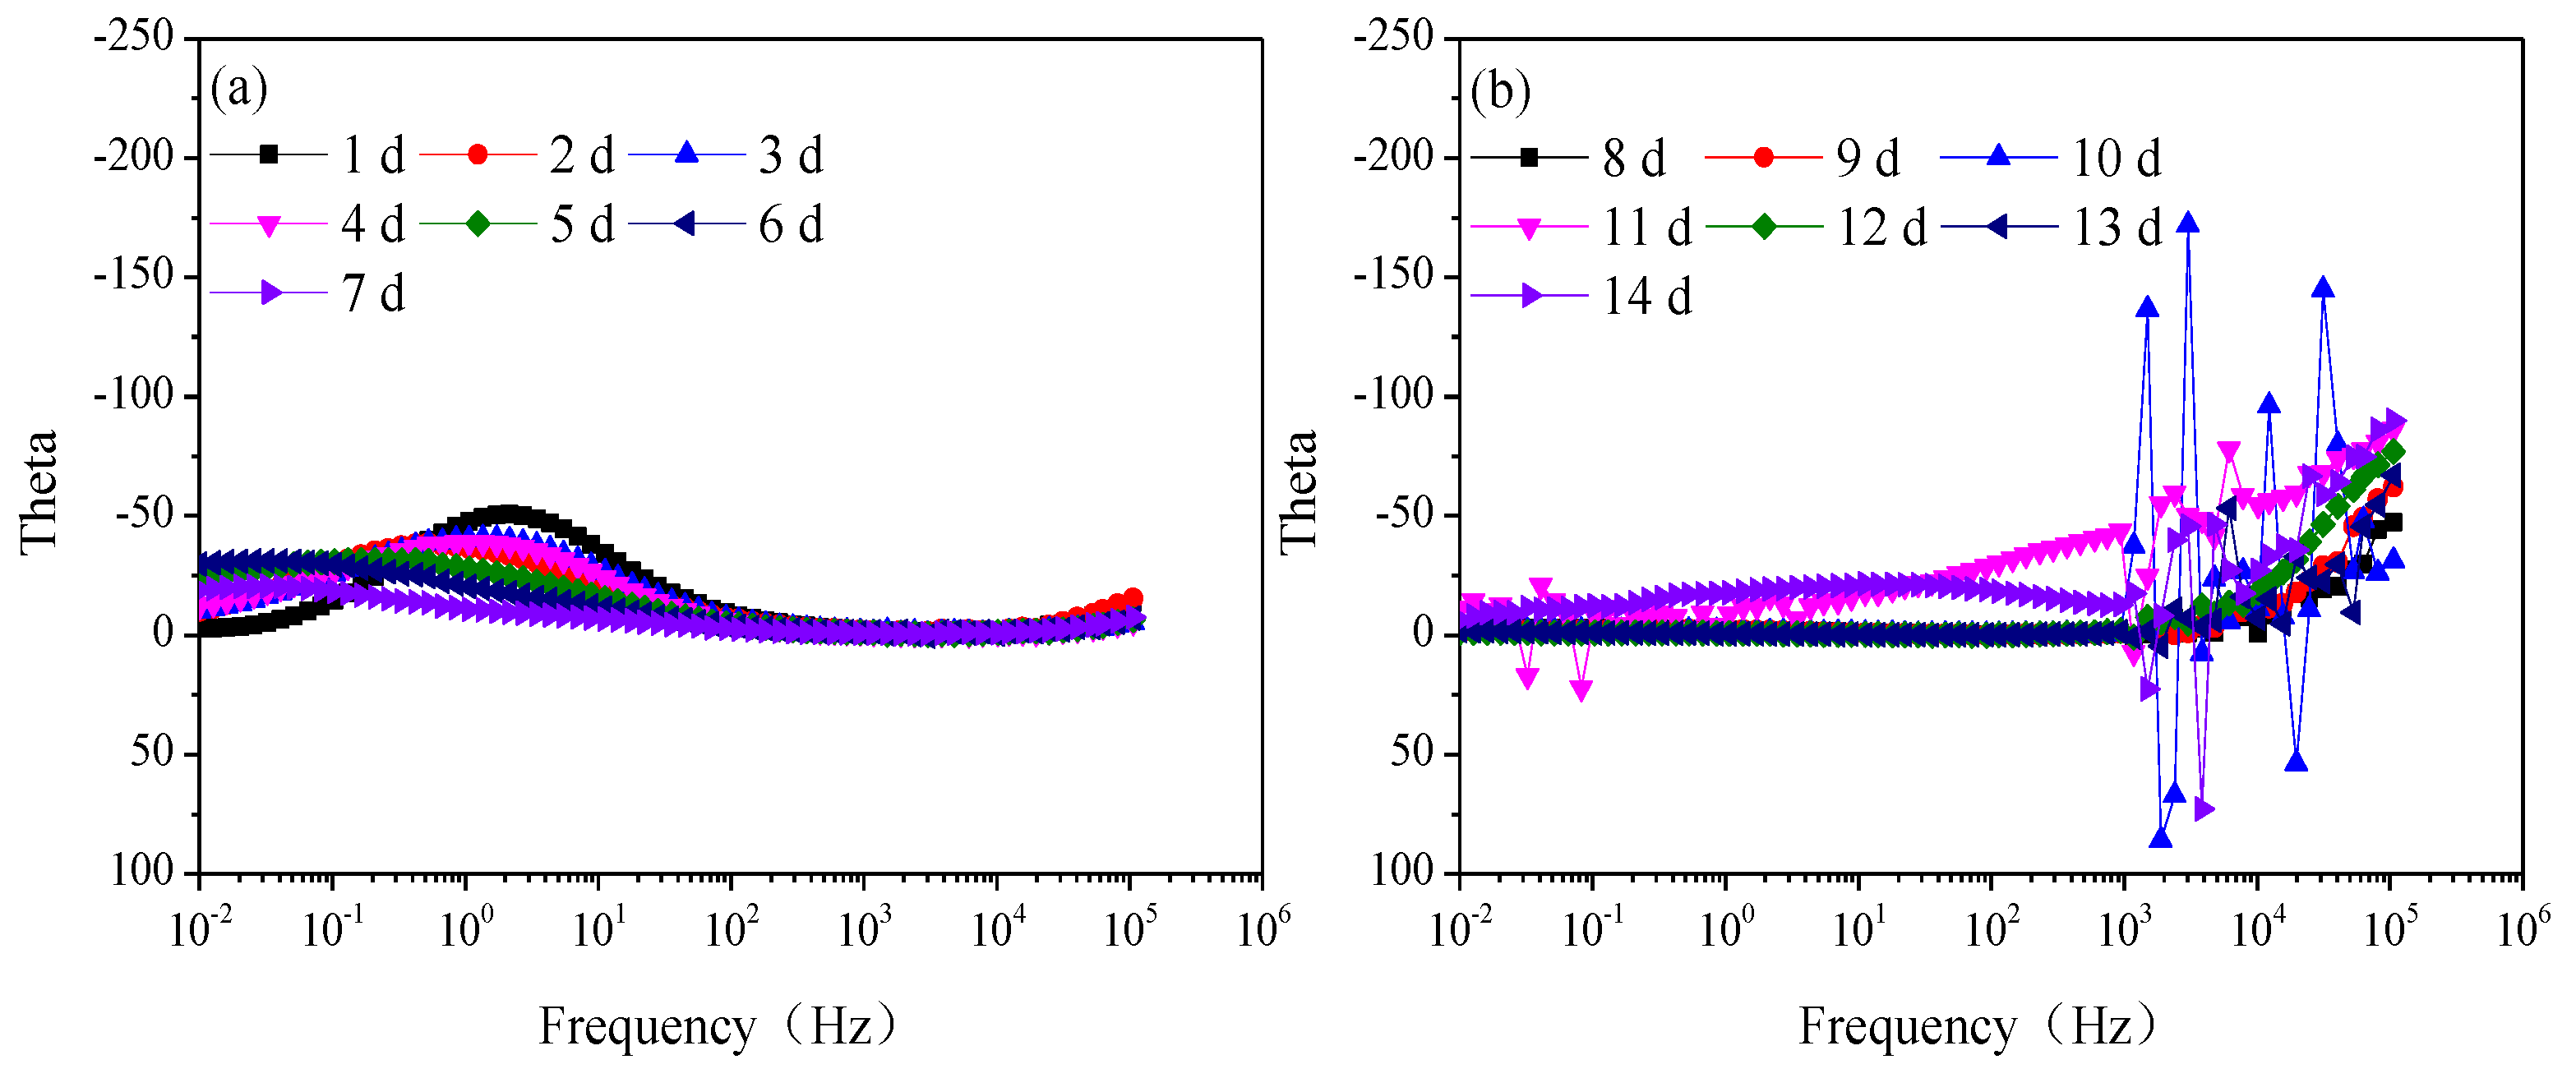
Figure 3 is the modulus value and Figure 4 is the phase angle of Q235 steel in natural HA-containing sand. The impedance spectra are not the type of onetime constant, which is consistent with the impedance spectra. After 8 d, the impedance spectra fluctuate greatly in the frequency range of 103–106 Hz.
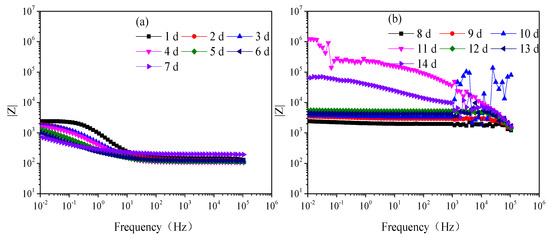
Figure 3.
Modulus of Q235 steel in sand containing HA solution: (a) 1 d–7 d; (b) 8 d–14 d.
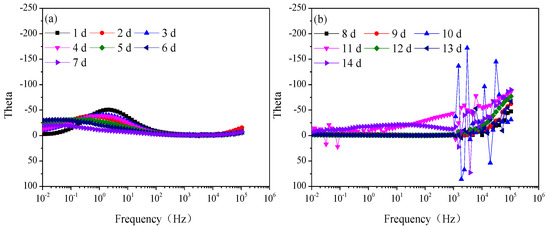
Figure 4.
Phase angle of Q235 steel in sand containing HA solution: (a) 1 d–7 d; (b) 8 d–14 d.
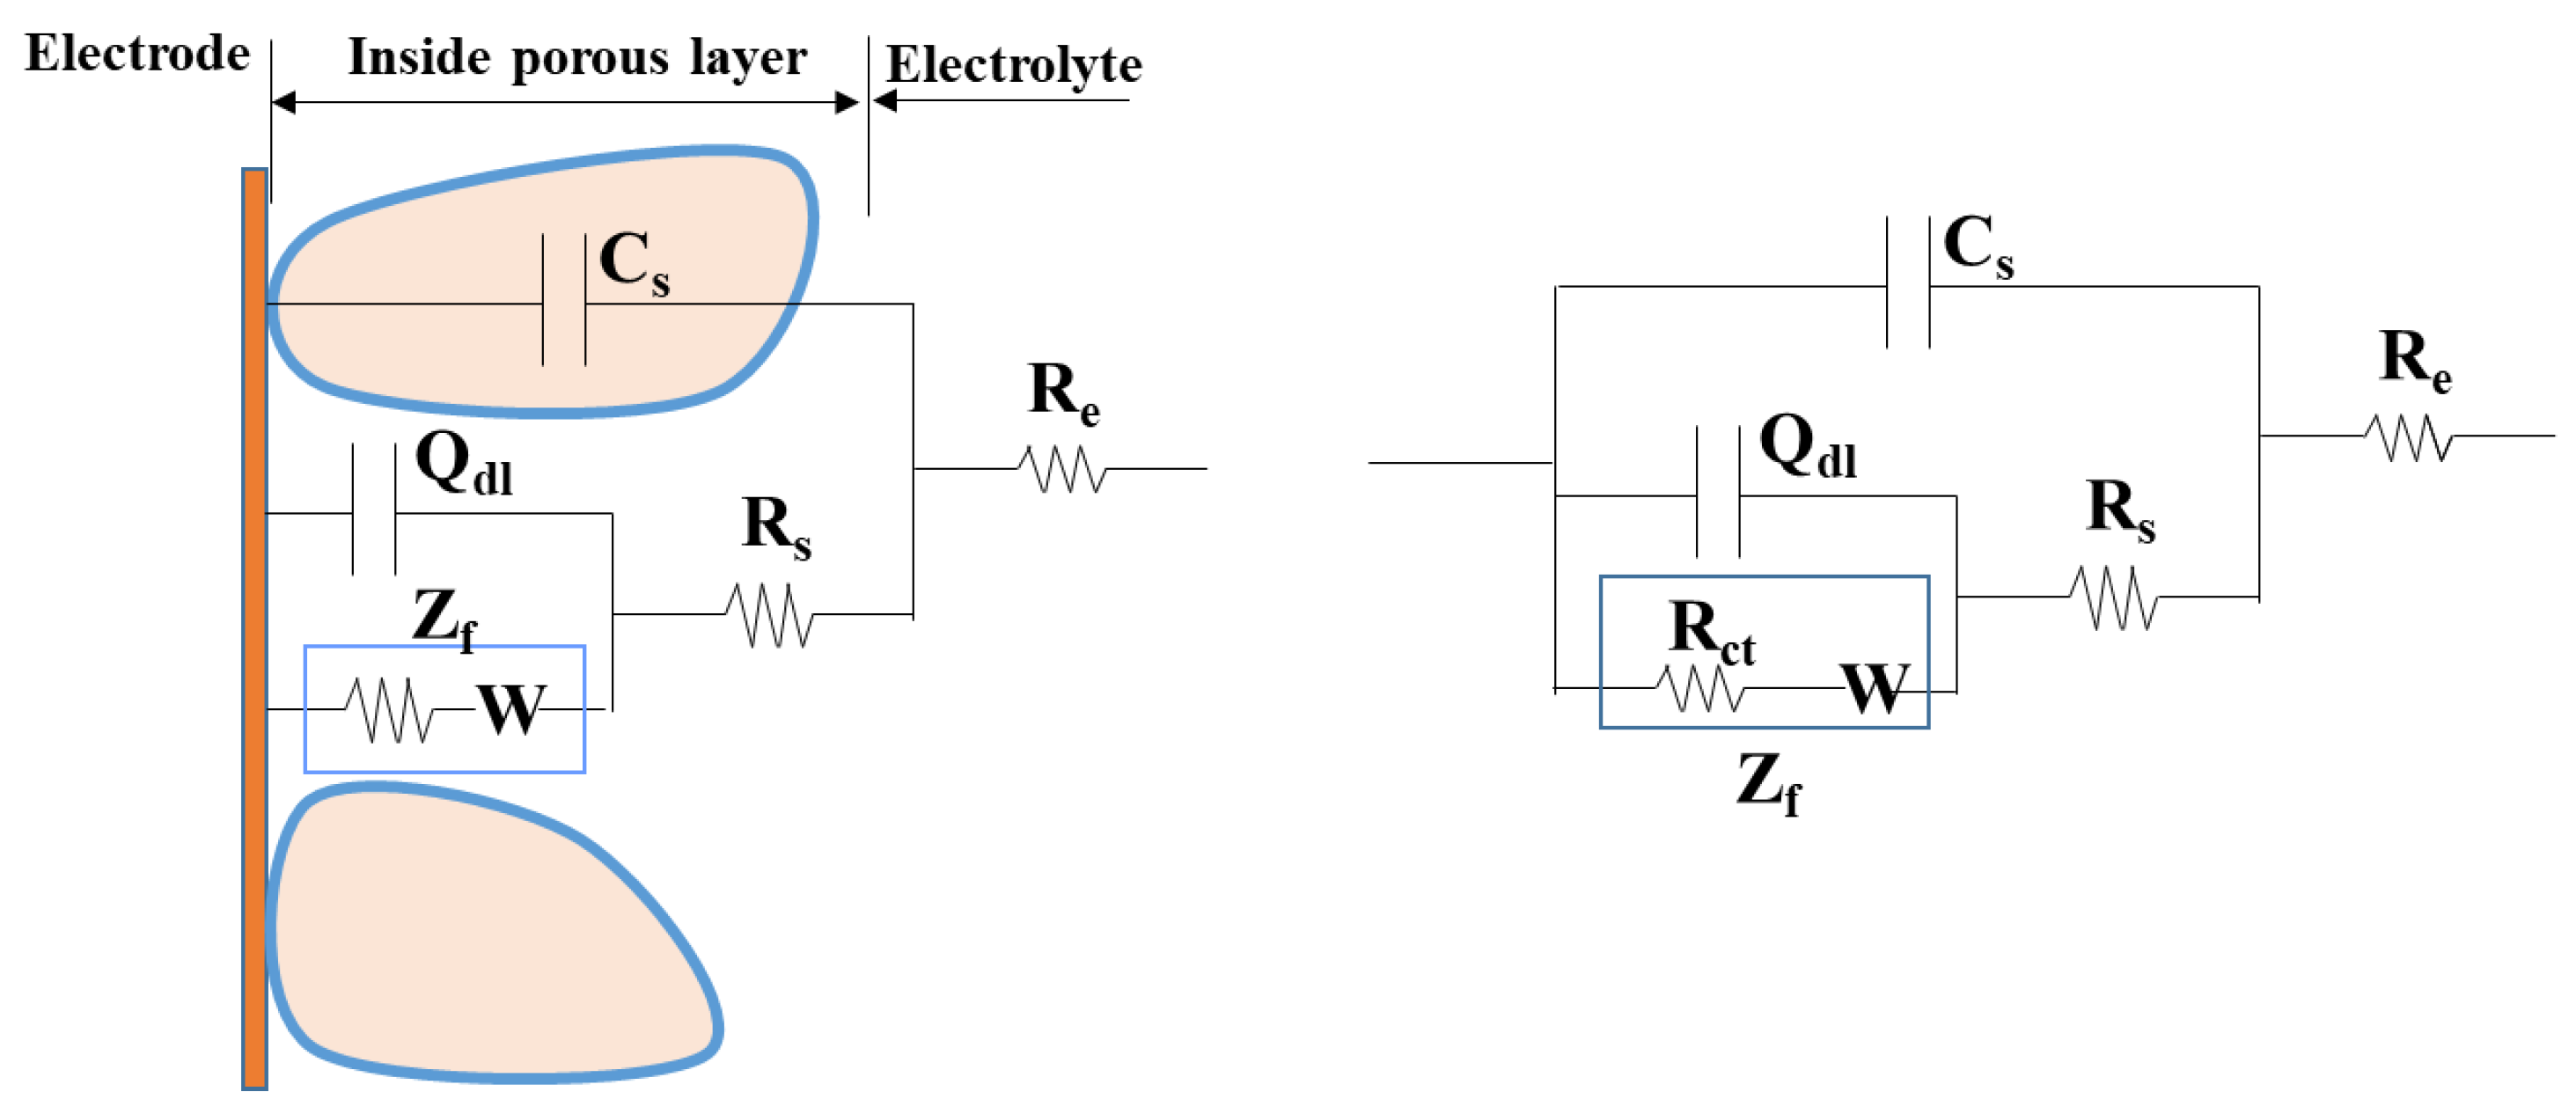
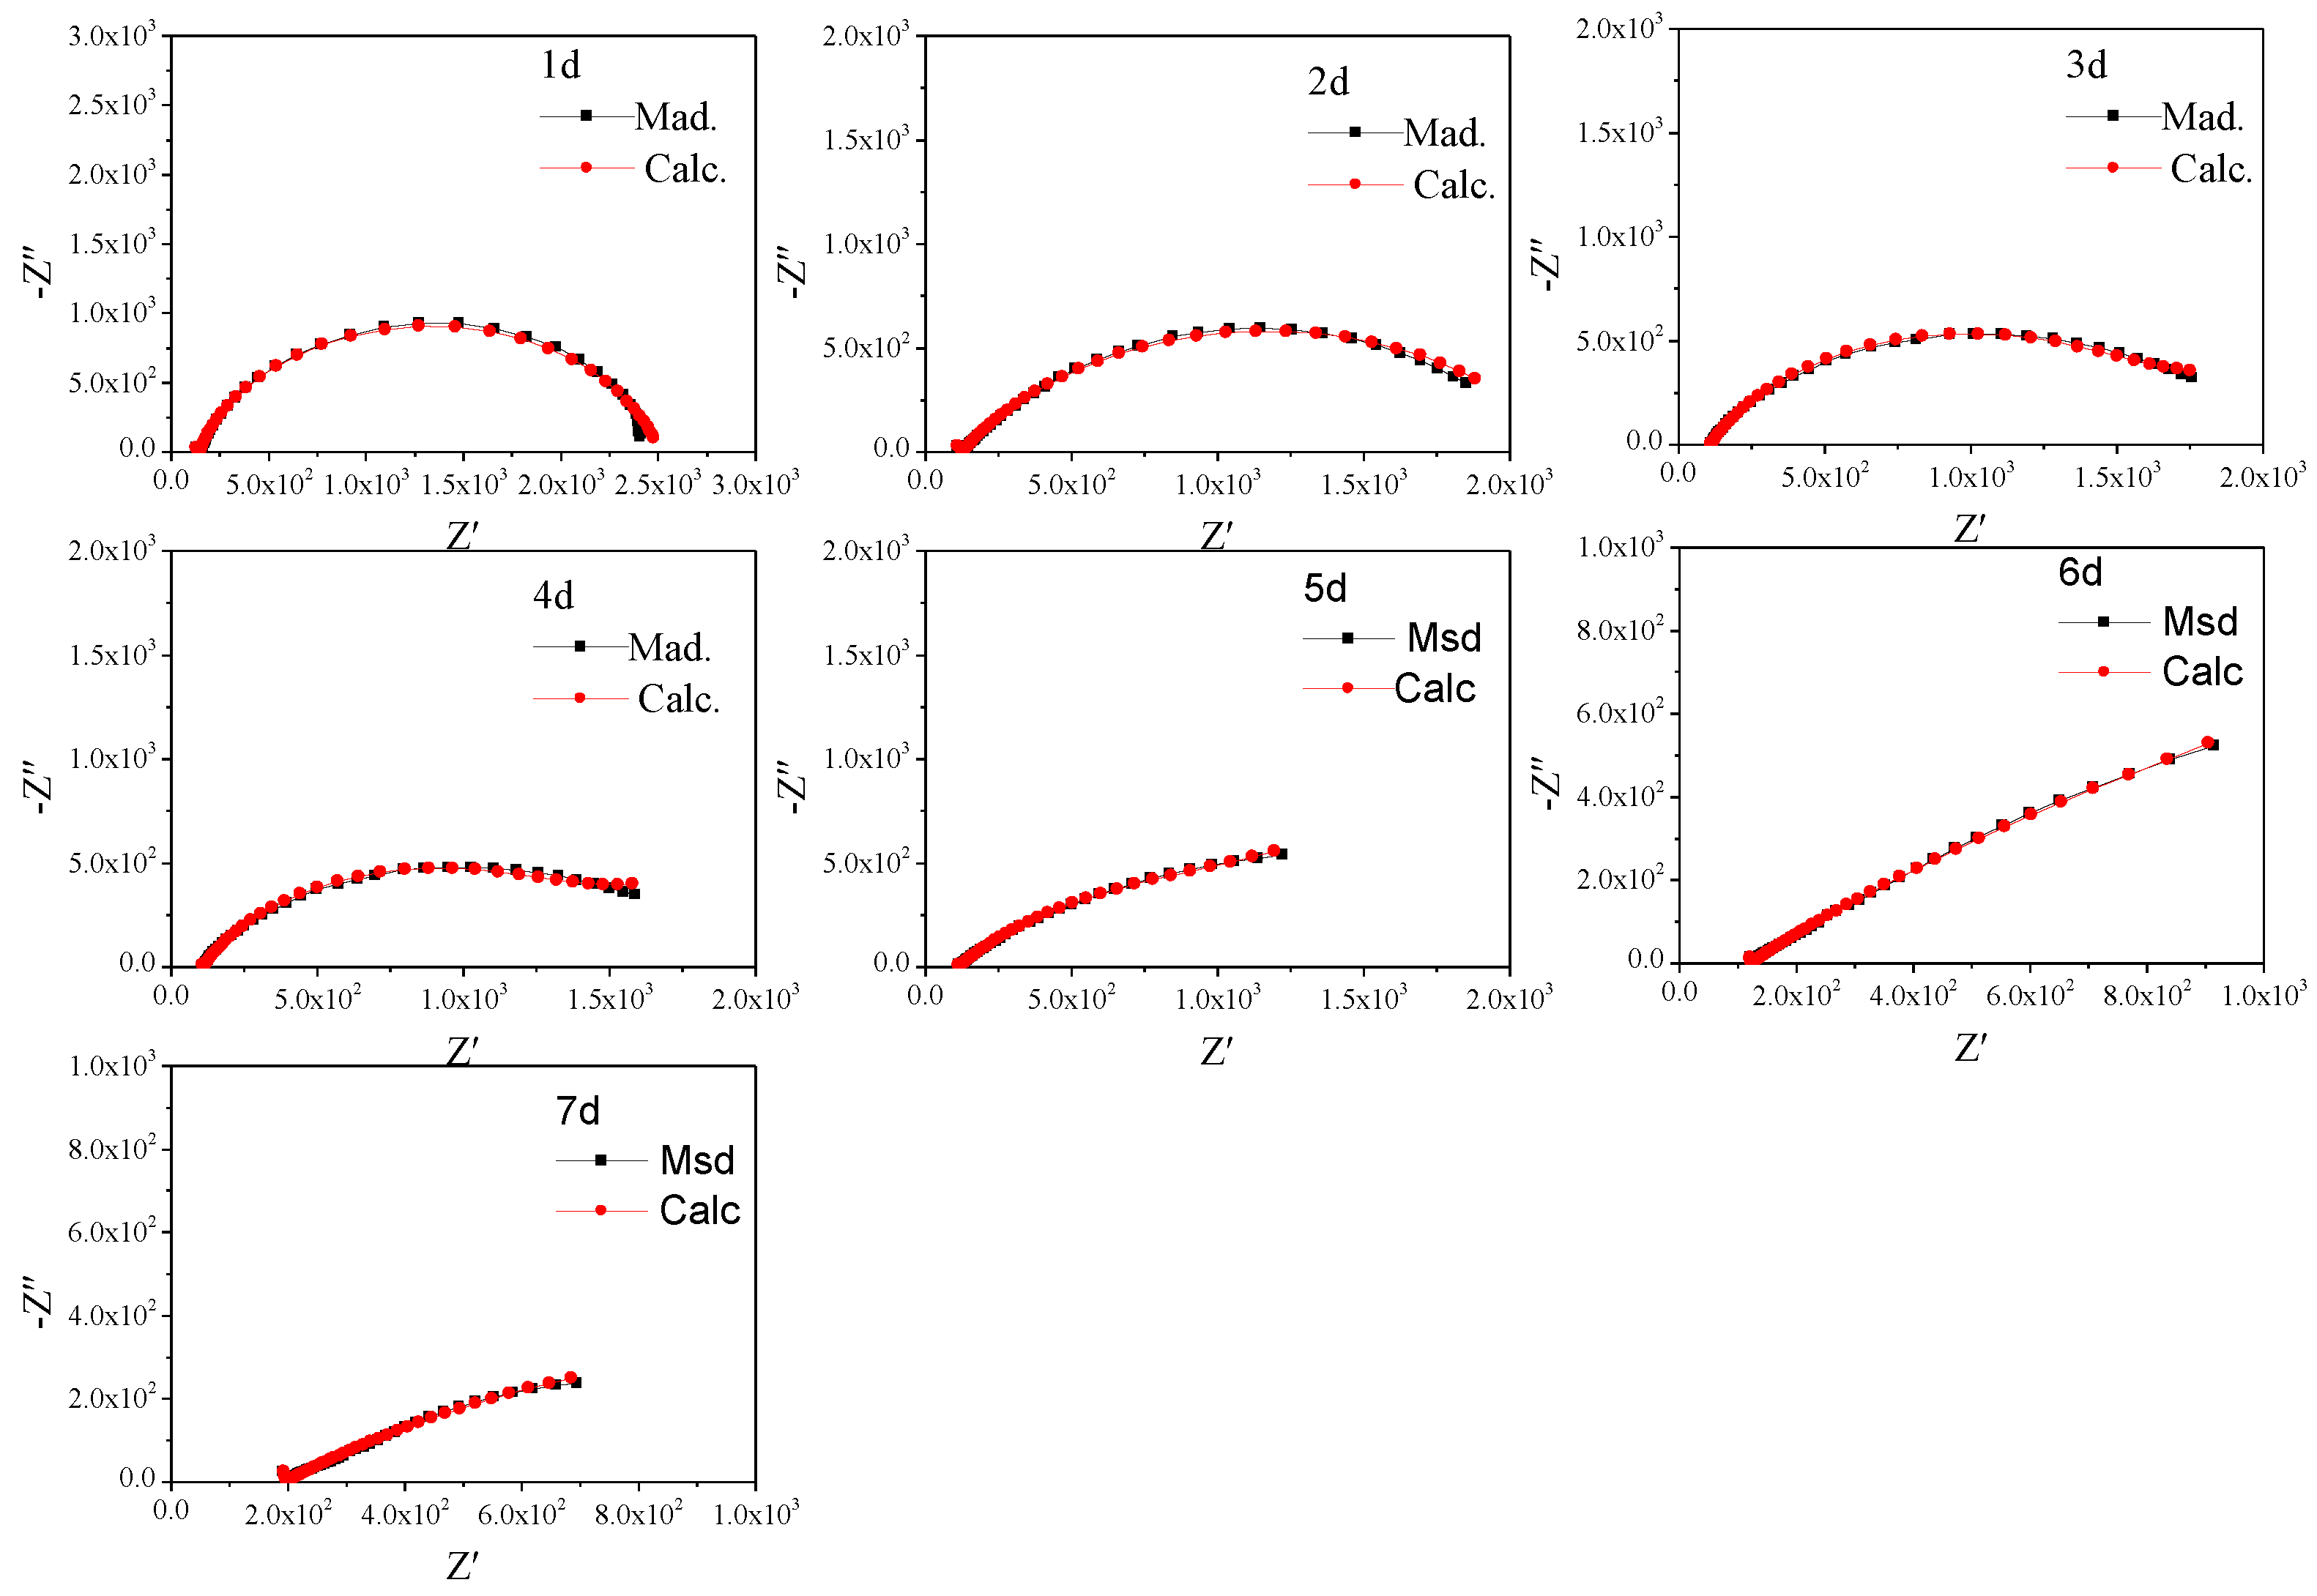
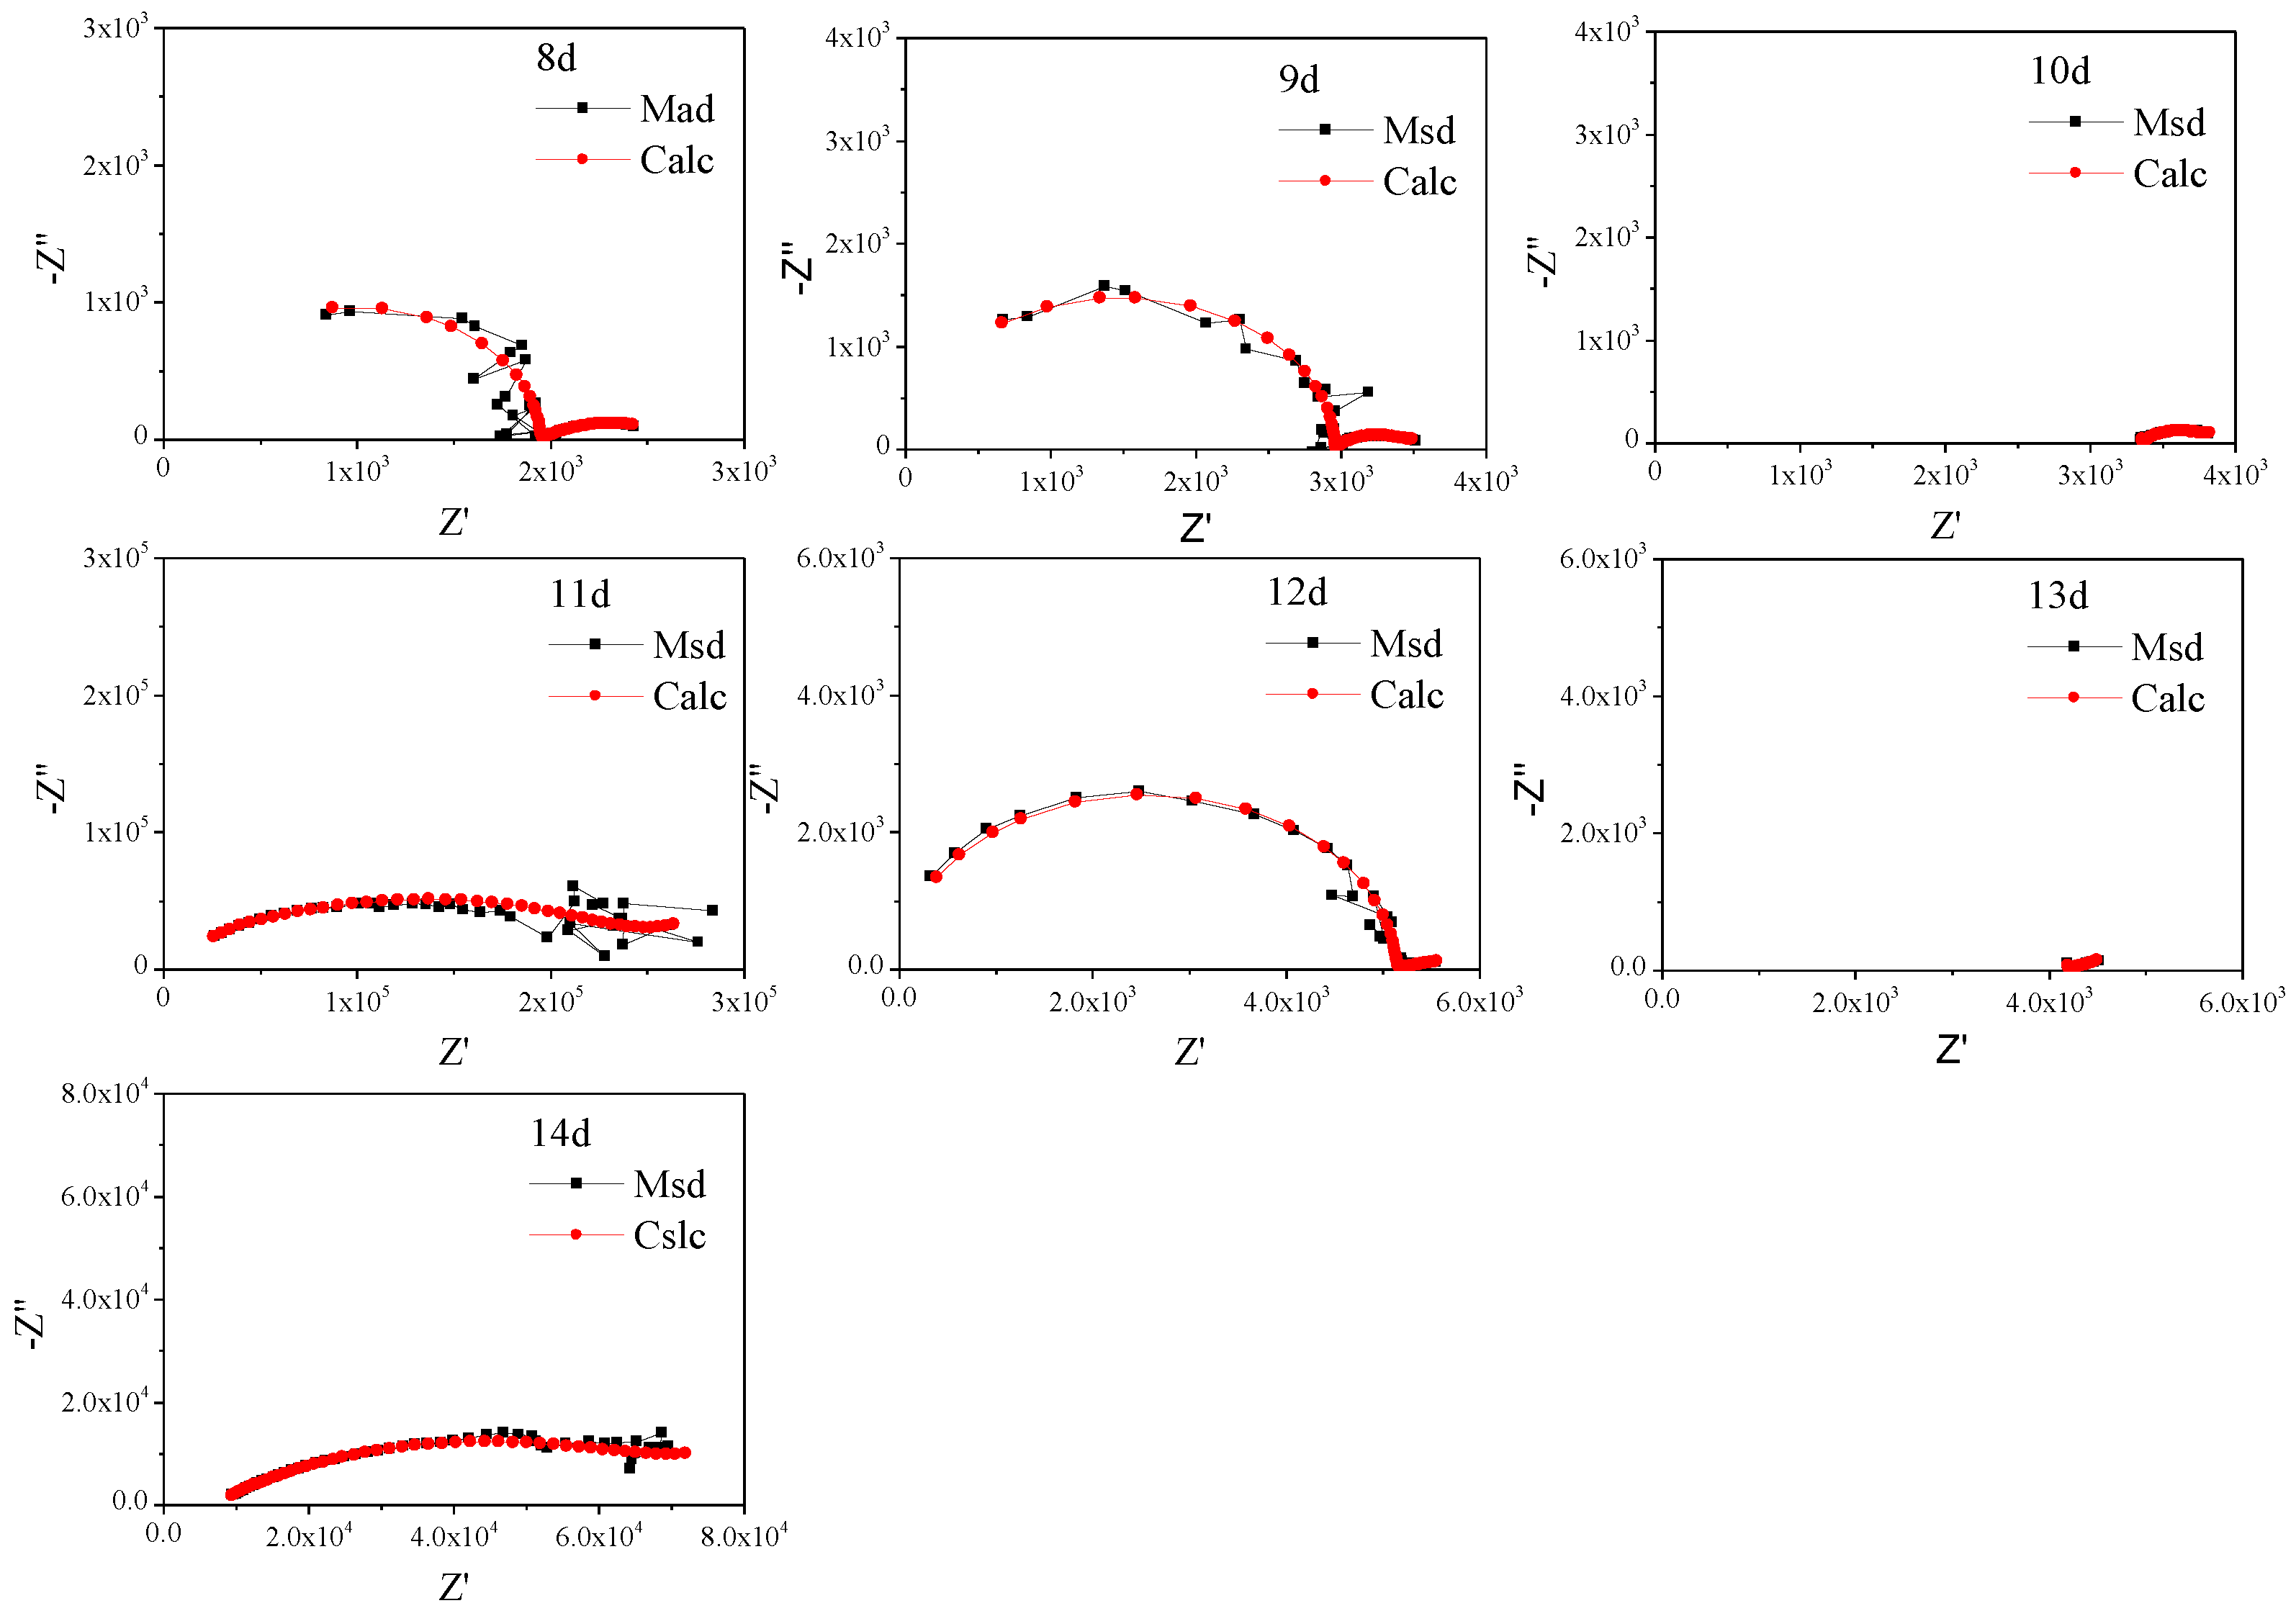
To further study the characteristics, the non-fluctuation part of the impedance spectra of Q235 was fitted by the equivalent circuit Re(Cs(Rs(Qdl(RctW)))) (Figure 5) according to the characteristics of the modulus and phase angle [15]. The fitting results are shown in Figure 6 and Figure 7 and Table 4, which are obtained by the fitting software ZSimDemo 3.30d. Figure 6 and Figure 7 show that the fitting effect of the equivalent circuit is good.
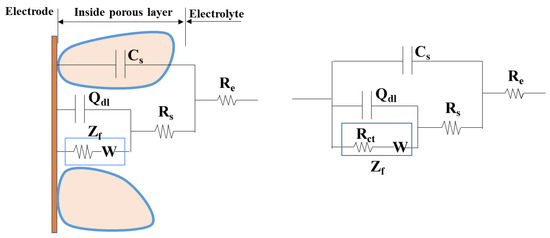
Figure 5.
Equivalent circuit model of sand-steel interface.
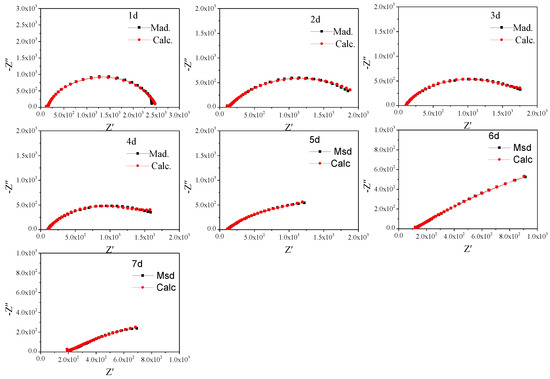
Figure 6.
Equivalent circuit fitting results of the impedance spectra of Q235 steel in sand containing HA solution (1 d–7 d).
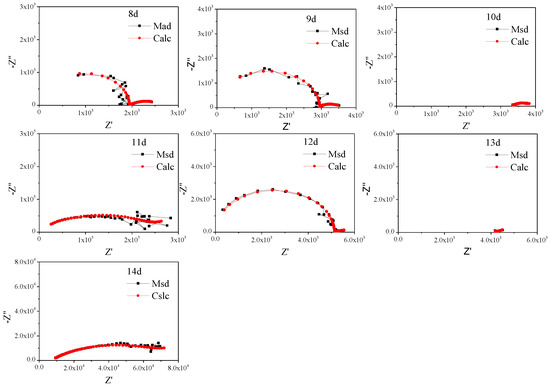
Figure 7.
Equivalent circuit fitting results of the impedance spectra of Q235 steel in sand containing HA solution (8 d–14 d).
Table 4.
Equivalent circuit fitting results of the impedance spectra of Q235 steel in sand containing HA solution.
3.4. Polarization Curve of Q235 Steel in Sand Containing HA Liquid
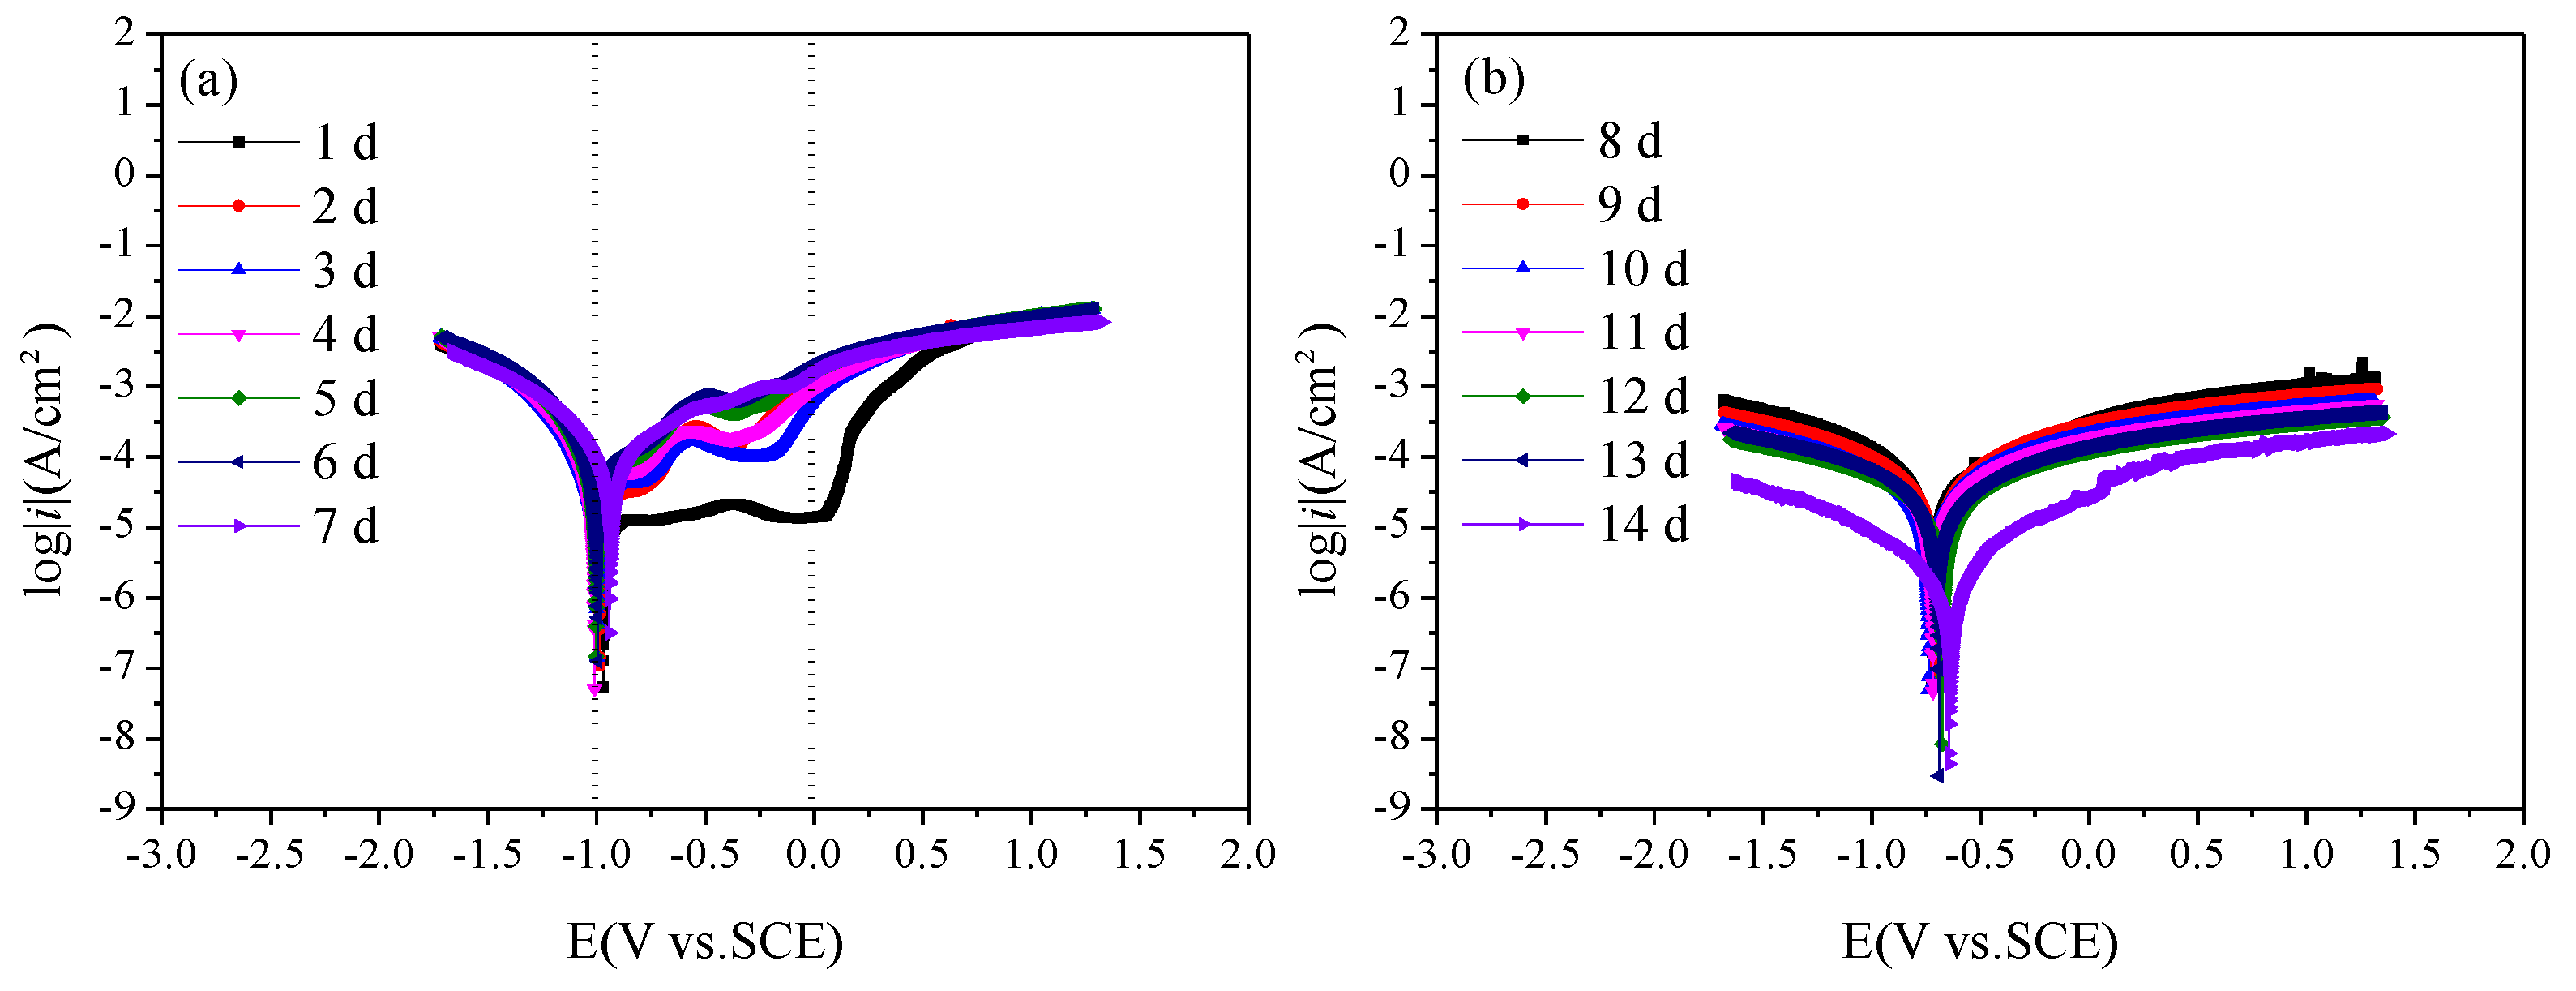
Figure 8 is the polarization curves of Q235 steel in sand containing HA solution under a natural air-dried state. With the increase in age, that is, as the moisture content in the sand decreases continuously, the polarization curve shifts upward overall, and the corrosion of Q235 steel gradually weakens. During 1 d–7 d, the corrosion potential of the Q235 steel is around −1 V, and passivation of the anode branch is obvious. After 8 days, the corrosion potential gradually increased to about −0.8 V. At 1 d, a wide platform appeared in the anode branch of the polarization curve, showing a relatively stable current density, which may be related to the solid–liquid path in the initial saturation state in the sand. During 2–5 d, an activation–passivation transition zone appears in the range of −1–0 V of the anodic branch. On the one hand, the water content in the sand decreases, forming a solid–liquid–gas three-phase path; On the other hand, the pore liquid contains Cl−, and the anode branch presents the characteristics of pitting. Over 1–5 d, pitting potential gradually shifts from around 0 V to about −0.5 V.
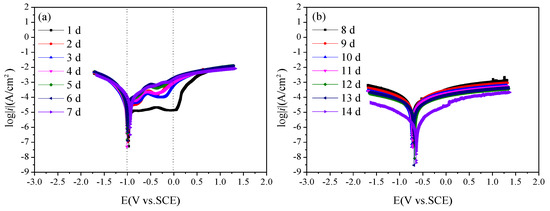
Figure 8.
Polarization curves of Q235 steel in sand containing HA solution: (a) 1 d–7 d; (b) 8 d–14 d.
To further study the corrosion rate of Q235 steel in sand containing HA solution, the polarization curves were fitted by Rp weak polarization at ±50 mV near the open circuit potential. The results are shown in Table 5. The polarization resistance Rp decreases first and then increases, reaching a peak value at 7 d. Io is the corrosion current density. The corrosion grade of Q235 steel first increases, reaching the highest level (3.44 × 10⁻⁵ A/cm2) at 6 d, and then decreases. The corrosion potential E0 basically shifts to the negative direction.
Table 5.
Rp fitting results of the polarization curves of Q235 steel in sand containing HA solution.
3.5. Electrochemical Corrosion Mechanism of Q235 Steel in Sand Containing HA Solution
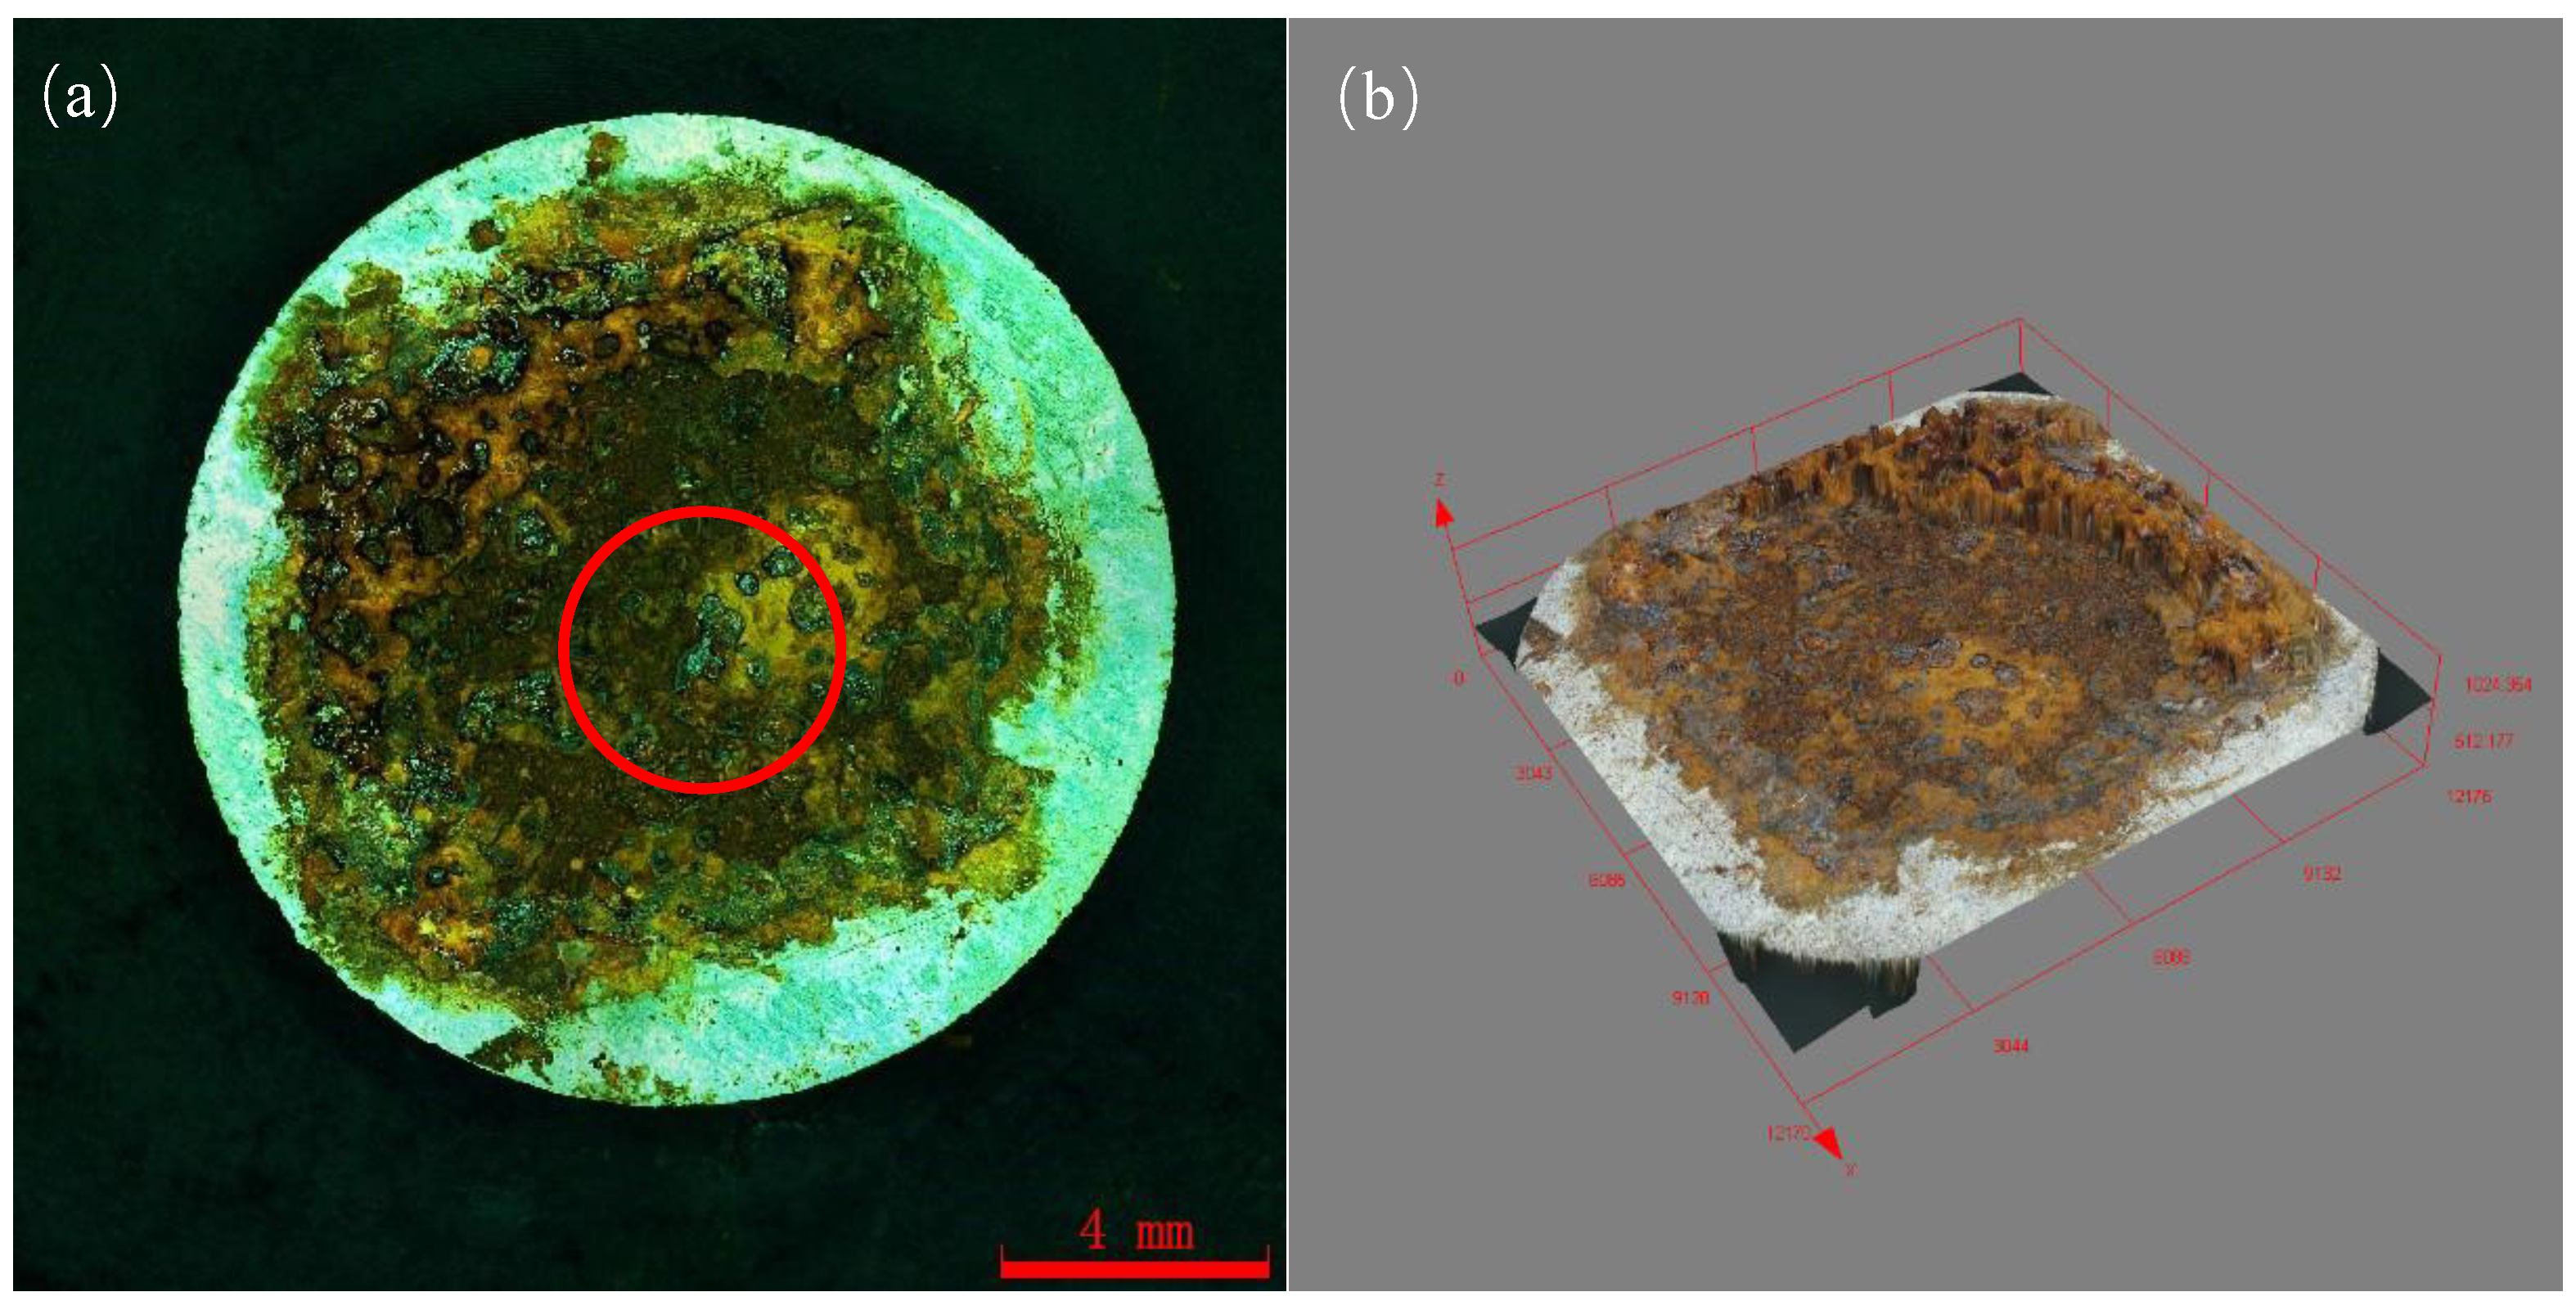
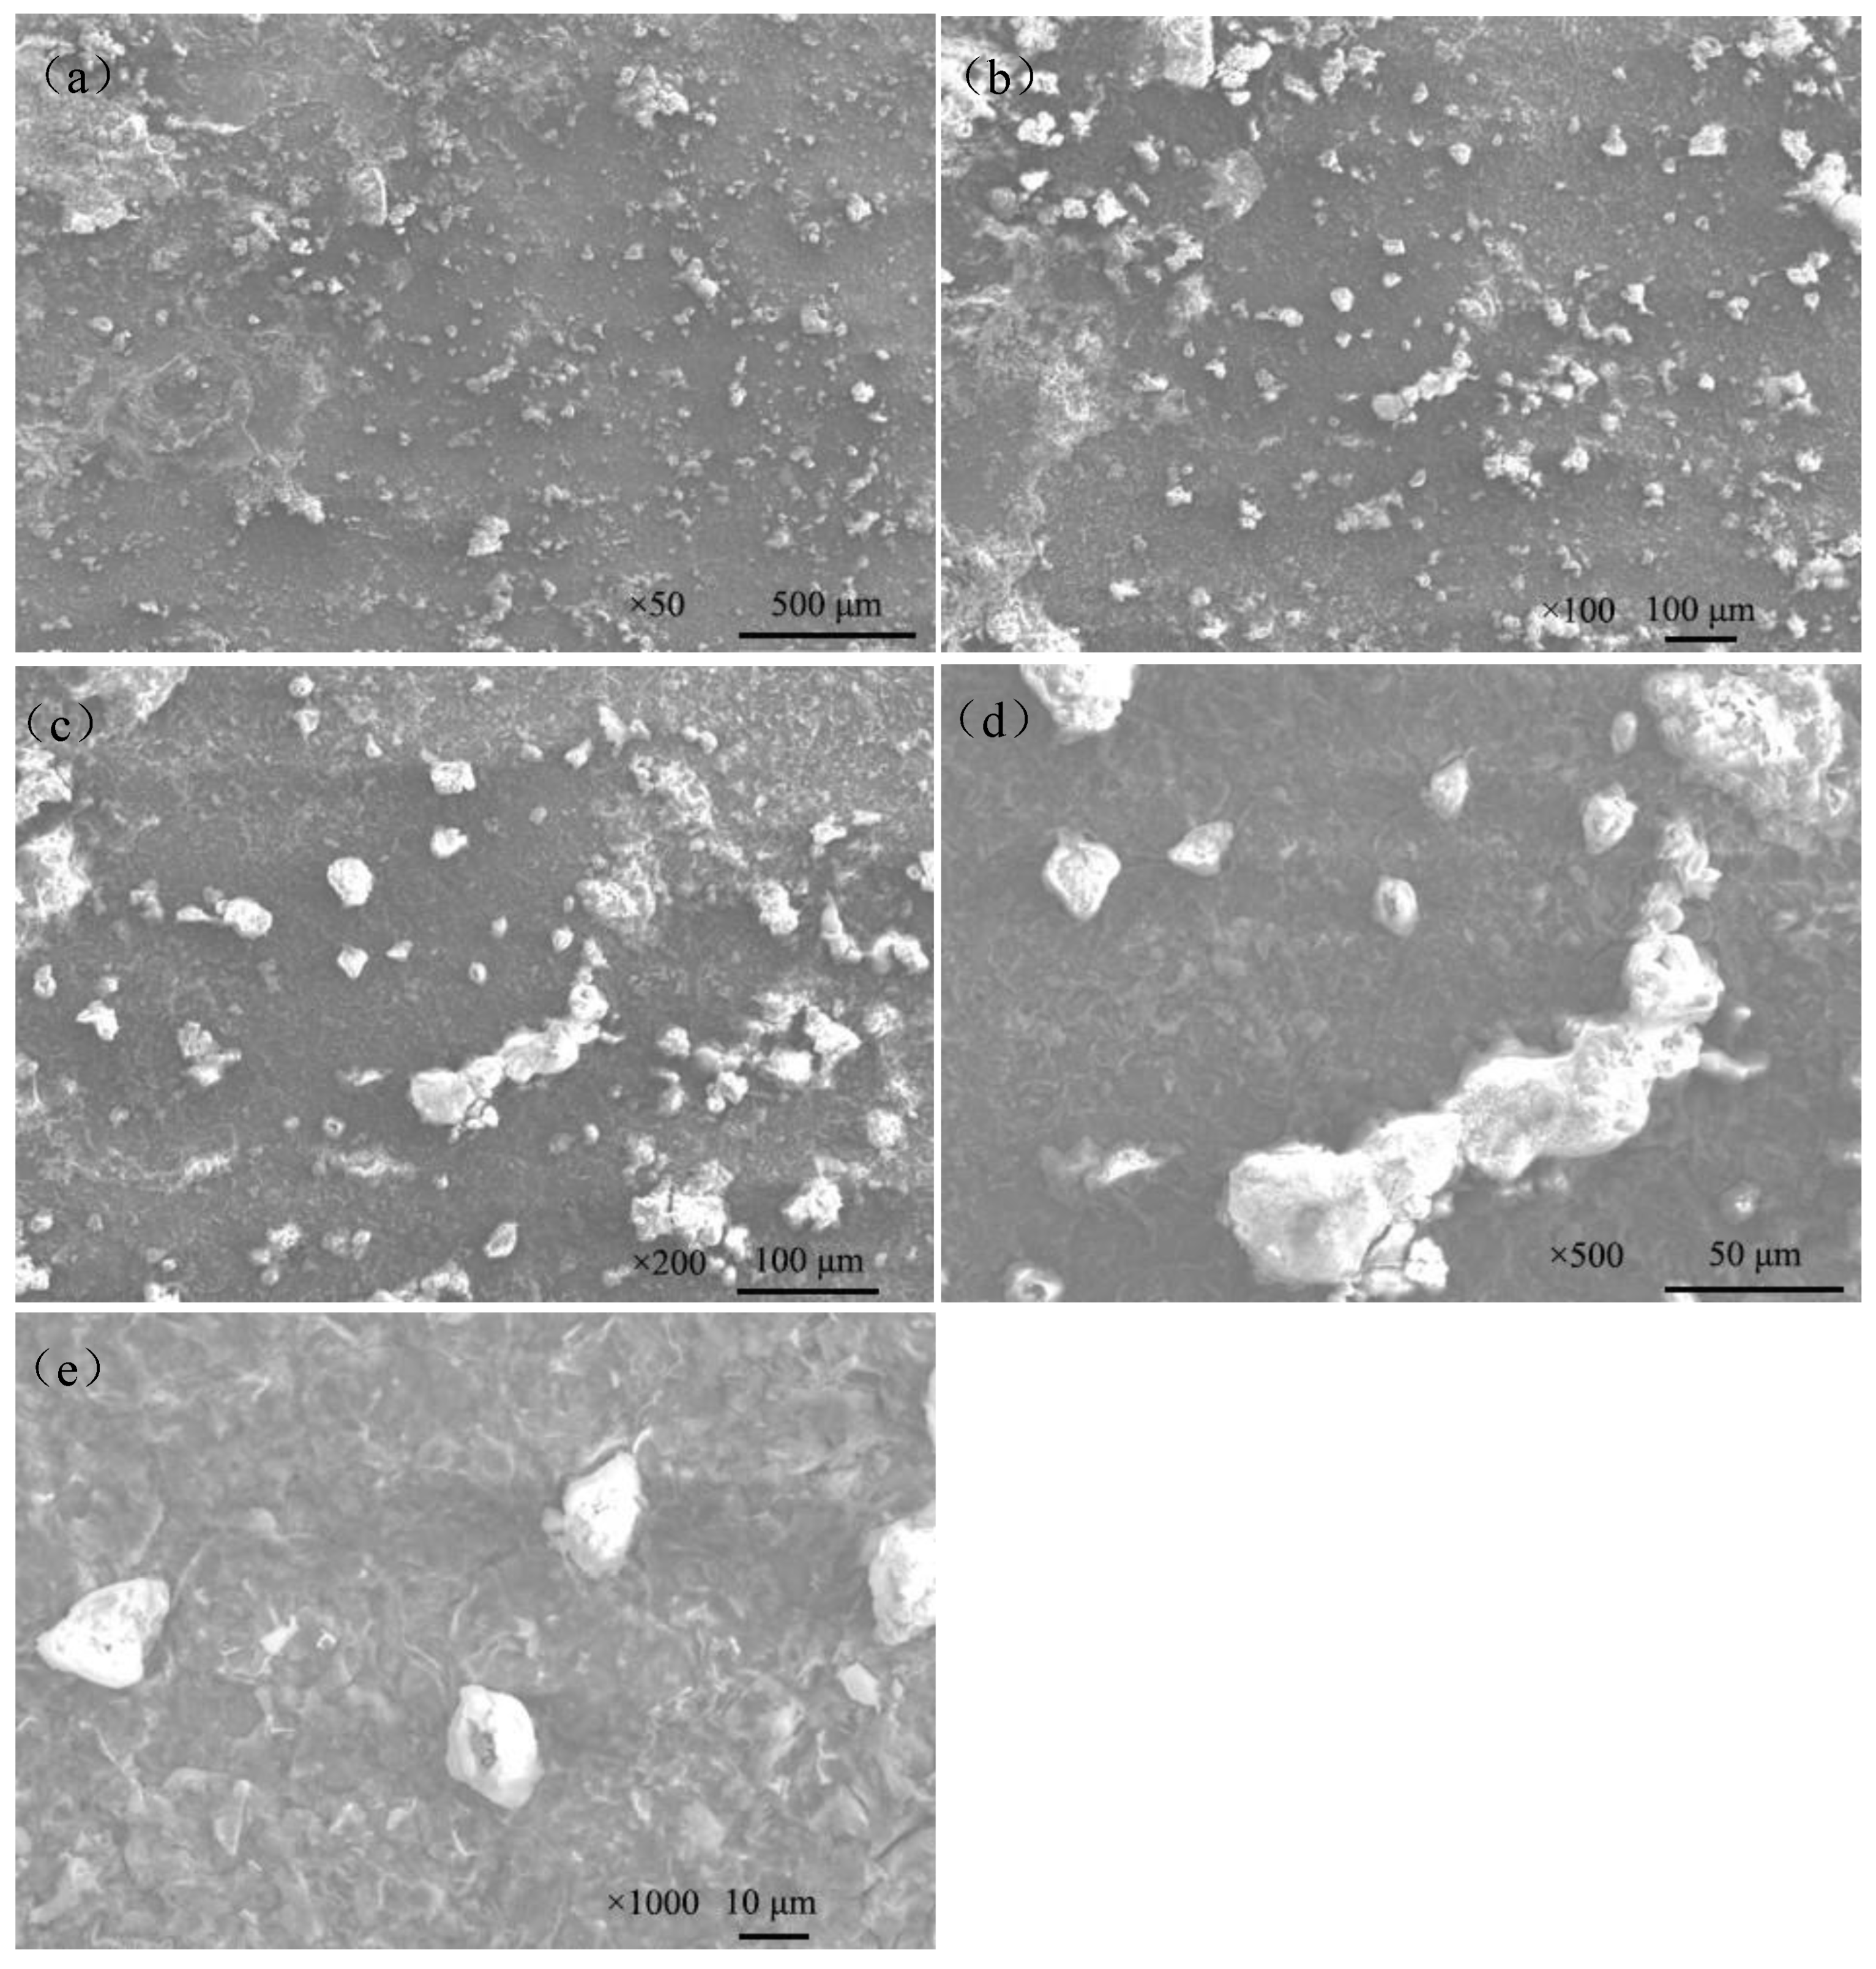
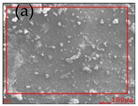
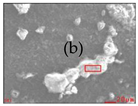
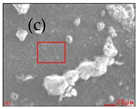
Figure 9 shows the macroscopic corrosion morphology of Q235 steel in sand containing HA solution under natural air-dried state, and the magnification of the picture is 18×. The results indicate that the surface of Q235 steel has highly variable brown-yellow corrosion products (iron oxides). Figure 9b shows that the thickness of the corrosion products is about 70–200 μm and the height varies. The SEM images of the corrosion products are show in Figure 10. The corrosion products were in the shape of lamellar, flocculent clusters, rice grains, etc.

Figure 9.
Macroscopic corrosion morphology of Q235 steel in sand containing HA solution: (a) 2D image; (b) 3D image (The area in the red circle will be further analyzed by EDS and XPS).

Figure 10.
SEM images of corrosion products on the surface of Q235 steel in sand containing HA solution: (a) ×50; (b) ×100; (c) ×200; (d) ×500; (e) ×1000.
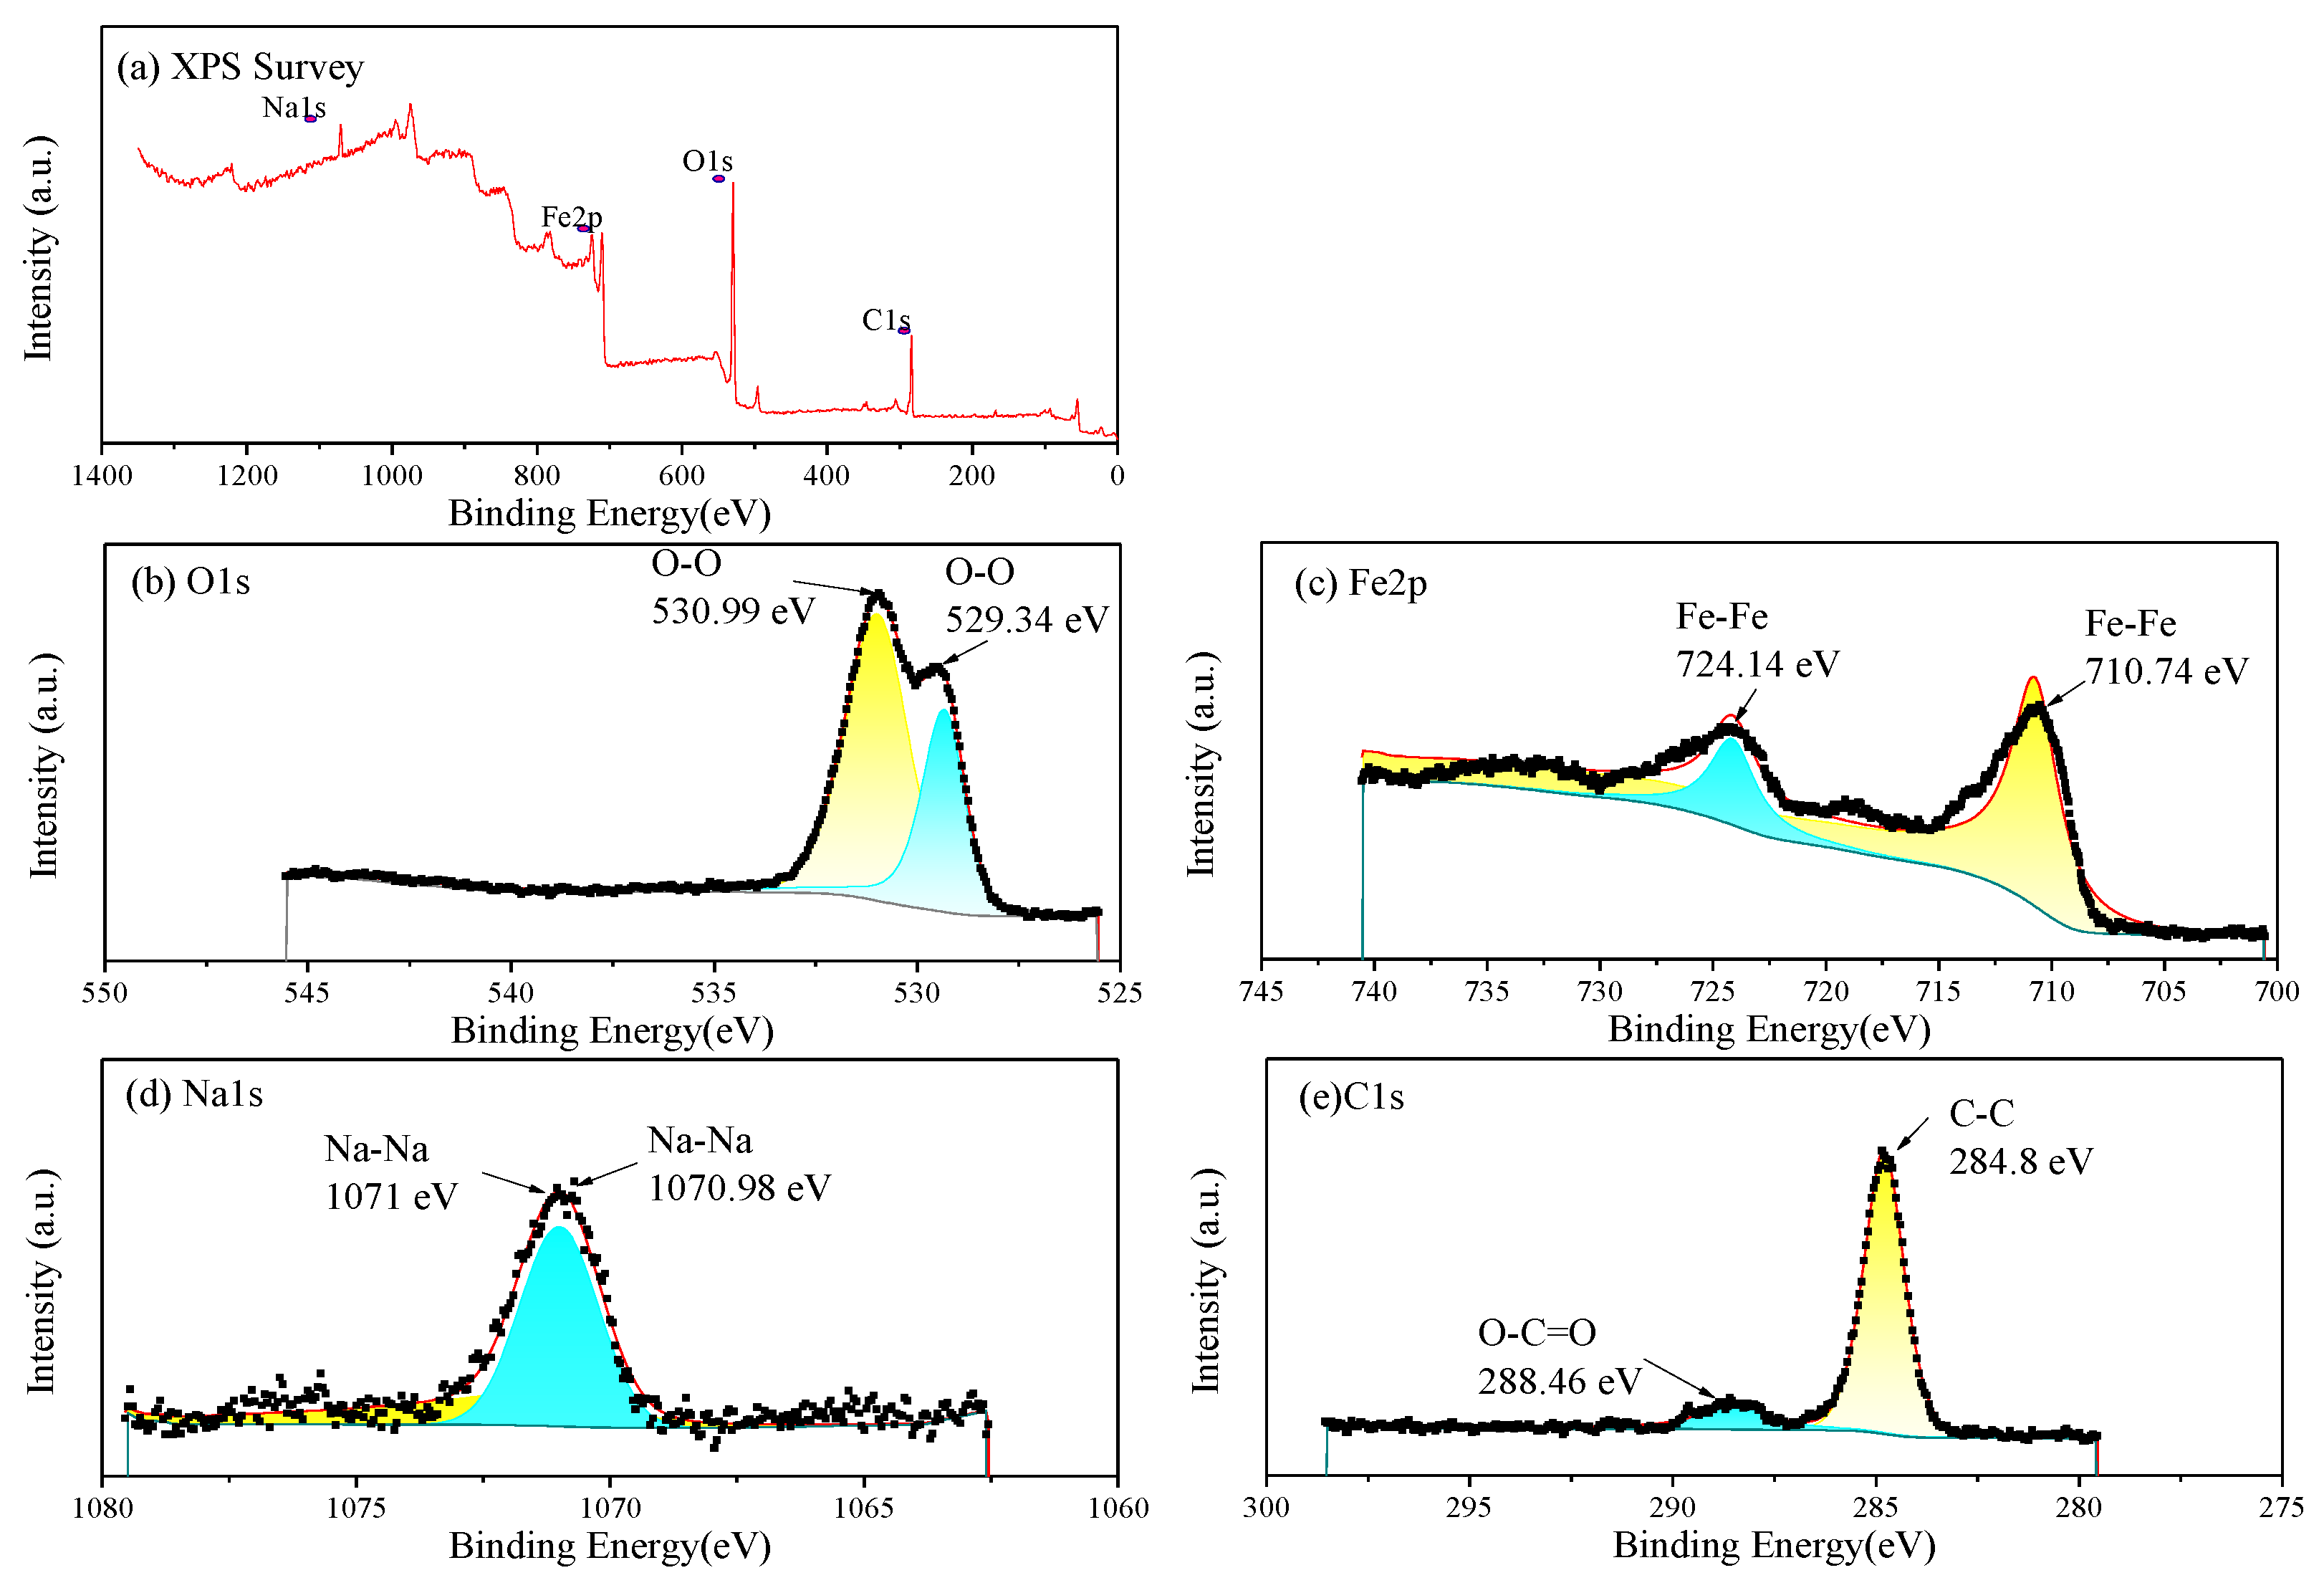
The EDS and XPS analysis were further performed on the corrosion products on the Q235 selected in Figure 9. The EDS results (Table 6) indicate that the corrosion products are mainly composed of Fe, O and C. And small amounts of Na, S and Cl are present. The XPS analysis results of the corrosion products are shown in Figure 11. As shown in the full spectrum XPS scanning diagram in Figure 11a, the elements in the corrosion products mainly include Fe, O and C. The C may come from the matrix of the sample and adventitious carbon, Na may be the precipitation of sodium salts, and Fe and O may come from the surface corrosion products.
Table 6.
Elemental content analysis (EDS) of corrosion products for different selections: (a) all selection; (b) protrusion region; (c) flat region.
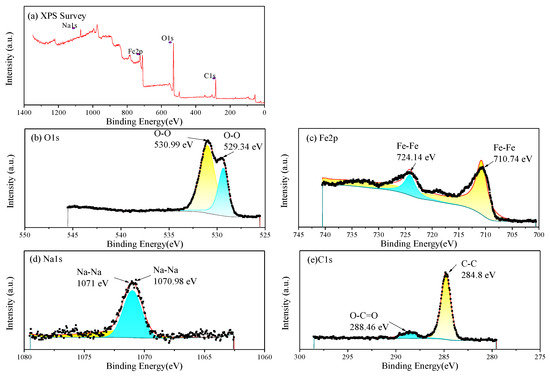
Figure 11.
XPS of the corrosion products on Q235 steel: (a) full spectrum and elemental chemical bond analysis: (b) O1s fine spectrum; (c) Fe2p fine spectrum; (d) Na1s fine spectrum; (e) C1s fine spectrum.
The corrosion morphology of Q235 steel was further analyzed via SEM after removing the rust. The magnifications were ×50, ×100, ×200, ×500 and ×1000 (Figure 12). The corrosion of Q235 steel is local corrosion, and corrosion pits are connected to form a large area of dimples.
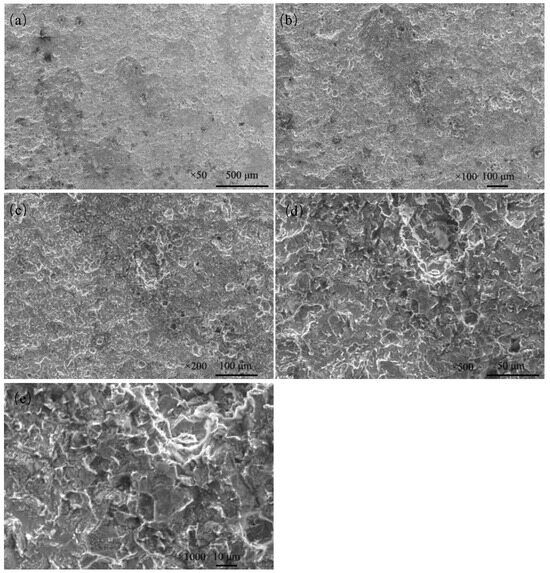
Figure 12.
Microscopic corrosion morphology of Q235 steel in sand containing HA solution after rust cleaning: (a) ×50; (b) ×100; (c) ×200; (d) ×500; (e) ×1000.
4. Discussion
The Eocp of Q235 steel in sand gradually positively skews, indicating that the corrosion kinetics of Q235 steel in sandy soil decrease with the increase in age [17]. In the high-frequency region, solid, solution and gas in sand containing HA solution will all form conductive paths, and the impedance spectrum will fluctuate greatly when the water content is low [15,18]. In sandy soil, Cl− has greater mobility and aggression, while SO42− has more charge. The impedance spectrum radius of Q235 steel in sand containing HA solution is smaller than that in sand without HA solution [15]. At 8 d, the water component of the sand containing the HA solution is 12.5%, which is near the limit volume content of the liquid bridge (6%–12%). The arc radius of the capacitive loop reached a minimum, and the sand had the strongest corrosion on the Q235 steel. The water content in the liquid bridge limit volume is respectively about 6% and 12% for the loose simple cube arrangement and the compact tetrahedron arrangement. When the water content is 6%–12%, the water content in the sand is near the liquid bridge limit volume. Water content continues to decrease, and there are lenticular or annular water films on the contact points of sand particles that are not connected with each other [15].
Table 4 shows that after the water component reaches less than the limit liquid bridge volume (8 d), the fitting parameters of the impedance spectra change greatly, which may be caused by the complex distribution of the pore liquid. With decreasing water in sand, the solution resistance (Re), sand layer resistance (Rs) and charge transfer resistance (Rct) increase, but the order of magnitude of Rs changes little. In addition, the order of magnitude the diffusion impedance (W) representing tortuosity fluctuates greatly, which is probably because the complex pore structure of sand containing HA solution [19]. Qdl is a constant phase element, the values of n are all less than 0.8 and the interface capacitance deviates from the ideal capacitance.
The pitting characteristics of anode branch for polarization curve also indicate the faster corrosion kinetics of Q235 steel in the early age (1–5 d) [17]. The Io of Q235 steel is above 3 μA/cm2 at 1 d–13 d, the corrosion degree of Q235 steel is above medium, the corrosion degree is below 3 μA/cm2 at 14 d and the corrosion of Q235 steel is mild [19]. The overall corrosion rate decreases gradually from 10−1 to 10−3 and the average corrosion rate is 0.1629 mm/a. HA solution accelerates the corrosion of Q235 steel in sand without HA solution (average corrosion rate, 1.51 × 10⁻² mm/a). The addition of HA solution increases the corrosion rate of Q235 steel by orders of magnitude, and the corrosion potential E0 basically shifts to the negative direction, which increases the corrosion tendency [15].
The surface of Q235 steel has highly variable brown-yellow corrosion products (iron oxides, about 70–200 μm), which is closely related to the porous structure of sand containing the HA solution. The part in contact with the pore solution (HA solution) can directly carry out electrochemical corrosion, and the corresponding product presents a darker color [20]. The SEM images of the corrosion products (Figure 10) showed that the corrosion products were in the shape of lamellar, flocculent clusters, rice grains, etc.
The EDS results (Table 6) indicate that the corrosion products are mainly composed of Fe, O and C. And small amounts of Na and Cl are present. Therein, Fe and O are in compositions of brown and yellow iron oxides. In the O1s fine spectrum (Figure 11b), the peak at 529.34 eV represents the formation of iron oxides, while the peak at 530.99 eV may be caused by the coexistence of various iron oxides and adhesive sand particles (SiO2), with multiple overlapping components [21]. In the Fe2p fine spectrum (Figure 11c), the characteristic peak at 710.74 eV represents the formation of Fe2p3/2(Fe2O3), and the peak at 724.14 eV represents the formation of Fe2p1/2(Fe2O3) [22]. In the Na1s fine spectrum (Figure 11d), the peaks at 1071–1071.5 eV represent sodium compounds. In the C1s fine spectrum (Figure 11e), the peak at 284.8 eV represents the chemical state of C-C, while the peak at 288.46 eV represents the chemical state of O-C=O. On the one hand, the metal matrix is an iron–carbon alloy, and on the other hand, adventitious carbon is adsorbed on the sample [23].
Fe2O3 is the main component of the corrosion products. Anode dissolution will produce Fe2+, which may react with H2O in the neutral pore liquid to form Fe(OH)2 (Formula (3)) and further oxidize to form Fe2O3 on the Q235 steel [24,25]. When the steel is in contact with the sand, a circuit is formed through the sand to form a corrosion battery, and an electrochemical reaction can occur.
The HA solution and porous structure of sand affect the electrochemical corrosion of Q235 steel, and Figure 12 shows that HA solution strongly aggravates the corrosion of Q235 steel in sand [15].
5. Conclusions
Based on electrochemical theory and the corrosion principle of Q235 steel, the electrochemical corrosion of Q235 steel in sand containing HA solution under a natural air-dried state was comprehensively studied. The following conclusions are obtained:
- (1)
- The pH of the sand containing the HA solution fluctuated within the range of 6.31–7.01, the sand was basically neutral and the temperature changed by around 20 °C. The moisture gradually decreased from 30% to 0%, and the salt decreased from 1.26% to 0.04% within 14 days;
- (2)
- The Eocp of Q235 steel is stable with time. With the increase in age, the Eocp gradually-positively skews indicating the corrosion kinetics of Q235 steel in sandy soil decrease. In the frequency of 10−2–103 Hz, the impedance spectra present a flat capacitive loop. The water component of the sand is near the limit volume content of the liquid bridge (6%–12%) at 8 d. The radius of capacitive loop is the smallest, and sand erodes steel the most. After 8 d, the impedance spectra fluctuate greatly in the frequency of 103–106 Hz;
- (3)
- As age increases, the polarization curve of Q235 steel moves upward overall, and the corrosion tendency of Q235 steel in sand containing HA solution gradually weakens. The pitting characteristics of the anode branch for polarization curve also indicate the faster corrosion kinetics of Q235 steel in the early age (1–5 d). The corrosion grade of Q235 steel first increases and then decreases, reaching the highest level (3.44 × 10⁻⁵ A/cm2) at 6 d. The corrosion degree of Q235 steel varies from medium to mild corrosion. The average corrosion rate is 0.1629 mm/a. HA solution accelerates the corrosion of Q235 steel in sand without HA solution (average corrosion rate, 1.51 × 10⁻² mm/a).
- (4)
- The surface of the Q235 steel was stacked with highly different brown–yellow corrosion products (iron oxides, about 70–200 μm), and the corrosion products were lamellar, flocculent clusters, rice grains and other shapes. The corrosion of the Q235 steel was local corrosion, and corrosion pits connected to form a large area of dimples. The HA solution and porous structure in sand jointly affect the electrochemical corrosion of Q235 steel.
Author Contributions
Writing—original draft, R.X., Y.B., R.G., Q.Z., H.H., Y.W., B.L., P.H., Z.W., S.W., N.L. and B.D. All authors have read and agreed to the published version of the manuscript.
Funding
This research was funded by PhD research launch project of Jinzhong University (No. jzxybsjjxm2019019), “1331” Innovation Team of Jinzhong University (No. jzxycxtd2019008), National Natural Science Foundation of Shanxi Province (No. 202103021224306, No. 20210302123139), Shanxi Collaborative Innovation Center for Lightweight Material Modification and Application and Shanxi Province Science and Technology Innovation Young Talents Team (No. 202204051001005). Opening Project of Sichuan University of Science and Engineering, Material Corrosion and Protection Key Laboratory of Sichuan province (No. 2020CL13, No. 2021CL22).
Institutional Review Board Statement
Not applicable.
Informed Consent Statement
Not applicable.
Data Availability Statement
All the data used to support the findings of this study are present in the paper.
Conflicts of Interest
The authors declare no conflicts of interest.
References
- Li, X.H.; Cao, G.W.; Guo, M.X.; Peng, Y.C.; Ma, K.J.; Wang, Z.Y. Initial corrosion behavior of carbon steel Q235, pipeline steel L415, and pressure vessel steel 16MnNi under high humidity and high irradiation coastal-industrial atmosphere in Zhanjiang. Acta. Metall. Sin. 2023, 59, 884–892. [Google Scholar]
- Deng, C. Research on characterisyics of particle pollution in sixteen cities of yunnan. Environ. Sci. Surv. 2017, 36, 86–90. [Google Scholar]
- Chen, H.; Liu, J.J.; Wang, P.Z.; Lin, X.; Ma, J.J.; Wang, C.Y. Characteristics of PM2.5 chemical species in 23 Chinese cities identified using a vehicular platform. Sustainability 2024, 16, 2340. [Google Scholar] [CrossRef]
- Zhu, Y.C.; Liu, G.M.; Liu, X.; Pei, F.; Tian, X.; Gan, H.Y. Corrosion behavior of Q235 steel in three typical soil environments. Mater. Machanical. Eng. 2019, 43, 15–19. [Google Scholar]
- Li, X.D.; Li, X.J.; Yang, J.; Zhou, Z.J.; Ma, C.; Jiang, M. The grounding grid corrosion comparative judgment and difference analysis using different soil corrosion evaluation method. Electr. Power Technol. Environ. Prot. 2014, 30, 8–9. [Google Scholar]
- Ibrahim, M.A.; Jaafar, M.Z.; Yusof, M.A.M.; Shye, C.A.; Idris, A.K. Influence of size and surface charge on the adsorption behaviour of silicon dioxide nanoparticles on sand particles. Colloids Surf. A 2023, 674, 131943. [Google Scholar] [CrossRef]
- Xie, C.X.; An, J.Y.; Deng, Z.R.; Liu, C.L. Corrosion test and three-dimensional cellular machine simulation of Q235 steel by ion diffusion in different soil environments. Arabian J. Chem. 2023, 16, 104869. [Google Scholar] [CrossRef]
- Li, J.; Su, H.; Chai, F.; Chen, X.P.; Li, X.Y.; Meng, H.M. Simulated corrosion test of Q235 steel in diatomite soil. J. Iron. Steel Res. Int. 2015, 22, 352–360. [Google Scholar] [CrossRef]
- Deng, Z.Y.; Liu, L.L.; Li, W.B.; Zhong, Z.; Xu, D.L.; Wu, Z.T. Effect of graphite on the corrosion behavior of Q235 steel in sodium bentonite. Total Corros. Control. 2022, 36, 8–29. [Google Scholar]
- Liu, L.L.; Li, W.B.; Deng, Z.Y.; Xu, S.; Xu, Y.R.; Zeng, L.B.; Li, D.K.; Yang, Y.; Zhong, Z. Effect of moisture on corrosion behavior of Q235 steel in bentonite clay. Int. J. Electrochem. Sci. 2023, 18, 100164. [Google Scholar] [CrossRef]
- Yang, C.; Wang, Z.L.; Wang, G.J.; Han, Q.; Liu, J. Study on corrosion characteristics of Q235 steel in seawater, soil and dry-wet alternating environments focusing on Shengli oilfield. Mater. Res. Express. 2022, 9, 046506. [Google Scholar] [CrossRef]
- Wu, Y.H.; Liu, T.M.; Sun, C.; Xu, J.; Yu, C.K. Effects of simulated acid rain on corrosion behaviour of Q235 steel in acidic soil. Corros. Eng. Sci. Technol. 2010, 45, 136–141. [Google Scholar] [CrossRef]
- Wang, S.R.; Du, C.W.; Liu, Z.Y.; Li, X.G.; Zhu, M.; Huang, Y.Z.; Jia, J.H. Field experimental study on stress corrosion cracking behavior of Q235 and X70 steels in Singapore soil. Int. J. Mech. Eng. Educ. 2015, 51, 30–35. [Google Scholar] [CrossRef]
- Jiang, J.; Wang, J. Effect of gas/liquid/solid three-phase boundary zone on cathodic process of metal corrosion. Corros. Sci. Prot. Technol. 2009, 21, 79–81. [Google Scholar]
- Xie, R.Z.; Geng, R.C.; Zhang, Q.; Yuan, M.L.; Bao, Y.G.; Zhou, Y.Q.; Li, B.Q.; Han, P.J.; Wang, Z.X.; Wang, S.Y. Investigation of Q235 steel electrochemical corrosion behavior in naturally dried sandy soil. Int. J. Electrochem. Sci. 2023, 18, 100376. [Google Scholar] [CrossRef]
- Cui, L.Y.; Liu, Z.Y.; Hu, P.; Shao, J.M.; Li, X.G.; Du, C.W.; Jiang, B. The corrosion behavior of AZ91D magnesium alloy in simulated haze aqueous solution. Materials 2018, 11, 970. [Google Scholar] [CrossRef] [PubMed]
- Palcut, M.; Gerhátová, Ž.; Šulhánek, P.; Gogola, P. Corrosion resistance of steel S355MC in crude glycerol. Technologies 2023, 11, 69. [Google Scholar] [CrossRef]
- Stefanoni, M.; Angst, U.M.; Elsener, B. Kinetics of electrochemical dissolution of metals in porous media. Nat. Mater. 2019, 18, 942–947. [Google Scholar] [CrossRef] [PubMed]
- Wang, S.; Xu, X.; Li, Z.Z.; Liu, X.; Su, X.L.; Wang, J.; Cheng, L.; Li, Q.; Tan, J.B. The application of Krijing method in national soil corrosion distribution map. Experience Exch. 2016, 30, 38–42. [Google Scholar]
- Ding, K.K.; Guo, W.M.; Qiu, R.; Hou, J.; Fan, L.; Xu, L.K. Corrosion behavior of Q235 steel exposed in deepwater of south china sea. J. Mater. Eng. Perform. 2018, 27, 4489–4496. [Google Scholar] [CrossRef]
- Nohira, H.; Tsai, W.; Besling, W.; Young, E.; Petry, J.; Conard, T.; Vandervorst, W.; De Gendt, S.; Heyns, M.; Maes, J.; et al. Characterization of ALCVD-Al2O3 and ZrO2 layer using X-ray photoelectron spectroscopy. J. Non-Cryst. Solids 2002, 303, 83–87. [Google Scholar] [CrossRef]
- Biesinger, M.C.; Payne, B.P.; Grosvenor, A.P.; Lau, L.W.M.; Gerson, A.R.; Smart, R.S.C. Resolving surface chemical states in XPS analysis of first row transition metals, oxides and hydroxides: Cr, Mn, Fe, Co and Ni. Appl. Surf. Sci. 2011, 257, 2717–2730. [Google Scholar] [CrossRef]
- Shchukarev, A.V.; Korolkov, D.V. XPS Study of Group IA Carbonates. Cent. Eur. J. Chem. 2004, 2, 347–362. [Google Scholar] [CrossRef]
- Jin, Z.Q.; Zhao, X.; Zhao, T.J.; Hou, B.R.; Liu, Y. Effect of Ca(OH)2, NaCl, and Na2SO4 on the corrosion and electrochemical behavior of rebar. Chin. J. Oceanol. Limnol. 2016, 35, 681–692. [Google Scholar] [CrossRef]
- Teng, Y.X.; Sun, D.Y.; Wang, S.; Wang, Y.S.; An, Z.Y.; Li, Y.; Qu, X.L.; Zhao, X.D. Investigation of corrosion behavior of Q235 steel in simulated industrial wastewater. Int. J. Electrochem. Sci. 2019, 14, 10670–10680. [Google Scholar] [CrossRef]


Disclaimer/Publisher’s Note: The statements, opinions and data contained in all publications are solely those of the individual author(s) and contributor(s) and not of MDPI and/or the editor(s). MDPI and/or the editor(s) disclaim responsibility for any injury to people or property resulting from any ideas, methods, instructions or products referred to in the content. |
© 2024 by the authors. Licensee MDPI, Basel, Switzerland. This article is an open access article distributed under the terms and conditions of the Creative Commons Attribution (CC BY) license (https://creativecommons.org/licenses/by/4.0/).