Article

Analysis of Surface Characteristics of Titanium Alloy Milling with Ball-End Milling Cutters Based on Mesoscopic Geometric Features

1
School of Mechanical and Power Engineering, Harbin University of Science and Technology, Harbin 150080, China
2
Key Laboratory of Advanced Manufacturing and Intelligent Technology, Ministry of Education, Harbin University of Science and Technology, Harbin 150080, China
*
Author to whom correspondence should be addressed.
Coatings 2024, 14(6), 670; https://doi.org/10.3390/coatings14060670
Submission received: 18 April 2024 / Revised: 15 May 2024 / Accepted: 23 May 2024 / Published: 25 May 2024

Abstract

:
In order to further reduce the height of burrs on the surface of the workpiece when milling titanium alloy with ball-end milling cutters and optimize the quality of the workpiece, this article takes the mesoscopic geometric feature of ball-end milling cutters as the research object and establishes the theoretical relationship between the mesoscopic geometric feature parameters and the height of titanium alloy burrs during milling. A milling test platform was built to explore the influence of micro-texture, blunt edge single factor, and their interaction with cutting parameters on the force-thermal characteristics and workpiece burr in the milling process. The influence mechanism was revealed, and the prediction model was established. The results show that the ball-end milling cutter with mesoscopic geometric features was able to suppress burrs, and the burr height was reduced by 21% compared with the non-textured milling cutter. The micro-texture reduced the contact area and improved the heat dissipation conditions, thereby reducing the force-thermal characteristics and thus inhibiting the formation of some burrs. The blunt edge can disperse the stress, diffuse the local heat in the tool–chip contact area, and reduce the burr height. In the interaction test considering cutting parameters, the interaction between R and ap was significant. The optimized parameters based on the simulated annealing algorithm were as follows: the radius of the blunt edge was 33.242 μm, the distance between the texture and the edge was 114.621 μm, the texture diameter was 59.820 μm, the texture spacing L1 was 131.410 μm, the cutting depth ap was 0.310 mm, the cutting speed V was 140.019 mm/min, and the feed f was 60 μm/z. This provides a basis for the study of strengthening the tool to suppress burr size.

1. Introduction

The characteristics of titanium alloy are complex, and the cutting process is difficult. During the cutting process, high cutting forces and temperatures are generated, which easily lead to burrs on the machined surface of the workpiece. Burrs can affect the geometric accuracy of the workpiece and, in severe cases, can even result in workpiece scrap [1,2]. To address this issue, scholars have adopted optimized cutting parameters to suppress burr formation. Additionally, studies have demonstrated that mesoscopic geometric features can reduce milling forces, lower milling temperatures to suppress burr generation, decrease tool wear, prolong tool life, and enhance workpiece surface integrity. By focusing on the mesoscopic geometric characteristics of cutting tools, this study explores their interaction mechanisms in the formation of burrs on the surface of workpieces. The aim is to further suppress burr formation and achieve efficient and high-quality precision machining of titanium alloys.
Deba Kumar Sarma [3] used micro electric discharge to machine grooves and micro pits on the back face of AISI D2 steel hard-alloy-coated cutting tools. It was found that both types of textured cutting tools have good surface quality and small back face wear. Yu Xin [4] proposed a novel variable density micro texturing tool consisting of two regions with different groove widths and distribution densities. By reasonably designing texture parameters with variable distribution density, cutting tools can have better wear resistance and chip-breaking ability. Kairui Zheng [5] machined different-shaped grooves on the front face of hard alloy cutting tools to improve the cutting performance of titanium alloy Ti-6Al-4V machining. It was found that using sine-textured cutting tools can achieve optimal cutting performance under different cutting parameters. Patel Kaushalandra [6] investigated the influence of micro-texture geometric parameters on the front face of tungsten carbide blades tested in dry turning titanium alloy Ti-6Al-4V. It has been proven that both the characteristic parameters of microgroove size and cutting parameters have a significant impact on cutting performance. Usman Mustapha Mukhtar [7] and Ali Shafahat [8] have both studied it in the field of unconventional cutting. The former studied the cutting performance of micro-textured cutting tools on the front face under ultrasonic elliptical vibration cutting, demonstrating that the combined effect of ultrasonic elliptical vibration cutting mechanism and tool texturing technology can significantly improve the significant machining efficiency of ultrasonic elliptical vibration cutting. The latter studied the cutting process of AISI 630 stainless steel using different microgroove tools and found that rectangular microgroove tools have good performance and a positive impact on tool life. Kishawy Hossam A [9] proposed an analytical model based on Oxley to optimize the design of micro-textured cutting tools to suppress the occurrence of derivative cutting. Through experiments, it was found that the optimal micro-textured design eliminates derivative cutting and reduces cutting force. Yang Xiaofan et al. [10] analyzed the cutting mechanism of a new type of milling cutter to suppress machining defects such as burrs during the milling of carbon fiber composite materials. They discovered that staggered edge end mills and diamond tooth end mills can effectively suppress the generation of burrs on the surface of workpieces. The ability of diamond tooth end mills to suppress milling burrs is better than that of staggered edge end mills. Diamond-coated diamond-toothed end mills are suitable for milling carbon fiber composite materials. Minsu Kim et al. [11] conducted experimental research on tool wear during the CFRP milling process. Using this correlation between parameters, a wear prediction model with force equations was derived, and the estimated results were well-matched with the measured wear values. Franczyk Emilia et al. [12] selected different tool geometries and cutting parameters by modifying the blade of the cutting bit, so that the height of the burr is reduced by more than 90%. Ragavanantham Shanmugam [13] and Zaidi Sajid Raza et al. [14] studied the influence of cutting parameters on the surface roughness, burr height, and cutting energy consumption of the workpiece. It was proven that the surface roughness, burr width, and cutting energy of the workpiece can be reduced by selecting appropriate processing parameters. Song Wenbin et al. [15] introduced ultrasonic-vibration-assisted technology in cutting titanium alloy to reduce the height of cutting burr and improve the quality of workpiece. Anand Krishnan et al. [16] constructed a mathematical model for predicting the exit burr height of Inconel 718 micro-milling. The maximum error of the predicted exit burr height is 6.4%, which can be used to control and minimize the exit burr size. Currently, there has been some progress in the research on the mechanism and control technology of burr formation. However, from the perspective of tool structure design, the analysis of the interaction between tool feature parameters and the generation of milling burrs is not yet widely studied. There is a lack of technical research on strengthening the cutting tool itself to suppress burr size.
This article establishes a theoretical relationship between ball-end milling cutter characteristics and burr height when milling titanium alloys. A test platform for milling titanium alloy with a hard alloy ball-end milling cutter with mesoscopic geometric features was established, and the influence of mesoscopic geometric feature parameters on the height of burrs on the surface of the workpiece after milling was analyzed. A test platform for milling titanium alloy with cemented carbide ball-end milling cutter with mesoscopic geometric characteristics was built. The influence of the interaction between mesoscopic geometric characteristic parameters and cutting parameters on the force-thermal characteristics of ball-end milling titanium alloy was analyzed. The mechanism of its action is revealed. An exponential regression analysis prediction model with burr height as the evaluation index was established, and the relevant parameters were optimized based on simulated annealing algorithm.

2. Theoretical Modeling of Geometric Features for Milling Titanium Alloy Outlet Burrs by Ball-End Milling Cutters

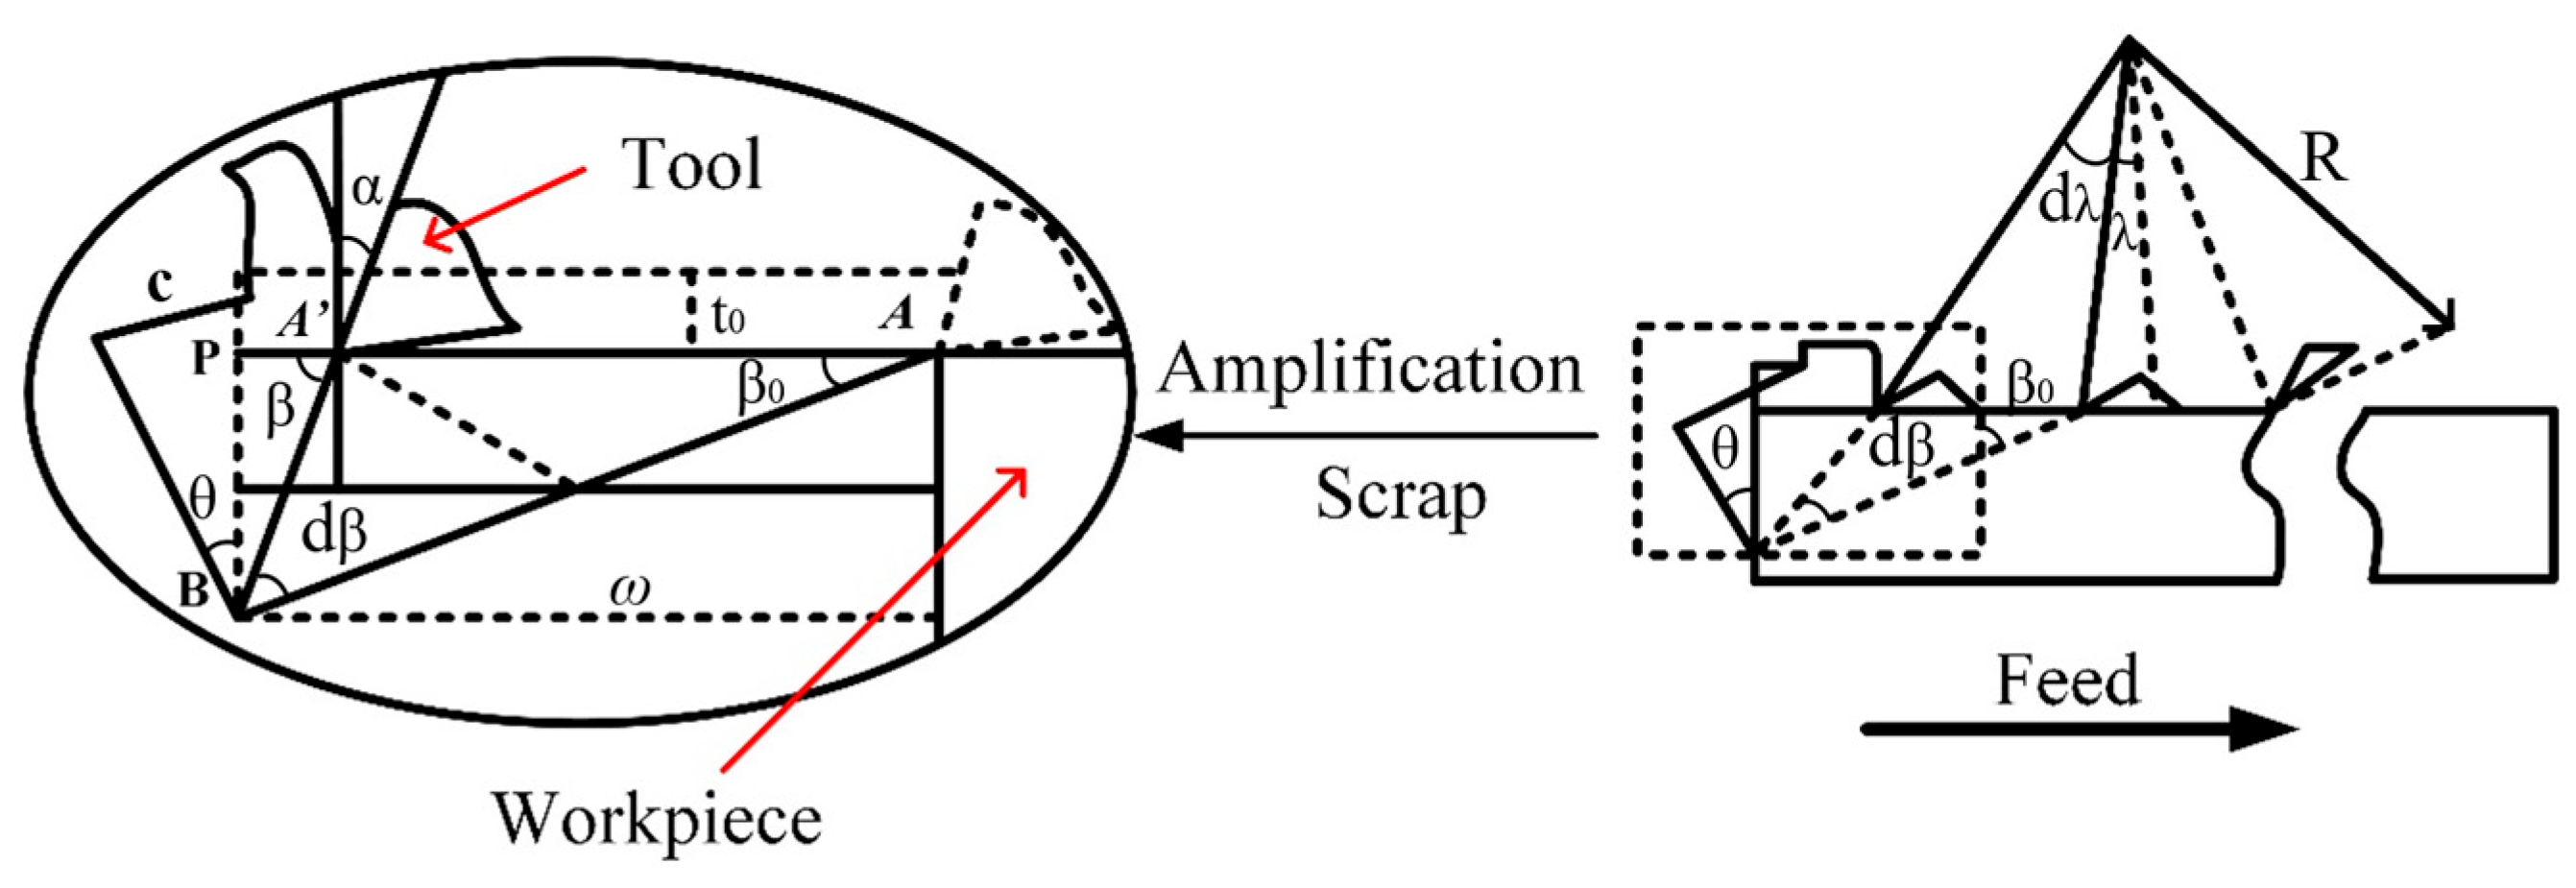
2.1. Milling Burr Size Model Establishment

It is generally believed that the movement of the tool during milling is not a cycloid but a combination of rotation and translation. Therefore, milling can be regarded as a special form of cutting in which the machining layer changes with the position angle of the milling cutter [17]. When milling with a milling cutter, at the moment when chips form burrs, the cutter teeth only travel a very small distance.
As shown in Figure 1, the length of the edge PB where the plastic hinge point B is located is the thickness of the burr. When the milling cutter teeth are milled, at the moment when the chips form burrs, the cutter teeth only travel a very small distance, which is AA’ in the figure. At the moment when the chips are converted into burrs, the cutting force is continuous, so it can be assumed that the work done to form chips is equal to the work done to form burrs, that is,
Δ W c = Δ W b
In Formula (1), the work done by ∆Wc is to form chips, and the work done by ∆Wb is to form burrs. ∆Wc is calculated according to the work of the main cutting force Fr in the milling process. As shown in Figure 1, the chips at point A begin to transform into burrs. When the cutter tooth rotates a very small angle dλ to point A’, the rotation angle of the corresponding plastic hinge point is dβ. The calculation of ∆Wc is as in Formula (2):
Δ W c = 0 λ F r R d λ = F r R λ
In Formula (2), Rdλ is the distance of tooth movement at which burrs begin to form.
According to [18], the work required for burr formation is
Δ W b = 0 λ k 0 2 cos 2 β 0 + σ e 4 tan β 0 ω R d λ a p
In Formula (3), k0 is the yield strength of the material against shear, σe is the normal yield strength of the material, and ap represents the amount of back cutting.
Simplify Formula (3) to obtain Formula (4):
ω = F r 3 6 cos 2 β 0 + 1 4 tan β 0 σ e a p
From Figure 1, it can be seen that the burr height Ht is shown in Formula (5):
H t = ω tan β 0 + a p
It can be concluded that the height of burrs is
H t = F r tan β 0 3 6 cos 2 β 0 + 1 4 tan β 0 σ e a p + a p
There are two types of energy generated during metal processing, namely, shear energy in the first deformation zone and friction energy in the second and third deformation zones. According to the mechanism of micro-texture [19], it has little effect on the shear energy of the workpiece in the first deformation zone. The wear-resistant function of the micro-texture is mainly in the second and third deformation zones.
As shown in Figure 2, the relationship between shear force, friction force, and resultant force is as follows (7):
F s = τ s A s F s = F r cos φ + β γ 0 F f = F r sin β
In Formula (7), Fs is the shear force, Fr is the resultant force, Ff is the frictional force, τs is shear strength, As is the shear area, β is the friction angle, γ0 is the front corner, and φ is cut angle.
Based on the above equation, the height of burrs can be expressed as Ht:
H t = F f tan β 0 3 6 cos 2 β 0 + 1 4 tan β 0 σ e a p sin β + a p
By combining Equation (7), Ff can be obtained as
F f = τ s A s sin β cos ( ϕ + β γ 0 )
The effective friction area is set to Qp, and Ff can be further expressed as [19]
Q p = A S sin β cos ( ϕ + β γ 0 )
F f = τ s Q p
By inserting the micro-texture into the tool-chip contact area, the effective contact friction area becomes:
Q p 1 = Q p S
In Formula (12): S is the area of micro-texture, and Qp is the effective friction area.
Therefore, the existence of micro-texture will reduce the effective friction area. By examining Equation (11), it can be inferred that the friction force Ff will decrease. Combining this with Formula (8), it can be concluded that when there is micro-texture on the surface of the milling cutter, the effective friction area decreases, so that the friction force will decrease, and then the burr height will decrease.

2.2. Dimensional Model of Burrs at the Outlet of Titanium Alloy Milling with Blunt Circular Edge Ball-End Milling Cutter

According to the schematic diagram in Figure 2, it can be seen that the main cutting force Fr can be expressed as the cutting-edge radius:
F r = τ s a w ( a c k r n ) sin ϕ cos ( ϕ + β γ 0 )
In Formula (13), τs represents the shear flow limit of the workpiece material; ac is the thickness of the removal layer; rn is the radius of the tool edge; k is a constant (k = 0.1~0.2); φ represents the shear angle; β represents the friction angle; and γ0 represents the tool front angle.
Therefore, when the edge radius rn increases, Fr decreases. Combining this with Formulas (7) and (8), it can be concluded that the increase in the edge radius of the milling cutter can reduce the burr height of the workpiece surface after milling.

3. Study on the Influence of Tool Mesoscopic Characteristics on the Surface Burr of Titanium Alloy

3.1. Materials and Methods Test Conditions and Data Collection

(1)
Test materials
The blade model is BNM-200, with two teeth and zero rake angle. The brand is YG8, and the tool holder is made of hard alloy. The workpiece material is Ti6Al4V titanium alloy square material, as shown in Figure 3.
(2)
Orthogonal test design of tool micro-texture
The selected cutting parameters are as follows: the cutting speed v is 150 mm/min, the cutting depth ap is 0.3 mm, and the feed rate f is 70 μm/z [20]. These cutting parameters remain unchanged, and a three-factor and three-level orthogonal test was designed with micro-texture distance L, micro-texture diameter D, and micro-pit spacing L1 as factors. A set of non-textured tools was set up for comparison test. The specific test design is shown in Table 1. A total of 10 groups of tests were designed.
(3)
Single-Factor test design of tool edge
Continue to use the same cutting parameters. The test design focuses on a single factor, with the edge parameters serving as the variable. The edge parameters are set at 20 μm, 40 μm, and 60 μm, with a total of three groups of tests.
(4)
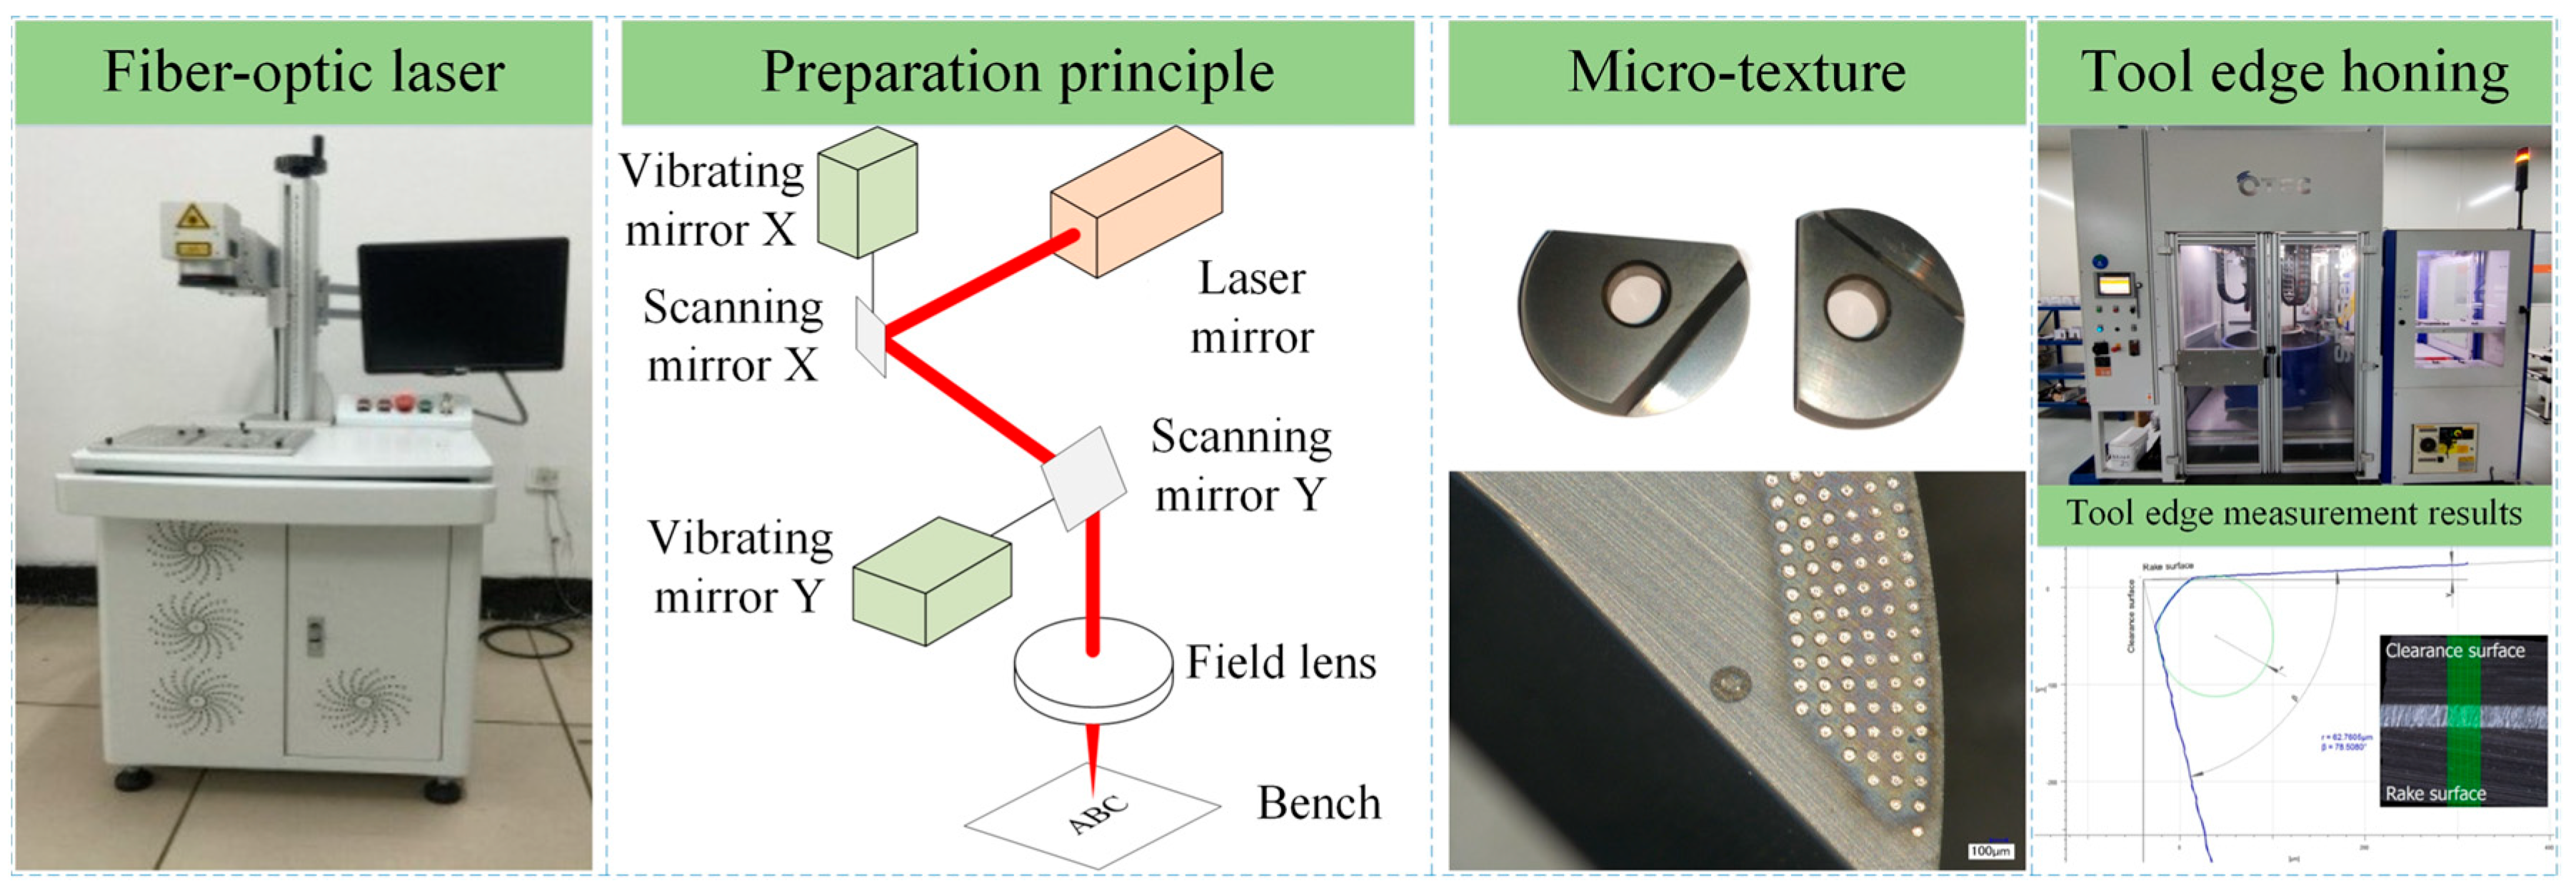
Texture and blade preparation
Using a Zhengtian fiber laser and creating a micro-texture distribution model using CAD, we imported it into the computer and utilized a fiber laser to complete the preparation of the tool’s micro-texture. Following the preparation process, sandpaper was used to remove burrs, and an ultrasonic cleaning machine was employed to eliminate impurities from the texture. The preparation of the cutting tool’s blunt round edge employed the sandblasting treatment method, with quartz sand as the abrasive, as depicted in Figure 4.
(5)
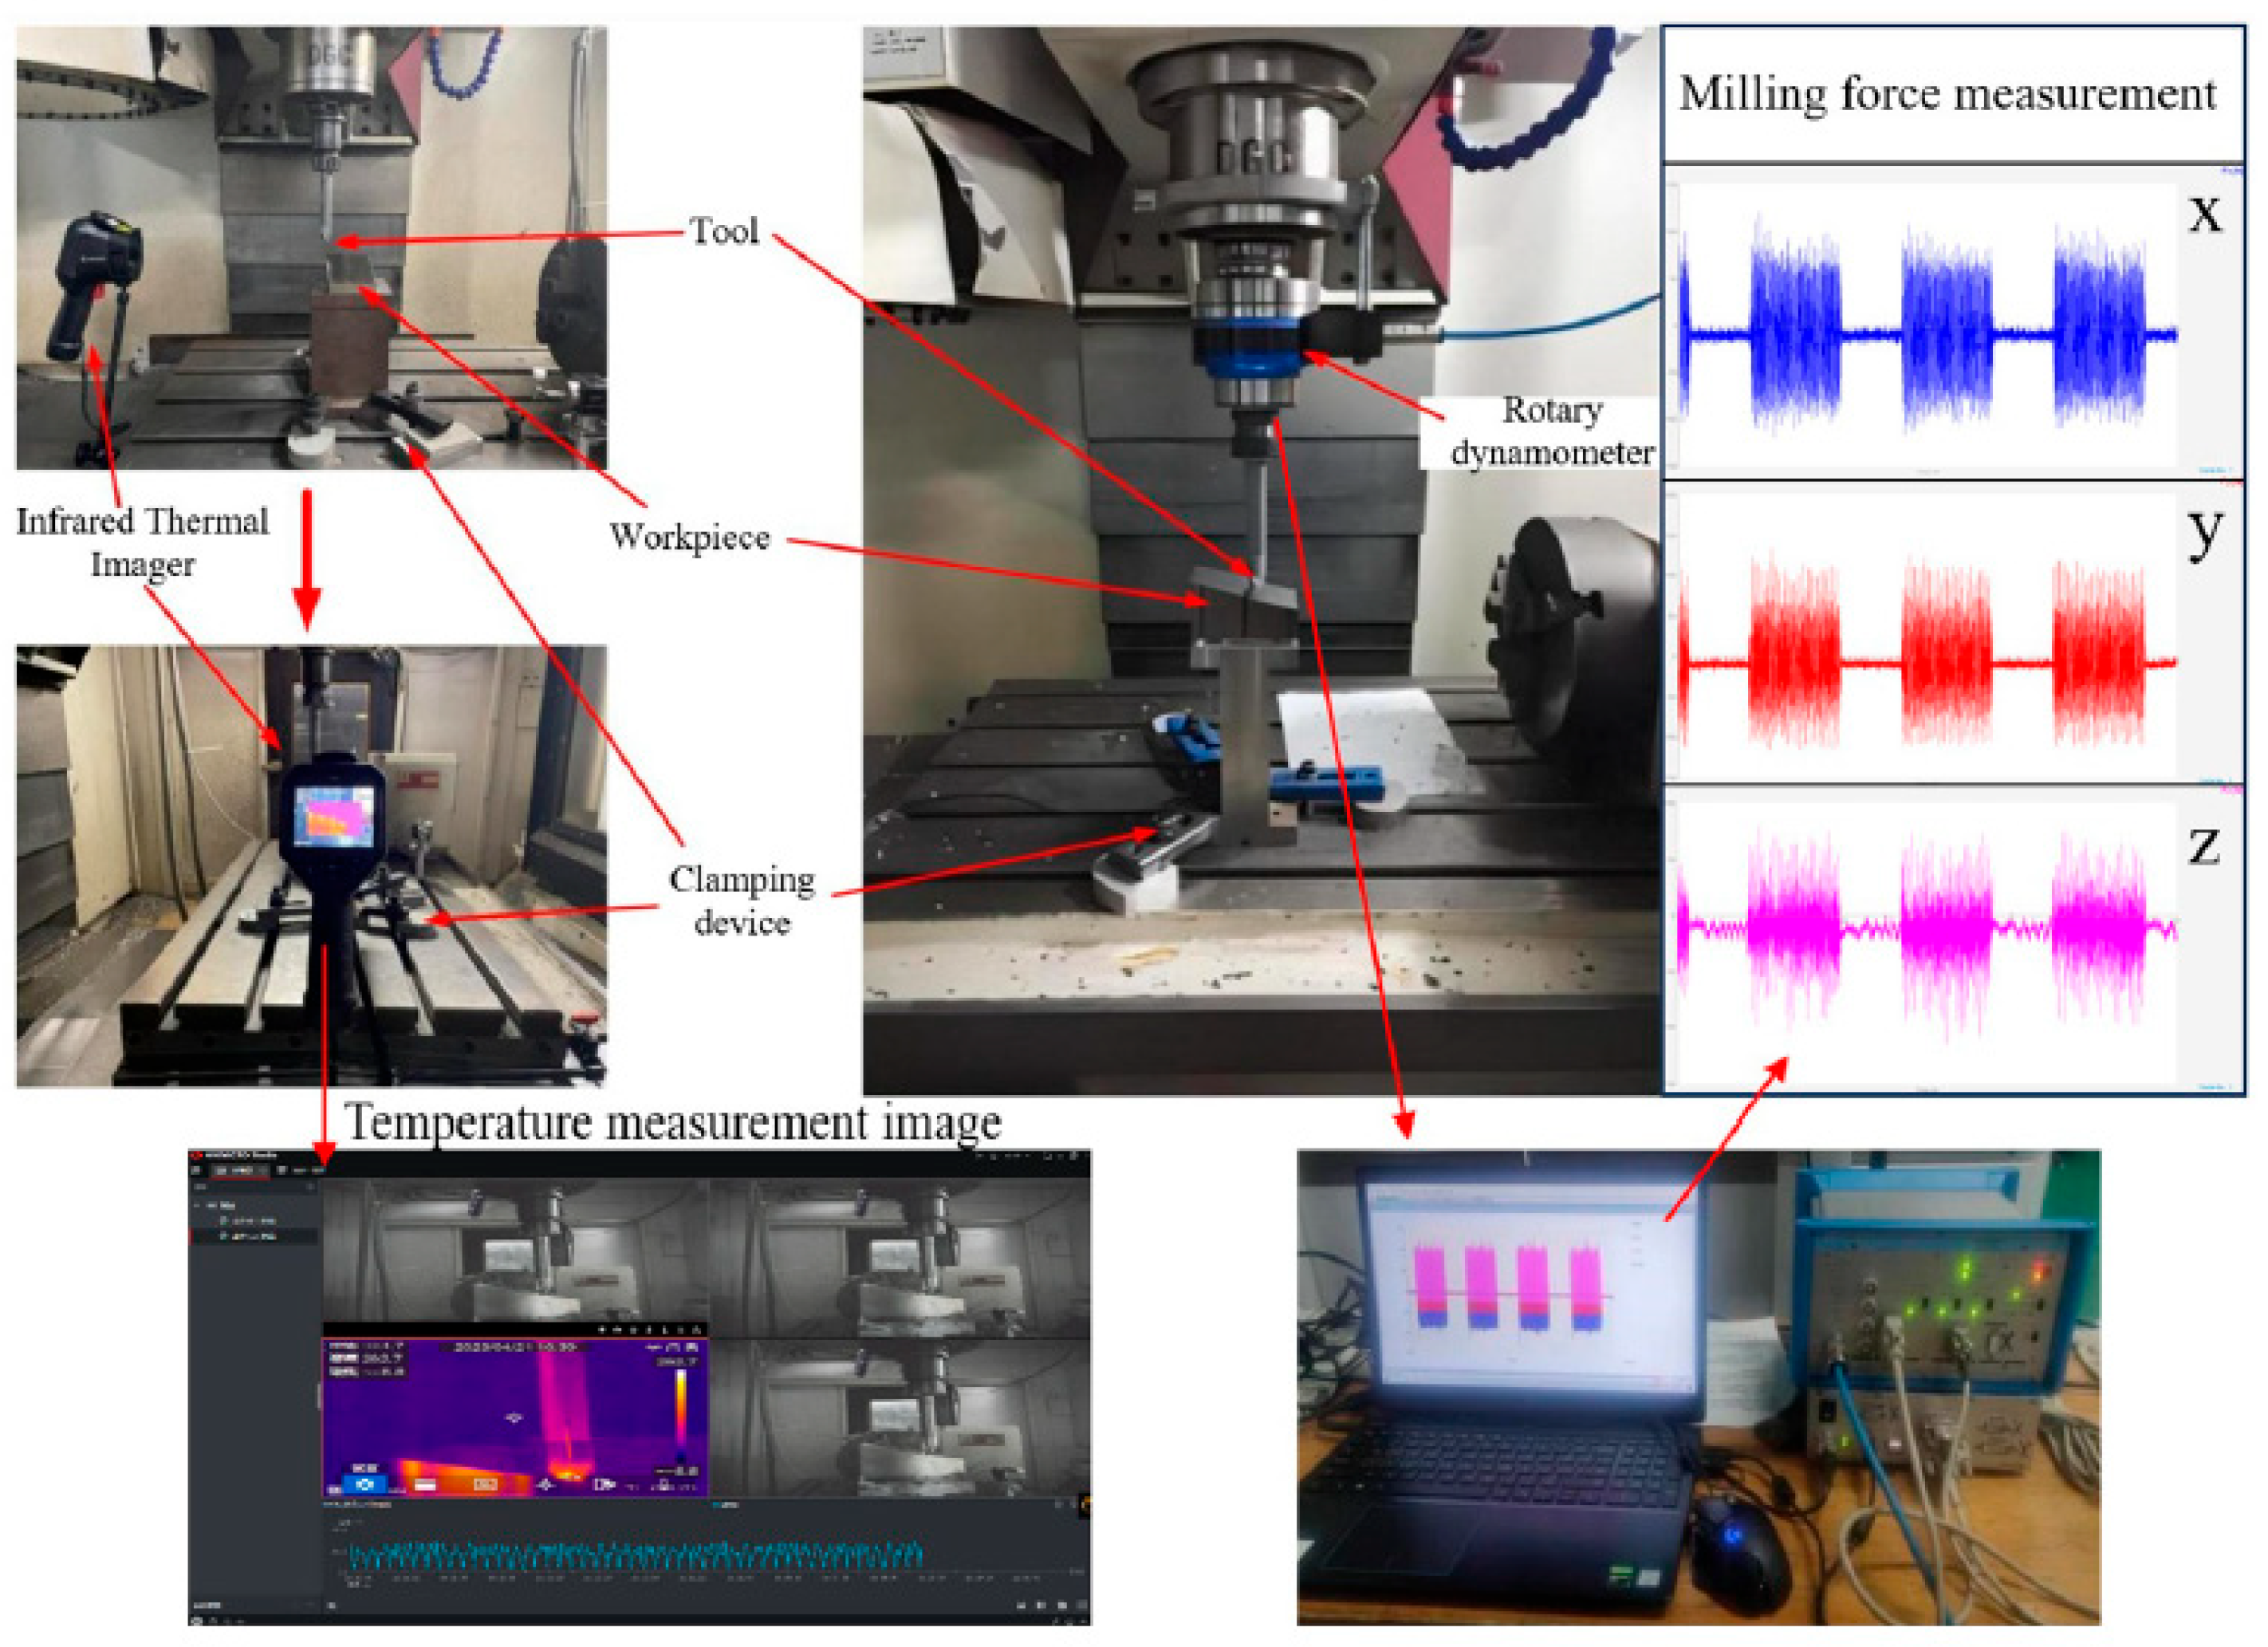
Construction of the test platform
The test utilized a Hikmicro industrial infrared thermal imager, model H26, to collect milling temperature data. The rotary dynamometer Kistler was used to collect the milling forces in three directions in the machining process, as shown on the right side of Figure 5, and the resultant force was calculated to obtain the final milling force data. Figure 5 illustrates the clamping sites for temperature collection on the workpiece, for measuring milling force, and for positioning the thermal imaging instrument.

3.2. Research on the Influence of Tool Micro-Texture Parameters on the Surface Burr Characteristics of Titanium Alloy Workpieces

The workpiece image detection system SH-VS4K and 4K fixed-time coaxial white light lens were used to observe the surface burr morphology of the workpiece after processing. Finally, the image was imported into the Image-Pro Plus6.0 software, and the burr size was measured by magnification of 100 and 1000 times.
Figure 6 depicts the morphology and test results of burrs on the workpiece surface after milling titanium alloy using a micro-textured milling cutter. Groups 1 to 9 represent the test results of textured milling cutters, while group 10 represents the test results of non-textured ball-end milling cutters. By observing the data, it can be found that the preparation of micro-texture on the milling cutter can inhibit the generation of milling burrs to a certain extent. The average height of burrs produced by the micro-textured milling cutter was about 99.01. Compared with non-textured milling cutter, the average height of burrs produced by milling was reduced by 21%. The burr height on the workpiece surface after milling titanium alloy with textured tools was lower than that when using non-textured tools. During the cutting process, abrasive wear and adhesion may occur on the tool and specimen surfaces due to mechanical friction. The resulting chips underwent secondary cutting with the workpiece. As cutting temperature rose, chips accumulated and formed larger burrs at the outlet end. As shown in Figure 7, micro-textures mitigated this by storing and reducing abrasive particles during cutting. As milling progressed, micro-textures on the milling cutter’s front face caused some high-temperature abrasive particles to adhere to the pits. Compared to non-textured cutting tools, the presence of micro-textures on the tool surface reduced force and temperature during milling, thereby suppressing the formation of some burrs.
The correlation between force, temperature, and burr height was tested by Pearson correlation coefficient. It is generally accepted that a correlation coefficient exceeding 0.7 indicates a very close relationship between two samples. According to the data of Figure 8, Figure 9 and Figure 10, we can conclude that the correlation coefficients between force, temperature, and burr height were 0.81 and 0.71, respectively, both surpassing 0.7. Hence, it can be deduced that milling temperature and milling force are significant factors influencing burr height, with a statistically significant correlation between the test data.
Burr formation is a consequence of the workpiece undergoing plastic deformation due to the force exerted by the tool, particularly in the cutting area where plastic deformation is significant. The resultant plastic work is predominantly converted into heat, causing a rise in temperature. Moreover, the greater the plastic deformation in the cutting area, the more heat is generated, leading to higher temperatures and subsequently increased burr height. Higher temperatures also correlate with greater hardness, making the removal of burrs formed at elevated temperatures more challenging compared to those formed at lower temperatures.
With an increase in milling force, the applied load on the surface of the workpiece intensified, resulting in higher levels of plastic deformation within the contact region of the tool. Consequently, the area of the fourth deformation zone at the outlet end expanded. As shown in Figure 11. This led to the emergence of an extended negative shear band. The augmentation of negative shear bands modified the path of plastic flow in the workpiece material during the cutting operation. More material transitioned from upward flow to rotational flow, thereby increasing the size of the burrs formed at the outlet (Figure 11).
Through the range analysis of the burr height L, milling force, and milling temperature measured in the test designed in Table 1, the K value and R value were calculated, and the influence of micro-texture parameters on the three was sorted to obtain the data in Table 2. According to the range analysis shown in Table 2, it can be seen that the micro-texture distance L and the micro-texture spacing L1 had the most significant impact on burr size, while the micro-texture diameter D had the least impact on milling burr size.
The height of a burr was positively correlated with L. As the micro-texture was farther away from the cutting edge, the area of micro-texture action decreased, reducing the number of micro pits available to store abrasive particles and chips during cutting. Consequently, the wear resistance of micro-textured cutting tools became worse, leading to increased friction force and main cutting force in the cutting area, as well as the heightened plastic flow phenomenon of the titanium alloy, thereby increasing the size of burrs. Additionally, due to the increase in friction, the temperature of the tool-chip contact area increased, and the resulting outlet burr had high hardness and low strength, which is difficult to remove.
The height of a burr was positively correlated with L1. A higher L1 value resulted in a slight reduction in the quantity of micro pits within the contact region, causing a decrease in the effective micro pit area per unit area. Consequently, the wear resistance of the ball-end milling cutter decreased, making the tool more susceptible to adhesive wear and abrasive wear, which in turn increased force and heat during the milling process. The sharp increase in temperature led to adhesive wear on the tool surface and an increase in burr size.

3.3. Research on the Influence of Blunt Round Edge of Cutting Tools on the Surface Burr Characteristics of Titanium Alloy Workpieces

The test results of the surface burr height of the workpiece under different blade parameters are shown in Figure 12 and Figure 13. The enhancement of thermal characteristics in ball-end milling of titanium alloy was evident with the increase in blade radius. Since the burr height was predominantly influenced by milling temperature and milling force, it decreased accordingly.
As shown in Figure 14, when the radius of the blade was small, the blade was sharp, but the contact area between the blade and the workpiece was small, which made it easy to cause stress concentration at the edge and blade collapse. Both force and temperature were high. With an incremental increase in the cutting edge radius, the contact area between the tool and the workpiece expanded, resulting in the dispersion of stress at the cutting edge. This expansion of contact area also aided in the diffusion of localized heat within the contact area of the tool chips. Consequently, both milling force and temperature decreased. This led to a reduction in plastic deformation on the workpiece surface, an increase in the support stiffness of the workpiece, and heightened constraint on the material’s plastic flow during cutting, to some extent restraining the expansion of the fourth deformation zone. Therefore, increasing the cutting edge radius had an inhibitory effect on burrs at the milling outlet.
In summary, as the cutting edge radius increased, the force and temperature during the milling process decreased, consequently reducing the burr height of titanium alloy workpieces. These test results aligned with previous theoretical findings, thereby validating the accuracy of the theoretical model.

4. Study on the Influence of the Interaction between Mesoscopic Geometric Features and Cutting Parameters on the Surface Burr of Titanium Alloy

4.1. Interactive Test Design

In order to examine the combined impact of cutting parameters, cutting edge radius, and micro-structure parameters on burr formation, an interaction test was formulated for investigation. Based on relevant research, the distance L between the micro-texture and the cutting edge ranged from 110 to 150 μm, while the micro-texture diameter D ranged from 40 to 60 μm. The micro-texture spacing L1 varied from 130 to 170 μm, and the radius R of the blunt circular edge ranged from 40 to 60 μm. The cutting speed v ranged from 140 to 180 mm/min, the cutting depth ap ranged from 0.3 to 0.5 mm, and the feed rate f ranged from 60 μm/z to 80 μm/z [21]. An orthogonal test table was designed to account for interactive effects, as shown in Table 3. A total of 27 groups of tests took place.

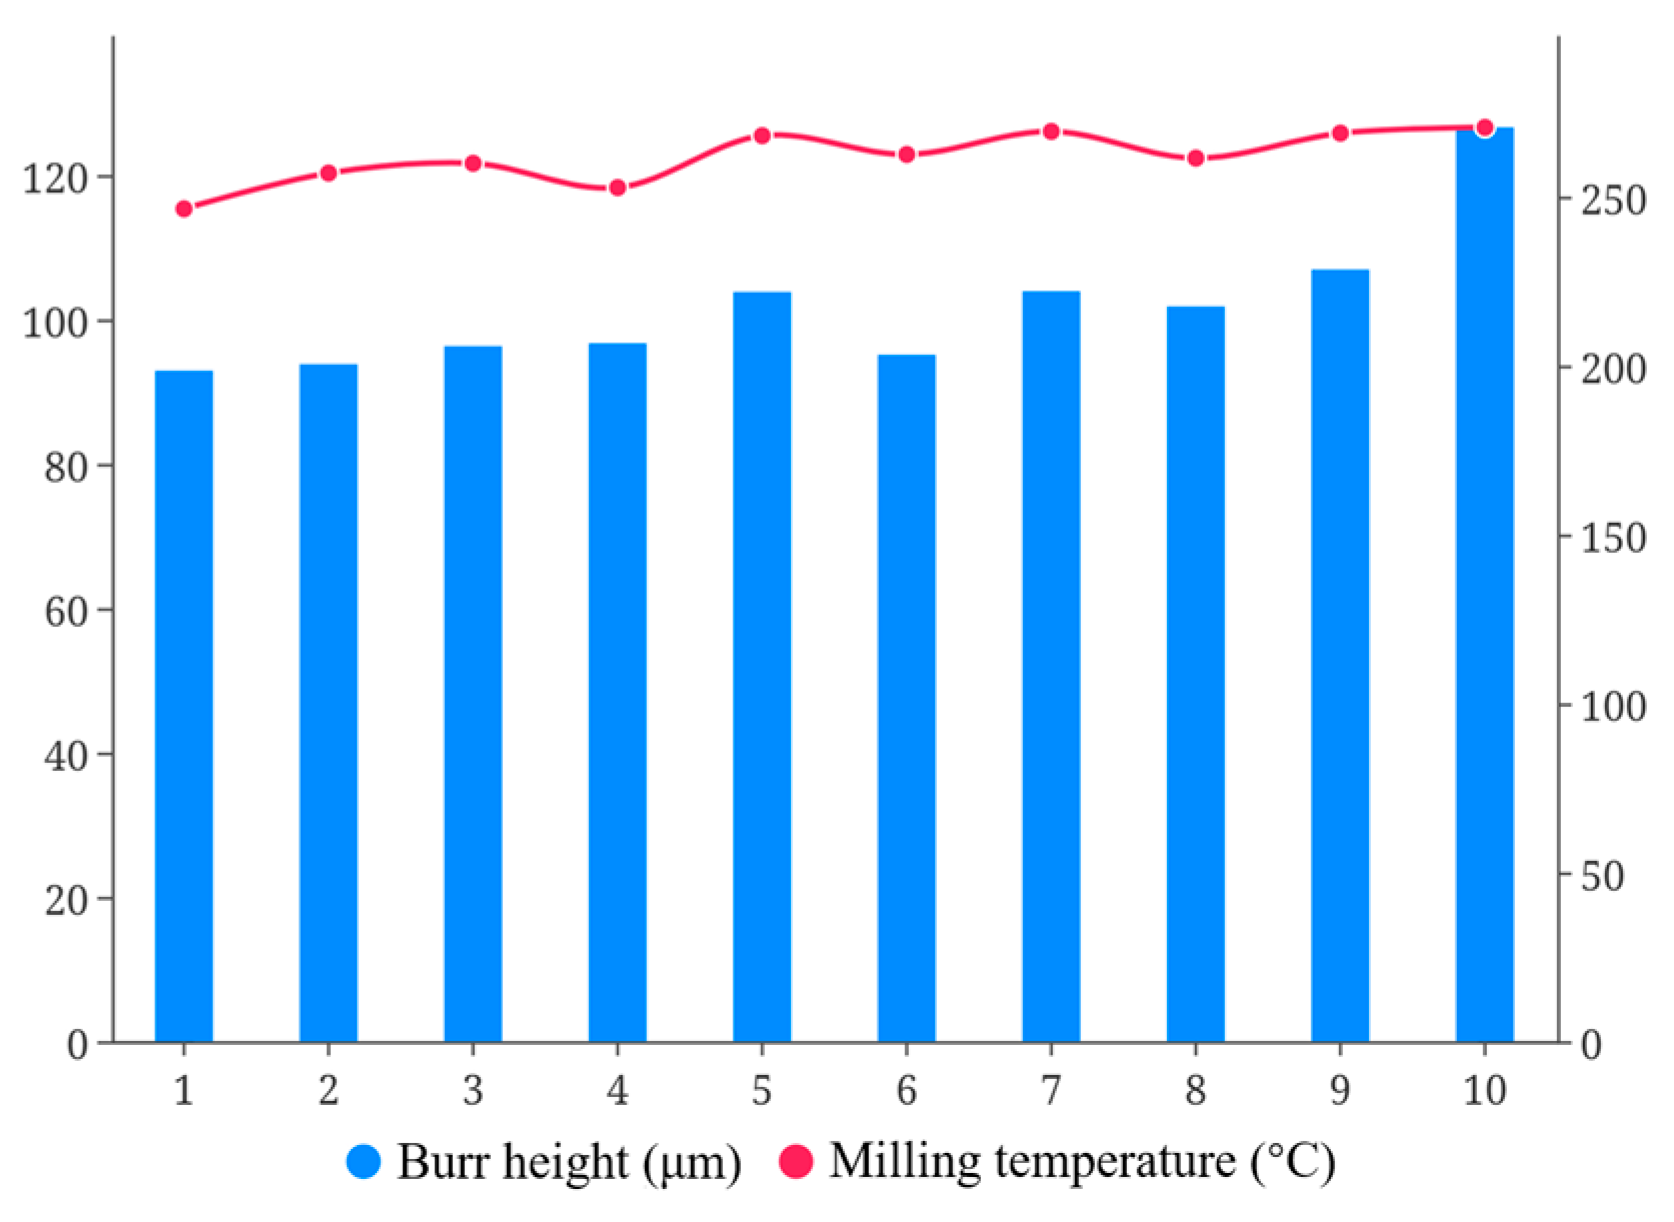
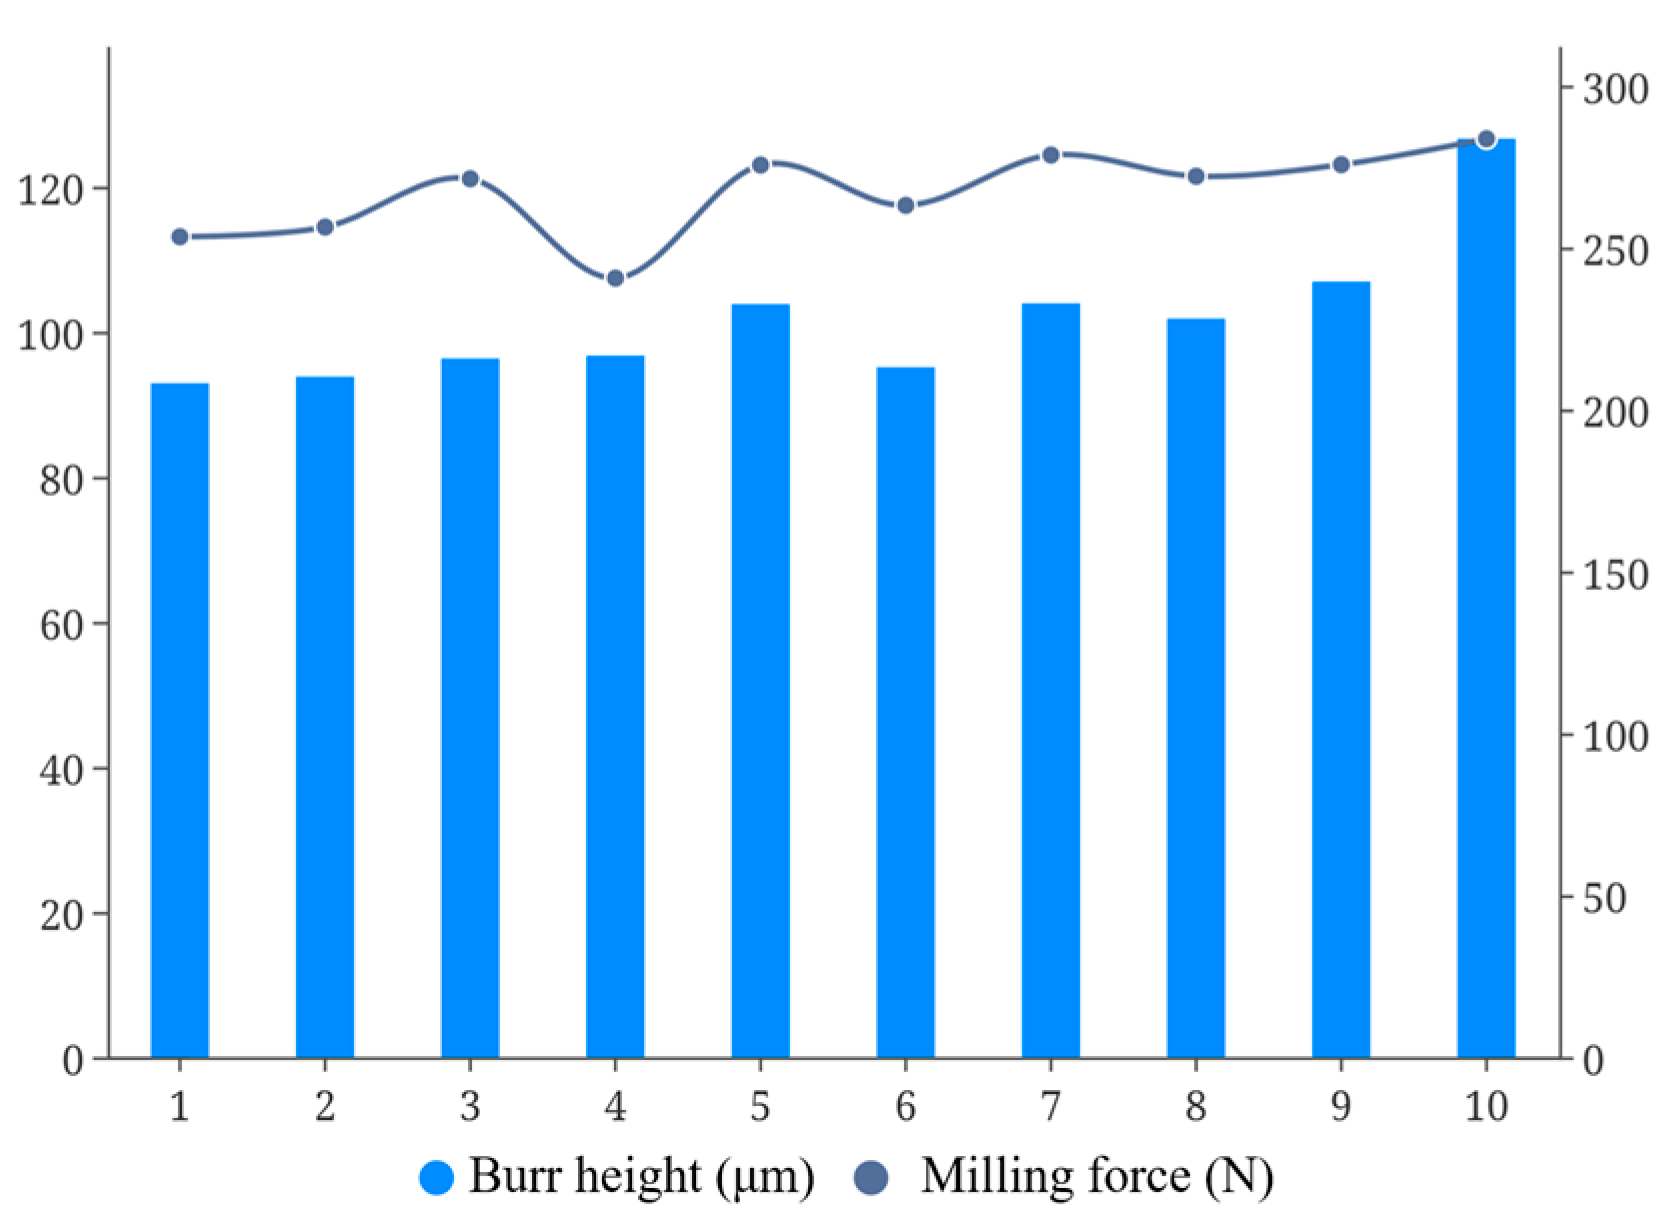
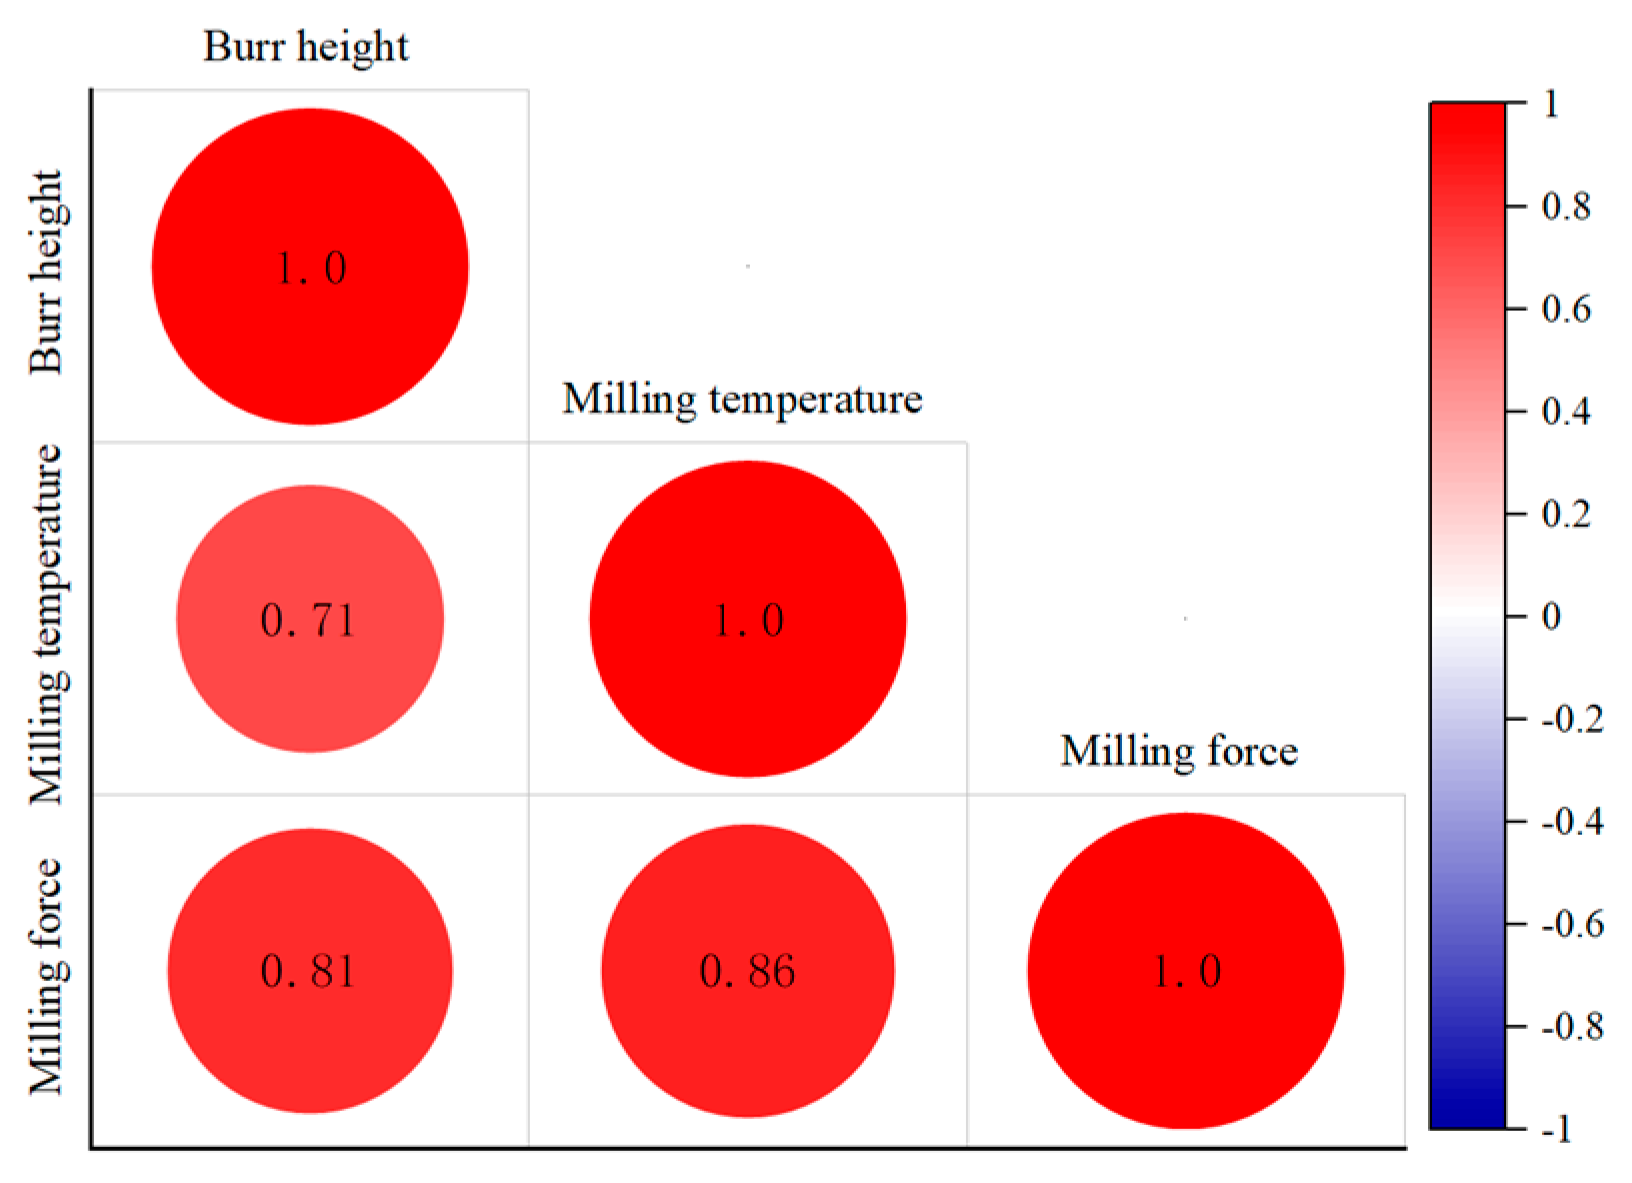
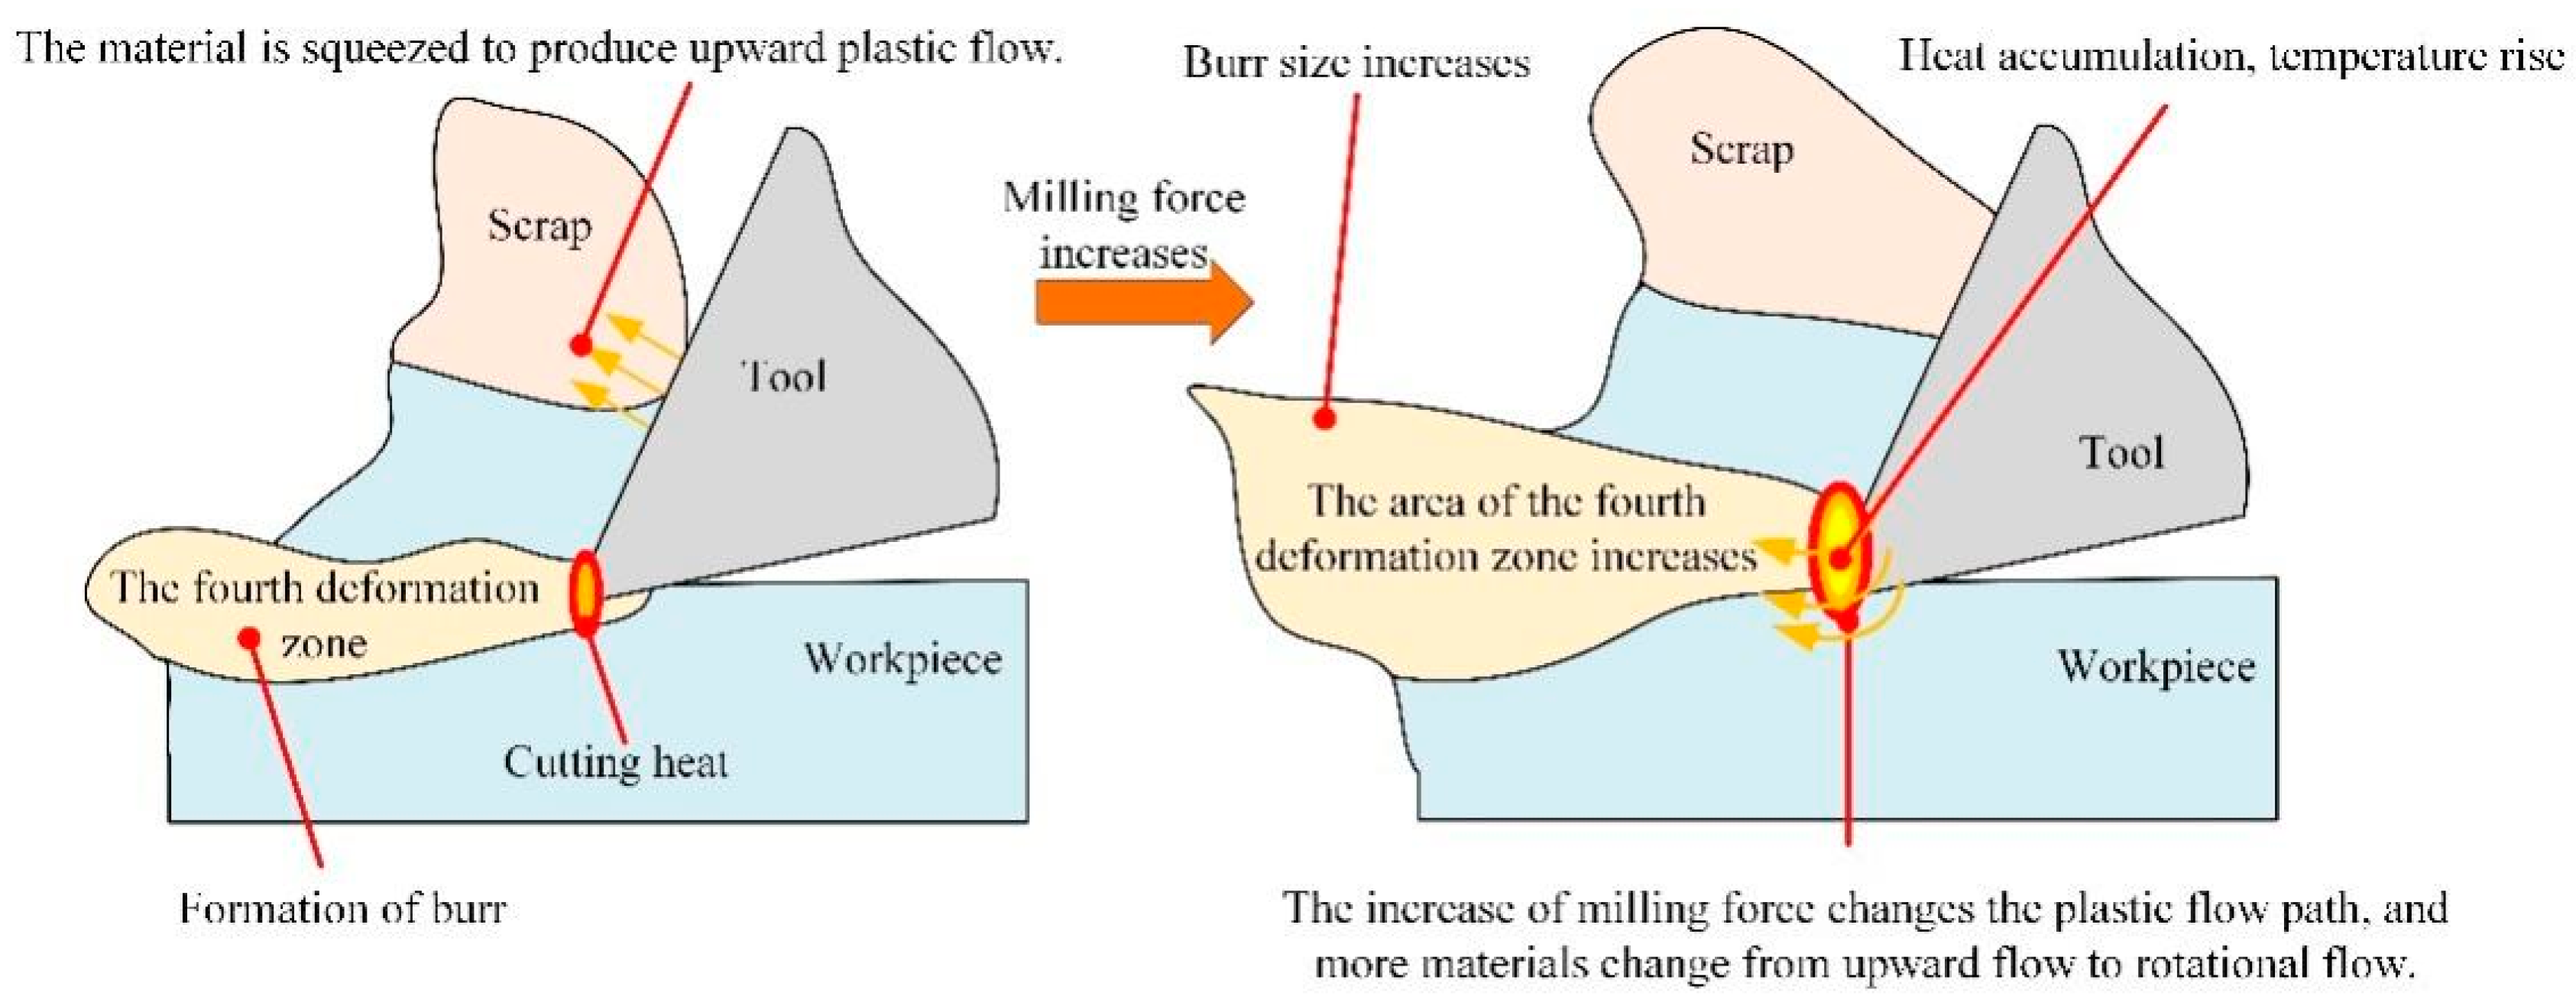
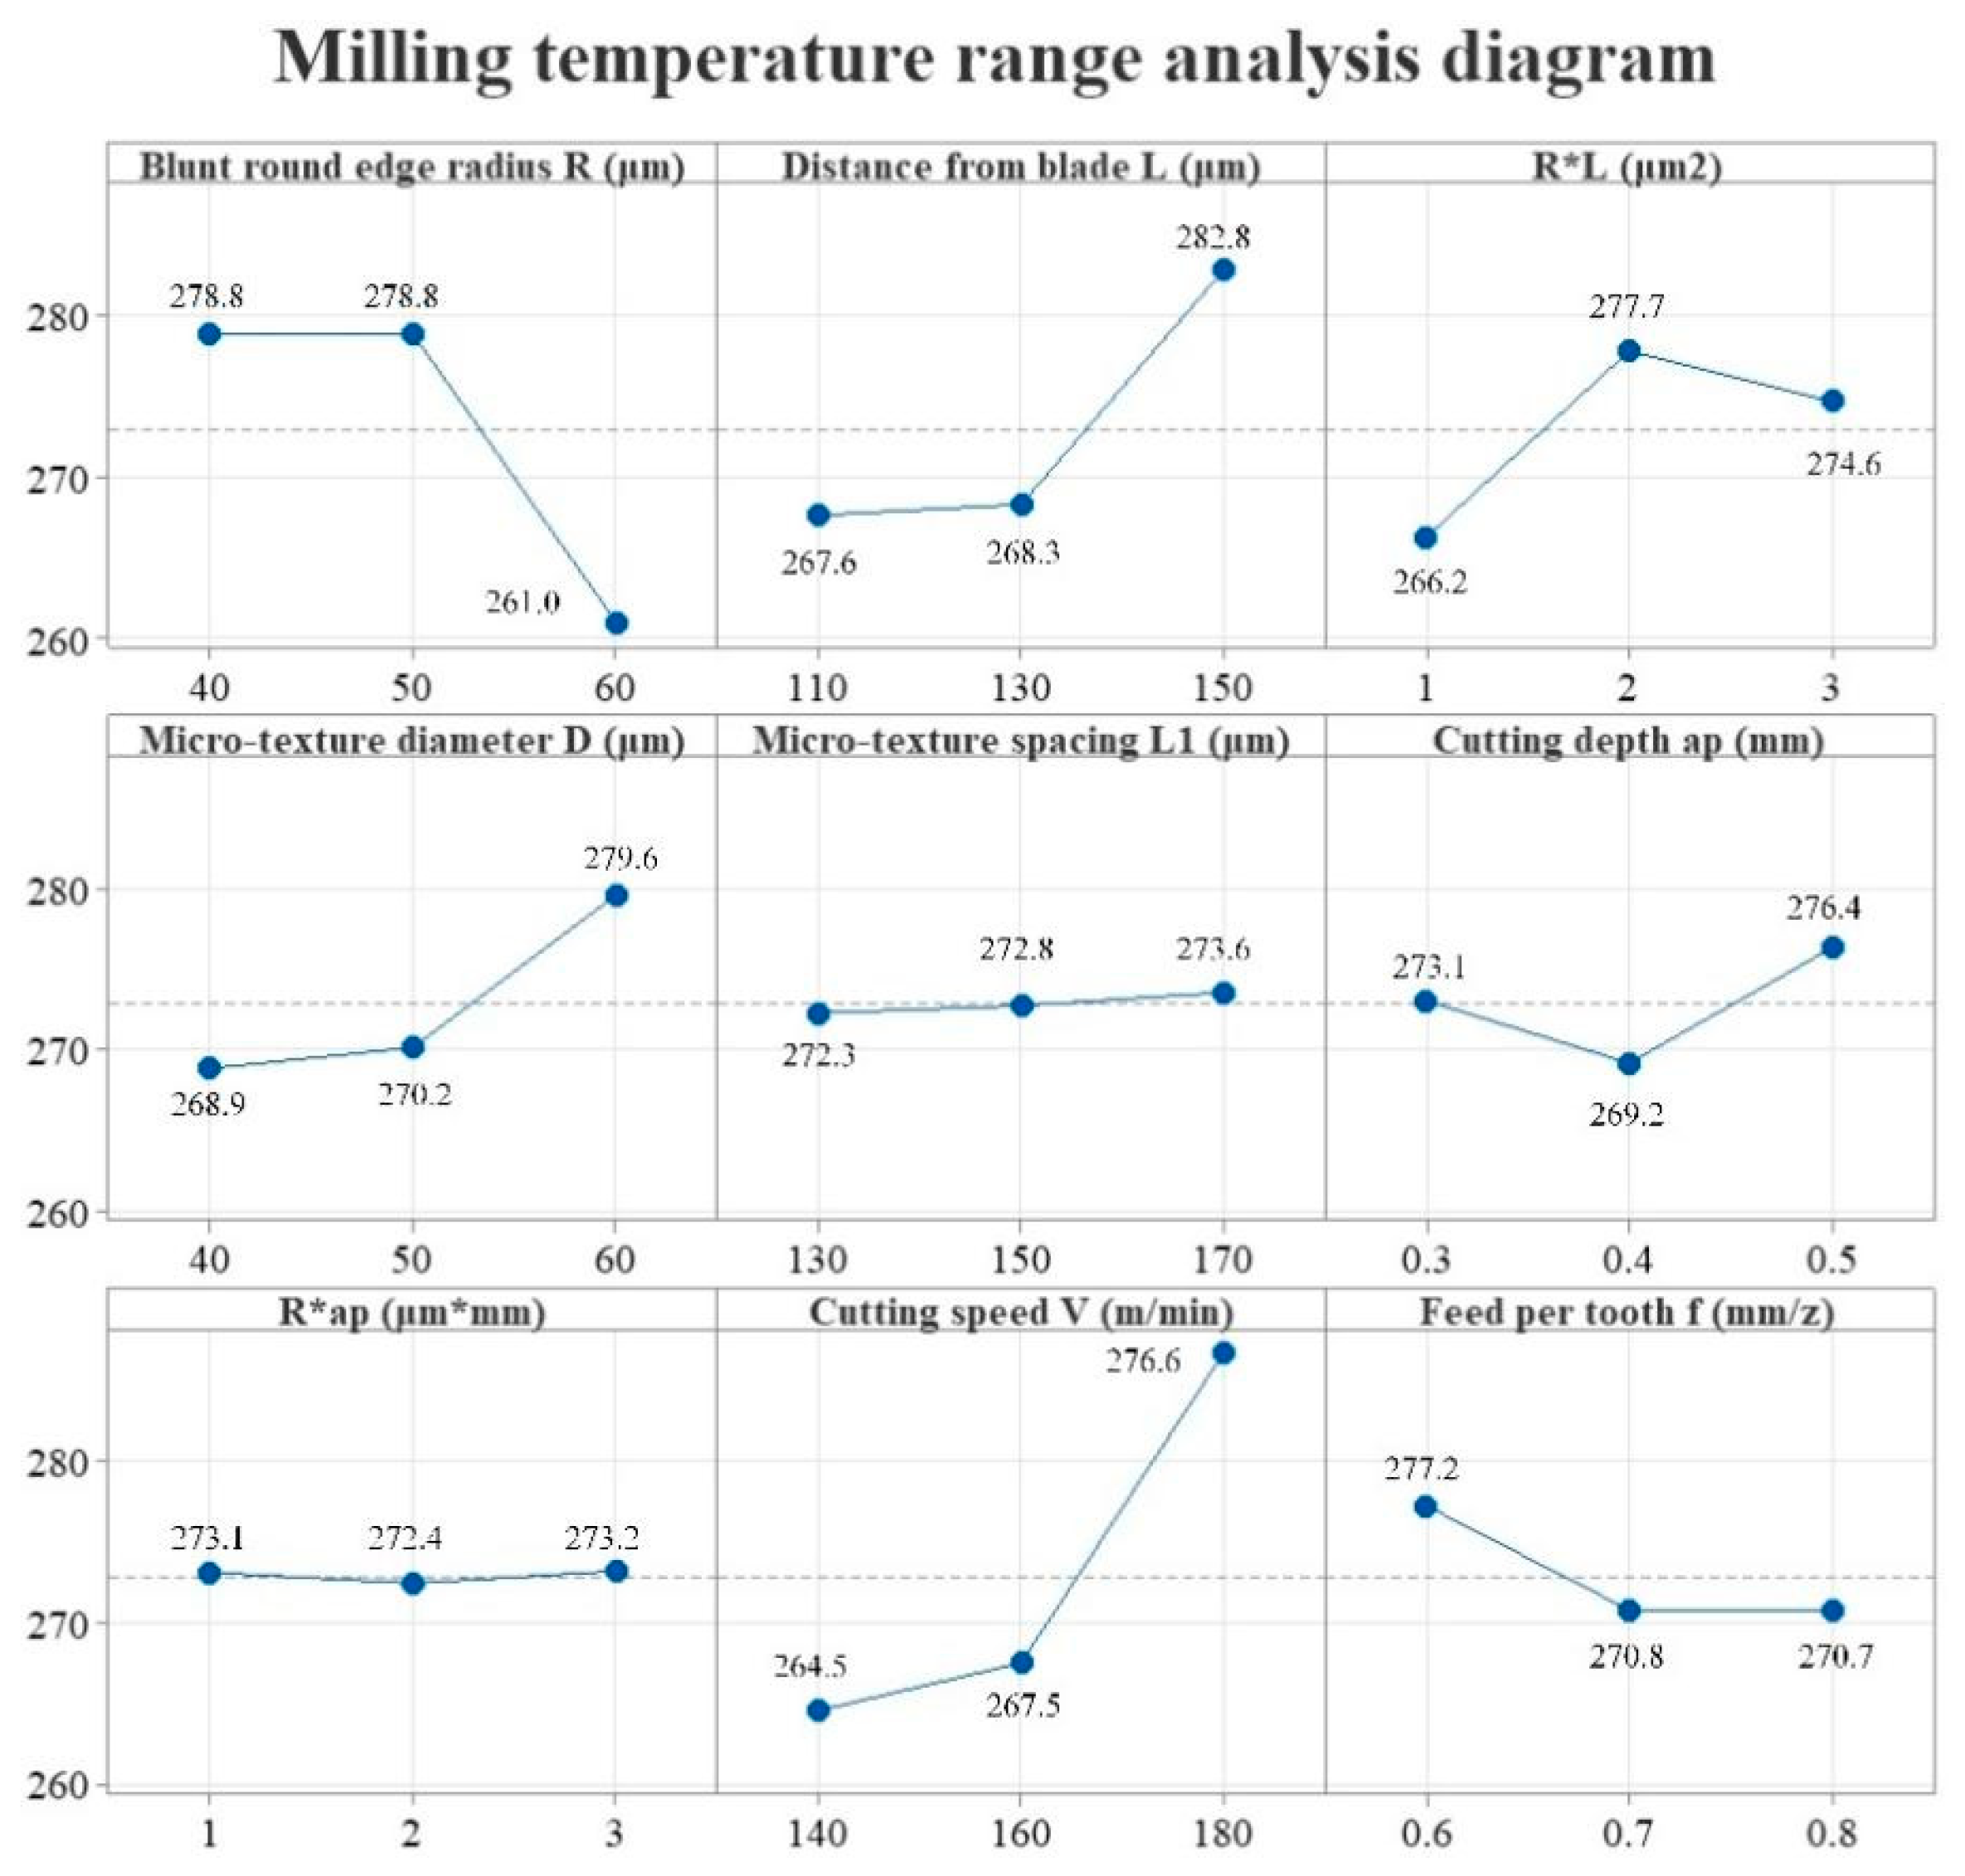
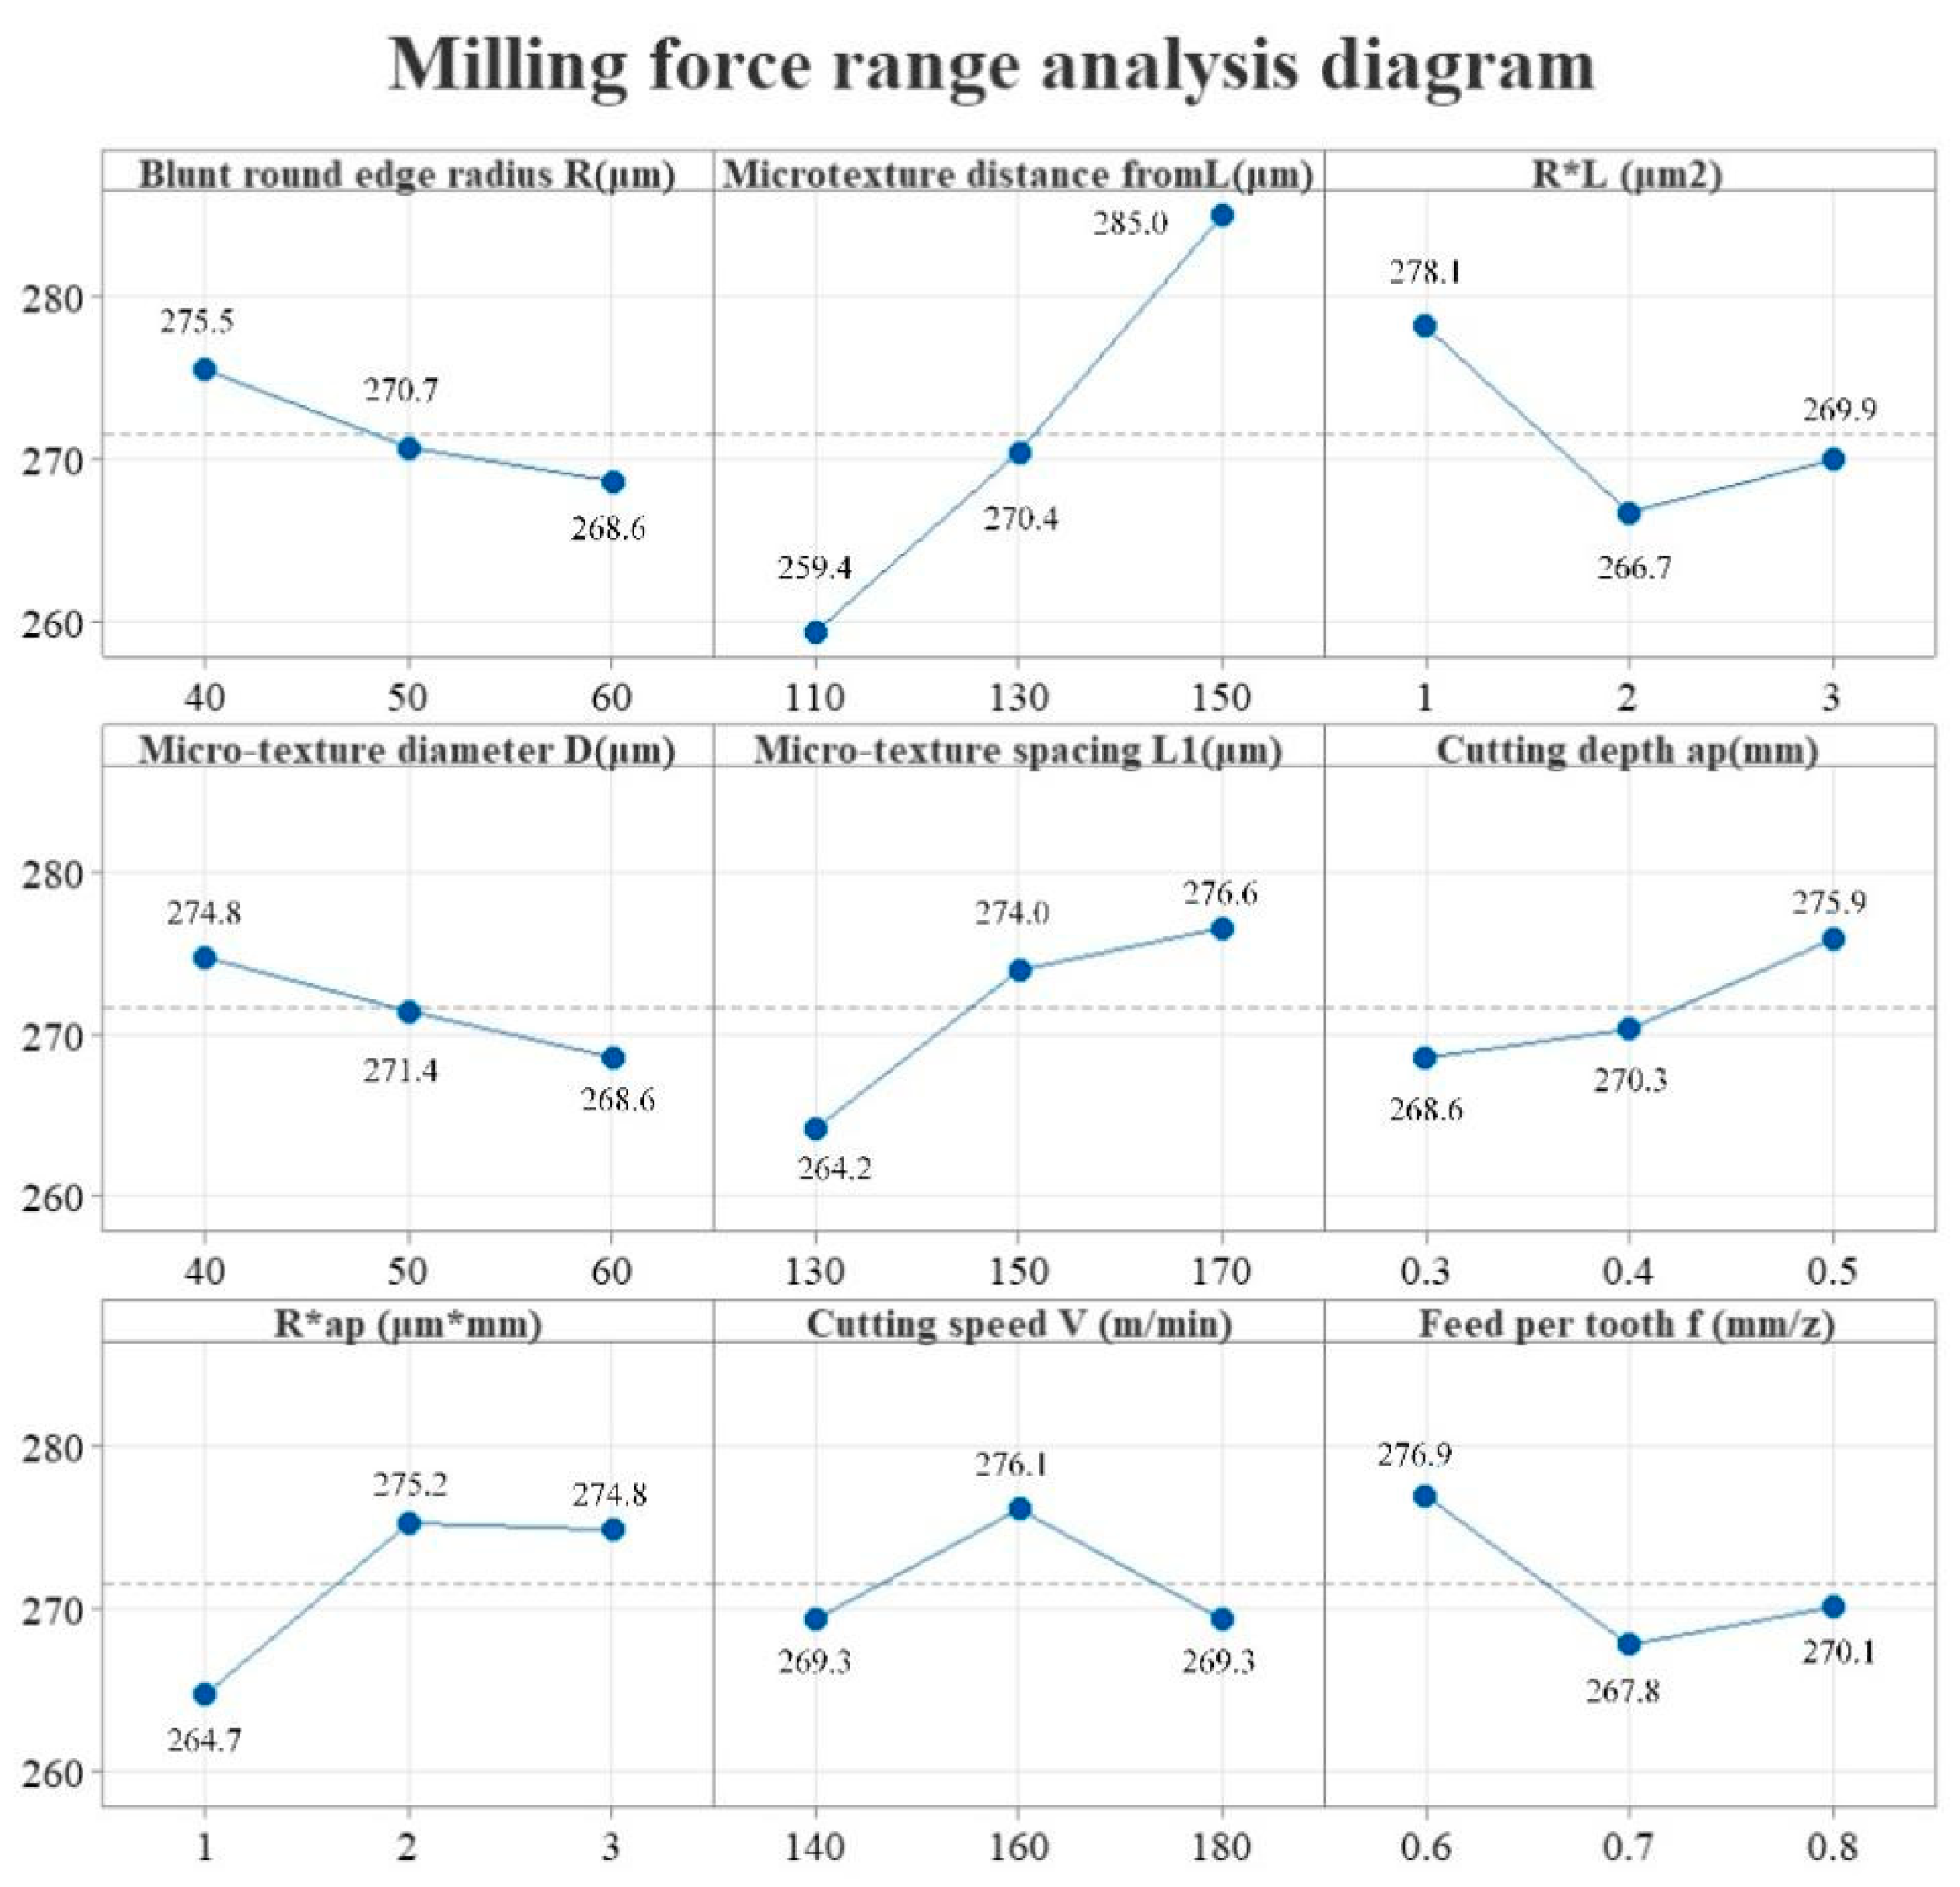
4.2. Analysis of the Results of Interaction Test Force Thermal Characteristics

The measurement results of milling temperature and milling force in the interactive test are shown in the two columns on the right side of Table 3. Range analysis of the milling temperature and milling force test results was conducted to generate Figure 15 and Figure 16. As depicted in Figure 15, the factors with a significant impact on milling temperature were cutting speed v and cutting edge radius R. With an increase in cutting speed v, the milling temperature also rose. Conversely, there was a negative correlation between the cutting edge radius R and milling temperature, where an increase in the cutting edge radius R resulted in a decrease in milling temperature. Additionally, the interaction between the cutting edge radius R and the micro-texture distance L significantly influenced milling temperature. However, the influence of the interaction between the cutting edge radius R and the cutting depth ap on milling temperature was negligible and can be disregarded.
As illustrated in Figure 16, the factors significantly influencing milling force include the distance from the micro-texture to the cutting edge L, as well as the distance between micro-textures L1. Milling force increased with an increase in the micro-texture distance L from the cutting edge and the micro-texture spacing L1. Furthermore, the interaction among the cutting edge radius R, the distance from the micro-texture to the cutting edge L, and the cutting depth ap also had a notable impact on milling force. The feed rate f had the most significant effect on the milling force, while the micro-texture diameter D and cutting speed v had the least significance.

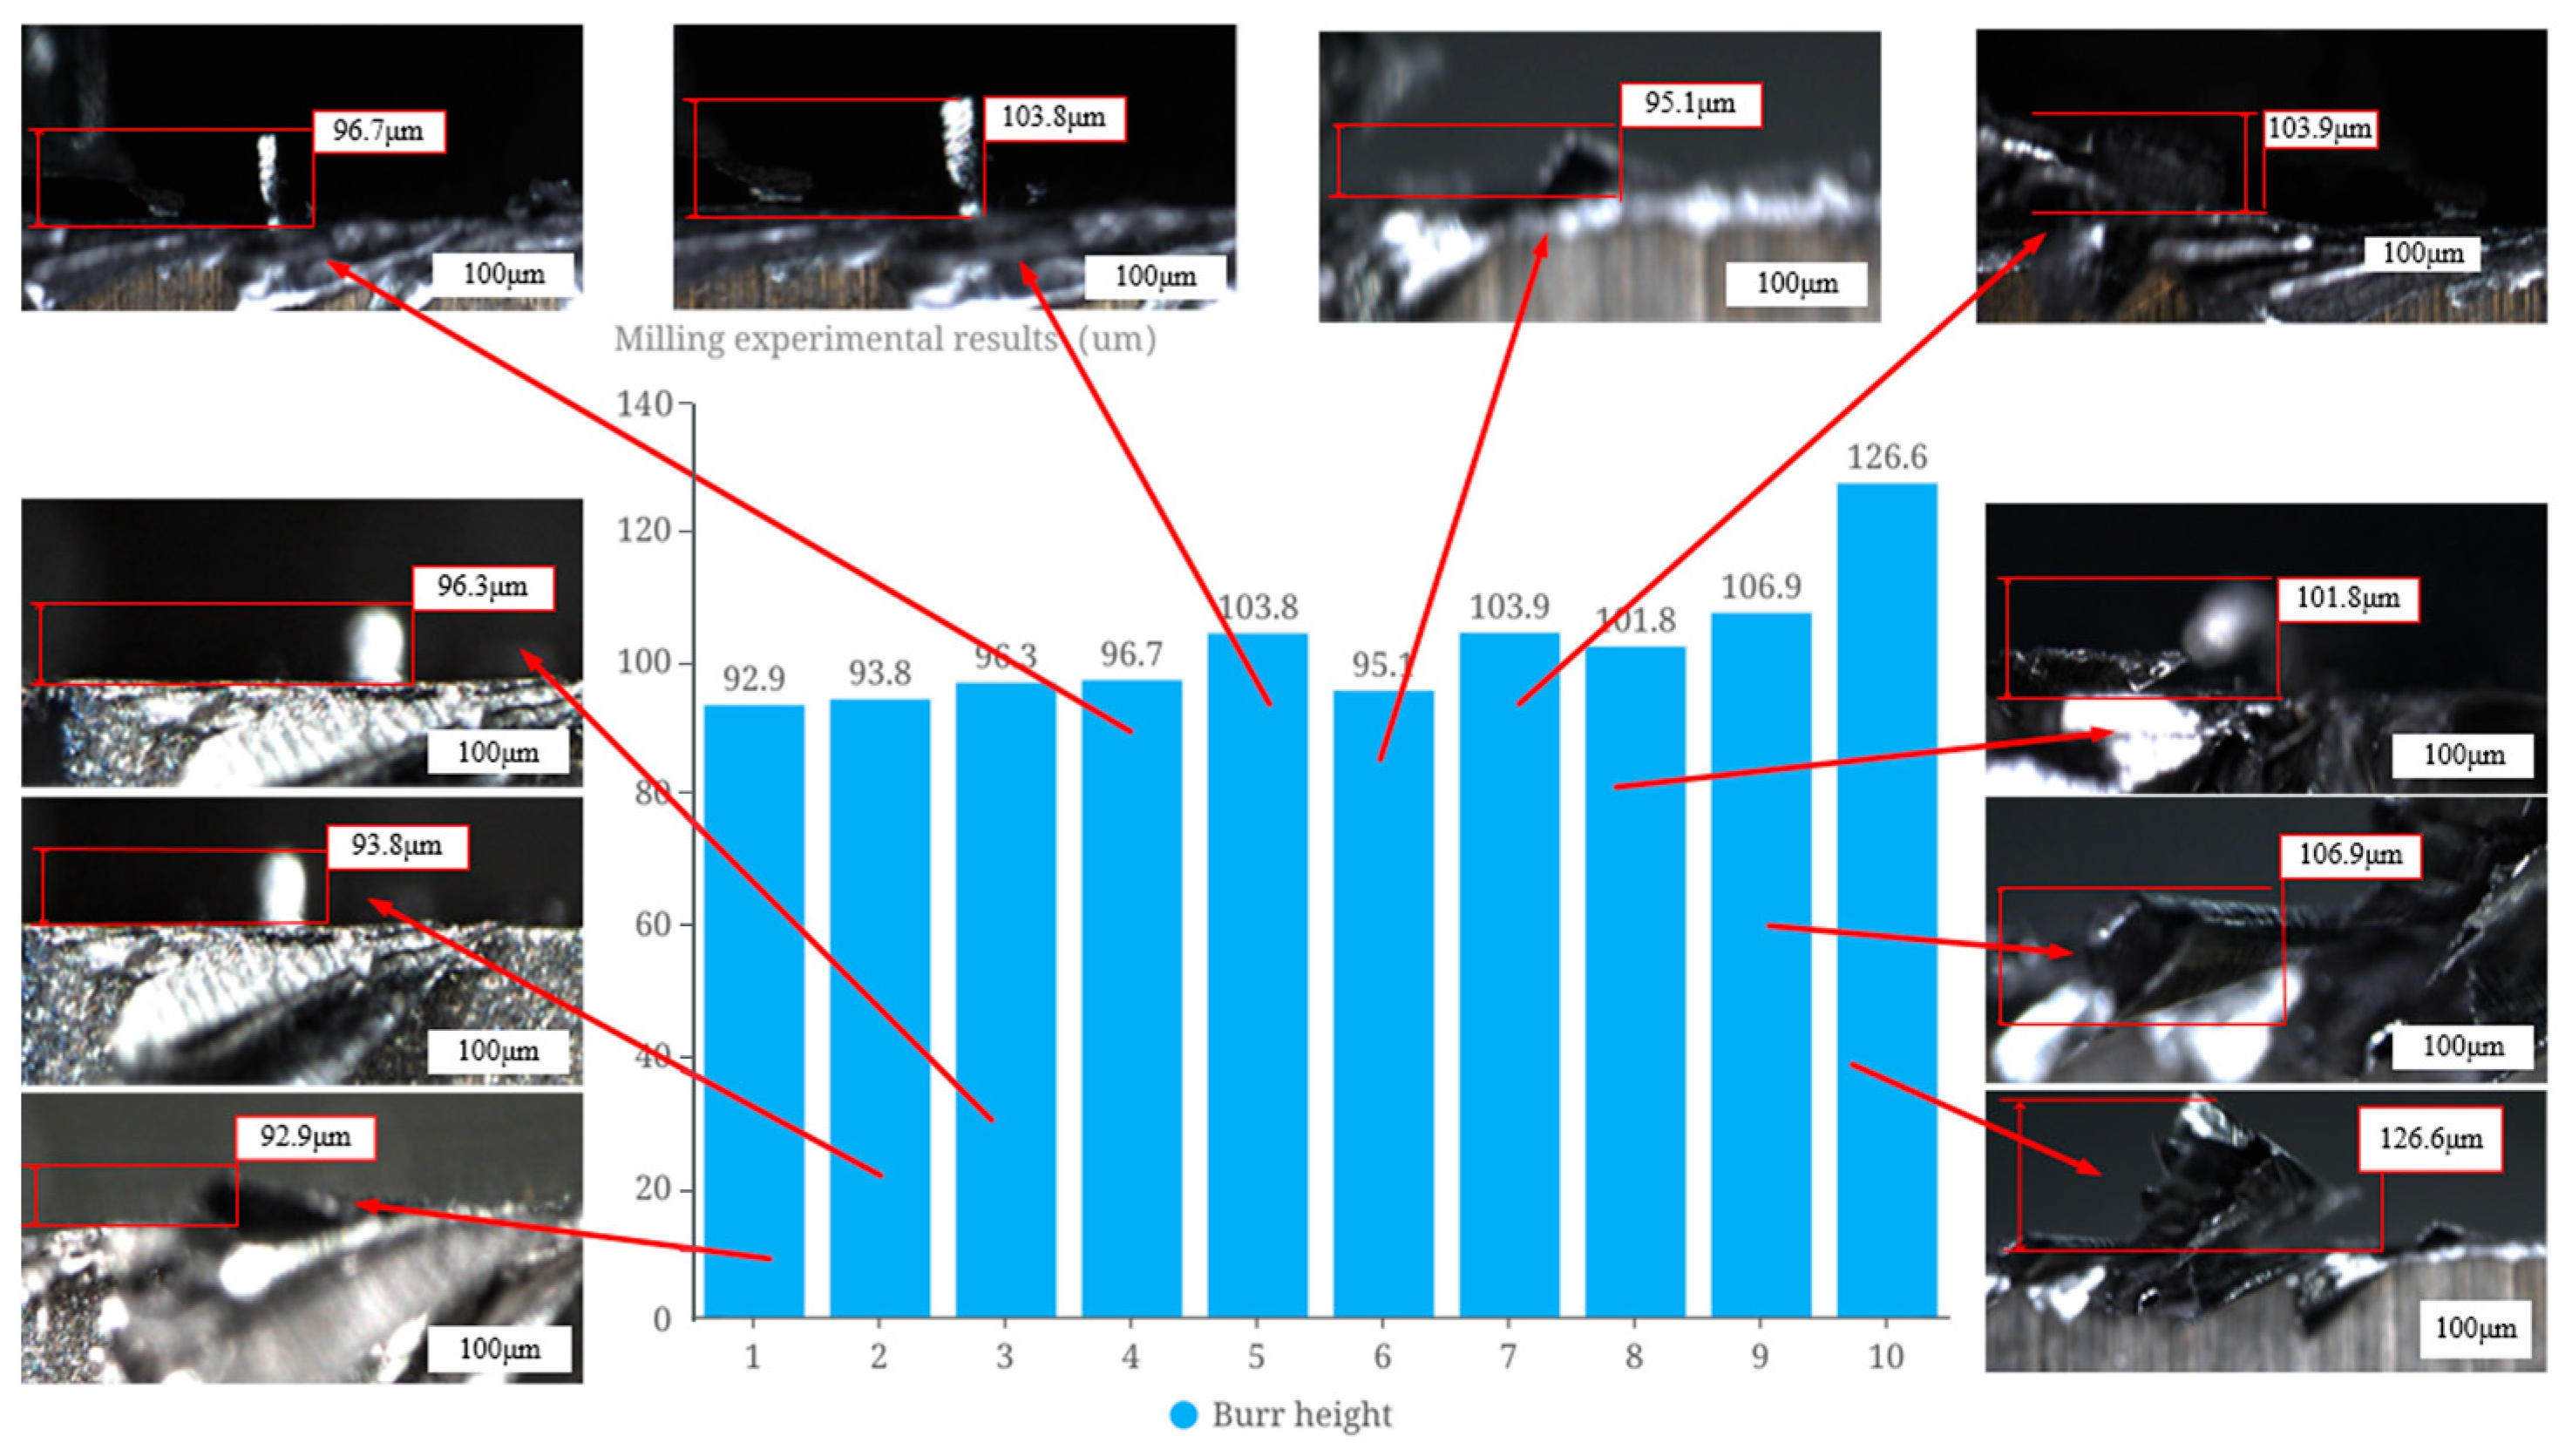
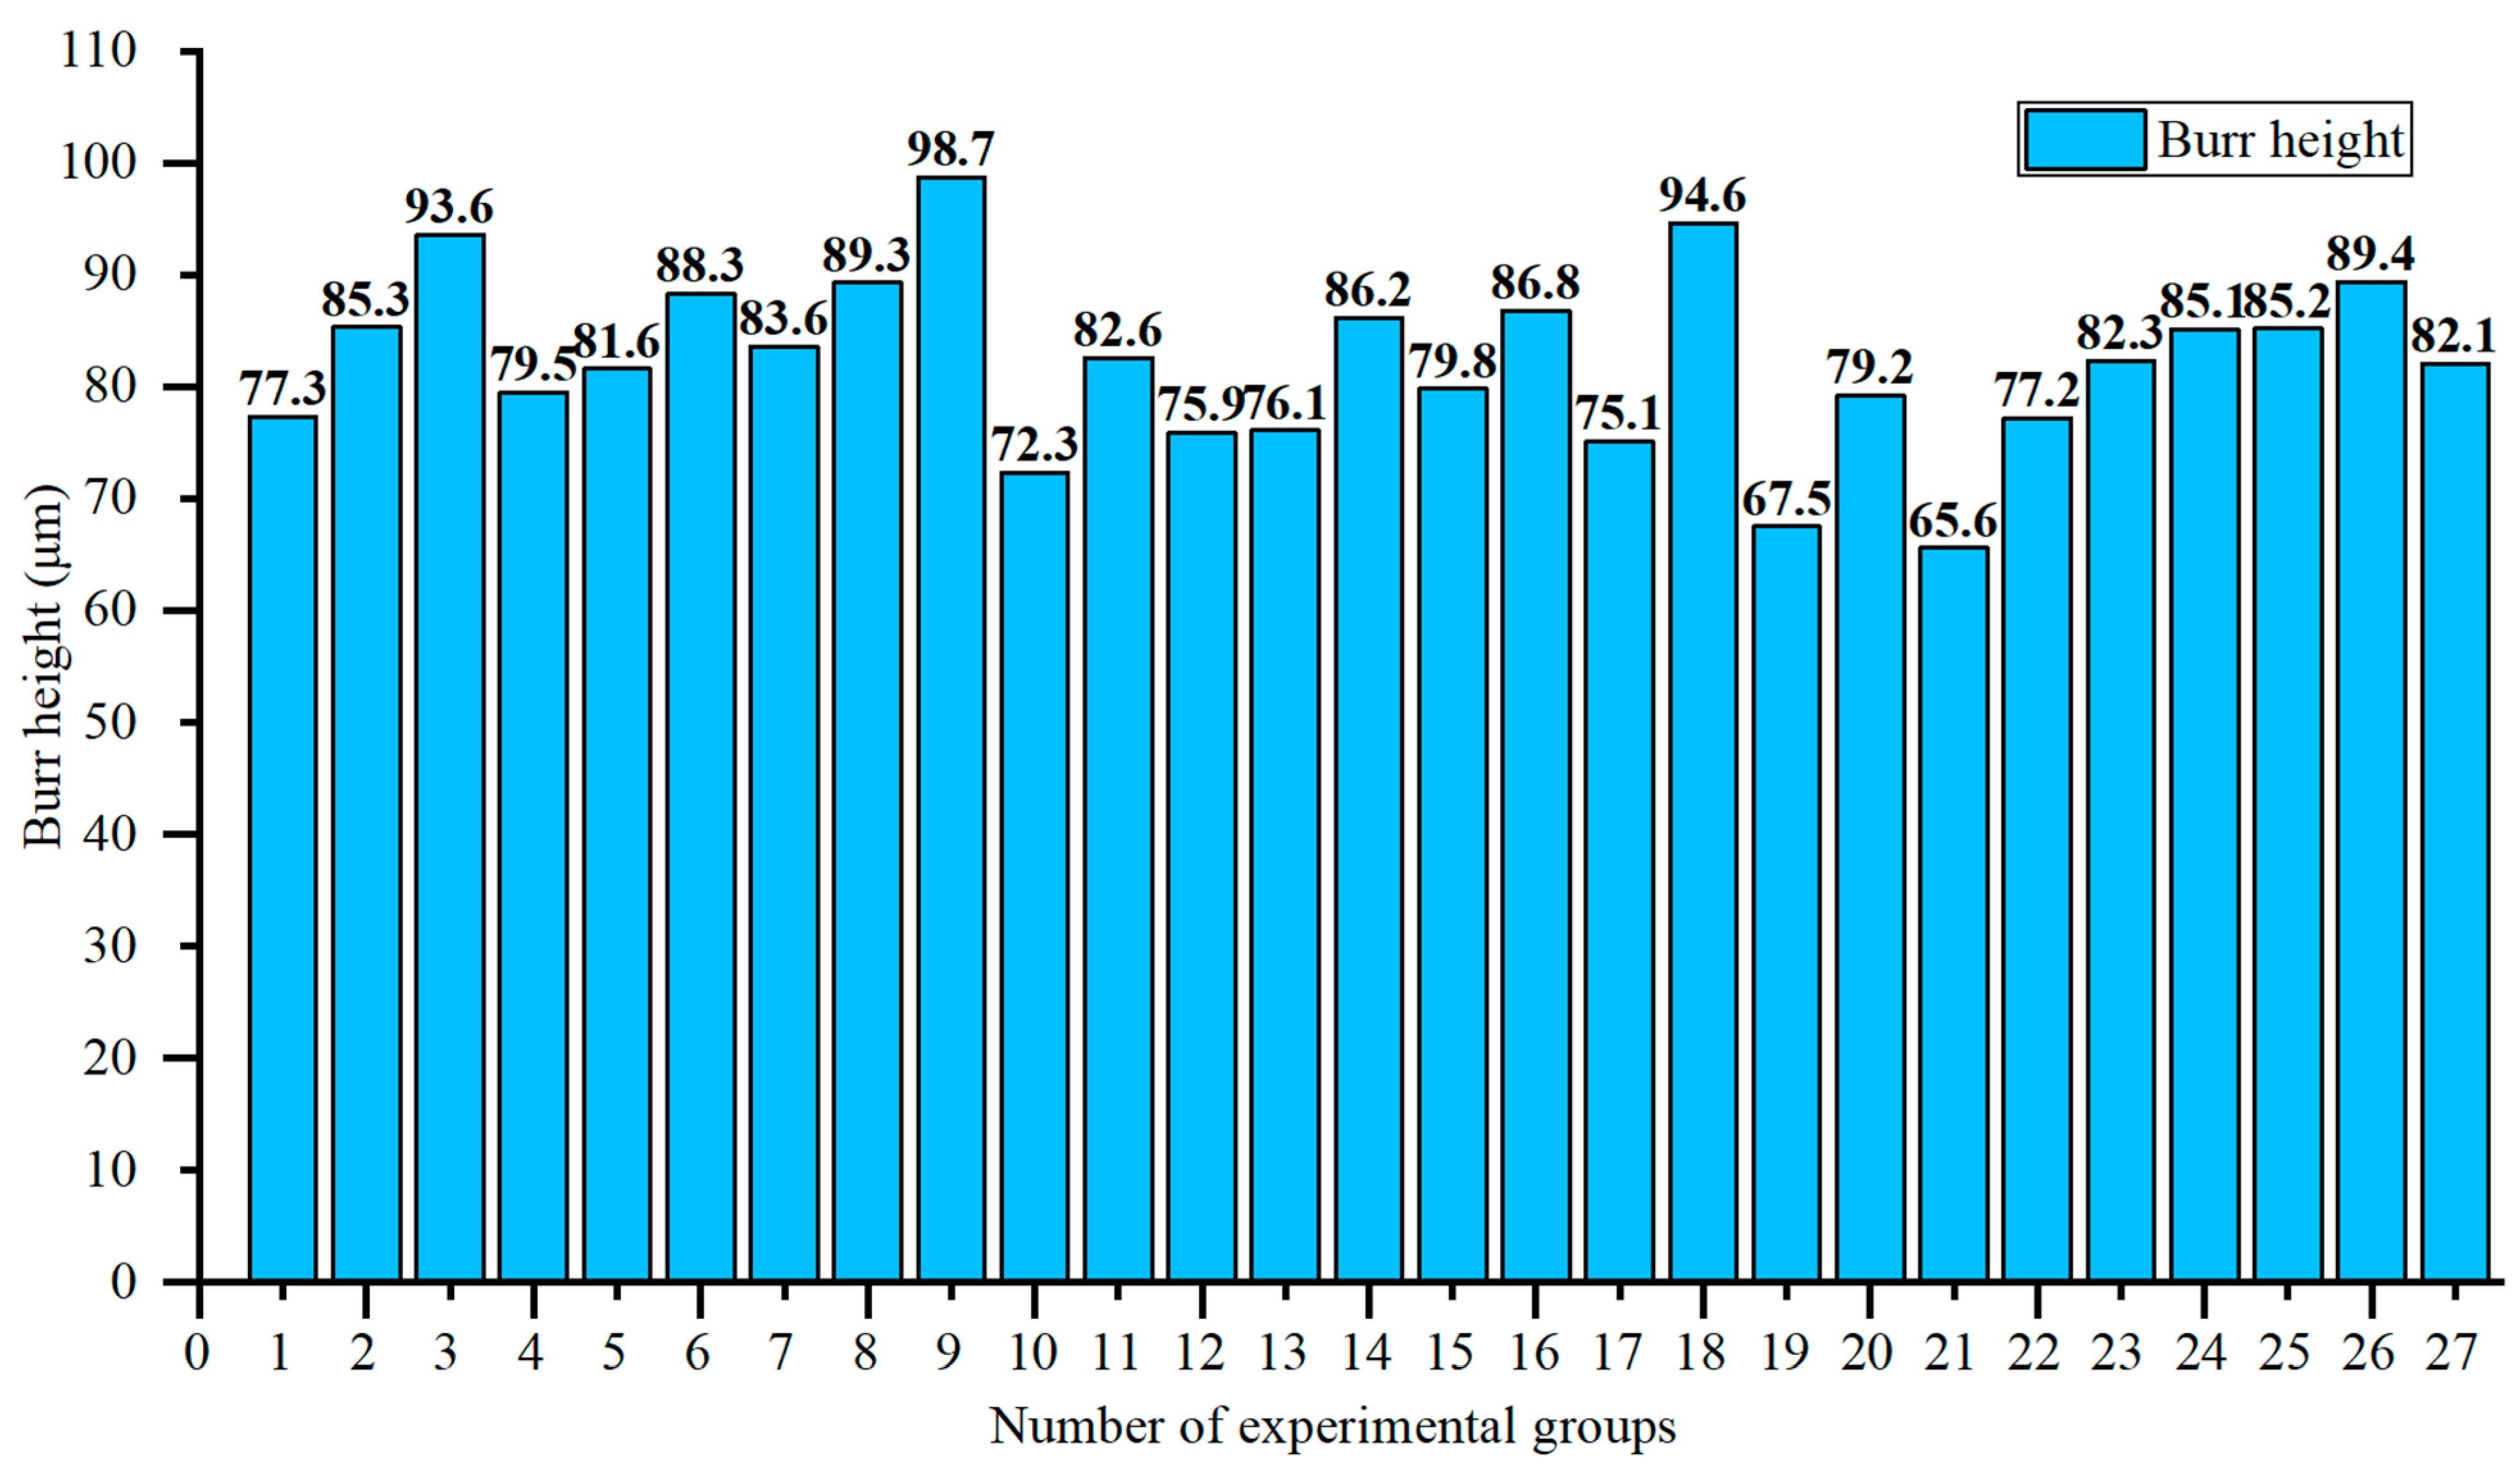
4.3. Analysis of Burr Height Test Results

The burr height data of the workpiece surface after milling is shown in Figure 17. Table 4 shows the range analysis of the test results. It is concluded that the micro-geometric characteristic parameters R and L were the key factors that significantly impacted the height of the burr. The cutting parameters were mainly affected by the cutting depth ap and cutting speed v. The interaction between the blunt radius of the edge R and the cutting depth ap had a significant impact on the burr height. Based on the results of the interaction test force thermal characteristics, it can be concluded that as L increased, the milling force increased, and the burr height also increased. The dominant source of cutting force during milling was primarily attributed to the frictional force exerted on the front face. In this case, the bonding zone contributed a higher proportion to the overall cutting force compared to the sliding zone. As the distance from the micro-texture to the cutting edge L increased, the actual area of the micro-texture’s action decreased, the effective effect of micro-texture was weakened, the frictional performance of the front face decreased, the friction force in the tool-chip contact area increased, and an increase occurred in the main cutting force during the milling process. The increase in cutting force caused the entire milling process to be in a very severe negative rake-cutting state, with severe serious deformation at the outlet edge of the workpiece. The plastic flow path of the material was longer, forming a flipped exit burr with the undivided chips, resulting in an increase in burr size. As the cutting edge radius R increased, the height of the burrs gradually decreased, and the milling force decreased. This occurred because as the cutting edge radius increased, the tool–workpiece contact area increased, reducing the load on the tool per unit area from the workpiece. The surface deformation of the workpiece was reduced, and the resistance of the milling cutter to overcome the plastic deformation of the workpiece material decreased as well. The decrease in cutting force and cutting heat between the tool and the workpiece led to a reduction in the size of the fourth deformation zone formed in the cutting area. Therefore, the burr size was smaller.
As the cutting depth ap increased, the actual cutting layer thickness gradually approached and reached the critical cutting thickness value for generating chips. At this point, the number of chips accumulated at the cutting-edge decreased, thereby reducing the formation of outlet burrs due to insufficient cutting. When the cutting depth ap continued to increase, the actual cutting thickness exceeded the critical cutting thickness value for generating chips, causing more material to enter the cutting edge and more chips to accumulate together, thereby increasing the size of burrs generated. Therefore, with the increase in the cutting depth ap, the burr height decreased first and then increased. As the cutting speed v accelerated, the amount of plastic deformation in the cutting area increased, resulting in faster heat generation and an increase in milling force and milling temperature, as well as an increase in burr size. Utilizing the Central Composite Design response surface optimization method, we analyzed the interaction terms and depicted the findings in Figure 18.
Observing Figure 18, it is evident that R*ap had an interactive effect on the height of burrs. Due to this interaction, the actual cutting depth ap decreased as the cutting edge radius R increased. The cutting edge radius was small, but the actual cutting depth was larger, leading to greater stress concentration at the cutting edge, resulting in reduced tool strength and a propensity for edge bouncing. Consequently, as the cutting depth increased, the low-strength tool experienced greater load impact, significantly diminishing the cutting performance. This resulted in a higher force exerted between the tool and the workpiece, causing a substantial accumulation of material cut by the edge, leading to deformation and outward rolling, thus forming large-sized burrs. Conversely, with a larger blunt radius of the cutting edge, the actual cutting depth decreased, thereby enhancing tool strength. This decrease in cutting depth also reduced the vibration generated between the workpiece and the cutting edge during the milling process, subsequently decreasing milling force and milling temperature. Additionally, the accumulation of material at the cutting edge decreased, reducing the size of the burrs. Consequently, it can be concluded that the interaction between R and ap positively influenced the reduction of force temperature and force, as well as the reduction in burr height.
According to the analysis results, the mesoscopic geometric features of the ball-end milling cutter and cutting parameters selected according to the minimum burr height evaluation principle are as follows: the diameter of the micro circular pits D was 50 μm, the spacing of the micro-textures L1 was 170 μm, the distance between the micro-texture and the cutting edge L was 110 μm, and the cutting edge radius R was 60 μm. Furthermore, the cutting depth ap was 0.4 mm, the cutting speed v was 180 mm/min, and the feed rate per tooth f was 70 μm/z.

5. Optimization of Mesoscopic Geometric Feature Parameters of Cutting Tools for Burr Features on Workpiece Surface

A regression analysis model for designing objective functions based on micro-texture parameters of ball-end milling cutters was designed, with the micro-groove diameter D, adjacent micro-texture spacing L1, micro-texture distance from the edge L, blunt edge radius R, cutting depth ap, cutting speed v, and feed rate f as independent variables, and the surface burr height H of titanium alloy workpieces as the dependent variable. This model was formulated in the form of an exponential function. We established the mathematical model as follows:
H = 10 0.0586 R 0.0810 L 0.3797 D 0.0386 L 1 0.2841 a p 0.0209 V 0.0966 f 0.0385
The data in Table 5 show that the P-values of the burr height in the empirical regression equation were 4.78275 × 10⁻¹⁷, which was significantly lower than the effective level of 0.05. Through the F-test critical value table, it can be concluded that F(m, nm − 1) = F0.05(8, 18) = 2.510, and the actual values of the statistic F were far greater than 2.510, indicating the existence of significant differences. Therefore, the regression models for burr height established through the empirical regression equation were highly significant.
Using a simulated annealing algorithm [22], based on various evaluation indicators, the optimized texture parameters, cutting edge radius, and cutting parameter range were used as constraint conditions to set the parameter optimization limit range as blunt circular cutting edge radius R of 20–60 μm. The distance between the micro-texture and the cutting edge ranges L was 110–150 μm. The texture diameter D was 40–60 μm. The texture spacing L1 was 130–170 μm. The cutting depth ap was 0.3–0.5 mm, the cutting speed v was 140–180 mm/min, and the feed rate f was 0.06–0.08 mm/z. We performed dimensionality reduction on the model, established a simulated annealing algorithm optimization function based on the dimensionalized model, assigned a burr height weight of 0.5, set the number of iterations to 1000, selected the annealing function as Boltzmann annealing for the simulated annealing algorithm optimization solution, and solved the interface. The final optimization result is shown in Figure 19. The parameter optimization result was a blunt circular edge radius of 33.242 μm, texture to blade distance of 114.621 μm, texture diameter of 59.820 μm, texture spacing L1 of 131.410 μm, cutting depth ap of 0.310 mm, cutting speed v of 140.019 mm/min, and feed rate f of 60 μm/z.
The optimized parameters were verified by milling experiments under the same experimental conditions. The surface burr size of the workpiece after processing was measured. The measured data were weighted to obtain the final experimental results. We recorded the final optimization result ’f’ and experimental results as shown in Table 6. It can be seen that the relative error between the optimization results and the experimental results was within 5%, which proves the feasibility of optimizing the parameters of the mesoscopic geometric feature ball-end milling cutter.

6. Conclusions

Through the combination of theory and experiment, it was verified that the ball-end milling cutter with mesoscopic geometric characteristics can effectively improve the surface quality of milling titanium alloy and reduce the burr height. The mesoscopic geometric characteristic parameters and milling parameters with ideal effect were obtained. The conclusions are as follows:
(1)
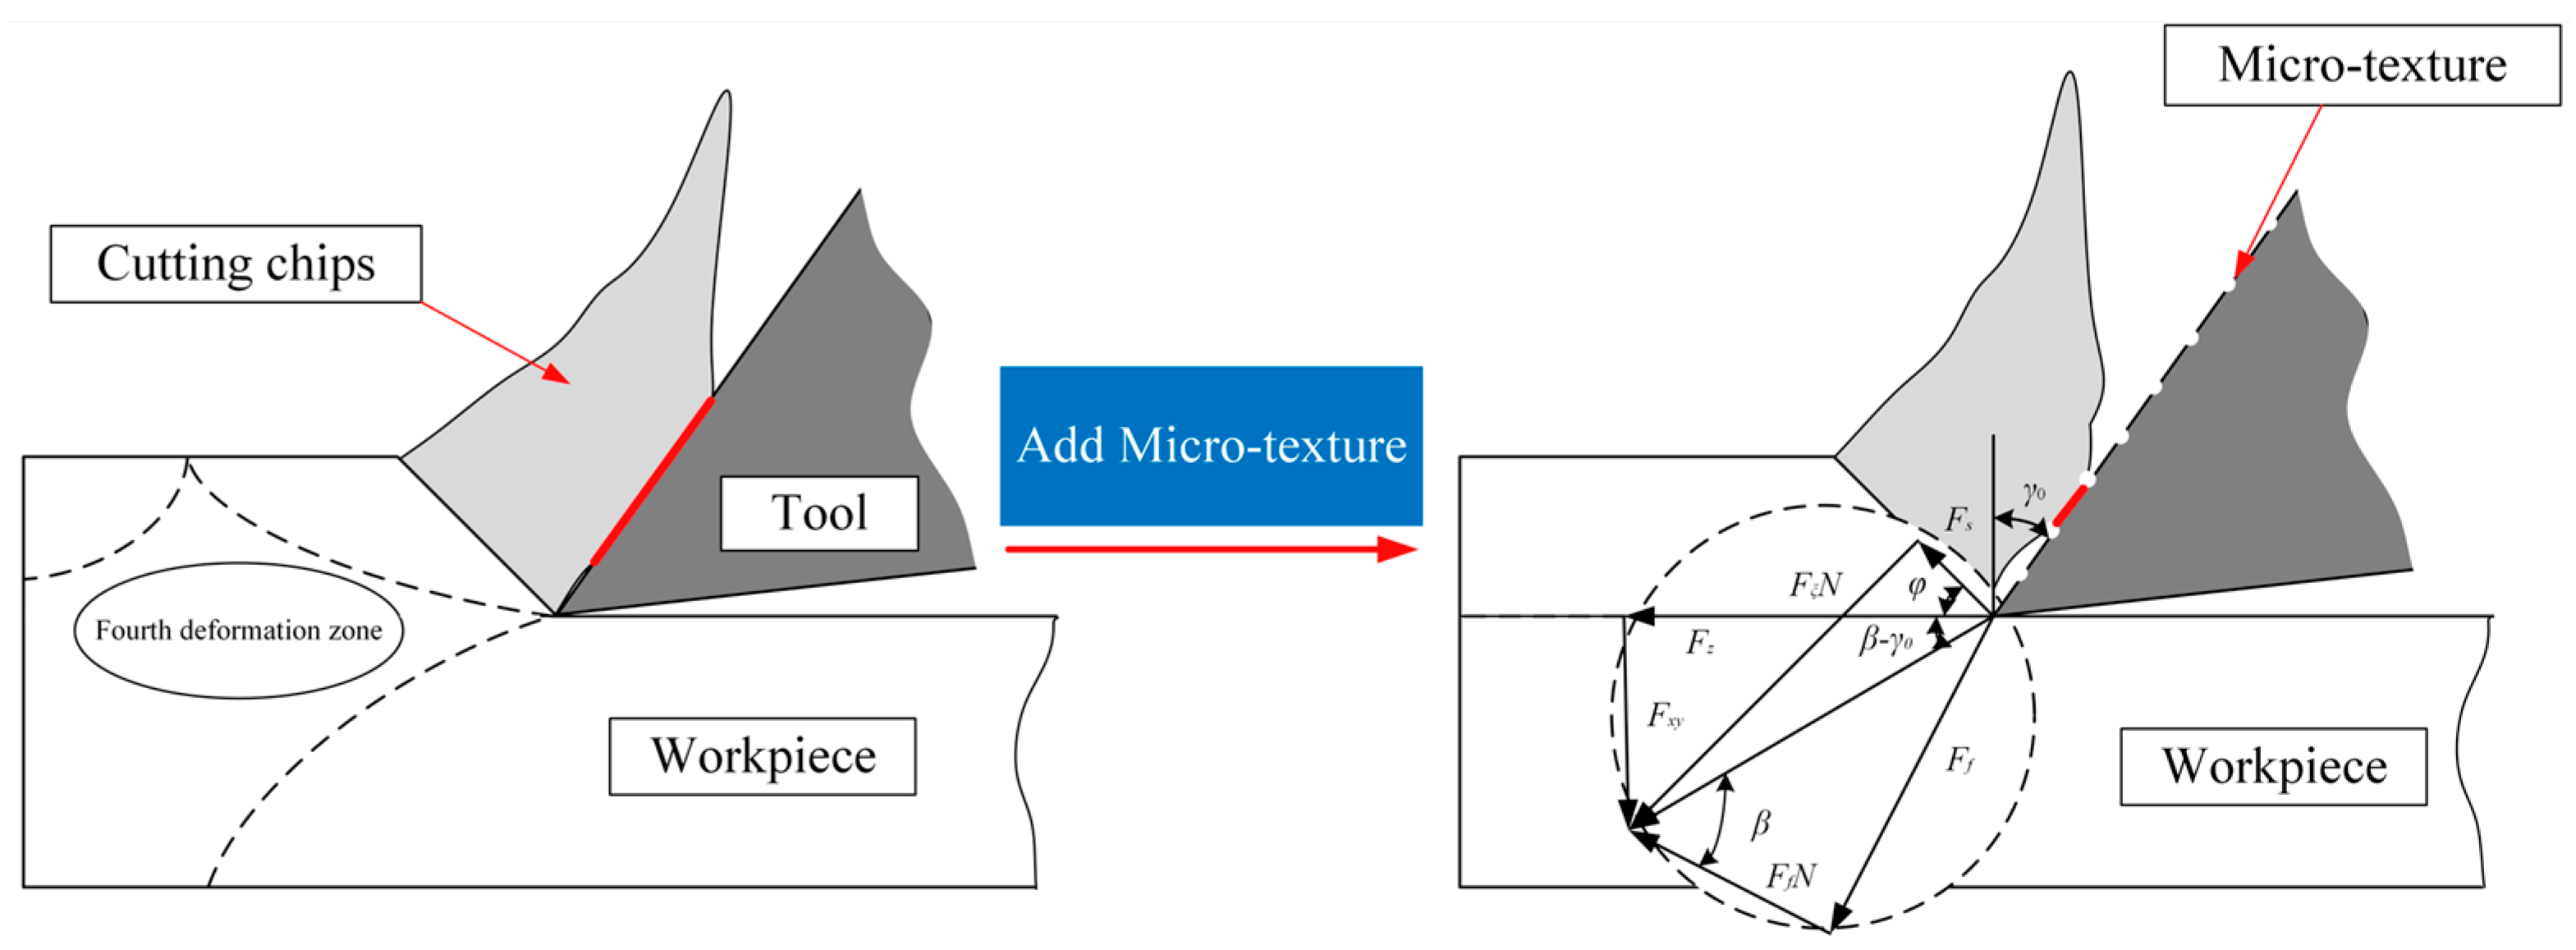
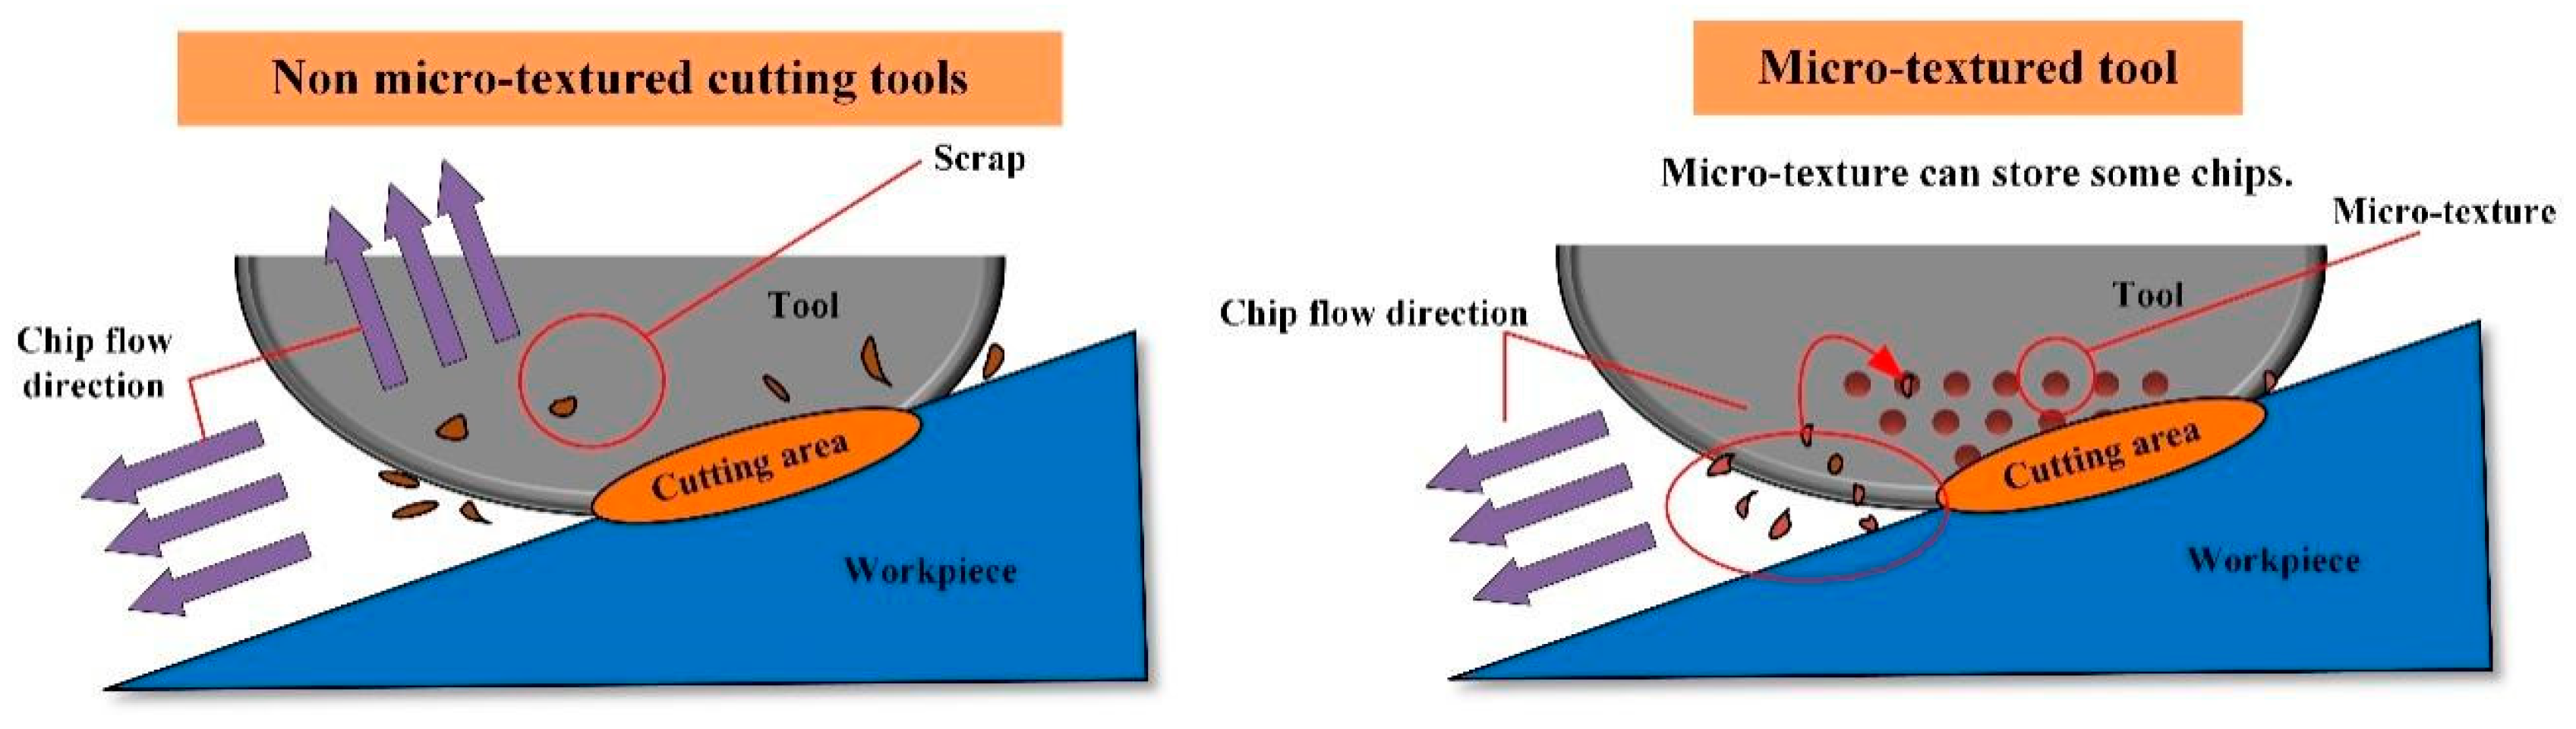
Based on the titanium alloy milling export burr model, a theoretical relationship between mesoscopic geometric characteristic parameters and the burr height of a ball -end milling cutter for titanium alloy milling was established. It was found that the insertion of micro-textures will reduce the effective friction area Qn, thereby reducing the friction force Ff and the heat generated by friction q2, resulting in a decrease in burr height. Increasing the radius R of the cutting edge led to a decrease in the primary cutting force, thereby reducing the formation of outlet burrs.
(2)
A test platform for milling titanium alloy with a hard alloy ball-end milling cutter with mesoscopic geometric features was established. By integrating the thermal characteristics of force during milling of titanium alloy with a ball-end milling cutter, an investigation was conducted into how the mesoscopic geometric attributes affect the surface burr height of the workpiece post-milling. The obtained micro-texture reduced the milling force and temperature during the milling process, thereby suppressing the formation of some burrs. The blunt rounded edge improved the force thermal characteristics of ball-end milling cutters in milling titanium alloys and reduced the height of burrs.
(3)
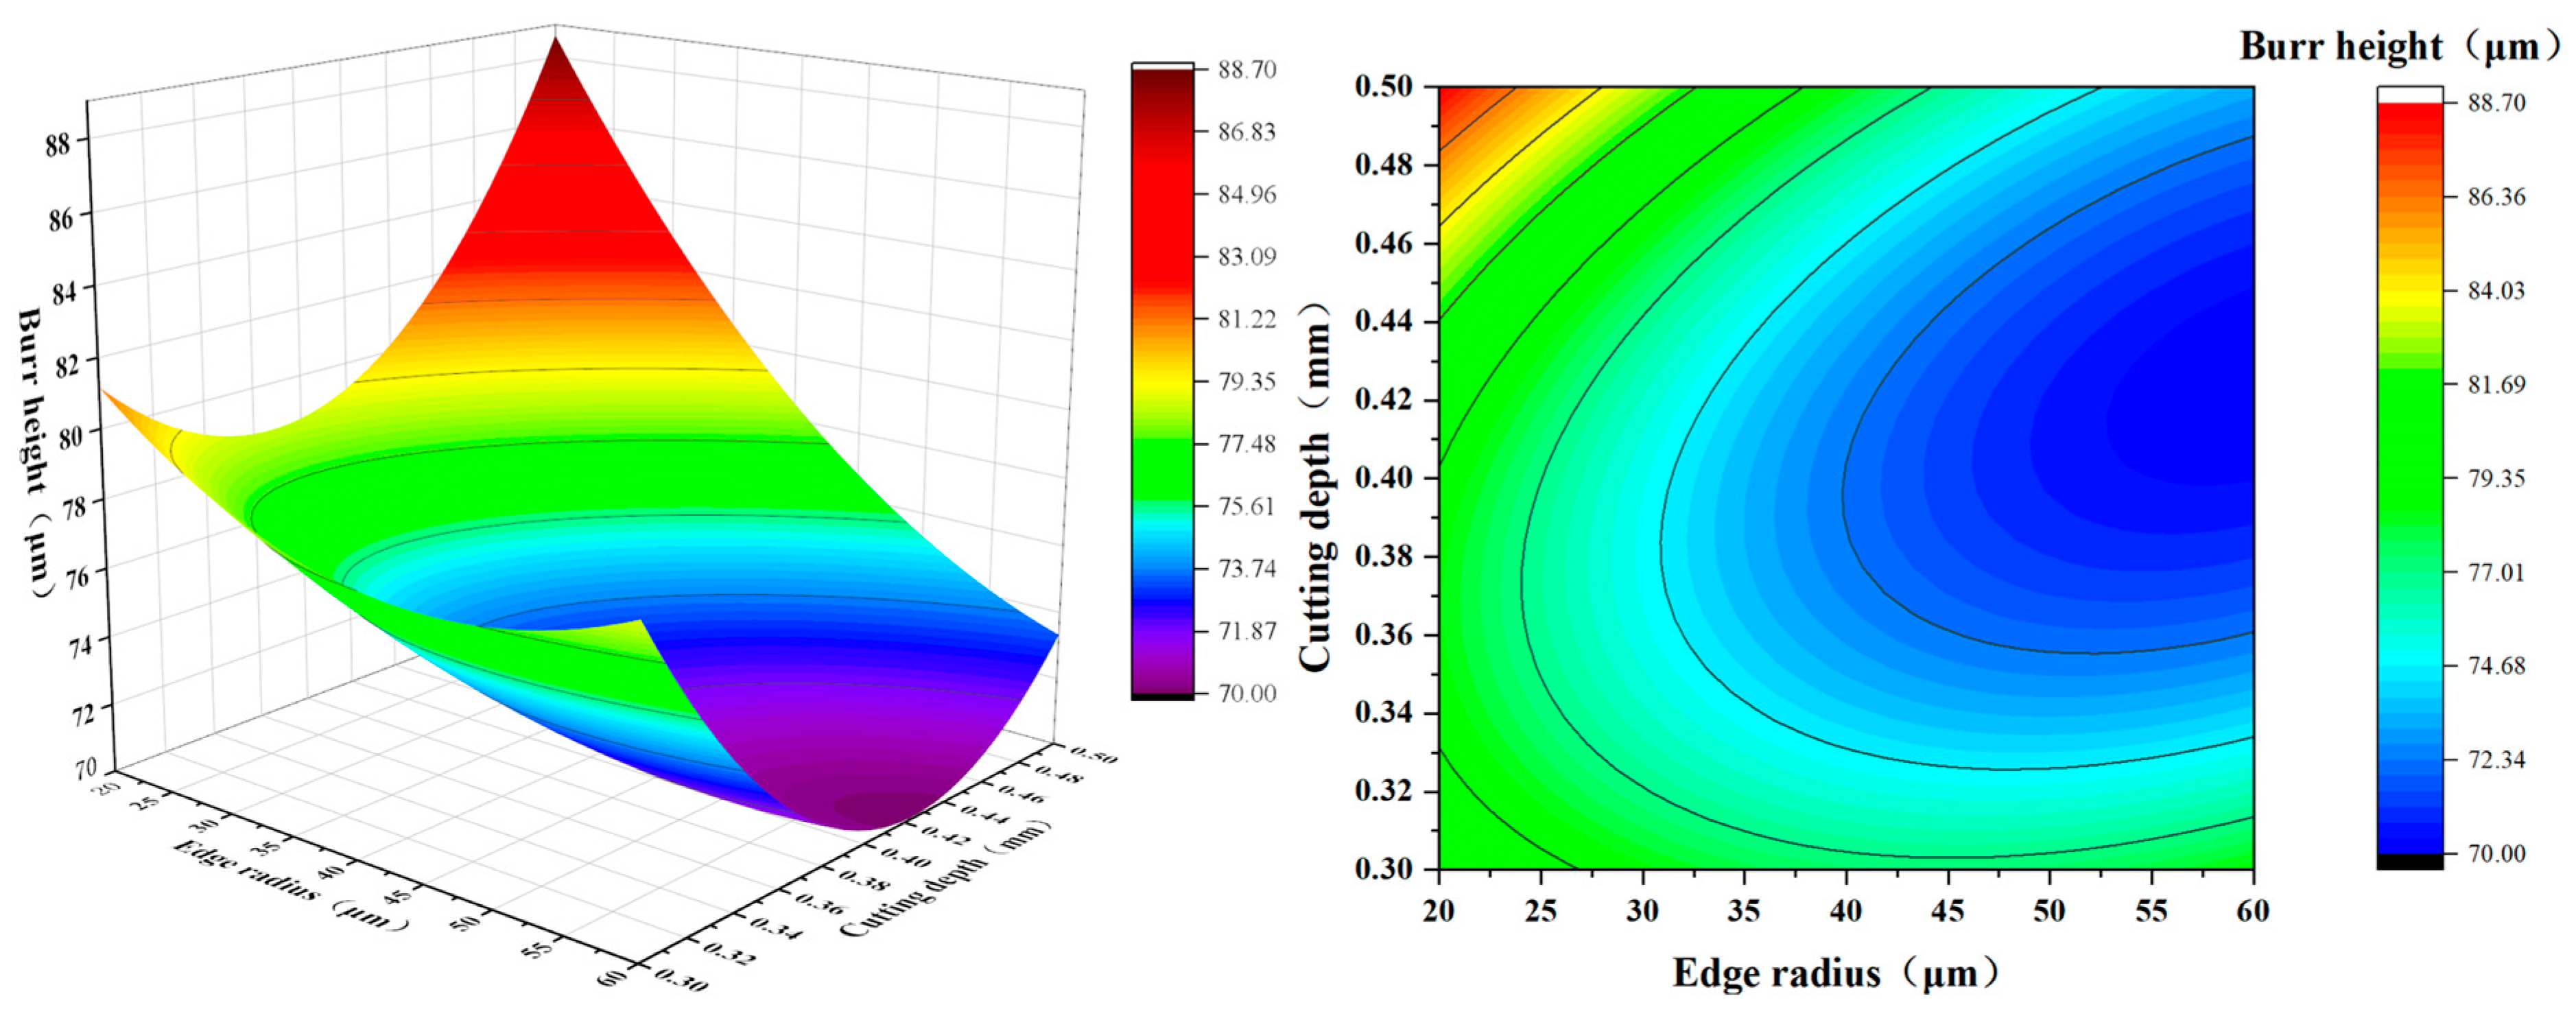
A mesoscopic geometric feature ball-end milling cutter interaction test platform was established to analyze the influence of the interaction between mesoscopic geometric feature parameters and cutting parameters on the force thermal characteristics of ball-end milling cutters for milling titanium alloys. The interaction between R and ap had a positive effect on reducing milling force and temperature, as well as reducing burr height.
(4)
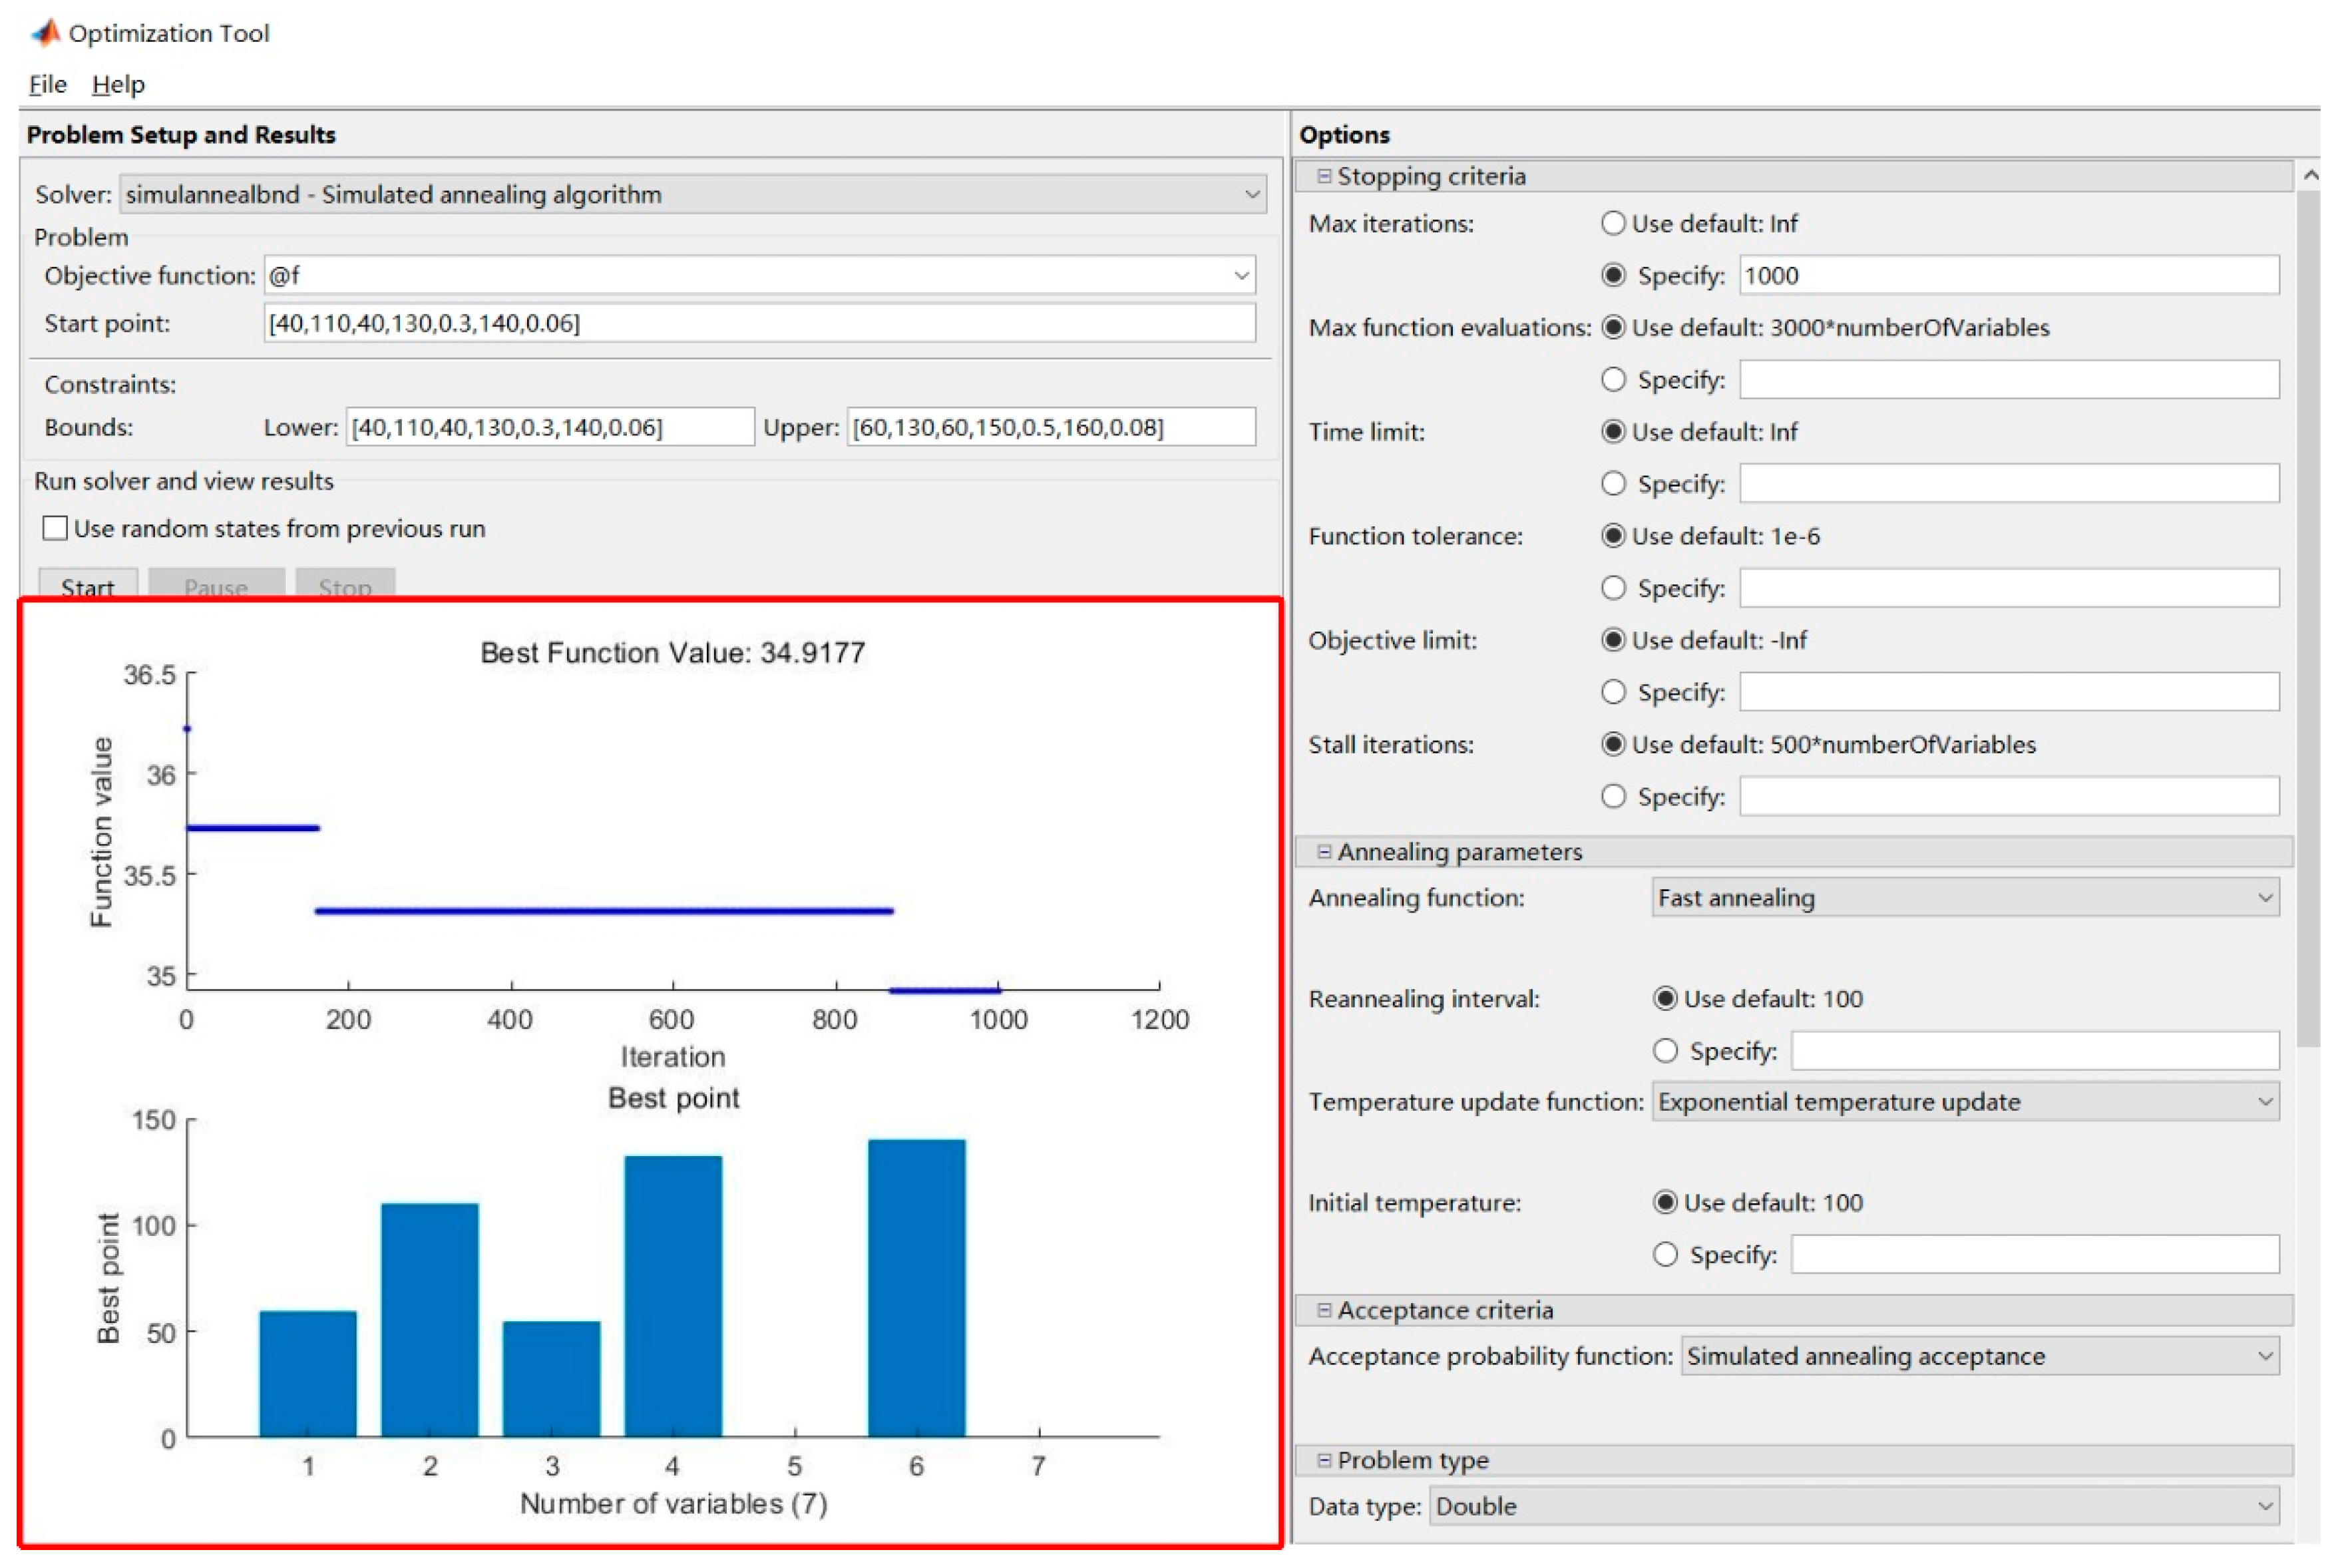
We stablished an exponential regression analysis prediction model with burr height as the evaluation indicator and optimized the regression model using a simulated annealing algorithm. The optimized cutting parameters resulted in a blunt circular edge radius R of 54.14 μm. The distance between the micro-texture and the cutting edge ranges L was 110.05 μm. The texture diameter D was 60.00 μm, and the texture spacing L1 was 130.05 μm. The cutting depth ap was 0.43 mm, the cutting speed v was 140.10 mm/min, and the feed rate f was 60 μm/z.

Author Contributions

Conceptualization, X.T. and S.W.; methodology, Q.Q.; validation, S.W. and Q.Q.; formal analysis, S.W.; investigation, X.W.; resources, X.T.; writing—original draft preparation, S.W.; writing—review and editing, X.T.; funding acquisition, X.T. All authors have read and agreed to the published version of the manuscript.

Funding

This research was funded by the National Natural Science Foundation of China, grant no. 52005140.

Institutional Review Board Statement

Not applicable.

Informed Consent Statement

Not applicable.

Data Availability Statement

Data are contained within the article.

Conflicts of Interest

The authors declare no conflicts of interest.

References

  1. Liu, X. Research on Material Removal Mechanism of Laser-Assisted Micro Milling of Titanium Alloy Based on Burr Morphology. Master’s Thesis, Harbin Institute of Technology, Harbin, China, 2022. [Google Scholar]
  2. Liu, L.; Wu, X.; Shen, J. Experimental study on the formation mechanism and size of burrs in micro milling. Mech. Des. Manuf. 2022, 202–207. [Google Scholar]
  3. Sarma, D.K.; Rajbongshi, S.K. A study in turning of AISI D2 steel with textured and non-textured coated carbide tool at the flank face. Mater. Today Proc. 2020, 28 Pt 2, 574–581. [Google Scholar] [CrossRef]
  4. Yu, X.; Wang, Y.; Lv, D.; Ye, Z.; Gao, Y. Study on machining characteristics with variable distribution density micro-texture tools in turning superalloy GH4202. Int. J. Adv. Manuf. Technol. 2022, 123, 187–197. [Google Scholar] [CrossRef]
  5. Zheng, K.; Yang, F.; Zhang, N.; Liu, Q.; Jiang, F. Study on the Cutting Performance of Micro-Textured Tools on Cutting Ti-6Al-4V Titanium Alloy. Micromachines 2020, 11, 137. [Google Scholar] [CrossRef] [PubMed]
  6. Patel, K.; Liu, G.; Shah, S.R.; Özel, T. Effect of Micro-Textured Tool Parameters on Forces, Stresses, Wear Rate, and Variable Friction in Titanium Alloy Machining. J. Manuf. Sci. Eng. 2020, 142, 021007. [Google Scholar] [CrossRef]
  7. Usman, M.M.; Zou, P.; Yang, Z.; Lin, T.; Muhammad, I. Evaluation of micro-textured tool performance in ultrasonic elliptical vibration-assisted turning of 304 stainless steels. Int. J. Adv. Manuf. Technol. 2022, 121, 4403–4418. [Google Scholar] [CrossRef]
  8. Ali, S.; Abdallah, S.; Pervaiz, S. Predicting Cutting Force and Primary Shear Behavior in Micro-Textured Tools Assisted Machining of AISI 630: Numerical Modeling and Taguchi Analysis. Micromachines 2022, 13, 91. [Google Scholar] [CrossRef] [PubMed]
  9. Kishawy, H.A.; Salem, A.; Hegab, H.; Hosseini, A.; Elbestawi, M. An analytical model for the optimized design of micro-textured cutting tools. CIRP Ann.—Manuf. Technol. 2022, 71, 49–52. [Google Scholar] [CrossRef]
  10. Yang, X.; Li, Y.; Li, L.; Wang, Y.; Shen, Z. The effect of CVD diamond coating process on the performance of CFRP milling with hard alloy end mills. Diam. Abras. Grind. Tool Eng. 2018, 38, 37–41. [Google Scholar]
  11. Kim, M.; Lee, M.; Cho, G.; Lee, S.K. Effect of the Fiber Orientation and the Radial Depth of Cut on the Flank Wear in End Milling of CFRP. Int. J. Precis. Eng. Manuf. 2020, 21, 1187–1199. [Google Scholar] [CrossRef]
  12. Emilia, F.; Wojciech, Z. Optimization of Titanium Alloy Drilling to Minimize the Secondary Burr after Deburring Process. Materials 2022, 15, 8432. [Google Scholar] [CrossRef] [PubMed]
  13. Shanmugam, R.; Baloor, S.S.; Koklu, U.; Polishetty, A.; Bolar, G. Machining Temperature, Surface Integrity and Burr Size Investigation during Coolant-Free Hole Milling in Ti6Al4V Titanium Alloy. Lubricants 2023, 11, 349. [Google Scholar] [CrossRef]
  14. Zaidi, S.R.; Ul Qadir, N.; Jaffery SH, I.; Khan, M.A.; Khan, M.; Petru, J. Statistical analysis of machining parameters on burr formation, surface roughness and energy consumption during milling of aluminium alloy Al 6061-T6. Materials 2022, 15, 8065. [Google Scholar] [CrossRef] [PubMed]
  15. Song, W.; Zhao, M.; Zhu, J.; Xue, B.; Wang, H. Burr formation mechanism and experimental research in longitudinal-torsional ultrasonic-assisted milling Ti-6Al-4 V. Int. J. Adv. Manuf. Technol. 2024, 132, 2315–2331. [Google Scholar] [CrossRef]
  16. Krishnan, A.N.; Vipindas, K.; Jose, M. Modelling and experimental analysis of exit burr height and studies on size effect during micro endmilling on Inconel 718. CIRP J. Manuf. Sci. Technol. 2023, 46, 135–147. [Google Scholar]
  17. Niknam, S.A.; Songmene, V. Modeling of burr thickness in milling of ductile materials. Int. J. Adv. Manuf. Technol. 2013, 66, 2029–2039. [Google Scholar] [CrossRef]
  18. Wu, Y. Research on the Mechanism and Size Rule of Burr Formation in Titanium Alloy. Master’s Thesis, Chongqing University, Chongqing, China, 2019. [Google Scholar]
  19. Guo, C. Research on the Milling Performance of Ball End Milling Cutters under the Combined Action of Front and Rear Micro-Textures. Master’s Thesis, Harbin University of Science and Technology, Harbin, China, 2023. [Google Scholar]
  20. Zhang, X. Optimization of TC4 Parameters and Development of Data System for Micro-Textured Ball End Milling Cutter. Master’s Thesis, Harbin University of Science and Technology, Harbin, China, 2023. [Google Scholar]
  21. Tong, X. Precise Distribution Design and Parameter Optimization of Micro-Textured Ball-End Milling Cutter. Ph.D. Thesis, Harbin University of Science and Technology, Harbin, China, 2019. [Google Scholar]
  22. Qu, C.; Ji, C.; Zhang, Y.; Wu, J. Research on Improved Distribution Estimation Algorithm Based on Simulated Annealing. Comput. Appl. Res. 2020, 37, 138–139+142. [Google Scholar]
Figure 1. Milling outlet burr model diagram.
Coatings 14 00670 g001
Figure 2. Ball head milling cutter front cutting surface cutting model.
Coatings 14 00670 g002
Figure 3. Test materials: (a) Cutter; (b) Cutterhandle; (c) Workpiece; (d) Clamping method; (e) Milling; (f) Machine tool.
Coatings 14 00670 g003
Figure 4. Workpiece preparation test equipment.
Coatings 14 00670 g004
Figure 5. Milling test equipment.
Coatings 14 00670 g005
Figure 6. Milling test titanium alloy burr image.
Coatings 14 00670 g006
Figure 7. Schematic diagram of micro-texture on cutting.
Coatings 14 00670 g007
Figure 8. Trend diagram of milling temperature and burr height.
Coatings 14 00670 g008
Figure 9. Trend diagram of the milling force and the burr height.
Coatings 14 00670 g009
Figure 10. Pearson correlation images of milling force, milling temperature, and burr height.
Coatings 14 00670 g010
Figure 11. Milling force action diagram.
Coatings 14 00670 g011
Figure 12. Test results of blunt circular edge radius on burr height layer.
Coatings 14 00670 g012
Figure 13. The effect of blunt circular edge radius on milling temperature and milling force.
Coatings 14 00670 g013
Figure 14. Schematic diagram of stress concentration influence.
Coatings 14 00670 g014
Figure 15. Milling temperature range analysis diagram.
Coatings 14 00670 g015
Figure 16. Milling force range analysis diagram.
Coatings 14 00670 g016
Figure 17. Interaction test burr height test results.
Coatings 14 00670 g017
Figure 18. R × ap interaction response surface plot for burr height.
Coatings 14 00670 g018
Figure 19. MATLAB R2022a simulated annealing algorithm to solve the interface and optimization results.
Coatings 14 00670 g019
Table 1. Orthogonal test design.
FactorL (μm)D (μm)L1 (μm)
Level
111040130
211050150
311060170
413040150
513050170
613060130
715040170
815050130
915060150
Table 2. Burr height extreme difference analysis table.
TargetBurr Height (μm)Milling Force (N)Milling Temperature (°C)
L (μm)D (μm)L1 (μm)L (μm)D (μm)L1 (μm)L (μm)D (μm)L1 (μm)
K194.397.896.6260.2257.4262.7 254.4 256.1 256.8
K298.599.899.1259.6 267.9 257.4 261.1 262.1 259.5
K3104.299.4101.3275.3 269.9 275.0 266.5 263.7 265.7
R9.92.04.715.7 12.517.6 12.1 7.6 8.9
Sort132231132
Table 3. Mesoscopic geometric feature ball-end milling cutter interaction test design, milling force, and milling temperature data.
FactorR (μm)L (μm)R × L (μm × μm)D (μm)L1 (μm)ap (mm)R × ap (μm × mm)v (mm/min)f (μm/z)Temperature
(°C)
Force
(N)
Level
1401101401300.311400.6256.31255.35
2401101401500.421600.7254.83278.23
3401101401700.531800.8277.64285.32
4401302501300.311600.7268.39256.89
5401302501500.421800.8285.97263.21
6401302501700.531400.6274.85287.62
7401503601300.311800.8311.27262.35
8401503601500.421400.6282.89299.25
9401503601700.531600.7297.41291.01
10501102601300.431400.7272.94245.32
11501102601500.511600.8288.65256.63
12501102601700.321800.6293.73249.69
13501303401300.431600.8244.85262.01
14501303401500.511800.6296.85280.71
15501303401700.321400.7274.15270.33
16501501501300.431800.6306.72288.55
17501501501500.511400.7261.54273.97
18501501501700.321600.8269.73308.85
19601103501300.521400.8252.63243.65
20601103501500.331600.6251.87268.32
21601103501700.411800.7259.81251.74
22601301601300.521600.6258.69284.31
23601301601500.331800.7268.74262.65
24601301601700.411400.8241.98265.98
25601502401300.521800.7278.94279.63
26601502401500.331400.8263.42282.64
27601502401700.411600.6272.85278.54
Table 4. Range analysis table.
Burr HeightRLR × LDL1apR × ap vF
K186.377.783.183.881.882.479.780.782.5
K281.081.881.881.283.480.581.883.980.4
K379.387.280.183.084.583.9 85.282.383.2
R7.09.53.02.62.73.45.53.22.8
Sort216984357
Table 5. Variance analysis of burr height by empirical regression equation.
FreedomRegression Sum of SquaresMean SquareF ValueSignificance p
Regressive analysis8855.8865196106.98581263.64754.78275 × 10−17
Residual187.3042402010.4057911————
Total26863.1907598——————
Table 6. Experimental results.
Final Optimization Result fResultsRelative Error
36.938.43.91%
Disclaimer/Publisher’s Note: The statements, opinions and data contained in all publications are solely those of the individual author(s) and contributor(s) and not of MDPI and/or the editor(s). MDPI and/or the editor(s) disclaim responsibility for any injury to people or property resulting from any ideas, methods, instructions or products referred to in the content.

