Abstract
This study investigated the effect of purge gas flow rate and purge gas flow time on the properties of TiN thin films via chemical reaction simulation and the plasma-enhanced atomic layer deposition (PEALD) process along purge gas flow rates and time settings. Chemical reaction simulation unveiled an incremental increase in generating volatile products along purge gas flow rates. In contrast, increased purge gas flow times enhanced the desorption of physically adsorbed species flow time in the film surface. Subsequent thin film analysis showed that the increased Ar purge gas flow rate caused a shift of 44% in wafer non-uniformity, 46% in carbon composition, and 11% in oxygen composition in the deposited film. Modulations in the Ar purge gas flow time yielded variations of 50% in wafer non-uniformity, 46% in carbon composition, and 15% in oxygen content. Notably, 38% of the resistivity and 35% of the film thickness occurred due to experimental variations in the Ar purge step condition. Increased purge gas flow rates had a negligible impact on the film composition, thickness, and resistivity, but the film’s non-uniformity on a 6-inch wafer was notable. Extended purge gas flow times with inadequate flow rates resulted in undesired impurities in the thin film. This study employed a method that utilized reaction simulation to investigate the impact of purge gas flow and verified these results through film properties analysis. These findings can help in determining optimal purge conditions to achieve the desired film properties of PEALD-deposited TiN thin films.
1. Introduction
In semiconductor manufacturing, diffusion barriers play a crucial role, particularly in leveraging copper interconnects. Copper, while widely utilized, is known to exhibit a tendency to penetrate adjacent insulating layers, potentially inducing defects in semiconductor devices [1,2,3]. Barrier defects compromise the efficiency of insulating layers that are essential for maintaining electrical signal integrity, minimizing leakage, and reducing power consumption [4,5,6]. Titanium nitride (TiN) diffusion barriers have already been introduced in semiconductor manufacturing due to their material characteristics, such as high thermodynamic stability, corrosion resistance, and low electrical resistance [7,8,9,10,11,12,13]. However, depending on deposition conditions, they may exhibit high resistivity, posing potential reliability issues [14,15,16,17]. Recent advancements in plasma technology have led to the adoption of PEALD (plasma-enhanced atomic layer deposition)-TiN in various surface coating areas, including membrane fuel cells, and for corrosion prevention in CrN hard coatings, fine pattern etching, and hard masks for EUV lithography [18,19,20]. Among these applications, PEALD-TiN films used in semiconductor manufacturing stand out as the most condition sensitive, needing to meet stringent process quality requirements. Growth rates may be limited due to screening effects from physical adsorption [21,22]. Additionally, studies have reported that adjusting flow rates and residence times in the purge phase can contribute to gas efficiency and productivity, and potentially enhance film quality [23]. Understanding the relationship between purge conditions and TiN film properties is essential. However, current research predominantly focuses on characterizing TiN films by process temperature and reactant types, leaving a gap in understanding the impact of purge conditions on film properties [24,25].
This study aimed to investigate the properties of PEALD-TiN thin films regarding the argon (Ar) purge gas flow rate and purge gas flow time. We first investigated the chemical reaction mechanisms associated with Ar purging, employing ANSYS Chemkin-Pro. Designed experiments regarding PEALD-TiN deposition along various Ar purge conditions were performed, followed by film characteristics employing ellipsometry, a four-point probe, and X-ray photoelectron spectroscopy (XPS) for the surface chemistry. This study not only enhanced the understanding of the significance of the purge step in the PEALD process, but also the usefulness of chemical reaction simulations coupled with experimental analysis in ALD thin films. The limitation of this study was the omission of plasma physics in the ligand exchange step, but the understanding of plasma chemistry still holds without the physics of plasma. This paper is organized as follows. Section 2 provides a chemical reaction study of the PEALD-TiN process and Section 3 presents the experiment and results. Finally, the conclusion is presented in Section 4.
2. Chemical Reaction Study
For the analysis of chemical reactions, we used the following simulation conditions, which were the same as experimental conditions: a substrate temperature of 230 °C, a process pressure of 1.0 Torr in a reactor volume of 600 cm3, and a total of 40 reactions involving 399 possible species of dissociated intermediate and by-products. We utilized the commercially available software ANSYS Chemkin-Pro (2020 R1) for chemical kinetics analysis. To investigate the chemical production rate and conversion rate, we conducted experiments varying the flow rate and flow time during the purge step of the ALD reaction involving tetrakis-dimethylamino-titanium (TDMAT) and ammonia (NH3), which are commonly used in contemporary semiconductor processes [26,27,28]. The conversion rate was related to the moles of the initial substance and the converted substance, and can be represented as follows:
The production rate was related to the coefficients of reactant and products, changes in concentration, and the change in time, and can be represented as follows:
where a, b, c, and d are the coefficients of reactants A and B and products C and D, respectively. Δ[A], Δ[B], Δ[C], and Δ[D] are changes in reactant concentration. Δt is the change in time over which the reaction occurred.
Previous studies of ALD reaction mechanisms have predominantly focused on surface reactions with molecular dynamics (MD) simulations. However, this study considered gas-phase reactions during the Ar purge step between the modification and ligand exchange steps [29]. Input species and reactions were selected based on data from the Quantemol database, a plasma chemistry database, and mass spectrometry results for the ALD-TiN process presented in the literature [30]. The simulation settings relied on two key assumptions: (1) a steady supply of the reactant of constant composition and (2) a perfectly stirred reactor. Steady-state conditions were assumed to vary one or more parameters and observe the results. For the rate of conversion of reactants to products to be controlled by the chemical reaction rate rather than the mixing process, reactants were assumed to be perfectly stirred and nearly spatially uniform. We investigated the chemical production rates and conversion rates along the flow rate in the purge step. The rate of a chemical reaction can be explained by the amount of reactants consumed. Conversion is an indication of the amount of reactants that reacted and the amount of products formed.
Figure 1 presents results obtained from the ANSYS Chemkin-Pro simulation depicting the production rate and conversion rate as functions of the purge gas flow rate. In Figure 1a, it can be observed that the production rate of stable species such as CH4 and N2 increased, while the production rate of unstable species like N2H and CH2 decreased. Figure 1b reveals that the conversion rate of CH4 initially decreased, followed by an increase, while the conversion rate of H2 notably decreased when the purge gas flow rate was set at 400 sccm. Interestingly, the conversion rates of NH3, Ar, HCN, and N2 remained unaffected by variations in the purge gas flow rate. Considering these results, we posit two hypotheses. First, as gas density increases, the number of collisions between particles increases. Therefore, the production speed decreases due to low collision energy. Second, stable species contribute to decreasing impurities on the film surface because they are effectively removed without interacting with the film surface during the evacuation process.
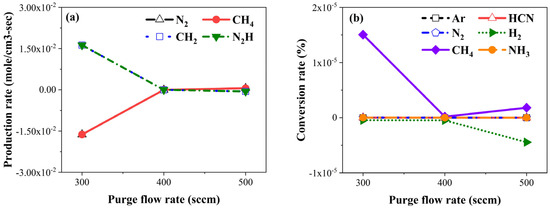
Figure 1.
Chemical kinetics simulation results: (a) production rate and (b) conversion rate by purge flow rate.
Figure 2 presents production rates and conversion rates along the purge gas flow time. Notably, production rates of CH4, N2, CH3, and N2H exhibited a decline after 10 s, as indicated in Figure 2a. Similarly, production rates of CH and H decreased from 15 s, while H2 production rate are up to 10 s. Figure 2b shows no significant change in the conversion rate, as it is known as inert gas, but all other species increased rapidly at 15 s. We postulated that the reason the conversion rate increased, although some production rates decreased at 15 s, is that physically adsorbed material was desorbed and exhausted without the secondary reaction. As the purge gas flow time increased, the desorption of the physically adsorbed material increased; therefore, it was expected that impurities were uniformly and thinly deposited, with fewer impurities. To support our hypothesis, we conducted the PEALD-TiN process, and results of the thin film measurement are presented in the following section.
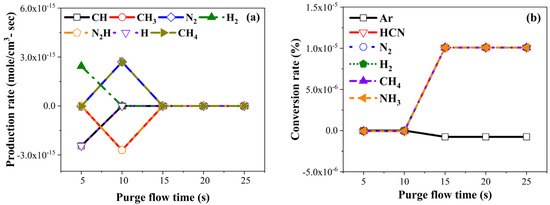
Figure 2.
Chemical kinetics simulation results: (a) production rate and (b) conversion rate by purge flow time.
3. Experiment and Results
PEALD-TiN thin film depositions, with a TDMAT precursor and NH3 reactant, were performed on 4-inch p-type Si (100) wafers. As shown in Table 1, TDMAT was supplied by an evaporation-type canister, and 300 sccm of NH3 gas was injected in the ligand exchange step. Ar flow rates varied from 300 to 500 sccm, and flow times varied from 5 to 25 s.

Table 1.
Cyclic experiment conditions in the PEALD-TiN process.
TiN films were deposited in a PEALD system (Plus200, QUROS, Republic of Korea) using 64 cycles of precursor/purge/reactant/purge steps. The PEALD system featured a CCP-type chamber with 13.56 MHz of RF source power, as illustrated in Figure 3. The canister containing TDMAT was maintained at 65 °C by the temperature controller, while the chamber temperature was set to 230 °C. During the plasma-on step, 300 watts of RF power was applied. The thickness of the deposited PEALD-TiN films was measured by a spectroscopic ellipsometer (M-2000, J.A. Woollam, Lincoln, NE, USA). Because ALD thin films grow in thin layers, high-resolution measurements were required. Therefore, we used an ellipsometer that can accurately measure the thickness and refractive index of a film by analyzing changes in the polarization state of light. The non-uniformity was calculated using Equation (3):
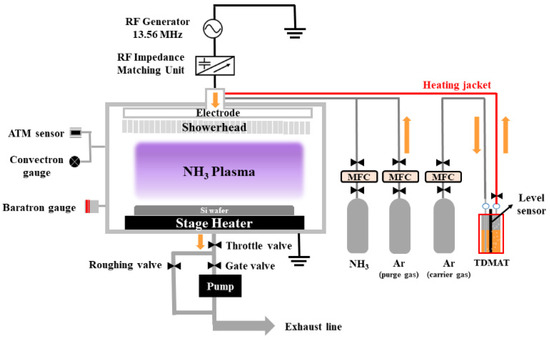
Figure 3.
Schematic of the PEALD system.
Resistivity was measured using a CMT-SR2000N four-point probe manufactured by AIT Co., Ltd., Suwon, Republic of Korea, with a voltage of 5 mA. In addition, to measure the exact resistivity of the thin film, we used a 4-point probe that minimizes electrical contact resistance and enables accurate measurement of electrical properties. To minimize sample exposure to atmospheric conditions, immediate surface chemistry analysis using XPS, (Nexsa, manufactured by Thermo Fisher Scientific, Waltham, MA, USA) was performed to analyze the surface chemistry, including titanium (Ti), nitrogen (N), carbon (C), and oxygen (O). We assumed that the observed carbon source originated from the ligands of the TDMAT precursor or by-products, while the oxygen source was attributed to atmospheric conditions. Consequently, we sought to compare the obtained signals for residual carbon and oxidation resistance based on the Ar flow rate–time relationship [30].
Initially, we hypothesized that an increase in the purge gas flow rate would effectively remove physically adsorbed precursors and by-products between ligands, thus preventing the introduction of impurities into the thin film [31]. However, when the Reynolds number used to predict fluid flow exceeded 4000, we inferred that turbulence and pressure fluctuations in the process chamber might have led to the re-adsorption of the removed by-products, resulting in an increase in carbon and oxygen impurities within the TiN [32].
Figure 4 presents XPS survey data for TiN deposited under the conditions of a 300 sccm purge gas flow rate and a 5 s purge gas flow time. These data provide atomic percentages for Ti, N, C, and O. Atomic percentage values were also obtained from XPS survey data under various purge gas flow rate conditions.
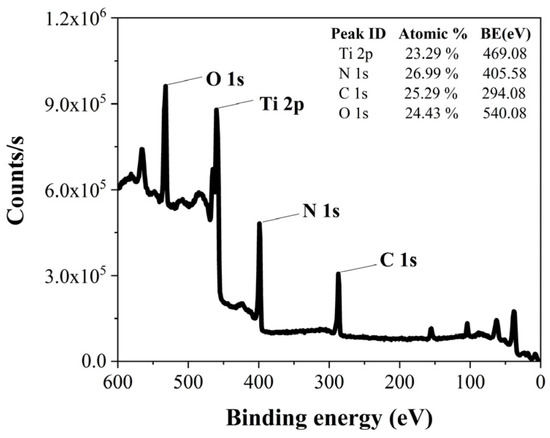
Figure 4.
XPS survey data of TiN at a 300 sccm purge gas flow rate and a 5 s purge gas flow time.
Successful purging was expected when the presence of Ti and N percentages are high, and the presence of C and O percentages are low in the TiN film. We intended to extend the purge gas flow time to ensure the desired complete purging across the entire wafer. However, as shown in Figure 5, the XPS analysis revealed no significant variations in the atomic percentages of Ti, N, C, and O with changes in purge gas flow rate, except for the case of 25 s of purge gas flow time. The expected trend of decreasing C and O atomic percentages with increased purge gas flow rates was most evident at the 25 s purge gas flow time. Likewise, increases in Ti and N atomic percentages with increasing purge gas flow rates was most pronounced at a 25 s purge gas flow time. Under a 15 s purge condition, an increase in the flow rate resulted in higher C and O atomic percentages, attributed to the presence of impurities within the TiN film due to insufficient purging. The XPS analysis results led to the conclusion that, regardless of the purge gas flow rate, changes in the purge gas flow time did not significantly alter the atomic percentages of Ti, N, C, and O, because the Ar purge flow rate may not have a significant effect on these self-limiting properties.
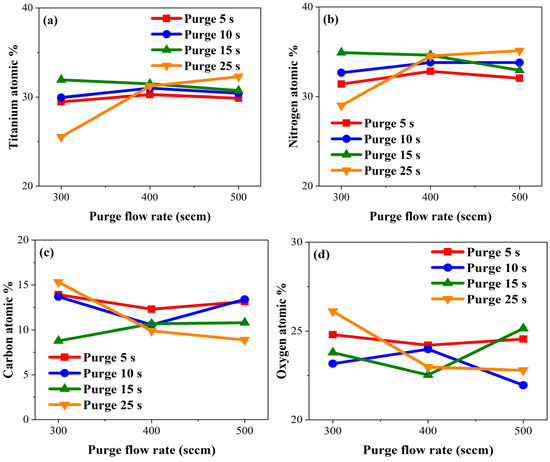
Figure 5.
Atomic percentages of (a) titanium, (b) nitrogen, (c) carbon, and (d) oxygen by purge gas flow rate.
The resistivity of thin films varies due to factors such as film thickness, crystal structure, deposition technique, and surface composition [31]. In our study, the temperature and deposition method remained constant, while variations were introduced solely in terms of surface composition and film thickness. As depicted in Figure 6a, changes in thickness attributed to increased purge gas flow rates were minimal, representing less than a 5% variation. Figure 6b shows that alterations in resistivity due to the elevated purge gas flow rates remained below 10%. Factors affecting TiN film resistivity can include the material crystal structure and impurities in the film, and results showed that an increase in the purge gas flow rate did not yield significant alterations in TiN film thickness and resistivity.
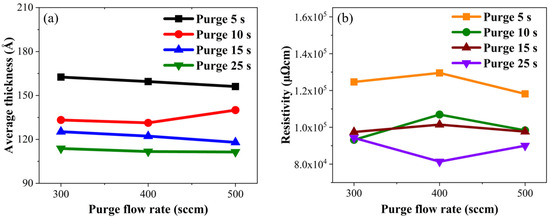
Figure 6.
Experimental results: (a) average thickness and (b) resistivity of TiN along the purge gas flow rate.
With an increase in the purge gas flow rate, we anticipated an initial decrease in non-uniformity due to the removal of physically adsorbed impurities, followed by an increase in non-uniformity at flow rates causing excessive turbulence due to the re-adsorption of impurities. Non-uniformity concerning the purge gas flow rate was calculated by substituting film thickness into Equation (3), and it is depicted in Figure 7. Under all conditions, non-uniformity was measured to be within 1%. Non-uniformity was highest at a purge gas flow time of 5 s and a purge gas flow rate of 500 sccm. This is why a purge time of 5 s and a rate 500 sccm contained more carbon and oxygen. Carbon and oxygen percentages were low, and non-uniformity increased even at purge 25 s and 500 sccm conditions. Our findings suggest that increasing the purge gas flow rate initially decreased non-uniformity by removing physically adsorbed impurities, but excessive turbulence at higher flow rates led to increased non-uniformity due to impurity re-adsorption.
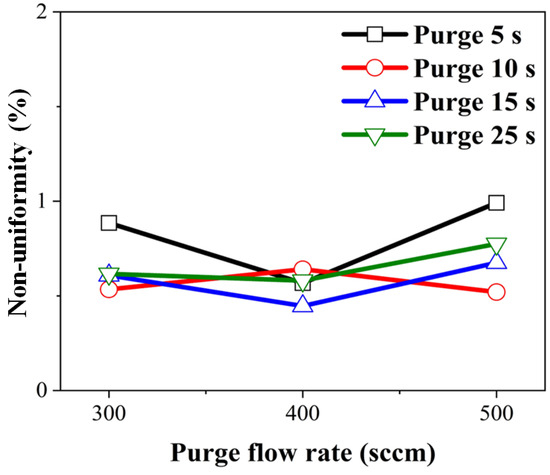
Figure 7.
Calculated wafer non-uniformity over 4-inch wafer concerning purge gas flow rate.
Figure 8 displays XPS survey data about TiN deposited at purge 300 sccm and 25 s. This analysis allowed for confirmation of atomic percentages of Ti, N, C, and O. Under different purge gas flow rate conditions, atomic percentage values were obtained from XPS survey data.
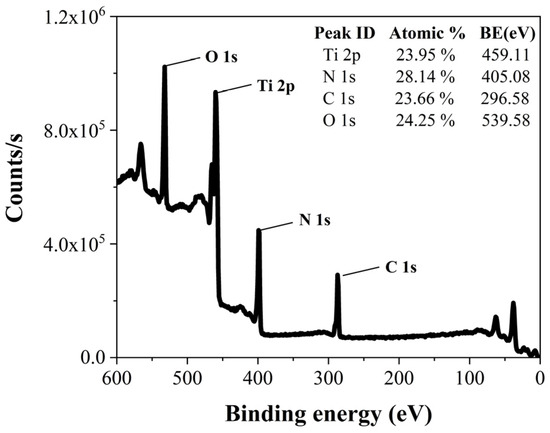
Figure 8.
XPS survey data by purge gas flow rate at purge 300 sccm and 25 s.
Purging was considered successful when Ti and N percentages were high, while low C and O percentages were detected in TiN films. We hypothesized that longer purge gas flow times would be necessary to ensure thorough purging across the entire wafer. XPS analysis of TiN films deposited with varying purge gas flow times, as shown in Figure 9, was conducted to confirm ratios of Ti, N, C, and O. However, as shown in Figure 9, at a purge gas flow rate of 300 sccm, a different trend was observed. Figure 9c,d shows a sharp increase in the atomic percentages of C and O at a purge gas flow time of 25 s. The reason for this could be an insufficient flow rate, which may have prevented the complete desorption of physically adsorbed residual precursors and by-products, leading to their accumulation in the chamber and subsequent co-deposition when other gases were introduced. Moreover, under conditions of low purge gas flow rates and long purge gas flow times, there was a possibility of the continued reaction of precursor gases, which could have led to the formation of undesired compounds or impurities.
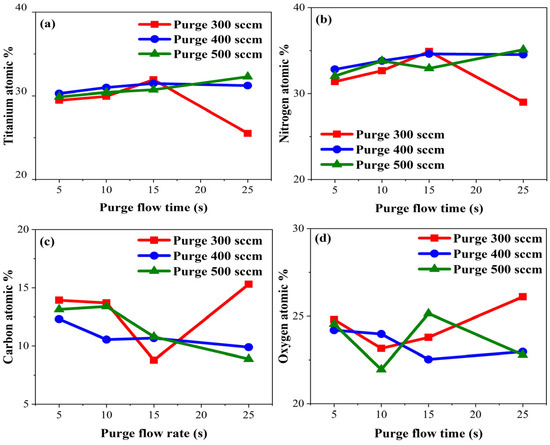
Figure 9.
Atomic percentages of (a) titanium, (b) nitrogen, (c) carbon, and (d) oxygen by purge gas flow time.
The resistivity of thin films varies based on factors such as film thickness, crystal structure, deposition method, and surface composition. Given that the temperature and deposition methods remained consistent in this study, we concluded that the primary factors influencing resistivity changes were surface composition and film thickness. We anticipated that longer purge gas flow times would lead to the deposition of thinner films with reduced impurities, resulting in a decrease in average thickness and resistivity. The actual experimental results, as shown in Figure 10a, indicated that the average thickness of TiN decreased with an increasing TiN flow rate. Figure 10b shows that the resistance of TiN also decreased. Nevertheless, at a purge gas flow rate of 300 sccm and purge gas flow time of 10 s, the resistance reached its minimum value, with subsequent changes remaining below 5%. This was attributed to increases in the atomic percentages of carbon and oxygen in TiN. Despite the continued decrease in thickness after a 10 s purge time at a flow rate of 300 sccm, the presence of increased carbon and oxygen impurities prevented further reductions in resistance.
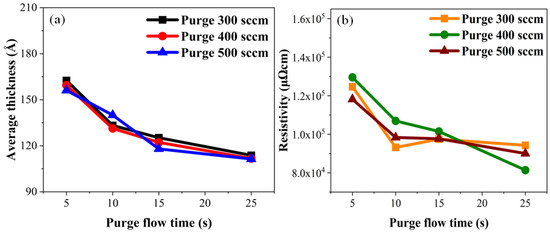
Figure 10.
Experimental results: (a) average thickness and (b) resistivity of TiN along the purge gas flow rate.
It was anticipated that increasing the purge gas flow time would result in decreased non-uniformity due to the removal of physically adsorbed impurities. Non-uniformity concerning purge gas flow time was calculated by substituting film thickness into Equation (3) and is depicted in Figure 11. Under all conditions, non-uniformity was measured to be within 1%. The highest non-uniformity was observed with a 5 s purge gas flow time and 500 sccm purge gas flow rate, coinciding with elevated carbon and oxygen percentages. Even at a 25 s gas flow and 500 sccm purge gas flow rate, non-uniformity remained high, while carbon and oxygen impurities were low. Hence, it can be concluded that the decrease in non-uniformity with increasing purge gas flow time did not have a significant impact.
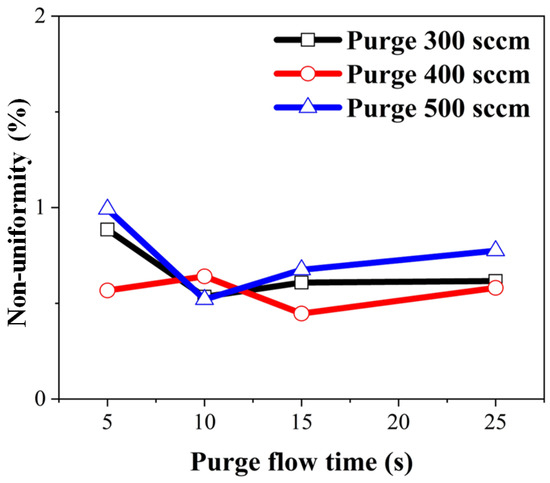
Figure 11.
Calculated wafer non-uniformity over 4-inch wafer concerning purge gas flow time.
We summarized theoretical and experimental results employing a coefficient of variation. Coefficient variation was obtained by dividing the standard deviation by the mean. Figure 12 illustrates the coefficient of variations of resistivity, thickness, non-uniformity, and atomic percentages of TiN concerning purge gas flow rate and purge gas flow time. Figure 12a shows the coefficient of variation as a function of the purge gas flow rate at each purge gas flow time condition. From this graph, the effect of the purge gas flow rate on the film properties of TiN was determined. The change in purge gas flow rate caused the largest change in non-uniformity and carbon content in the film, while other film properties had a coefficient of variation within 10%, indicating that these properties were not significantly changed by the purge gas flow rate. Furthermore, when the purge gas flow time was 25 s, changes in the purge gas flow rate led to significant variations in the atomic percentages of Ti, N, and notably, C. Figure 12b shows the coefficient of variation as a function of purge gas flow time at each purge gas flow rate condition. The characteristics that showed the largest variation with the change in purge gas flow time were non-uniformity, resistivity, carbon atomic percentages, and thickness. The coefficient of variation of thickness at purge gas flow time did not change, while the atomic percentages of titanium, nitrogen, and oxygen varied within 10%.
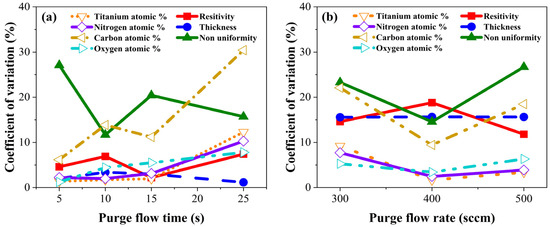
Figure 12.
Coefficient of variation concerning (a) purge gas flow time and (b) purge gas flow rate.
From this, we concluded that the purge gas flow rate had a strong influence on the non-uniformity and carbon atomic percentage of TiN, and that the purge gas flow time had a strong influence on resistivity and thickness. The effect of the purge gas flow rate on non-uniformity and carbon atomic percentage was that as the purge gas rate increased, the collision energy between gas particles was lowered, which reduced the production of unstable chemical species such as CH2 and N2H, and increased volatile species such as CH4 and N2 so that impurities could be effectively removed. The reason the purge gas flow time significantly changed the film non-uniformity, carbon atomic percentages, thickness, and resistivity was that as the purge gas flow time increased, impurities were reduced by the removal of physically adsorbed material, leading to a thinner, lower resistivity film.
4. Conclusions
Purge gas flow rate and purge gas flow time are important process parameters that can control thickness, resistivity, and non-uniformity, as well as impurities that can be incorporated into thin film during the ALD process. Purge gas flow rate and purge gas flow time both had the greatest impact on carbon and oxygen atomic percentages, especially purge gas flow time, which had a significant impact on resistivity and thickness. Moreover, at a high purge gas flow rate, a short purge gas flow time could not change the film’s composition, resistivity, thickness, and non-uniformity to a significant level, under a long purge gas flow time, an insufficient purge gas flow rate increased impurities in the film. Our observations showed that the experimental condition of 25 s and 500 sccm of the purge step showed the lowest carbon and oxygen impurities with low resistivity. This phenomenon can be attributed to simulation results, which revealed an upsurge in the production of volatile products at higher purge gas flow rates, facilitating the removal of adsorbed materials during extended purge gas flow times. Despite the absence of a comprehensive exploration of plasma physics concerning ions, this study provided a methodology that evaluated the influence of process variables by a simulation-coupled experiment during the PEALD-TiN process. It is important to note that the applicability of this research extends beyond TiN, offering valuable insights regarding understanding the purging mechanism and exercising control over thin film properties.
Author Contributions
Conceptualization, J.E.K. and S.J.H.; methodology, J.E.K. and S.J.H.; software, J.E.K. and S.A.; validation, J.E.K. and S.J.H.; formal analysis, J.E.K. and S.A.; investigation, J.E.K. and S.A.; data curation, J.E.K.; writing—original draft preparation, J.E.K. and S.A.; writing—review and editing, S.J.H.; visualization, J.E.K. and S.J.H.; supervision, S.J.H.; project administration, S.J.H.; funding acquisition, S.J.H. All authors have read and agreed to the published version of the manuscript.
Funding
This study was supported by the Korea Evaluation Institute of Industrial Technology (KEIT, GID: G01001557533).
Institutional Review Board Statement
Not applicable.
Informed Consent Statement
Not applicable.
Data Availability Statement
Data that support the findings of this study are available from the corresponding author upon reasonable request.
Acknowledgments
The authors are grateful to the staff of SPDRC at Myongji University for superior maintenance of the R&D process equipment.
Conflicts of Interest
The authors have no conflicts to disclose.
References
- Nitta, T.; Ohmi, T.; Otsuki, M.; Takewaki, T.; Shibata, T. Electrical Properties of Giant-Grain Copper Thin Films Formed by a Low Kinetic Energy Particle Process. J. Electrochem. Soc. 1992, 139, 922. [Google Scholar] [CrossRef]
- Weber, E.R. Transition Metals in Silicon. Appl. Phys. A 1983, 30, 1. [Google Scholar] [CrossRef]
- Murarka, S.P. Silicides for VLSI Applications; Academic Press: New York, NY, USA, 1983. [Google Scholar]
- Gonella, R. Key Reliability Issues for Copper Integration in Damascene Architecture. Microelectron. Eng. 2001, 55, 245. [Google Scholar] [CrossRef]
- Li, B.; Sullivan, T.D.; Lee, T.C.; Badami, D. Reliability Challenges for Copper Interconnects. Microelectron. Reliab. 2004, 44, 365. [Google Scholar] [CrossRef]
- Havemann, R.H.; Hutchby, J.A. High-Performance Interconnects: An Integration Overview. Proc. IEEE 2001, 89, 586. [Google Scholar] [CrossRef]
- Uhm, J.; Jeon, H. TiN Diffusion Barrier Grown by Atomic Layer Deposition Method for Cu Metallization. Jpn. J. Appl. Phys. 2001, 40, 4657. [Google Scholar] [CrossRef]
- Kwak, M.Y.; Shin, D.H.; Kang, T.W.; Kim, K.N. Characteristics of TiN Barrier Layer against Cu Diffusion. Thin Solid Films 1999, 339, 290. [Google Scholar] [CrossRef]
- Andrew, W. Titanuim Nitride Diffusion Barriers and Schottky Diodes. RIT Microelectron. Eng. Conf. 1998, 8, 33. Available online: https://scholarworks.rit.edu/ritamec/vol8/iss1/9 (accessed on 1 January 2024).
- Musschoot, J.; Xie, Q.; Deuytsche, D.; Van den Berghe, S.; Meirhaeghem, R.L.; Detavernier, C. Atomic Layer Deposition of Titanium Nitride from TDMAT Precursor. Microelectron. Eng. 2009, 86, 72. [Google Scholar] [CrossRef]
- De Baynast, H.; Bouteville, A.; Remy, J.C. Optimization of Titanium Nitride Rapid Thermal CVD Process. Chem. Vap. Depos. 2000, 6, 115. [Google Scholar] [CrossRef]
- Solovan, M.N.; Brus, V.V.; Maistruk, E.V.; Maryanchuk, P.D. Electrical and Optical Properties of TiN Thin Films. Inorg. Mater. 2014, 50, 40. [Google Scholar] [CrossRef]
- Zhang, W.; Cai, J.; Wang, D.; Wang, Q.; Wang, S. Properties of TiN Films Deposited by Atomic Layer Deposition for through Silicon Via Applications. In Proceedings of the 11th International Conference on Electronic Packaging Technology & High Density Packaging, Xi’an, China, 16–19 August 2010. [Google Scholar] [CrossRef]
- Buiting, M.J.; Otterloo, A.F. Relationship Between the Process Parameters and Film Properties of “Low Temperature” Low Pressure Chemical Vapor Deposition Titanium Nitride Films. J. Electrochem. Soc. 1992, 139, 2580. [Google Scholar] [CrossRef]
- Buiting, M.J.; Otterloo, A.F.; Montree, A.H. Kinetical Aspects of the LPCVD of Titanium Nitride from Titanium Tetrachloride and Ammonia. J. Electrochem. Soc. 1991, 138, 500. [Google Scholar] [CrossRef]
- Kim, B.; Lee, S.; Park, S.; Oh, K.; Song, J.; Kim, D. Comparison Study for TiN Films Deposited from Different Method: Chemical Vapor Deposition and Atomic Layer Deposition. Mater. Res. Soc. Symp. Proc. 2001, 672, 1. [Google Scholar] [CrossRef]
- Elam, J.W.; Schuisky, M.; Ferguson, J.D.; George, S.M. Surface Chemistry and Film Growth during TiN Atomic Layer Deposition using TDMAT and NH3. Thin Solid Films 2003, 436, 145. [Google Scholar] [CrossRef]
- Woo-Jae, L.; Eun-Young, Y.; Han-Bo-Ram, L.; Suck Won, H.; Se-Hun, K. Ultrathin Effective TiN Protective Films prepared by Plasma-Enhanced Atomic Layer Deposition for High Performance Metallic Bipolar Plates of Polymer Electrolyte Membrane Fuel Cells. Appl. Surf. Sci. 2020, 519, 146215. [Google Scholar] [CrossRef]
- Kong, J.-Z.; Xu, P.; Cao, Y.-Q.; Li, A.-D.; Wang, Q.-Z.; Zhou, F. Improved Corrosion Protection of CrN Hard Coating on Steel Sealed with TiOxNy-TiN Composite Layers. Surf. Coat. Technol. 2020, 381, 125108. [Google Scholar] [CrossRef]
- Turnquist, A.; Kofuji, N.; Sebastian, J.; Liu, Z.; Kou, H.; Fukuda, H.; Tomczak, Y.; Sun, Y.; Piumi, D.; Roest, D.D. Advanced Etch Technology and Process Integration for Nanopatterning XII 12499; SPIE: Bellingham, WA, USA, 2023. [Google Scholar] [CrossRef]
- Kim, S.; Lee, S.; Ham, S.Y.; Ko, D.H.; Shin, S.; Jin, Z.; Min, Y.S. A Kinetic Study of ZnO Atomic Layer Deposition: Effects of Surface Hydroxyl Concentration and Steric Hindrance. Appl. Surf. Sci. 2019, 469, 804. [Google Scholar] [CrossRef]
- Walke, W.; Kaczmarek, M.; Staszuk, M.; Basiaga, M. Metalurgija. 2017; Volume 56, p. 179. Available online: https://hrcak.srce.hr/168925 (accessed on 10 February 2024).
- Pan, D.; Guan, D.; Jen, T.; Yuan, C. Atomic Layer Deposition Process Modeling and Experimental Investigation for Sustainable Manufacturing of Nano Thin Films. J. Manuf. Sci. Eng. 2016, 138, 101010. [Google Scholar] [CrossRef]
- Ghiyasi, R.; Milich, M.; Tomko, J.; Tewari, G.C.; Lastusaari, M.; Hopkins, P.E.; Karppinen, M. Simultaneously Enhanced Electrical Conductivity and Suppressed Thermal Conductivity for ALD ZnO Films via Purge-Time Controlled Defects. Appl. Phys. Lett. 2022, 120, 062106. [Google Scholar] [CrossRef]
- Nwanna, E.C.; Coetzee, R.A.M.; Jen, T. A Numerical Approach on the Selection of the Purge Flow Rate in an Atomic Layer Deposition (ALD) Process. Phys. Fluids 2022, 34, 052003. [Google Scholar] [CrossRef]
- Lee, S.J.; Yun, J.G.; Lee, H.M.; Kim, J.Y.; Yun, J.H.; Hong, J.G. Dependence of N2O/NO Decomposition and Formation on Temperature and Residence Time in Thermal Reactor. Energies 2021, 14, 1153. [Google Scholar] [CrossRef]
- Sieradzka, M.; Rajca, P.; Zajemska, M.; Mlonka-Mędrala, A.; Magdziarz, A. Prediction of Gaseous Products from Refuse Derived Fuel Pyrolysis using Chemical Modelling Software—Ansys Chemkin-Pro. J. Clean. Prod. 2020, 8, 119277. [Google Scholar] [CrossRef]
- Shaeri, M.R.; Jen, T.C.; Yuan, C.Y.; Behnia, M. Investigation Atomic Layer Deposition Characteristics in Multi-outlet Viscous Flow Reactors Through Reactor Scale Simulations. Int. J. Heat Mass Transf. 2015, 89, 468. [Google Scholar] [CrossRef]
- Longrie, D.; Deduytsche, D.; Haemers, J.; Smet, P.F.; Driesen, K.; Detavernier, C. Thermal and Plasma-Enhanced Atomic Layer Deposition of TiN Using TDMAT and NH3 on Particles Agitated in a Rotary Reactor. ACS Appl. Mater. Interface 2014, 6, 7316. [Google Scholar] [CrossRef] [PubMed]
- Kim, D.; Kim, J.J.; Park, J.W.; Kim, J.J. Stability of TIN Films Prepared by Chemical Vapor Deposition Using Tetrakis-dimethylamino Titanium. J. Electrochem. Soc. 1996, 143, L188. [Google Scholar] [CrossRef]
- Gakis, G.P.; Vergnes, H.; Scheid, E.; Vahlas, C.; Caussat, B.; Boudouvis, A.G. Computational Fluid Dynamics simulation of the ALD of alumina from TMA and H2O in a Commercial Reactor. Chem. Eng. Res. Des. 2018, 132, 795. [Google Scholar] [CrossRef]
- Elers, K.E.; Blomberg, T.; Peussa, M.; Aitchison, B.; Haukka, S.; Marcus, S. Film Uniformity in Atomic Layer Deposition. Chem. Vap. Depos. 2006, 12, 13. [Google Scholar] [CrossRef]
Disclaimer/Publisher’s Note: The statements, opinions and data contained in all publications are solely those of the individual author(s) and contributor(s) and not of MDPI and/or the editor(s). MDPI and/or the editor(s) disclaim responsibility for any injury to people or property resulting from any ideas, methods, instructions or products referred to in the content. |
© 2024 by the authors. Licensee MDPI, Basel, Switzerland. This article is an open access article distributed under the terms and conditions of the Creative Commons Attribution (CC BY) license (https://creativecommons.org/licenses/by/4.0/).