Article

Preparation of Silicone Coating and Its Anti-Ice and Anti-Corrosion Properties

College of Chemistry and Chemical Engineering, Shanghai University of Engineering Science, Shanghai 201620, China
*
Author to whom correspondence should be addressed.
Coatings 2024, 14(6), 699; https://doi.org/10.3390/coatings14060699
Submission received: 29 April 2024 / Revised: 26 May 2024 / Accepted: 30 May 2024 / Published: 1 June 2024
(This article belongs to the Section Environmental Aspects in Colloid and Interface Science)

Abstract

:
To enhance protection against corrosion and ice on iron metal material in frigid zones, an organic silicone resin coating was prepared using four monomers. Its structure and performance was analyzed via infrared spectroscopy (FTIR), nuclear magnetic resonance (NMR), gel permeation chromatography (GPC), and thermal analysis (TG). Corrosion resistance of coating was tested by saltwater resistance and salt spray resistance and assessed using an electrochemical workstation, alongside anti-icing tests. The results showed that the organic silicone resin was successfully synthesized. The coatings could delay freezing onset by one-third compared to controls in low temperatures, with a detachment time also reduced by one-third, indicating excellent corrosion and ice resistance. The methylphenyl silicone resin had good anti-corrosion and anti-ice properties, with a low corrosion current density (icorr) of 0.8793 μA/cm2 and a high charge transfer resistance (Rct) of 24,930 Ω·cm2 in saline.

1. Introduction

Polar navigation vessels and marine platforms are vital for resource exploration, transportation, and scientific research in polar regions. As scientific research progresses and navigational conditions improve, we continue to discover the mysteries and environmental value of the North and South Poles, leading to increased competition and disputes over Arctic region rights and interests [1,2]. Polar research icebreakers are crucial for accessing polar ocean areas, conducting marine surveys in icy regions, and implementing strategic polar activities [3].
Corrosion by saltwater and salt spray presents significant challenges for icebreakers in marine environments [4,5]. Additionally, polar navigation ships and offshore platforms face the impact of ice covering formed in extreme climates. Ice formation on the hull and deck of polar sailing ships primarily occurs due to seawater splashing. Encounters with equipment result in atmospheric ice formation, such as on cables, life-saving equipment, vents, and other surfaces, caused by supercooled liquid droplets in the atmosphere. Ice cover significantly affects the functionality and stability of polar navigation ships by increasing draft depth and center of gravity, thereby affecting stability. Offshore platforms can accumulate hundreds of tons of ice, compromising structure stability, altering structural stress, reducing overall reliability, and posing threats to equipment in polar working regions. Consequently, combating corrosion and icing in environments with extremely high salt content, high humidity, and low temperatures is a significant challenge. Coatings offer numerous advantages such as easy application, cost-effectiveness, effectiveness, high-cost performance, and good corrosion resistance [6,7,8]. Moreover, coatings have fewer application restrictions compared to other anti-corrosion methods, leading to their widespread usage and significant development prospects [9]. At present, the protective coatings are still based on traditional materials, such as epoxy resins, fluorocarbon resins with anti-corrosive fillers, such as graphene, zinc powder, etc. [10,11,12].
Metal corrosion can be categorized into chemical corrosion and electrochemical corrosion, with appropriate protection methods based on the underlying mechanism [13]. The mechanisms of corrosion protection can be broadly categorized into three types based on the mechanism of metal corrosion [14]. One of these mechanisms is the isolation shielding mechanism, which prevents the corrosive medium from reaching the metal substrate interface, ensuring effective isolation. Superhydrophobic or hydrophobic surfaces can minimize the contact area between the metal substrate and corrosive medium, enhancing corrosion resistance and prolonging material lifespan [11]. Nguyen et al. [15] prepared superhydrophobic coatings with ordered nanopillar array structures on the surface by etching a quartz substrate and cladding it with a low-surface-energy polytetrafluoroethylene (PTFE) material, and investigated the effect of surface topographical parameters on anti-icing properties. The results show that regardless of the height of the nanocrystalline pillars, as long as the top area is small, the actual ice contact area is small, the ice adhesion strength can be significantly reduced, and the icing time can be delayed. Wang et al. [16] used soft lithography to construct rough structures with micrometer scale on the surface of polydimethylsiloxane then prepared ZnO nanohair structures on the surface using a hydrothermal method so as to mimic the surface of a lotus leaf to construct micro-nano rough junction structures, and the surface was treated with a fluorinated silane coupling agent to prepare a new superhydrophobic structural material.
This is because the presence of an air layer, formed by the rough surface at the solid–liquid interface, significantly reduces heat exchange between the surface and the droplet, impeding nucleation and delaying ice onset [17,18]. When the superhydrophobic surface freezes, its rough microstructure maintains an air layer, minimizing contact with the ice sheet, effectively reducing ice adhesion. However, in low-temperature and high-humidity environments, water vapor in the atmosphere condenses, forming small cold droplets that adhere to microscopic structures and columnar arrays on superhydrophobic surfaces. This leads to hydrophobicity loss, preventing effective ice resistance while promoting increased adhesion. Consequently, smoother textured surfaces may exhibit improved performance across both low- and high-temperature regimes.
Commonly used substances for anti-corrosion coating films include epoxy resin, fluorocarbon resin, and silicone resin, among others. Silicone resins are widely known for their highly branched three-dimensional structure and exceptional properties such as heat resistance, water resistance, UV linearity, and improved adhesion [19]. However, the widespread use of pure silicone resin in coatings is limited due to its dense three-dimensional cross-linked structure, resulting in poor mechanical properties. Therefore, controlling and designing the structure of silicone resin is a research focus aimed at solving existing problems and achieving unity of mechanical properties, anti-corrosion, and weather resistance.
The corrosion protection properties of hybrid coatings formed through inorganic and organic polymerization in silicone resin synthesis have been sparsely examined [20]. Moreover, few studies have investigated the relationship between organic–organic chemistry, mixed coating structure, and long-term anti-corrosion properties [21]. This study utilized methyltrimethoxysilane and phenyltrimethoxysilane for high reactivity, and diphenyldimethoxysilane and methylphenyldimethoxysilane to ensure appropriate crosslinking density. By using these four relatively inexpensive raw materials, a hybrid organic silicone resin was synthesized, effectively balancing toughness and hardness. The resin’s structure was characterized, and its corrosion resistance and anti-icing performance were evaluated through electrochemical testing, salt spray testing, and anti-icing performance assessment. Additionally, the corrosion mechanism of this resin was briefly discussed.

2. Materials and Methods

2.1. Raw Materials

Methyltrimethoxysilane (MTMS, 98%), phenyltrimethoxysilane (MSDS, 98%), diphenyldimethoxysilane (DMDPS, 98%), methylphenyldimethoxysilane (MPMS, 98%), and glacial acetic acid (HAC, 98%) were purchased from Shanghai Titan Technology Co., Ltd., (Shanghai, China) Sodium chloride, tetrahydrofuran, glacial acetic acid, anhydrous ethanol, and deuterated chloroform were purchased from Aladdin Shanghai Co., Ltd. (Shanghai, China). All chemicals were used without further purification. Deionized water was made in the laboratory.

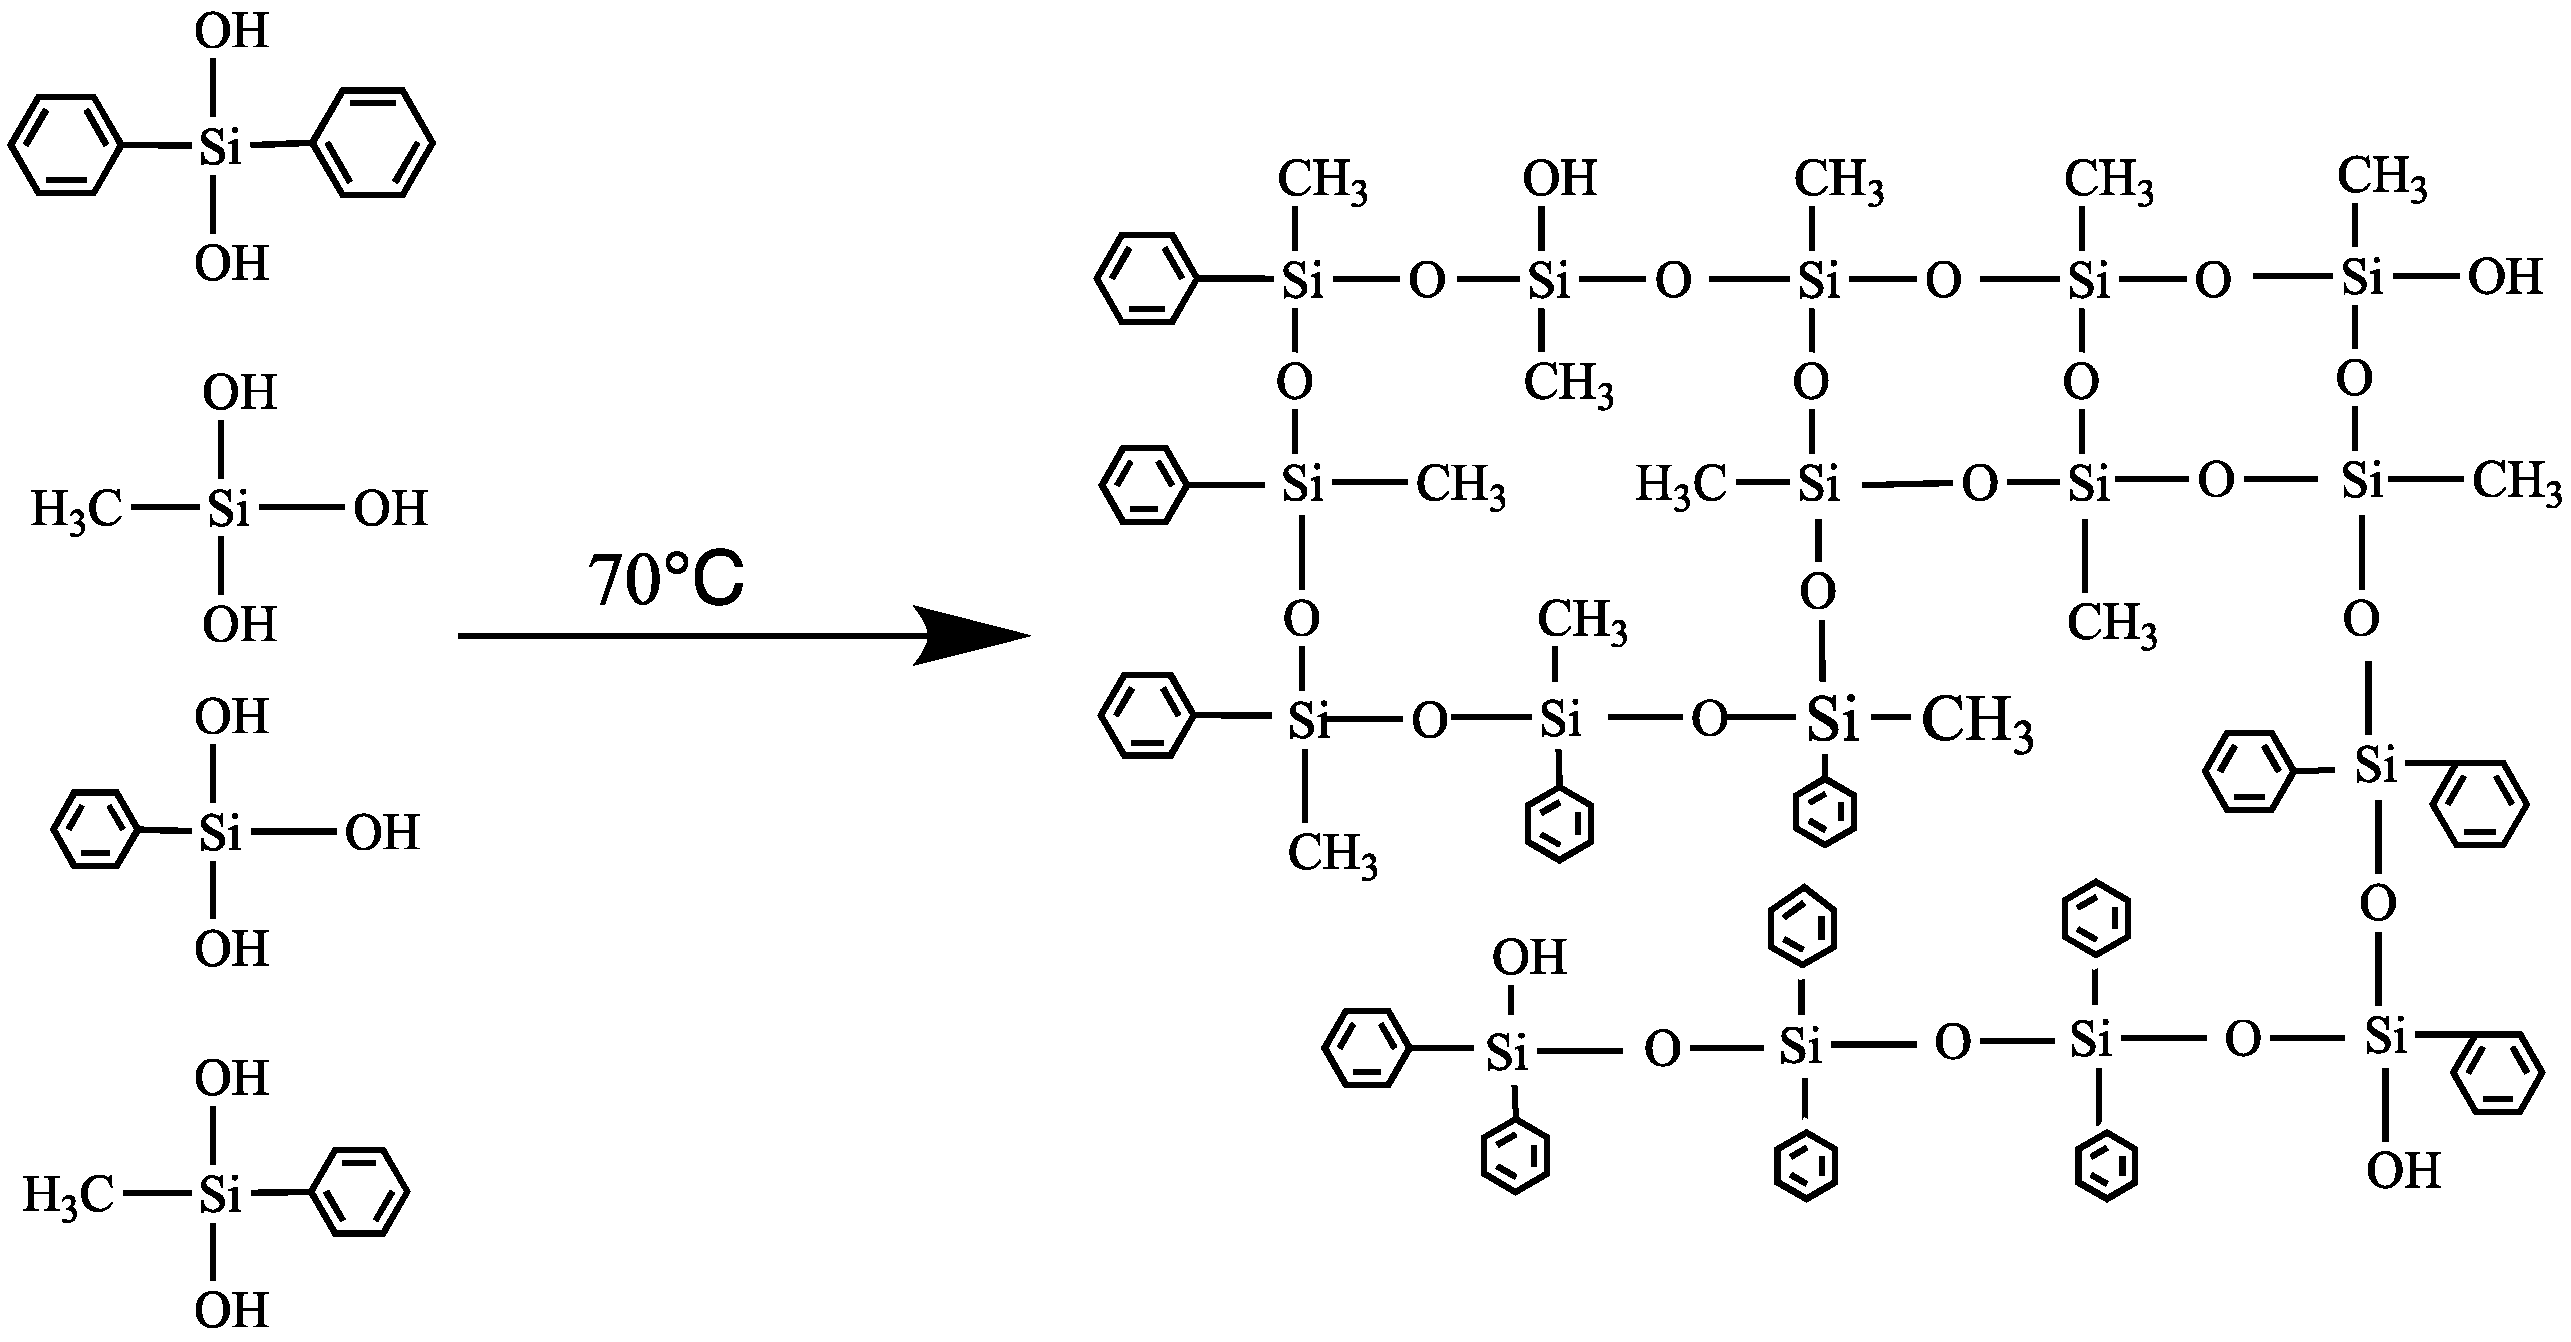
2.2. Preparation of Silicone Resin

To prepare the silicone resin, 6 mL of methyltrimethoxysilane, 5 mL of methylphenyldimethoxysilane, 5 mL of diphenyldimethoxysilane, 1 mL of phenyltrimethoxysilane, and 15 mL of anhydrous ethanol were combined in a three-neck flask. The pH of the mixture was adjusted to approximately four using glacial acetic acid. A solution containing a small amount of ethanol and precisely measured deionized water was then prepared in a normal pressure drip funnel. This solution was added gradually to the three-neck flask at a drop rate of 0.1 mL/min. After complete addition, the mixture was allowed to react at room temperature for 2 h before being heated to 70 °C and subjected to condensation reflux.
After the reaction was complete, the resulting liquid mixture underwent low-pressure steam treatment at 60 °C to eliminate low-boiling substances. The process was terminated when no more bubbles were observed, resulting in a colorless, transparent, and viscous methyl phenyl silicone resin. By adjusting the reactants’ ratio, a phenyl organosilicon resin with the ratio R/Si (organic substituents/silicon atoms) of 1.52 was determined, exhibiting excellent properties. The synthesis reaction is depicted in Figure 1 and Figure 2.

2.3. Preparation of Silicone Coating

In a single-neck flask equipped with a stirrer, silicone resin (52% by weight) and ethanol (48% by weight) were combined and stirred for 20 min.
Carbon steel tinplate polished with 600-mesh sandpaper before using, then soaked in anhydrous ethanol and taken out after ultrasound, cleaned with deionized water, wiped with paper towels, and dried with a hair dryer.
The silicone resin mixture was applied onto the treated tinplate with a 100 μm wire rod applicator. The films were baked in an oven at 160 °C for 2 h to obtain the final silicone resin coating samples.

2.4. Characterization

The structure of the silicone resin prepolymer was characterized using Nicolet IS5 infrared spectroscopy from Thermo-Fisher Scientific (Waltham, MA, USA) in the wavenumber range of 4000–500 cm−1. Hydrogen nuclear magnetic resonance (1H-NMR) spectroscopy was conducted on a Bruker AVANCE III HD 400M instrument (Billerica, MA, USA) using deuterated chloroform as the solvent. The ratio of methyl and phenyl groups in the silicone resin was determined based on the 1H-NMR data. The solid-state magic angle spinning (SI-MAS) spectrum was obtained using a Bruker AVANCE III 400 WB spectrometer (Billerica, MA, USA), and the branching structure and proportion of silicon were calculated from the spectral data. All 29Si cross-polarization magic angle spinning (CP MAS) chemical shifts were referenced to the resonance of 3-(trimethylsilyl)-1-propyl sulfonate standard.
The molecular weight of the samples, dissolved in tetrahydrofuran, was measured using liquid chromatography with an Agilent PLgel 5 μm MIXED-C column (Santa Clara, CA, USA) at a flow rate of 1 mL/min and a temperature of 35 °C, calibrated against a standard sample of polystyrene (PS)/polymethyl methacrylate (PMMA). Thermogravimetric analysis (TGA) was performed using TA’s TGA5500 (TA Instruments, New Castle, DE, USA), heating at a rate of 10 °C/min from room temperature to 800 °C in a nitrogen atmosphere to assess thermal stability.
The fundamental physical properties of silicon coatings were tested using instruments such as a film thickness gauge, pendulum hardness tester, pencil hardness tester, gloss meter, adhesion tester, impact strength tester, and high-low humidity alternating test box. The freezing and desorption times of coatings were recorded using a low-temperature refrigerator, thermometer, and timer.
In the absence of standardized ice prevention measures, this study assesses ice formation prevention by measuring the freezing time of coatings at the same temperature with three media (deionized water, 5 wt% NaCl, and tap water), representing the delay in ice formation. Additionally, the time taken for ice particles to detach from coatings with vertically attached water droplets at the same temperature is recorded to evaluate ice adhesion.
Before the saltwater resistance test, the edge and back surface of samples were sealed with a mixture of rosin: paraffin = 1:1. And two-thirds of tinplate was soaked in 3.5 wt% NaCl solution and observed at different intervals of days.
In the same way, the saltwater resistance test was used to seal samples, and then they were placed in the neutral salt spray test chamber from Biuged Laboratory Instruments Co., LTD., Guangzhou, China. The angle between the coating plate and the vertical line was 20 ± 5°. The NaCl concentration was 50 ± 10 g/L, the pH value was 6.5~7.2, and the solution collection rate of the spray collection device was 1 mL/h~2.5 mL/h.
The corrosion resistance of the coating was evaluated using an electrochemical workstation. Before testing, the carbon steel coated with coatings was cut, and the edge and back surface of the sample was sealed with a mixture of rosin and paraffin. The coatings with a retention area of 1 cm × 1 cm were tested using the electrochemical method. After soaking in 3.5 wt% NaCl solution at 25 °C for a period of time, the electrochemical impedance spectroscopy (EIS) and Tafel curves of coatings were obtained using an electrochemical workstation from Shanghai Chenhua Equipment Co., LTD., Shanghai, China. The saturated calomel electrode was used as the reference electrode, platinum electrode was used as the counter electrode, and the electrode coated with sample was used as the working electrode.

3. Results

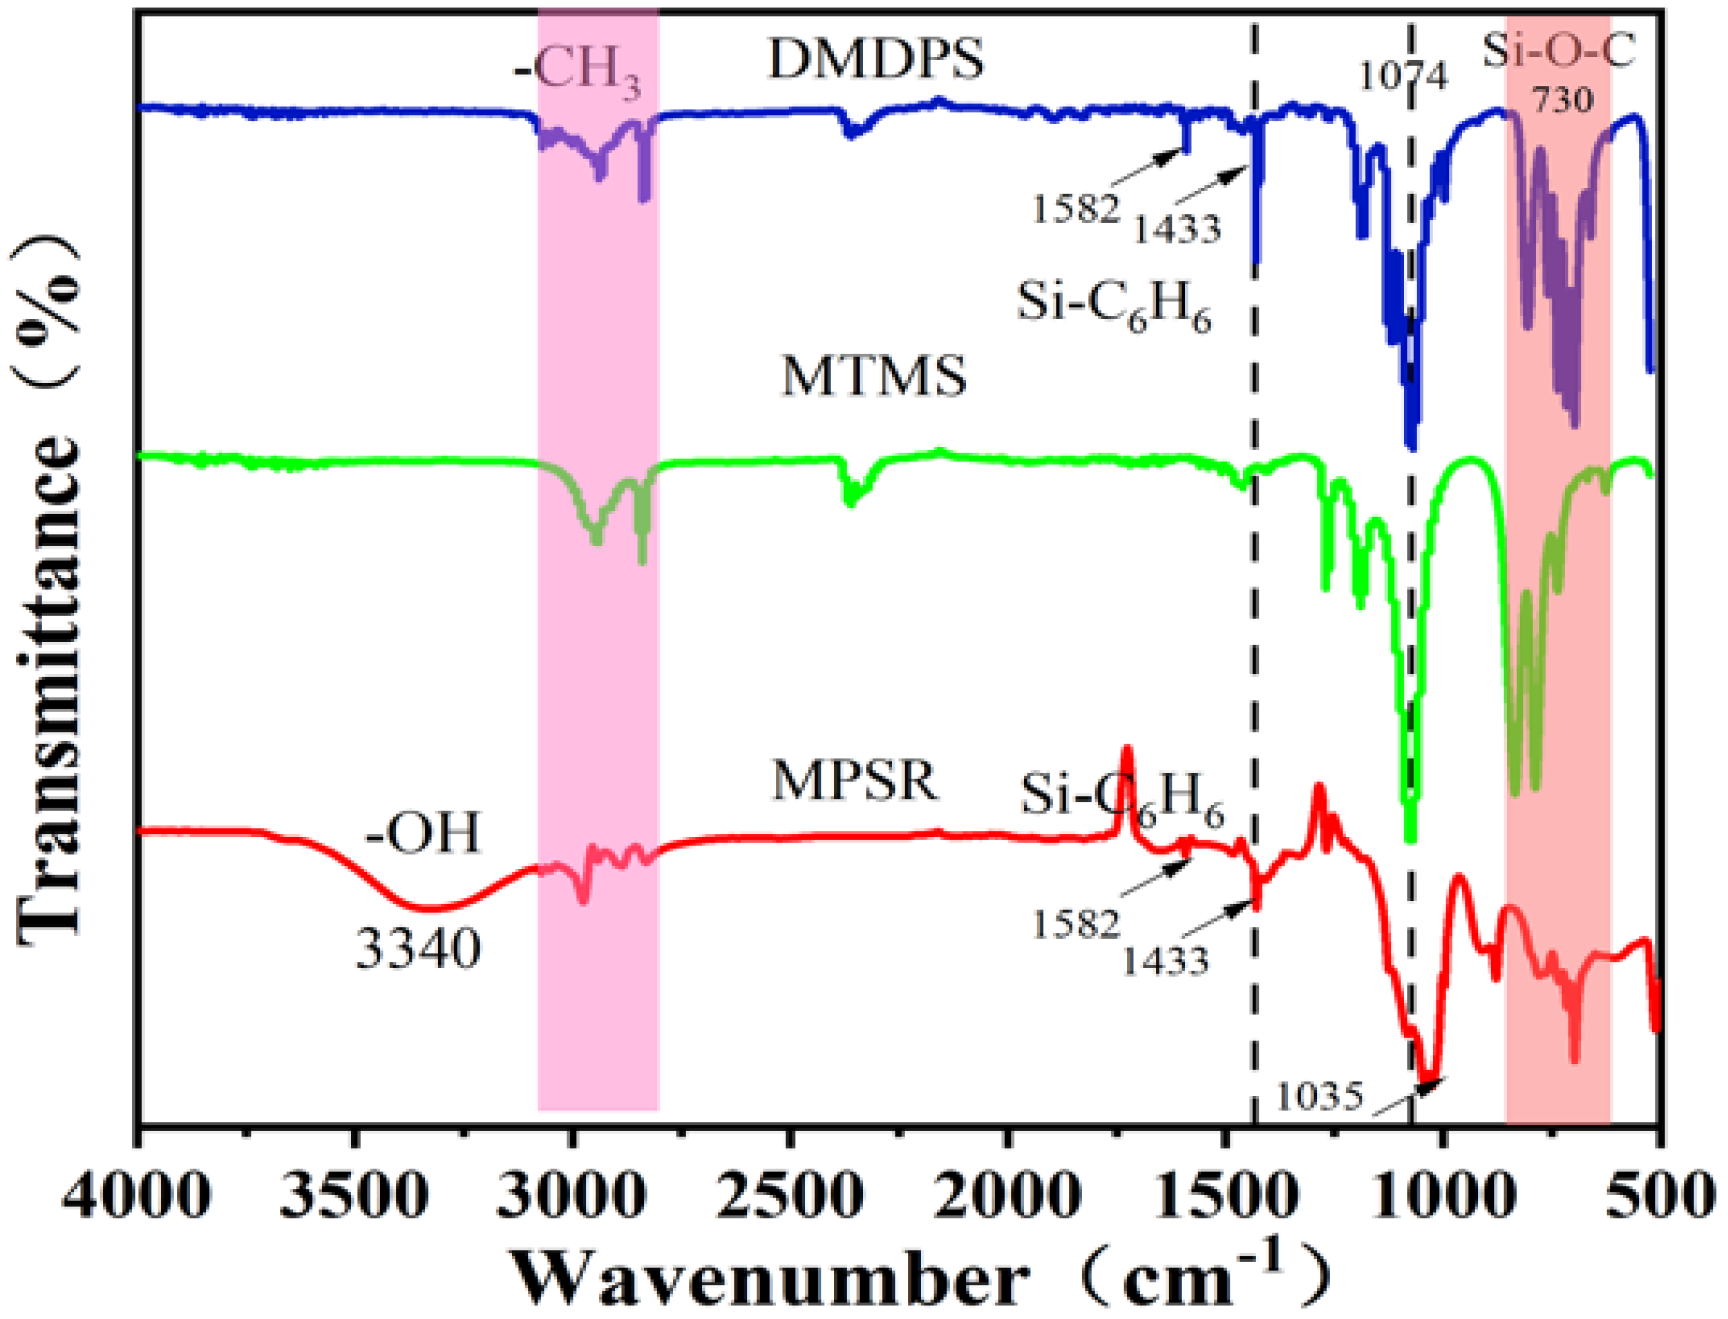
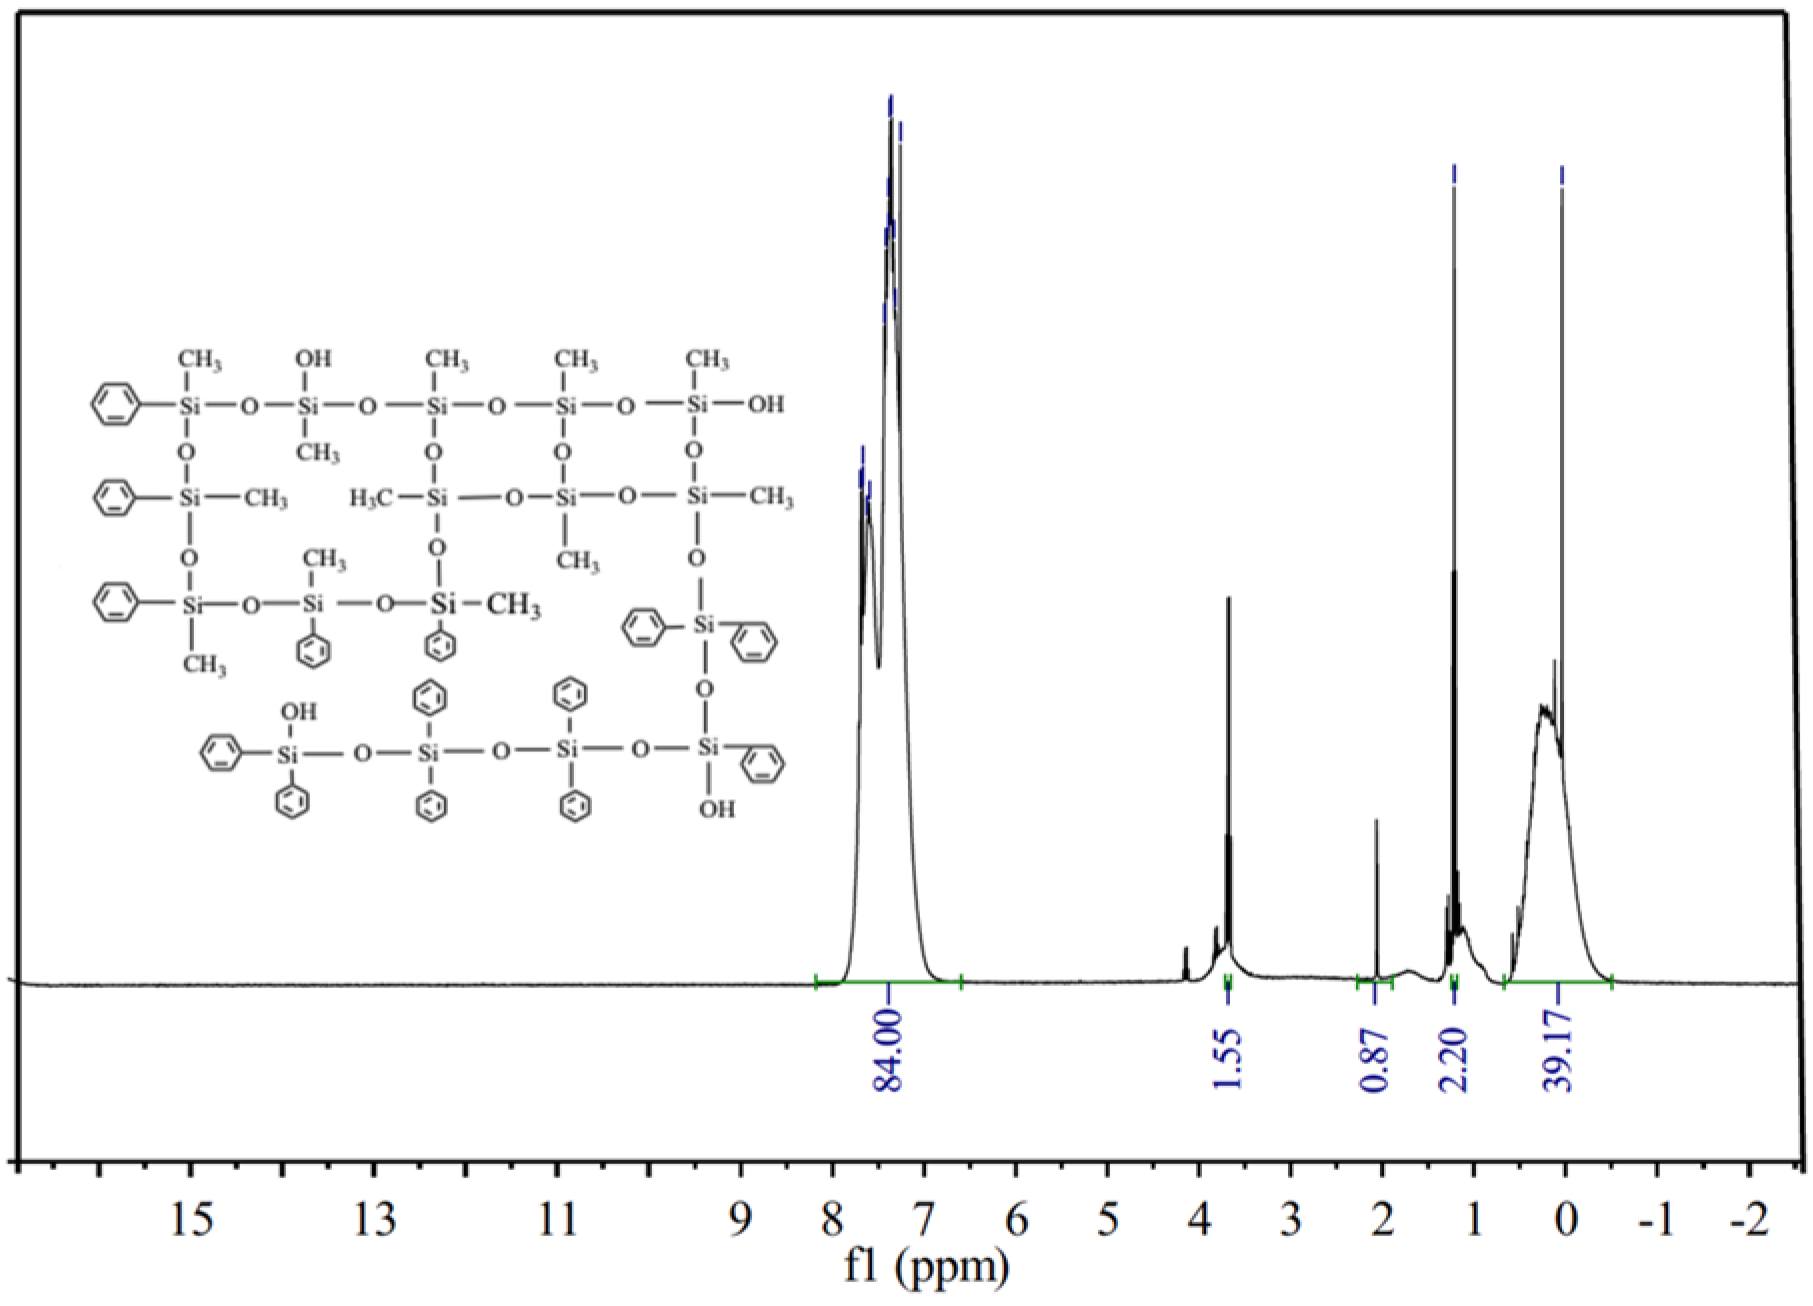
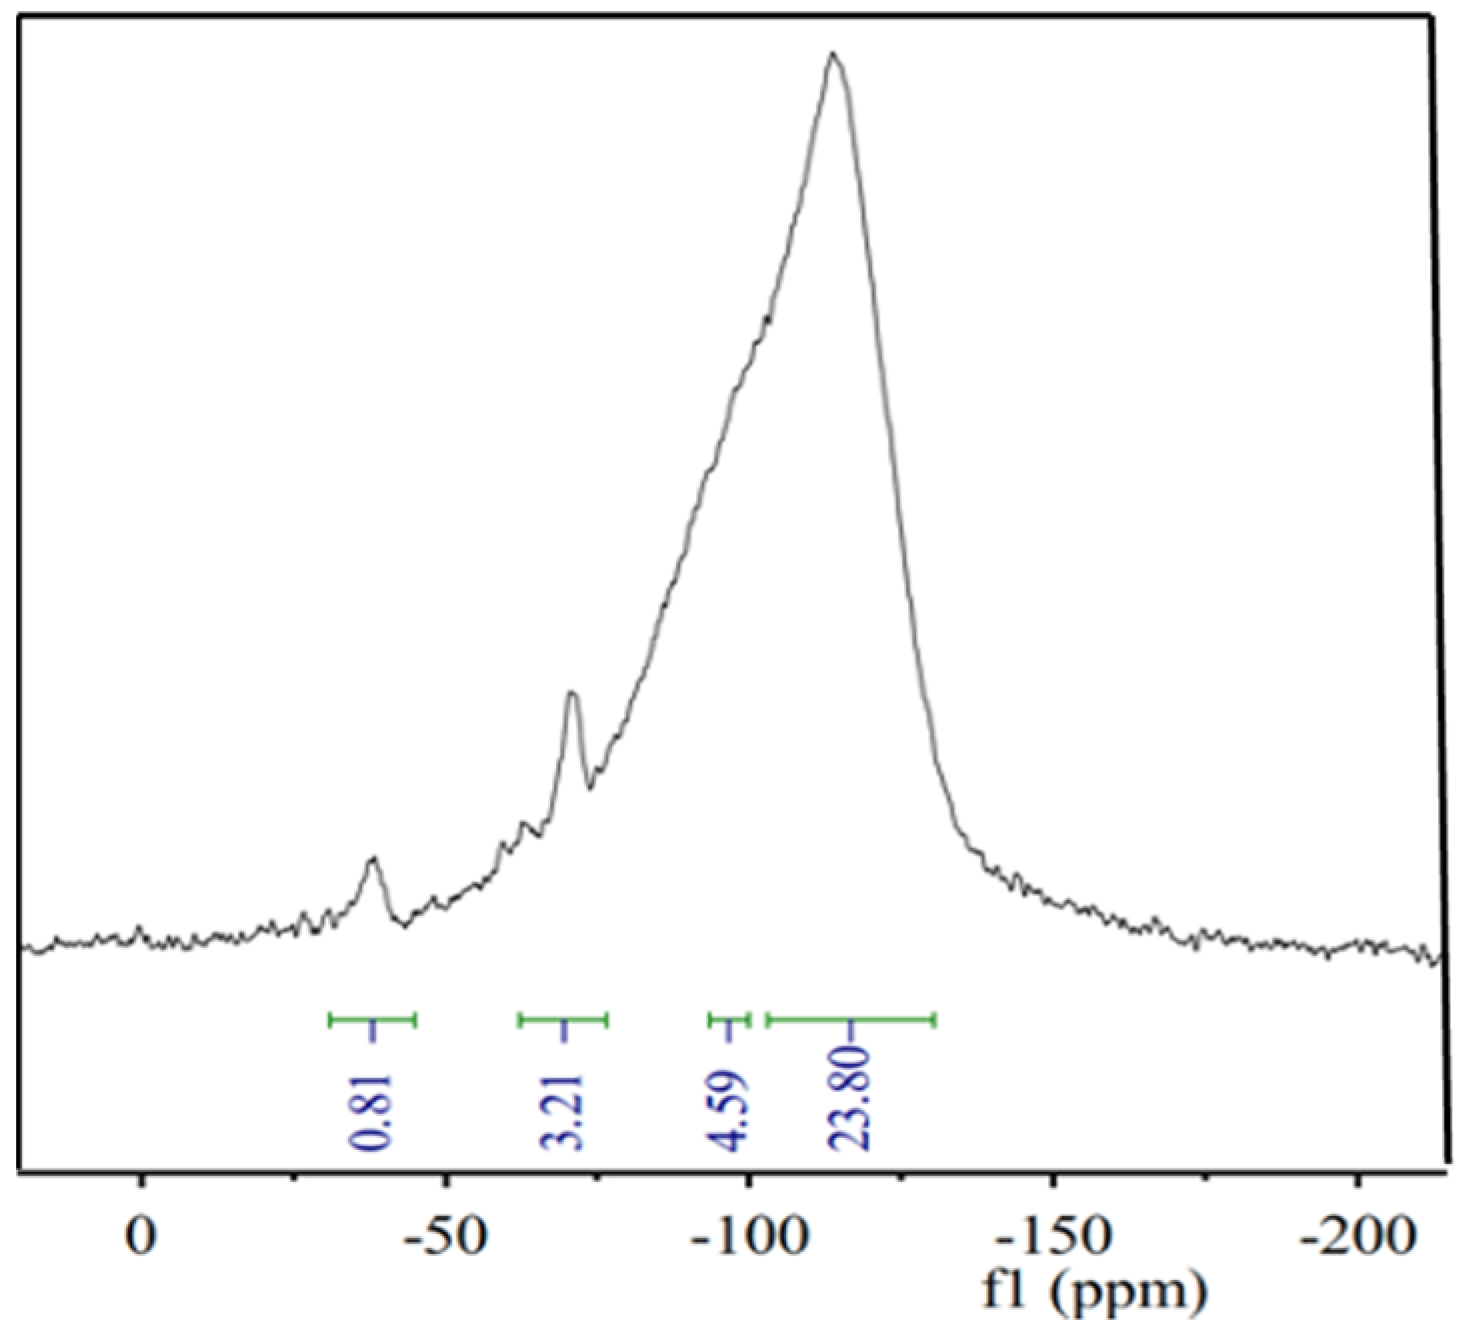
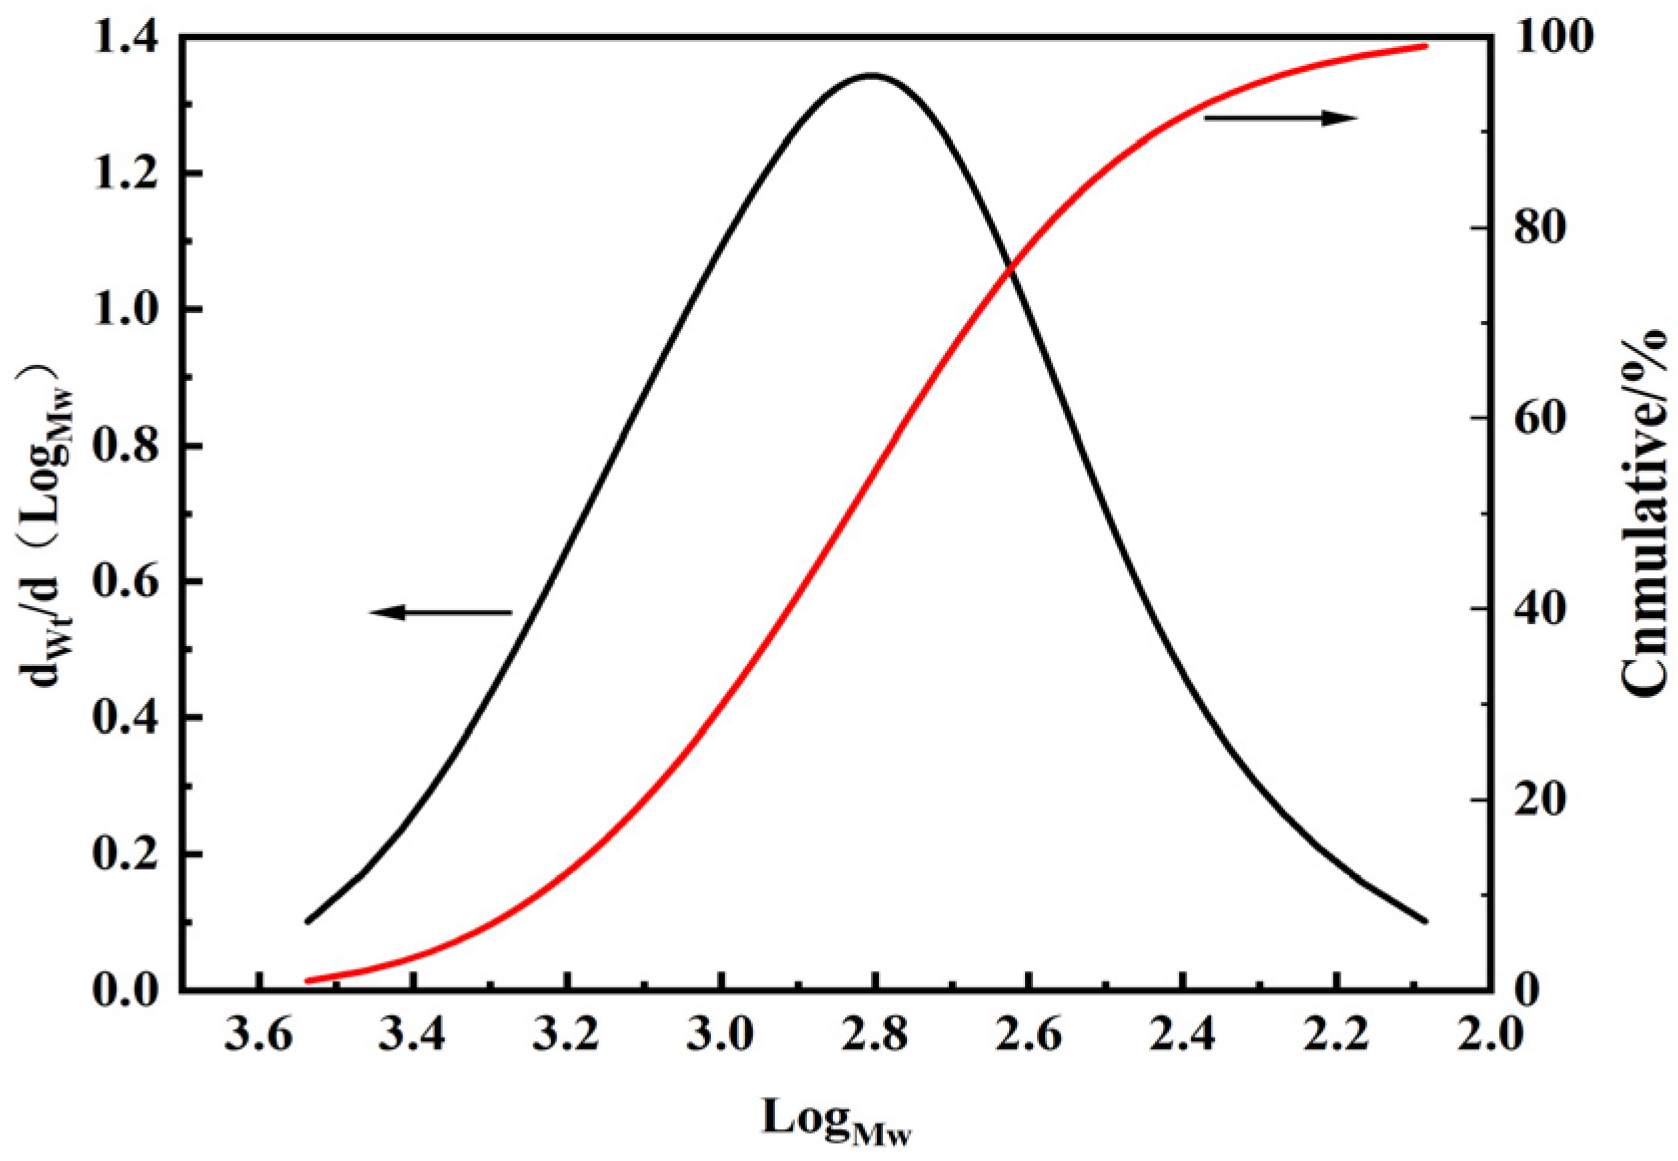
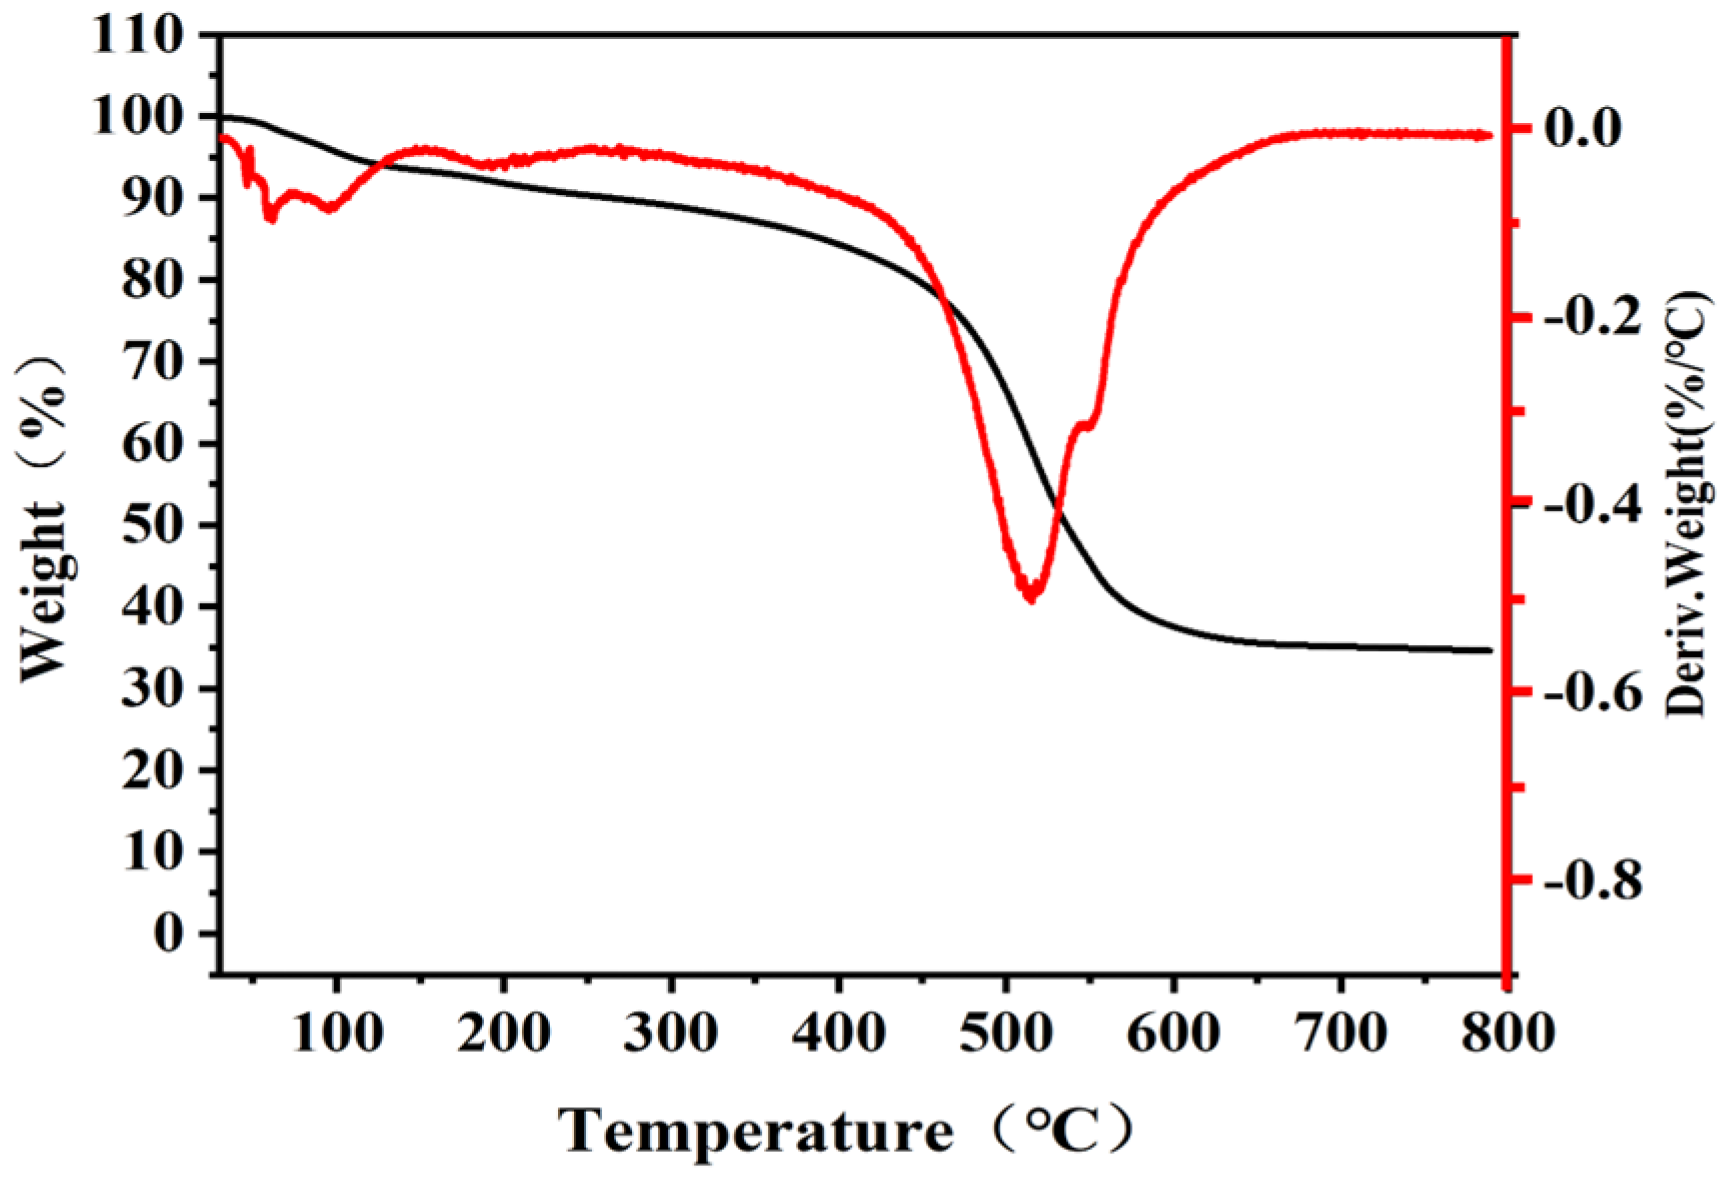
3.1. Structure Characterization of Silicone Resin

The monomer and the synthetic product were characterized by infrared structure, and the results are shown in Figure 3.
Figure 3 depicts the infrared spectra of the monomers (DMDPS and MTMS), along with the silicone prepolymers (MPSR). An absorption peak corresponding to Si-O-C is observed at approximately 730 cm−1. The wide and prominent double peaks at 1035 cm−1 represent the anti-symmetric stretching vibration absorption peak of Si-O-Si, arising from the tensile vibration of the Si-O bond—a characteristic feature of silicone resin. The peak at 1074 cm−1 is attributed to methyl absorption in Si-O-CH3. Additionally, the absorption peak at 1433 cm−1 corresponds to the tensile vibration of C-C in silicophenyl. Furthermore, absorption peaks at 3072 cm−1 and 3051 cm−1 are associated with the C-H bond in phenyl [22]. Wide peaks observed in the 3100 to 3500 cm−1 range signify the -OH tensile vibration of Si-OH. Spikes at 2963 cm−1 and 2902 cm−1 can be attributed to the symmetric -CH3 and asymmetric C-H hydrocarbon segments of the spectrum, respectively, indicating methyl absorption in the Si-CH3 feedstock. In conclusion, the synthesized silicone resin exhibits characteristic structures including monomeric phenyl and methyl groups, along with unique Si-O-Si and Si-OH characteristic peaks. These findings lead to the conclusion that the synthesized silicone resin is a methyl phenyl silicone resin with Si-OH as the end group.
In order to gain deeper insight into the molecular structure of the silicone resin, NMR spectroscopy was used to analyze both hydrogen and silicon nuclei. The 1H-NMR spectrum of silicone resin is presented in Figure 4.
The 1H-NMR spectrum of the silicone resin, showing the chemical shifts, is depicted in Figure 4. A singlet signal was observed at 7.26 ppm, indicative of CHCl3 when chloroform is used as the solvent. Peaks centered at 7.33 ppm and 7.46 ppm correspond to the resonance of protons in the phenyl group within the molecular structure. Additionally, the peak centered at 0.04 ppm corresponds to the resonance of methyl protons in the resin structure. The peaks at 3.68 ppm and 1.22 ppm represent resonances of methylene protons and methyl protons in residual ethanol, respectively [23].
By calculating peak areas, the ratio between the resonance of protons in the phenyl group and the proton formant area in methyl was determined to be 2.12, closely aligning with the theoretically calculated value of 2.30. This discovery further supports the structure of methyl phenyl silicone resin. The deviation between the theoretical and actual values arises from a small number of hydrolyzed monomers that do not react with the silicone hydroxyl group within the silicone resin molecule. This suggests that prepolymers with organic group content, particularly molecules containing phenyl groups, might contain a relatively small quantity of residual uncondensed silanol groups due to the steric hindrance surrounding the organic group site and the significant steric hindrance effect of phenyl groups [24].
The 29Si-NMR spectrum of silicone resin is presented in Figure 5.
A 29Si-NMR spectrum displaying the chemical shift of the silicone resin is presented in Figure 5. The spectrum reveals characteristic peaks corresponding to structural units at approximately −39 ppm, −69 ppm, −100 ppm, and −120 ppm, yielding four distinct signals [25,26,27]. The −39 ppm peak corresponds to the mixed peak characteristic structure of MePhSi(OSi)2 and Ph2Si(OSi)2. The −69 ppm peak corresponds to the characteristic structure of Ph2Si(OSi)(OH), with a theoretical ratio of 8 but an observed ratio of approximately 4.0. This suggests that a small portion of Ph2Si(OSi)(OH) has not undergone dehydration condensation to form the R2Si(OSi)2 structure, likely due to the significant steric hindrance of the phenyl component, impeding its involvement in the silicone resin synthesis [19].
The wide and prominent peaks around −100 ppm and −120 ppm represent the characteristic structural peaks of MeSi(OSi)3 and rSi(OSi)2 (OH) (where R is phenyl or methyl), respectively. The actual peak area [28] ratio between the two is 0.19, aligning closely with the calculated theoretical ratio of 1.67. This indicates that the formation of T-type cross-linked structures within the prepolymer structure is limited. Over time or with increased temperature, rSi(OSi)2 (OH) (where R is phenyl or methyl) progressively transforms into rSi(OSi)3 and R2Si(OSi)2 structures, corroborating the TGA results.
By analyzing the 1H-NMR and 29Si-NMR spectra, it was confirmed that the structure of the silicone resin prepolymer adhered to theoretical predictions. Under high temperature curing conditions, the molecules gradually reacted to form a highly cross-linked network structure, exhibiting excellent shielding properties and desirable mechanical characteristics.
Infrared analysis results confirm that the synthesized product is a prepolymer of methyl phenyl silicone resin [19].
The molecular weight distribution and size of the silicone prepolymers were determined using gel permeation chromatography. The test result is shown in Figure 6 and Table 1.
Figure 6 displays the results of the gel permeation chromatography (GPC) analysis performed on the methyl phenyl silicone resin prepolymer featuring a Si-O-Si backbone, eluted using tetrahydrofuran (THF). The GPC curve of the synthesized silicone resin exhibits a prominent peak at approximately 10.0 min of elution time, with the highest peak corresponding to a molecular weight of 625 (MP).
Table 1 presents the number average molecular weight (Mw) and weight average molecular weight (Wn) values of 528 and 867, respectively. The polydispersity index (Mw/Mn), calculated as the ratio of weight average molecular weight (Mw) to number average molecular weight (Mn), serves as an indicator of the breadth of the molecular weight distribution of the polymers. The polydispersity index of 1.64 suggests the synthesis of a relatively homogeneous polymer, indicating the absence of low-molecular-weight materials such as monomers and cyclic oligomers.
Thermogravimetric analysis (TGA) was performed on the organic silicone resin prepolymers to assess their thermal properties and molecular structure; the result is shown in Figure 7.
Figure 7 illustrates the thermogravimetric (TGA) and corresponding differential thermogravimetric (DTG) curves of the silicone resin prepolymers under a nitrogen atmosphere. These prepolymers underwent extensive study to investigate the structural and thermal properties of methylphenylsilicone resins. The TGA curves reveal three distinct stages of mass loss and degradation in the prepolymers [21].
The initial stage, occurring around 100 °C, involves the desorption and volatilization of impurity molecules like methanol, ethanol, and water [29]. The second stage, ranging from 200 °C to 550 °C, represents the primary phase of mass loss due to the decomposition of silanols. This decomposition primarily stems from the breakdown of organic side-chain groups, specifically methyl and phenyl, due to exposure to high temperatures. Around 200 °C, these side-chain groups undergo bond breaking with the terminal structure of the molecules, leading to chain breaking within the molecular structure itself from 200 °C to 550 °C [30]. Notably, certain silanols can exhibit significant stability even under rigorous experimental conditions in silicone resins, leading to cross-linking reactions alongside resin degradation reactions within this temperature range [31].
At higher temperatures, reactive silanols interact and undergo condensation, leading to crosslinking of the silicone resin. The final stage, between 550 °C and 800 °C, involves the gradual dehydration of silanol structures within the molecular framework, according to the TGA curve as anticipated based on the designed molecular structure [21].

3.2. Silicone Resin Coating Properties

Table 2 presents the fundamental properties of resin coating with an R/Si value of 1.52.
From Table 2, it was found that the coating has high grid adhesion and gloss degree. The results of pendulum hardness, pencil hardness, and compaction strength show that the coating has good flexibility. The results of high and low temperature alternating test indicated that the coating has good weather resistance.

3.3. Anti-Icing Performance of Silicone Resin

3.3.1. Icing Time

Figure 8 illustrates the freezing time of three solvent media (deionized water, 5 wt% NaCl, and tap water) on a tinplate coated with silicone resin, as well as 5 wt% NaCl on an uncoated tinplate as control subject. The freezing temperatures were −20 °C, −30 °C, and −40 °C, respectively.
As shown in Figure 8, as the icing amount increased, the icing time gradually lengthened in an approximately linear fashion. With the same icing amount at different temperature, the freezing times ordered from high to low are 5 wt% NaCl > 5 wt% NaCl of control subjects > deionized water > tap water. This is because in 3.5% sodium chloride aqueous solution, sodium chloride can reduce the freezing point of water, therefore, condensing time increased. There was no significant difference in icing times between tap water and deionized water. It can also be found that the freezing times decreased with the freezing temperature decline. This is due to the longer icing time at lower temperatures, as the significant temperature difference leads to faster heat transfer rates. However, the silicone resin coating showed the longest icing time with 5 wt% NaCl, demonstrating its effectiveness in delaying the icing process. This is due to the silicon element contained in the silicone resin, the low surface tension of the coating, and the inability of liquid medium to condense on its surface.

3.3.2. Desorption Time

Ice-melting adhesion, another significant measure of ice resistance, involves placing the coated plate, following the icing process described in Section 3.3.1, in a vertical position in 8 °C air. The timing records the duration until the ice detaches from the substrate, as shown in Figure 9.
As the ice weight increases, the time required for ice melting gradually prolongs. The desorption speed was different. Tap water was the fastest, but 5 wt% NaCl was the slowest. Ice exhibits a lower thermal conductivity of approximately 0.5 W/(m·K), while water has a higher thermal conductivity of around 0.6 W/(m·K). The saline solution has slower heat transfer and requires a longer dissolution time. This occurs because ice melting necessitates heat absorption, and a larger ice weight results in more heat absorption, thus requiring a longer duration for complete ice melting. Furthermore, the desorption of ice in the presence of air is influenced by factors such as contact with the coated surface, ice volume, and gravitational force.
The desorption time varies depending on the type of icing solution: tap water > deionized water > 5 wt% NaCl of control subjects > 5 wt% NaCl. Minimal difference is observed in the desorption time between tap water and deionized water. In the control group representing saline solution without an organosilicon resin coating, steel conductivity was significantly higher than that of resin, the saline solution has a lower melting point. When absorbing similar amounts of heat at the same temperature and duration, the saline solution tends to desorb.
In contrast, the desorption time of 5 wt% NaCl on organosilicone resin is shorter than that on bare tinplate. The main reason was the low surface tension of the silicone resin, resulting in a relatively low adhesion between the coating and the ice. Therefore, silicone resin coatings have good anti-icing properties.

3.3.3. Theoretical Calculation of Icing Time

Assumptions in calculating freezing time on smooth surfaces are as follows:
(a)
The law of conservation of energy governs heat transfer and exchange, with no heat loss considered.
(b)
The contact area between the liquid and coating is assumed to be roughly circular, and the influence of gravity is disregarded.
(c)
Heat transfer beyond the liquid and substrate is not considered.
(1)
The amount of heat that needs to be given off/absorbed when water freezes/ice melts:
Q s e n s i b l e d = ( c w a t e r T 1 + c i c e T 2 ) × m
Q s e n s i b i e d : the amount of heat given off or absorbed by the water;
Specific heat capacity of water: c w a t e r = 4.2 × 10 3   J ( K g · ) ;
Specific heat capacity of ice: c i c e = 2.1 × 10 3   J ( K g · ) ;
m : the mass of water, Kg;
T 1 = T 1 0 : the temperature at which the water changes;
T 2 = 0 T 2 : the temperature at which the ice changes.
When the phase change occurs, the heat of solidification of water needs to be considered. The latent heat of solidification of water at standard atmospheric pressure is 79.6 kcal/Kg, which is equivalent to 333.53 kJ/Kg when converted using the conversion factor of 1 kcal/Kg = 4.1816 kilojoules (kJ). Hence:
Q l a t e n t e d = 79.6 × 4.1816 = 332.86   J / g
Q p h a s e c h a n g e d = Q l a t e n t e d × m × 1000
Q = Q p h a s e c h a n g e d + Q s e n s i b i e d
(2)
The heat transfer rate equation is:
q = k A T
q : the heat transfer rate, W;
k : the heat transfer coefficient, which is generally 0.2~0.5 W/(m2·K) for resin;
A: the contact area between the liquid and the coating, m2;
T = T 1 T 2 : the temperature changes.
(3)
Icing time
Assuming that the tinplate is placed in the T2 environment from the T1 environment, substituting the data gives:
t = ( c w a t e r T 1 c i c e T 2 ) × m + Q l a t e n t e d × m × 1000 k A ( T 1 T 2 ) = ( 4200 T 1 2100 T 2 ) + 332860 k A ( T 1 T 2 ) × m
The results indicate that the icing time is directly proportional to the mass of the liquid and inversely proportional to the contact area when the temperatures are fixed. This suggests that a larger contact angle leads to a longer delayed icing time and a better anti-icing effect. And as we have observed experimentally, as the amount of icing increases, so does the freezing time.

3.4. Corrosion Resistance

3.4.1. Saltwater Resistance and Salt Spray Resistance

The prepared coatings were placed in 3.5 wt% NaCl solution and salt spray chamber for testing. The corrosion morphology is shown in Figure 10 at different times.
It is well known that steel exposed directly to 3.5 wt% NaCl will rust easily. Comparing the salt water resistance of coatings from Figure 10a, it can be found that with the extension of time, the coating is damaged, local corrosion occurs, and the corrosion area increases. The degree of corrosion is 80 days > 45 days > 15 days.
From Figure 10b through the salt spray resistance test, it was found that the coating remained in good condition within 72 h, and no corrosion occurred. When the experiment increased to 168 h, a small number of rust spots appeared on the surface of the coating. This is likely due to minor defects on the surface of the silicon resin coating, facilitating chloride penetration into the substrate. After 240 h, the rust spots expanded and the corrosion area increased. When the salt spray resistance time was increased to 360 h, a large area of corrosion occurred. That means the anti-corrosion property of the coating was declining.
It can be found that the silicon coating demonstrates a satisfactory level of corrosion resistance against 3.5 wt% NaCl and performs exceptionally well in the neutral salt spray resistance test.

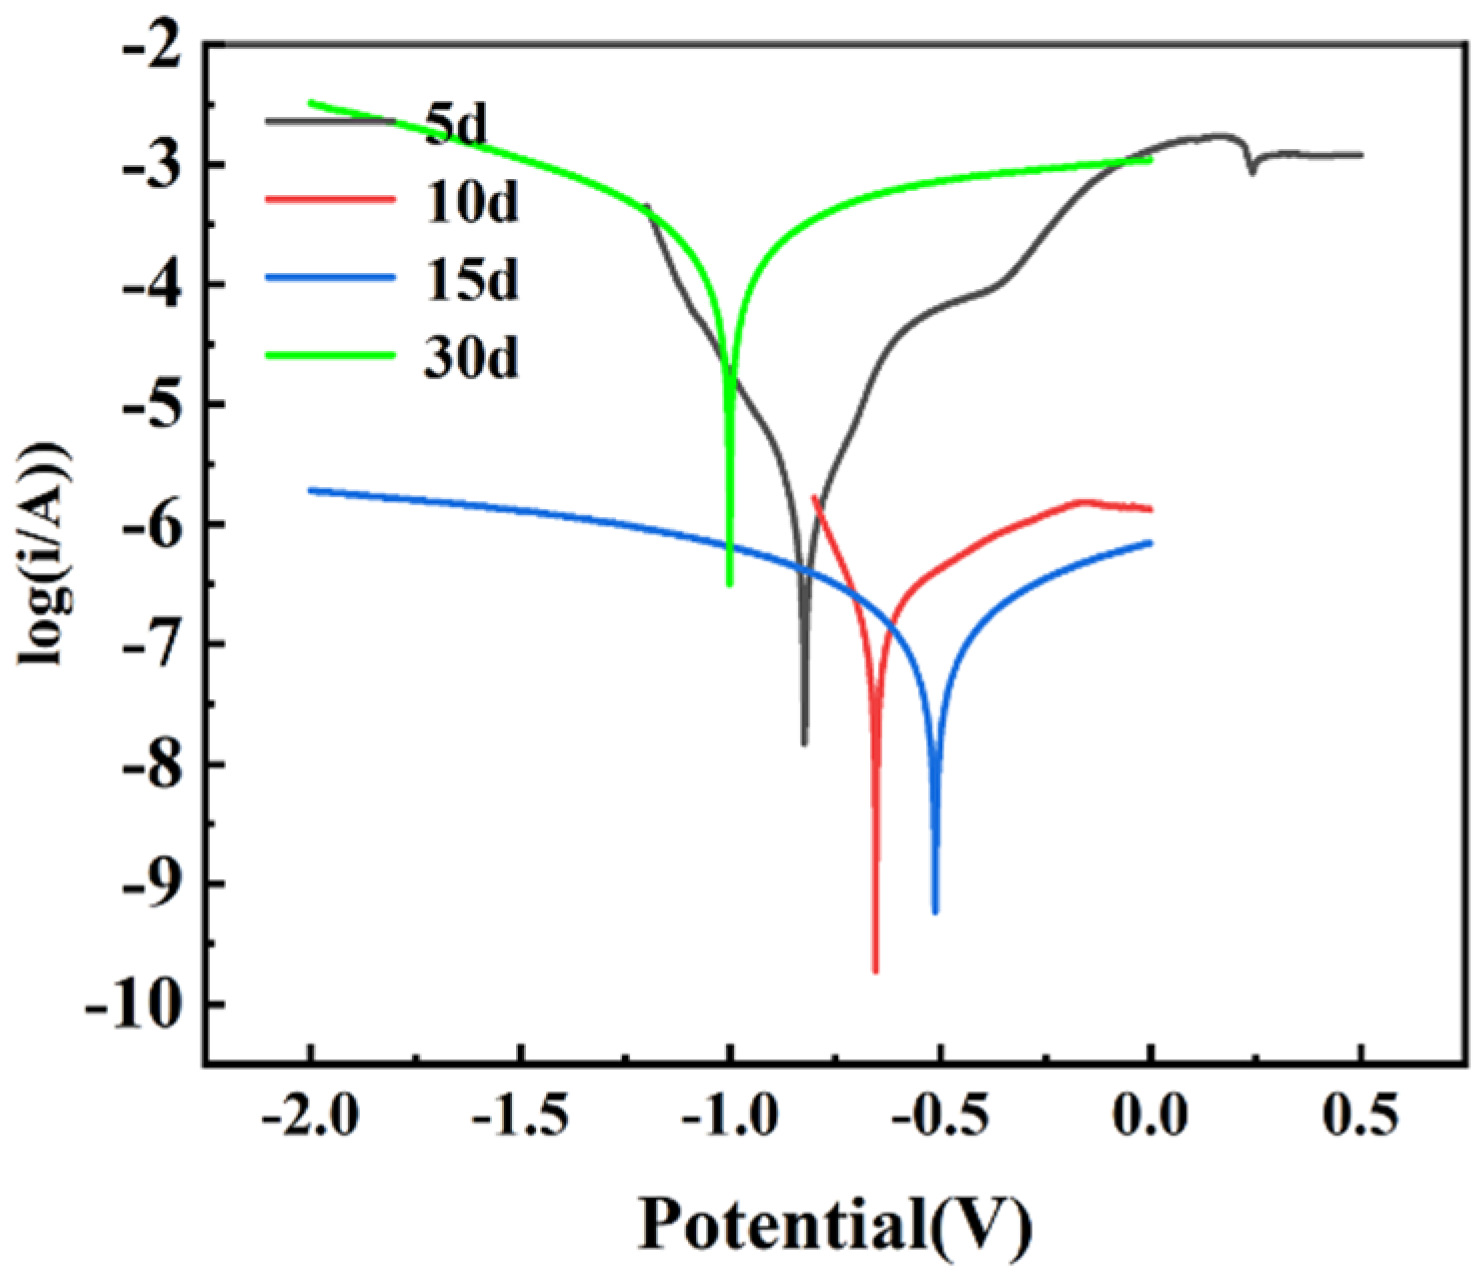
3.4.2. Tafel Polarization Curves

Polarization curves are commonly used to evaluate the corrosion resistance of coatings. A tinplate with a coating was submerged in a 3.5 wt% NaCl solution for varying durations, and parameters such as were measured. Figure 11 depicts the dynamic potentiodynamic polarization curves for silicone resin coatings immersed in 3.5 wt% brine at various time intervals.
Table 3 presents the Tafel electrochemical measurements obtained through simulations using the dynamic potentiodynamic polarization curves.
Figure 11 and Table 3 depict the changes in corrosion current and corrosion potential for the silicone resin coating over time. As time advances, the corrosion potential steadily increases, the corrosion current gradually decreases, and the polarization resistance initially shows a significant rise before decreasing. These patterns suggest that while corrosive ions may penetrate the coating, its highly crosslinked structure maintains a robust protective barrier. In general, a lower icorr and a higher Ecorr indicate better anti-corrosion properties. Specifically, the corrosion current dropped to as low as 0.1503 μA/cm², and the corrosion potential value reached −0.512 V.

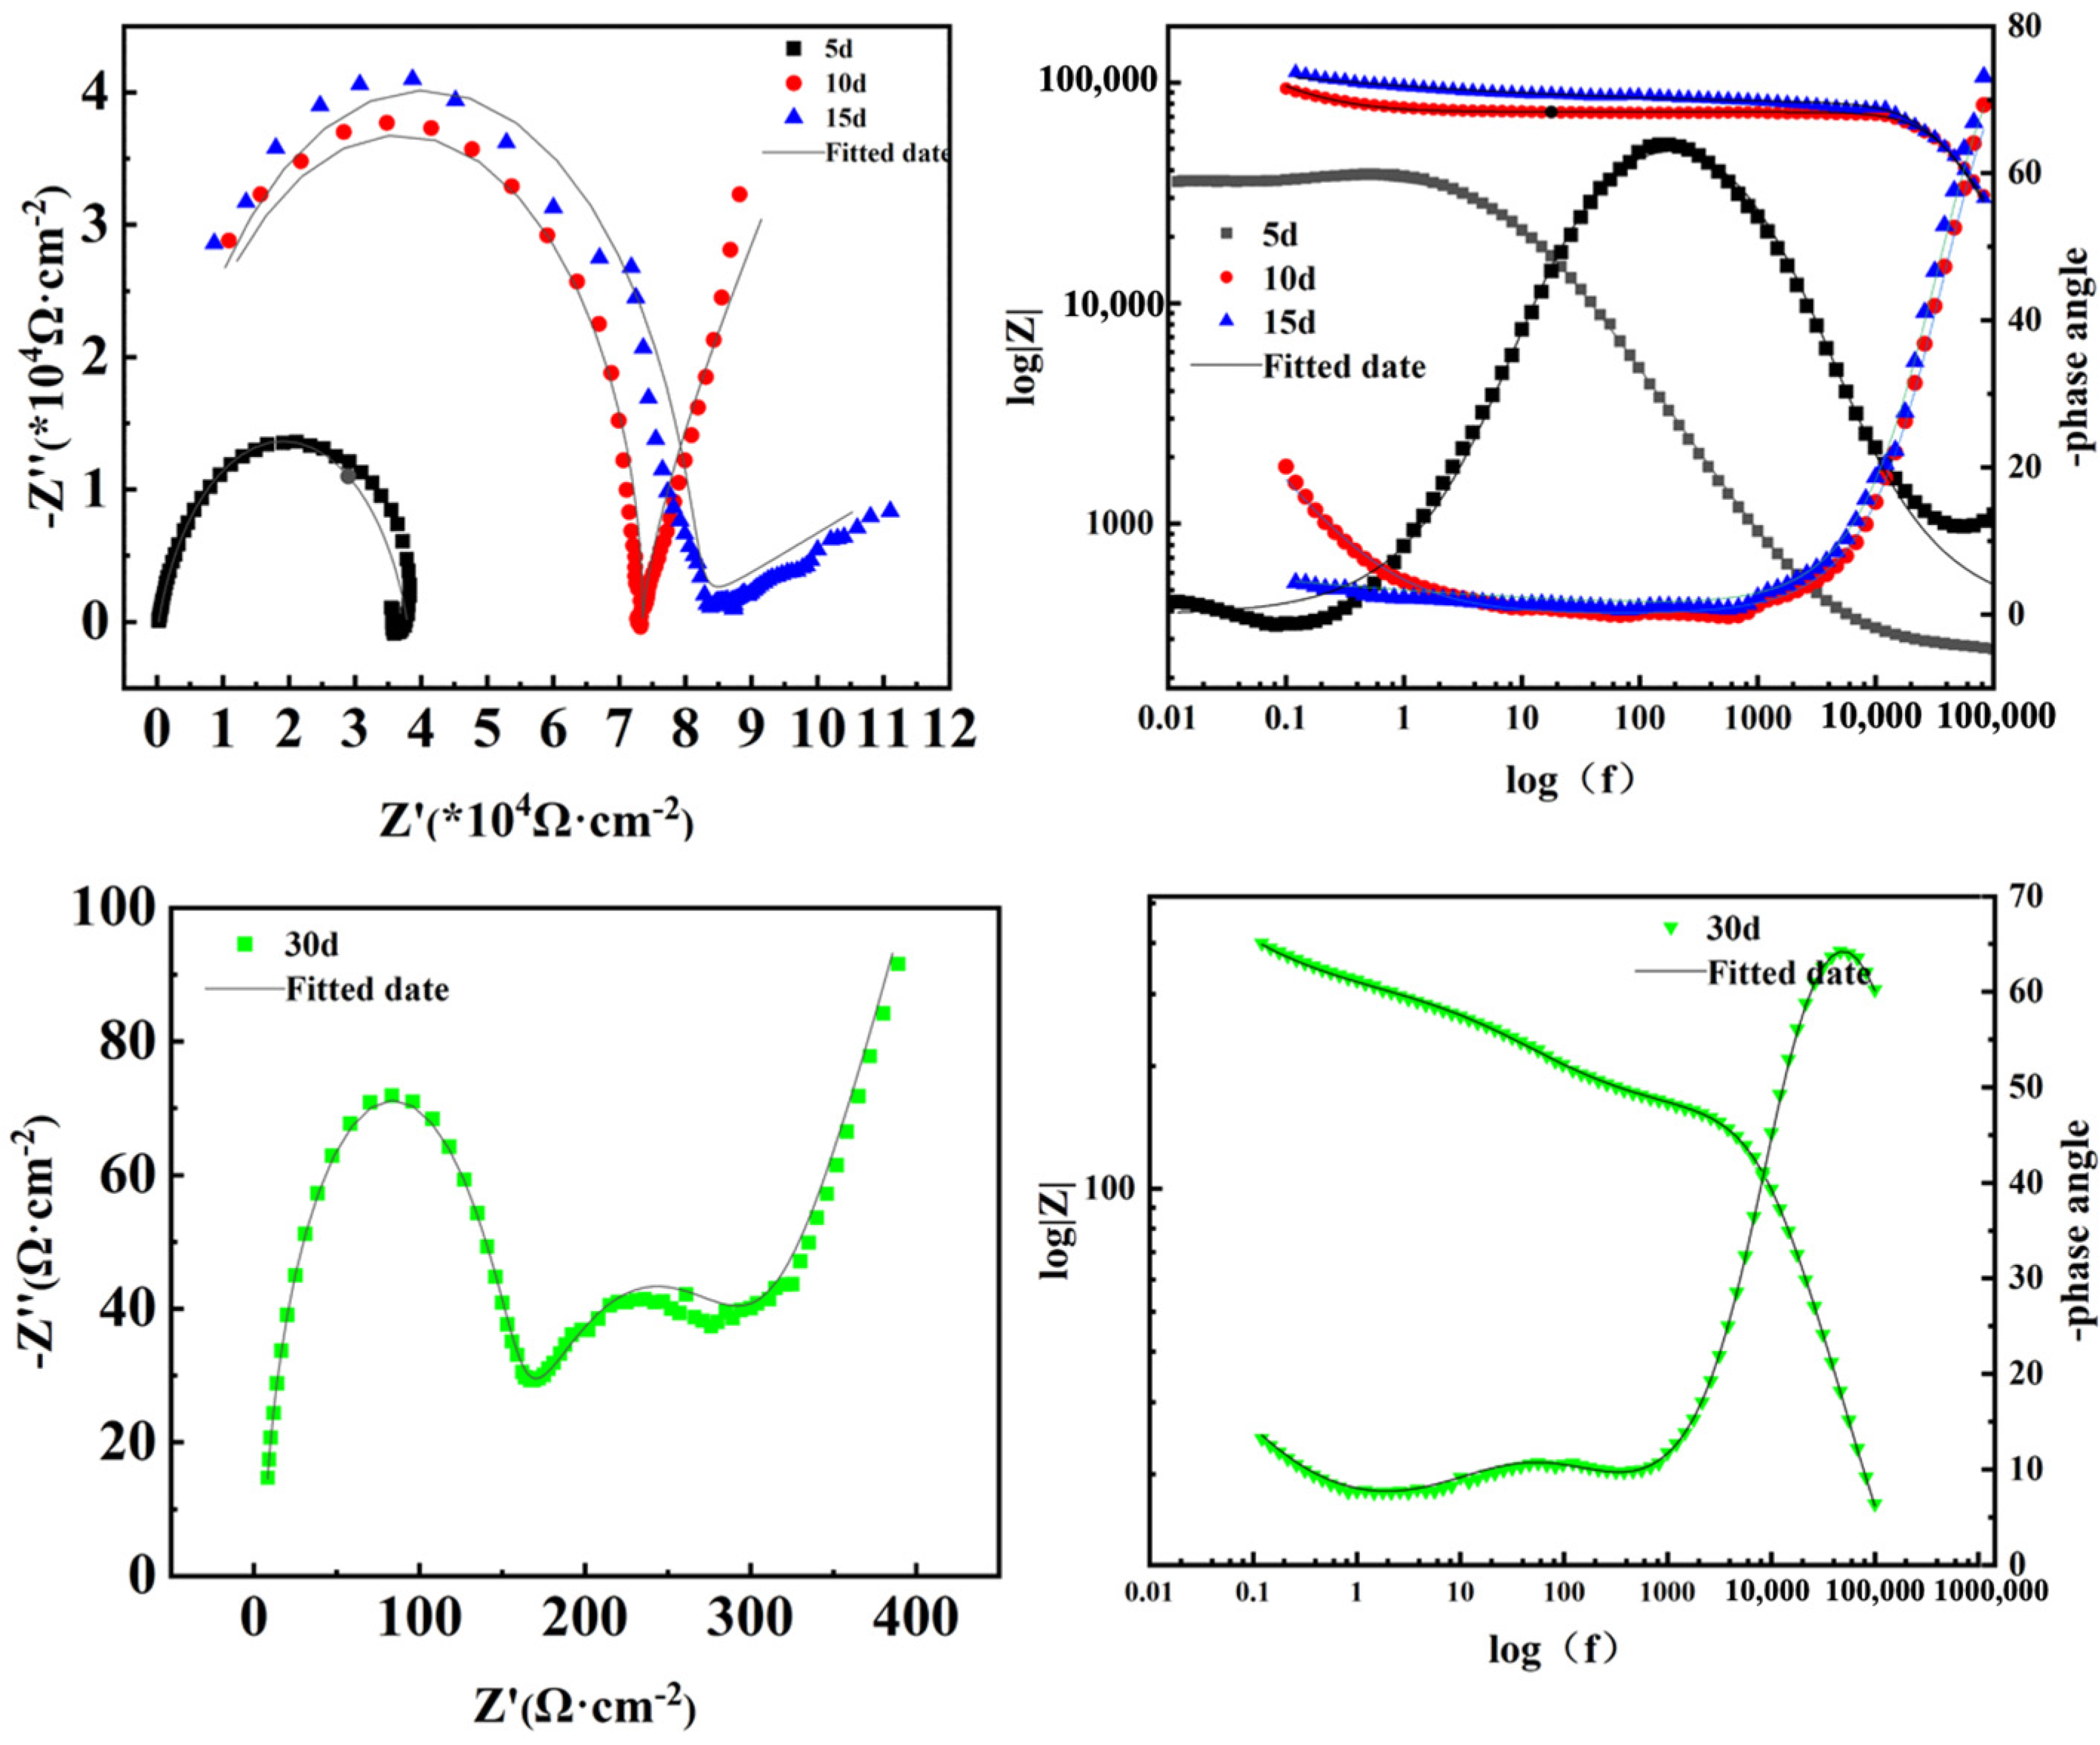
3.4.3. Electrochemical Impedance Spectra

The electrochemical impedance spectra of the same silicone resin coating during different immersion periods are presented in Figure 12.
The equivalent circuit is a model utilized for simulating the behavior of a coating in a corrosive medium to assess the corrosion process. The parameters derived from electrochemical tests conducted on the coating were fitted to obtain Nyquist plots, while Bode modulus impedance and phase angle plots were also generated. The fitted curves resulting from the electrochemical tests, along with the derived data using the equivalent circuit are depicted in Figure 12. The parameters of the fitted equivalent circuit can be found in Table 4. The correlation between the capacitive arc radius in the Nyquist diagram and the corrosion protection of the coating is demonstrated, indicating that a larger radius corresponds to enhanced corrosion resistance [32,33].
With increasing immersion time of the coating in the corrosive medium, the Nyquist diagram illustrates the penetration of corrosive ions into the coating. This penetration leads to the appearance of the Warburg diffusion coefficient and the emergence of the Warburg impedance. Consequently, the capacitive arc radius increases, which can be attributed to the barrier effect and diffusion obstruction exerted by the coating on the ions.
At this stage, the Bode modulus plot demonstrates that as the duration of immersion increases, the absolute value of impedance (|Z|) shows high values at both high and low to mid frequencies. However, for a 5-day immersion period, the |Z| values decrease at mid and high frequencies. The corresponding phase angle diagram reveals the presence of two time constants at 10 d and 15 d. Additionally, at high frequency, the phase angle reaches nearly 80°, indicating the initiation of chemical reactions between corrosive ions and the interface of the substrate and coating. Nevertheless, there is also a significant degree of cross-linking at the interface of the resin and the substrate during this time. This cross-linking is facilitated by the reaction between surface groups on the substrate (-OH) and Si-OH in the resin, resulting in a tightly bonded substrate. This phenomenon is the result of the tight chemical bond formed through the reaction of -OH on the substrate surface with Si-OH in the resin [34], leading to the higher impedance observed.
The aforementioned enhanced protection is attributed to the structural properties of the highly crosslinked organic–inorganic network. This network exhibits a low diffusion rate of electrolyte through the coating, thereby limiting the substrate’s corrosion. Additionally, the inorganic component enhances the adhesion between the metal and the coating, providing a strong adhesion layer between the metal substrate and the organic coating [35].
It has been discovered that the utilization of inorganic–organic hybrid thin film coatings can significantly enhance the corrosion resistance of stainless and galvanized steels. When employing sol-gel hybridized coatings, initial strong van der Waals bonds form between the film and the metal surface, which subsequently transform into stable covalent bonds during the film drying stage [28]. However, the exclusive use of inorganic coatings or a high proportion of inorganic components presents two disadvantages in terms of corrosion resistance. First, it becomes challenging to achieve thick coatings without causing cracking, and there is a high likelihood of crack formation [35]. Second, purely inorganic films tend to possess pores [36]. These drawbacks limit the effectiveness of the pure inorganic component as a physical barrier, rendering it insufficient for providing adequate corrosion protection. In this experimental study, a resin was developed that falls within the category of semi-organic and semi-inorganic coatings. This type of coating incorporates suitable organic groups into the inorganic network, thereby reducing the permeability of the inorganic coating, forming a denser film, and minimizing coating porosity [37]. Consequently, the steel substrate becomes less vulnerable to localized corrosion resulting from debonding and delamination processes [31], as evidenced by the remarkable increase in charge transfer resistance (Rct) as shown in Table 4. Additionally, the lower surface tension exhibited by organic groups, in comparison to inorganic oxides, serves as an additional barrier against the penetration of water molecules.
In order to study the coating anti-corrosion mechanism in depth, the data in Figure 12 were fitted to produce the equivalent circuit diagram in Figure 13, in which Rs, Rf, and Rct are the solution resistance, film resistance, and charge transfer resistance, respectively, and CPEf, CPEdl, and Zw represent the film capacitance, the bilayer capacitance, and the Warburg diffusion coefficient, respectively. The equivalent circuit is to replace the coating and solution in the actual corrosion process with electronic component resistors and wires, etc. The electron transfer path in the corrosion process is equivalent to the circuit, and the entire process is simplified in a schematic diagram on the paper. And the “a” and the “b” in Figure 13 represent different corrosion stages, which means different corrosion routes. In the figure, “a” represents the corrosion route in the middle and later stages of corrosion, corresponding to the corrosion of 5d, 10d, and 15d in Figure 13. Panel “b” represents the corrosion route in which the coating has basically failed in the later stages of corrosion, corresponding to the corrosion of 30 d in Figure 13.
From Table 4, with increasing immersion time, both Rf and Rct values increase. The highest value of Rct reaches 8.538 × 10⁸ Ω·cm2, which is attributed to the enhanced interception of ions by the combination of inorganic and organic components in the coatings. It is also likely that a passivation layer forms at the interface due to the presence of a small amount of Si-OH in the resin, which reacts with Fe2+ to generate Fe(OH)2. Conversely, as the immersion time increases, the Rct value of the coating decreases. This decrease in Rct value provides evidence of the continuous destruction of the passivation layer during the corrosion process. Prolonged immersion time causes the activity of aggressive ions (e.g., chlorides), leading to the rupture of the thin passivation film and exposure of the coating-substrate interface. The corrosion layer partially hinders charge transfer.

3.5. Anti-Corrosion Mechanism

The experimental findings validate the outstanding anti-corrosion efficacy of the silicone resin coating developed in this study. During the immersion process, Rp and Rf have high values, indicating that the highly cross-linked structure of silicone resin and organic–inorganic hybrid form a strong physical barrier, effectively blocking the penetration of corrosive media. Unlike traditional organic–inorganic co-hybridization methods, this experiment’s technique successfully addresses issues related to phase separation and degradation. The process of siloxane cross-linking and branching yields a dense hybrid network that restricts the electrolyte’s proximity to the substrate metal, establishing an efficient diffusion barrier against corrosion attack [35].
As the immersion enters the middle and late stages, the Rf value decreases, indicating that the corrosive medium has gradually penetrated the coating and reached the base surface of the coating and the substrate. At this time, the Rct value increases sharply, indicating that a dense high-density silica layer is formed at the base–medium interface, which hinders charge and ion transfer. Moreover, the silica-dense layer effectively fills cavity defects, enhancing its protective capabilities. During the whole test process, this coating shows good anti-corrosion performance, and the salt spray resistance of the single coating is more than 168 h. The silicone resin, as an organic–inorganic hybrid coating, uniformly distributes inorganic and organic components within its structure, ensuring reliable substrate protection and significantly boosting anti-corrosion performance.
The film thickness of silicone resin prepared in this experiment is 50 μm, R/Si value is 1.52, and it has good toughness, ice resistance, and corrosion resistance. We know that increasing the concentration of polymer or organic components or increasing the coating thickness can effectively limit the diffusion of corrosive substances or media to the coating metal interface [38], but it may affect the overall physical properties of the coating, such as hardness, etc. However, too high proportion of inorganic components will reduce toughness, so the proportion of organic and inorganic components and coating thickness, corrosion protection relationship needs to be balanced.

4. Conclusions

In this study, a silicone resin with R/Si value of about 1.52 was synthesized by using four kinds of silicone monomers as raw materials. Several analyses, including FTIR, GPC, TGA, 1H-NMR, and 29Si-NMR confirmed the successful synthesis of silicone resin molecules. These molecules exhibited favorable heat resistance. The degradation temperature range arrived at 500 °C.
The prepared silicone resin coatings displayed high grid adhesion, gloss degree, good flexibility, and weather resistance.
The silicone resin coating showed the longest icing time and the lowest desorption time with 5 wt% NaCl. This means that silicon coatings prevent ice adhesion to the substrate.
The silicone resin coatings demonstrated outstanding corrosion resistance, as evidenced by the 3.5 wt% NaCl solution immersion test, salt spray resistance test, and EIS. The corrosion current dropped to as low as 0.1503 μA/cm², and the corrosion potential value reached −0.512 V, Rct reached 8.538 × 10⁸ Ω·cm2 when exposed to a 3.5 wt% NaCl solution.

Author Contributions

Conceptualization, H.W. (Haopeng Wang) and S.W.; methodology, H.W. (Haopeng Wang) and J.W.; visualization, H.W. (Haopeng Wang); validation, J.W.; formal analysis, S.J. and J.S.; data curation, S.D. and H.W. (Hui Wu); writing—original draft preparation, H.W. (Haopeng Wang); writing—review and editing, H.W. (Haopeng Wang) and J.W.; supervision, S.W.; project administration, S.W., H.W. (Haopeng Wang) and J.W. contributed equally to this paper. All authors have read and agreed to the published version of the manuscript.

Funding

This research received no external funding.

Institutional Review Board Statement

Not applicable.

Informed Consent Statement

Not applicable.

Data Availability Statement

Data are contained within the article.

Acknowledgments

The research was supported by Natural Science Foundation of Shanghai (No. 23ZR1425700) and the Special Projects of the Ministry of Science and Technology Key R&D Program (No. 2018YFC1801503).

Conflicts of Interest

The authors declare no conflict of interest.

References

  1. Rajagopal, S.; Zhang, P. How widespread is the usage of the Northern Sea Route as a commercially viable shipping route? A statistical analysis of ship transits from 2011 to 2018 based on empirical data. Mar. Policy 2021, 125, 104300. [Google Scholar] [CrossRef]
  2. Biresselioglu, M.E.; Demir, M.H.; Solak, B.; Kayacan, A.; Altinci, S. Investigating the trends in arctic research: The increasing role of social sciences and humanities. Sci. Total Environ. 2020, 729, 139027. [Google Scholar] [CrossRef]
  3. Kondratenko, A.A.; Kujala, P.; Hirdaris, S.E. Holistic and sustainable design optimization of Arctic ships. Ocean. Eng. 2023, 275, 114095. [Google Scholar] [CrossRef]
  4. Vazirinasab, E.; Jafari, R.; Momen, G. Application of superhydrophobic coatings as a corrosion barrier: A review. Surf. Coat. Technol. 2018, 341, 40–56. [Google Scholar] [CrossRef]
  5. Han, S.; Meng, Q.; Xing, K.; Araby, S.; Yu, Y.; Mouritz, A.; Ma, J. Epoxy/graphene film for lifecycle self-sensing and multifunctional applications. Compos. Sci. Technol. 2020, 198, 108312. [Google Scholar] [CrossRef]
  6. Nardeli, J.V.; Fugivara, C.S.; Taryba, M.; Montemor, M.F.; Benedetti, A.V. Self-healing ability based on hydrogen bonds in organic coatings for corrosion protection of AA1200. Corros. Sci. 2020, 177, 108984. [Google Scholar] [CrossRef]
  7. Xie, C.; Jia, Y.; Xue, M.; Yin, Z.; Luo, Y.; Hong, Z.; Liu, W. Anti-corrosion and self-healing behaviors of waterborne polyurethane composite coatings enhanced via chitosan-modified graphene oxide and phosphate intercalated hydrotalcite. Prog. Org. Coat. 2022, 168, 106881. [Google Scholar] [CrossRef]
  8. Li, H.; Qiang, Y.; Zhao, W.; Zhang, S. 2-Mercaptobenzimidazole-inbuilt metal-organic-frameworks modified graphene oxide towards intelligent and excellent anti-corrosion coating. Corros. Sci. 2021, 191, 109715. [Google Scholar] [CrossRef]
  9. Yang, W.J.; Neoh, K.G.; Kang, E.T.; Teo, S.L.M.; Rittschof, D. Polymer brush coatings for combating marine biofouling. Prog. Polym. Sci. 2014, 39, 1017–1042. [Google Scholar] [CrossRef]
  10. Yang, H.; Qiu, S.; Lu, Y.F.; Liu, Z.X.; Lu, F. Experimental Study on Corrosion Prevention of a Multilayer Coating System. Adv. Mater. Res. 2014, 881–883, 1307–1311. [Google Scholar] [CrossRef]
  11. Krishnan, A.; Krishnan, A.V.; Ajith, A.; Shibli, S. Influence of materials and fabrication strategies in tailoring the anticorrosive property of superhydrophobic coatings. Surf. Interfaces 2021, 25, 26. [Google Scholar] [CrossRef]
  12. Wang, X.; Zhang, X.; Caldona, E.B.; Leng, W.; Street, J.; Wang, G.; Zhang, Z. Anticorrosive epoxy coatings containing ultrafine bamboo char and zinc particles. J. Environ. Chem. Eng. 2021, 9, 105707. [Google Scholar] [CrossRef]
  13. Yue, Q.X.; Wu, L.F.; Lv, J.; Wang, A.M.; Ding, R.; Wang, Y.Y.; Yue, L.; Gao, W.; Li, X.L.; Li, X.Y.; et al. Study on anti-corrosion performance and mechanism of epoxy coatings based on basalt flake loaded aniline trimer. Colloid Interface Sci. Commun. 2021, 45, 100505. [Google Scholar] [CrossRef]
  14. Ding, R.; Zheng, Y.; Yu, H.; Li, W.; Wang, X.; Gui, T. Study of water permeation dynamics and anti-corrosion mechanism of graphene/zinc coatings. J. Alloys Compd. 2018, 748, 481–495. [Google Scholar] [CrossRef]
  15. Nguyen, T.B.; Park, S.; Lim, H. Effects of morphology parameters on anti-icing performance in superhydrophobic surfaces. Appl. Surf. Sci. 2018, 435, 585–591. [Google Scholar] [CrossRef]
  16. Wang, L.; Gong, Q.; Zhan, S.; Jiang, L.; Zheng, Y. Robust Anti-Icing Performance of a Flexible Superhydrophobic Surface. Adv. Mater. 2016, 28, 7729–7735. [Google Scholar] [CrossRef]
  17. Heydari, G.; Thormann, E.; Järn, M.; Tyrode, E.; Claesson, P.M. Hydrophobic Surfaces: Topography Effects on Wetting by Supercooled Water and Freezing Delay. J. Phys. Chem. C 2013, 117, 21752–21762. [Google Scholar] [CrossRef]
  18. Xie, H.; Wei, J.; Duan, S.; Zhu, Q.; Yang, Y.; Chen, K.; Zhang, J.; Li, L.; Zhang, J. Non-fluorinated and durable photothermal superhydrophobic coatings based on attapulgite nanorods for efficient anti-icing and deicing. Chem. Eng. J. 2022, 428, 132585. [Google Scholar] [CrossRef]
  19. Kuo, C.F.J.; Chen, J.B. Study on the synthesis and application of silicone resin containing phenyl group. J. Sol-Gel Sci. Technol. 2015, 76, 66–73. [Google Scholar] [CrossRef]
  20. Wang, D.; Bierwagen, G.P. Sol–gel coatings on metals for corrosion protection. Prog. Org. Coat. 2009, 64, 327–338. [Google Scholar] [CrossRef]
  21. Sarmento, V.; Schiavetto, M.; Hammer, P.; Benedetti, A.; Fugivara, C.; Suegama, P.; Pulcinelli, S.; Santilli, C. Corrosion protection of stainless steel by polysiloxane hybrid coatings prepared using the sol–gel process. Surf. Coat. Technol. 2010, 204, 2689–2701. [Google Scholar] [CrossRef]
  22. Dvornic, P.R.; Lenz, R.W. Exactly alternating silarylene–siloxane polymers. II. The condensation polymerization of arylenedisilanols and bisureidosilanes. J. Polym.Sci. Polym. Chem. Ed. 1982, 20, 951–966. [Google Scholar]
  23. Huang, W.; Huang, Y.; Yunzhao, Y.U. Synthesis of MQ silicone resins through hydrolytic condensation of ethyl polysilicate and hexamethyldisiloxane. J. Appl. Polym. Sci. 1998, 70, 1753–1767. [Google Scholar] [CrossRef]
  24. Kim, W.S.; Kim, K.S.; Eo, Y.J.; Yoon, K.B.; Bae, B.S. Synthesis of fluorinated hybrid material for UV embossing of a large core optical waveguide structure. J. Mater. Chem. 2005, 15, 465–479. [Google Scholar] [CrossRef]
  25. Gokulakrishnan, N.; Karbowiak, T.; Bellat, J.P.; Vonna, L.; Saada, M.-A.; Paillaud, J.L.; Soulard, M.; Patarin, J.; Parmentier, J. Improved hydrophobicity of inorganic–organic hybrid mesoporous silica with cage-like pores. Colloids Surf. A Physicochem. Eng. Asp. 2013, 421, 34–43. [Google Scholar] [CrossRef]
  26. Chu, H.H.; Chiang, W.L.; Chuang, K.S. Viscoelastic and adhesive properties of PMMA-b-PtBA with tackifier. Int. J. Adhes. Adhes. 2012, 38, 89–94. [Google Scholar] [CrossRef]
  27. Menaa, B.; Takahashi, M.; Tokuda, Y.; Yoko, T. High dispersion and fluorescence of anthracene doped in polyphenylsiloxane films. J. Sol-Gel Sci. Technol. 2006, 39, 185–194. [Google Scholar] [CrossRef]
  28. Ono, S.; Tsuge, H.; Nishi, Y.; Hirano, S.-I. Improvement of Corrosion Resistance of Metals by an Environmentally Friendly Silica Coating Method. J. Sol-Gel Sci. Technol. 2004, 29, 147–153. [Google Scholar] [CrossRef]
  29. Kashiwagi, T.; Morgan, A.B.; Antonucci, J.M.; VanLandingham, M.R.; Harris, R.H., Jr.; Awad, W.H.; Shields, J.R. Thermal and flammability properties of a silica–poly(methylmethacrylate) nanocomposite. J. Appl. Polym. Sci. 2003, 89, 2072–2078. [Google Scholar] [CrossRef]
  30. Chang, T.C.; Wang, Y.T.; Hong, Y.S.; Chiu, Y.S. Organic–inorganic hybrid materials. V. Dynamics and degradation of poly(methyl methacrylate) silica hybrids. J. Polym. Sci. Part A Polym. Chem. 2000, 38, 1972–1980. [Google Scholar] [CrossRef]
  31. Kuo, C.; Chen, J.B.; Shih, C.Y.; Huang, C.Y. Silicone resin synthesized by tetraethoxysilane and chlorotrimethylsilane through hydrolysis–condensation reaction. J. Appl. Polym. Sci. 2014, 131, 169–172. [Google Scholar] [CrossRef]
  32. Mehdizade, M.; Eivani, A.R.; Soltanieh, M. Effects of reduced surface grain structure and improved particle distribution on pitting corrosion of AA6063 aluminum alloy. J. Alloys Compd. 2020, 838, 155464. [Google Scholar] [CrossRef]
  33. Silva, C.L.; Soares, R.B.; Pereira, P.H.R.; Figueiredo, R.B.; Lins, V.F.; Langdon, T.G. The Effect of High-Pressure Torsion on Microstructure, Hardness and Corrosion Behavior for Pure Magnesium and Different Magnesium Alloys. Adv. Eng. Mater. 2019, 21, 1801081. [Google Scholar] [CrossRef]
  34. Zheng, S.X.; Li, J.H. Inorganic-organic sol gel hybrid coatings for corrosion protection of metals. J. Sol-Gel Sci. Technol. 2010, 54, 174–187. [Google Scholar] [CrossRef]
  35. Brinker, C.J.; Scherer, C.W. Sol-Gel Science: The Physics and Chemistry of Sol-Gel Processing; Academic press: Cambridge, MA, USA, 1990. [Google Scholar]
  36. de Damborenea, J.; Pellegri, N.; de Sanctis, O.; Durán, A. Electrochemical behaviour of SiO2 sol-gel coatings on stainless steel. J. Sol-Gel Sci. Technol. 1995, 4, 239–244. [Google Scholar] [CrossRef]
  37. Park, S.S.; Mackenzie, J.D. Microstructure Effects in Multidipped Tin Oxide Films. J. Am. Ceram. Soc. 1995, 78, 2669–2672. [Google Scholar] [CrossRef]
  38. Menaa, B.; Takahashi, M.; Tokuda, Y.; Yoko, T. Preparation and properties of polyphenylsiloxane-based hybrid glass films obtained from a non-aqueous coating sol via a single-step dip-coating. Opt. Mater. 2007, 29, 806–813. [Google Scholar] [CrossRef]
Figure 1. Schematic diagram of hydrolysis reaction regarding monomer.
Coatings 14 00699 g001
Figure 2. Diagram of hydrolysis product reaction.
Coatings 14 00699 g002
Figure 3. FTIR spectra of DMDPS, MTMS, and MPSR.
Coatings 14 00699 g003
Figure 4. 1H-NMR spectrum of silicone resin.
Coatings 14 00699 g004
Figure 5. 29Si-NMR spectrum of silicone resin.
Coatings 14 00699 g005
Figure 6. Elution time and molecular weight distribution of organosilicon prepolymers.
Coatings 14 00699 g006
Figure 7. Thermogravimetric curves of silicone resin prepolymers and their differential curves.
Coatings 14 00699 g007
Figure 8. Relationship between freezing amount and freezing time at different temperatures.
Coatings 14 00699 g008
Figure 9. Time of desorption in air with different amounts of icing.
Coatings 14 00699 g009
Figure 10. Corrosion resistance of the coatings to 3.5 wt% NaCl solution (a) and salt spray (b).
Coatings 14 00699 g010
Figure 11. The potentiodynamic polarization curves of silicone resin coatings immersed in 3.5 wt% brine for different times.
Coatings 14 00699 g011
Figure 12. Electrochemical impedance spectra of silicone resin coatings with immersion time.
Coatings 14 00699 g012
Figure 13. The proposed equivalent electrical circuit according to the impedance data.
Coatings 14 00699 g013
Table 1. Molecular weight results of organosilicon prepolymers.
NameMnMwMpMzMz+1Mw/MnMz/MwMz+1/Mw
Numeric value528867625138520501.641.602.36
Table 2. Basic properties of anti-corrosion and anti-ice coating.
SamplesPerformance
Coating thickness (μm)50 ± 10
Pendulum hardness (s)130 ± 5
Pencil hardness3H
Gloss degree (GU)130 ± 5
Grid adhesion0
Pull-out adhesion (MPa)0.67 ± 0.1
Impact strength (Kg·cm)50
High and low temperature alternating test
(−30 °C, 3 h~50 °C, 3 h, 50% humidity/times)
≥40
Table 3. Tafel electrochemical measurement data.
SamplesEcorr (V)Icorr (μA/cm2)Rp (Ω)ba−bc
Days5−0.8241.114027,951.67.6256.333
10−0.6540.1503246,075.43.7368.022
15−0.5120.605073,141.55.6194.206
30−1.00283.6400527.74.8315.019
Ecorr, corrosion potentials, icorr, corrosion currents, Rp, polarization resistances, ba, anodic slopes and bc, cathodic slopes.
Table 4. Electrochemical impedance spectroscopy data of the coating.
SamplesRs
(Ω·cm2)
CPEf
−1 s−ncm−2)
Rf
(Ω·cm2)
CPEdl
−1 s−ncm−2)
Rct
(Ω·cm2)
Zw
−1 s5 cm−2)
Time5 d268.81.121 × 10−637,5405.556 × 10−25.038 × 1051.18 × 10−10
10 d0.015.906 × 10−1173,2603.89 × 10−58.538 × 1081.148 × 10−14
15 d0.186.256 × 10−1177,5303.634 × 10−51.11 × 1072.66 × 10−7
30 d5.7792.048 × 10−61503.005 × 10−4156.19.011 × 10−3
Disclaimer/Publisher’s Note: The statements, opinions and data contained in all publications are solely those of the individual author(s) and contributor(s) and not of MDPI and/or the editor(s). MDPI and/or the editor(s) disclaim responsibility for any injury to people or property resulting from any ideas, methods, instructions or products referred to in the content.

