Article

Dispersed CeO2 Nanorods with Low-Speed Mixing for Mechanical Properties Promotion of PTA Steel Coatings

1
State Key Laboratory of Baiyunobo Rare Earth Resource Researches and Comprehensive Utilization, Baotou Research Institute of Rare Earths, Baotou 014030, China
2
School of Materials Science and Engineering, Inner Mongolia University of Technology, Hohhot 010051, China
3
Shanxi Taiyuan Stainless Steel Co., Ltd., Taiyuan 030003, China
*
Authors to whom correspondence should be addressed.
These authors contributed equally to this work.
Coatings 2024, 14(6), 713; https://doi.org/10.3390/coatings14060713
Submission received: 25 April 2024 / Revised: 21 May 2024 / Accepted: 2 June 2024 / Published: 5 June 2024
(This article belongs to the Section Plasma Coatings, Surfaces & Interfaces)

Abstract

:
The plasma-transferred arc technology has been observed to induce preferential grain orientation in multiple directions, leading to nonuniform grain growth within the alloy coating material. The addition of nano-oxides can act as heterogeneous nucleation sites, reducing the preferred orientation of grains. In this study, a low-speed mixing method was employed to coat highly dispersed CeO2 nanorods (CNRs) onto the surface of 14Cr2NiSiVMn alloy powder particles. The aim was to analyze the influence of dispersed CNRs on grain growth orientation in different directions and the refinement and heterogeneous nucleation effect of CNR additives. The addition of 0.5 wt.% CNRs resulted in the refinement of dendritic grains along both the perpendicular and parallel directions to the coating cladding direction, leading to the formation of more uniform equiaxed crystals. The combination of Ce with Si and V elements formed submicron particles, which promoted grain nucleation and reduced defects in the coating. Consequently, the mechanical performance of the sample significantly improved. In the deposition direction, there was a notable improvement in microhardness (20.4%), tensile strength (97.6%), and elongation (59.0%). In the perpendicular deposition direction, the tensile strength increased by 88.1%, and the elongation increased by 33.9%. Additionally, the weight loss due to wear decreased by 44.2%, and the relative wear resistance improved by 79.3%.

1. Introduction

Alloy coatings have been increasingly employed for resistance to wear and corrosion and as tough materials for enhancing the durability of components exposed to extremely corrosive and abrasive environments. The methods to clad these alloy coatings have, hence, become the focus of numerous studies. Some of the cladding methods include Thermal spraying [1,2], Electroplating [3], Laser cladding [4,5], and Plasma-transferred arc (PTA) [6,7,8,9]. Among them, the PTA technique possesses characteristics such as high energy density, stable arc operation, and simple equipment operation [10]. These features result in alloy coatings with fine grain size, dense structure, high metallurgical bond strength, and excellent performance [11,12,13]. However, the rapid heating and solidification occurring during the PTA process may bring about the formation of distinct dendritic and columnar grain structures with directional growth along the deposition direction. This can affect the toughness properties in different grain texture directions [14]. Consequently, micro cracks and wear fragments may form on the coating during dry sliding, promoting a wear mechanism dominated by three-body wear, resulting in diminished wear resistance [15,16].
Hence, the enhancement of the mechanical performance of the coatings has assumed prime importance. The addition of uniformly dispersed rare earth nano oxides as nucleate particles, as well as the strengthening phase, has been shown to greatly enhance the strength and performance of steel components prepared through additive manufacturing and powder metallurgy [17,18,19,20,21].
For instance, the incorporation of La2O3 is advantageous in enhancing the microstructure of the Fe alloy coating specimen produced through PTA and improving its mechanical performance [21]. The addition of 1.2 wt.% lanthanum ions has been found to enhance the formation of a greater number of crystal nuclei, resulting in the simultaneous formation of a higher quantity of smaller grains. The smaller grain size restricts the growth of individual grains, resulting in a reduced growth rate [22,23]. The presence of 0.4 wt.% Y2O3 can refine crystal grain size, purify the coating, and improve grain morphology, resulting in improved coating hardness (22.4%) and wear resistance (25.8%) [18]. The reinforcement of heterogeneity nucleation is further improved by the formation of high melting substances resulting from the combination of Y3+ with other elements, such as Si. The addition of 2 wt.% nano CeO2 can lower the porosity and refined grain and enhance the solubility of solute elements in the Fe matrix [23,24]. The reason for this is that the surface tension and interfacial energy are decreased due to the partial dissolution of nano CeO2, leading to abundant nucleation sites and refined grain size [25]. However, an overabundance of rare earth nanoparticles can lead to the aggregation of impurities, resulting in the presence of gas bubbles and microcracks. This can easily generate voids and defects in the metallurgical bonding zone [18,19]. Dispersion is an essential prerequisite to enable rare earth nano-oxide to enter the Fe matrix and heterogeneous nucleation mechanisms, which then bring grain to be refined. Therefore, high-energy alloying techniques [26,27,28] have been explored to enhance the dispersion of the nano oxides in the alloy system. However, these techniques entail a lengthy and energy-intensive alloying process, such as ball milling at 300–1000 rpm speeds for 30–50 h, as well as specific heat treatment processes to further reduce pore and preferred orientation. These additional steps significantly increase the complexity and cost of the manufacturing process.
Conversely, utilizing a low-speed and efficient material mixing method to achieve a high dispersion of nanorods on the surface of alloy powders is an approach to increase the dispersion distribution of nanorods and decrease production costs in the field of metallic materials. In our previous work, the preferred orientation of laser-deposited alloy coatings was successfully reduced by loading highly dispersed Y2O3 nanoparticles on the surface of Fe alloy powders without a mechanical alloying process [29,30]. The present work aims to achieve a uniform coating of 14Cr2NiSiVMn alloy powder by utilizing low-speed mixing to enable electrostatic adsorption of CeO2 nanorods (CNRs) on the powder surface. The work demonstrates that the use of dispersed Ce-based heterogeneous nucleation in the rapid solidification process of PTA fabrication of high-strength steel coatings promotes the formation of equiaxed crystals and reduces preferred orientation in different deposition directions. Furthermore, the defects at the metallurgical bonding zone are minimized without the need for additional heat treatment, resulting in improved microhardness, tensile performance, and wear resistance of the Fe alloy coating.

2. Materials and Methods
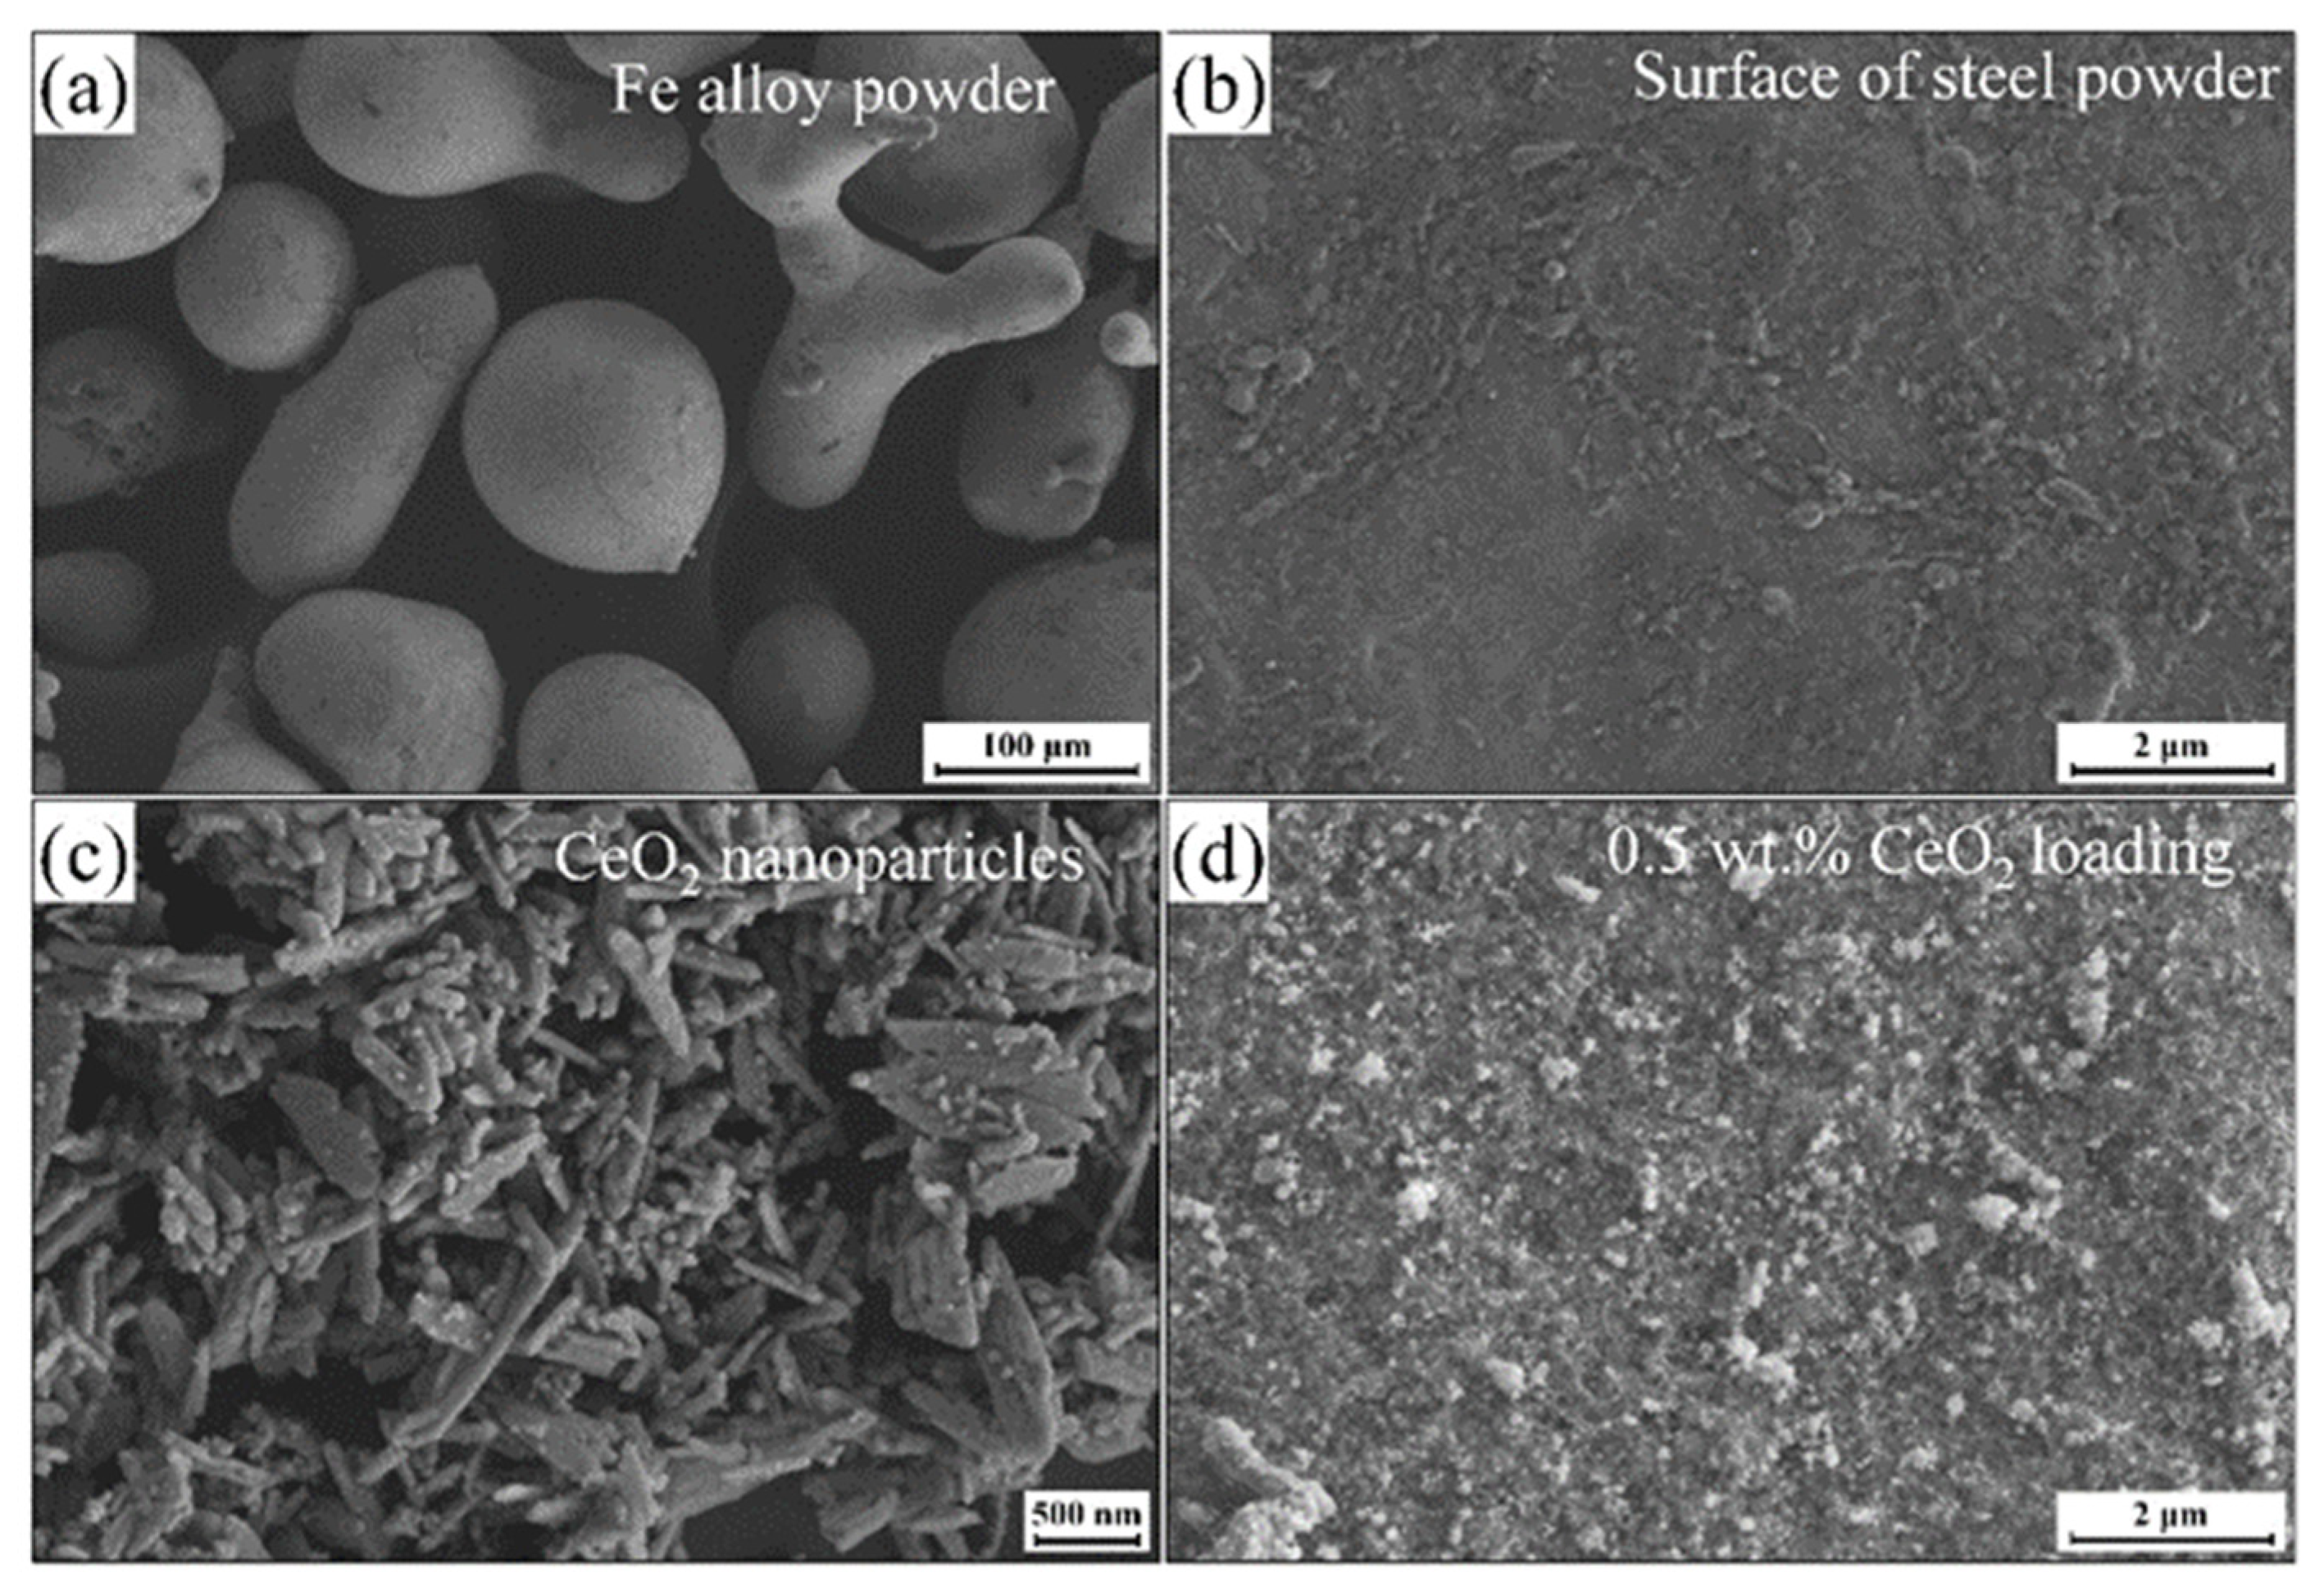
2.1. Materials

The 14Cr2NiSiVMn powder was procured from GL PTA Inc (Wuhan, China). Its composition was Cr (13.95%), Ni (2.10%), Si (1.26%), C (0.27%), Mn (0.52%), V (0.52%), O (0.12%), and Fe (balance) by mass percent. The particle size was 80–120 μm. Before the initiation of the coating production, the powder was subjected to a drying procedure in a regulated chamber at a temperature of 80 °C for a duration of 2 h. Figure 1a,b shows the morphology of 14Cr2NiSiVMn alloy powder. Figure 1c shows the diameter of CNRs (30–50 nm) and the length (0.5–2 μm). To load the highly dispersed CNRs onto the surface of the alloy powder, a planetary ball mill was employed at 3.3 r/s for 2400 s, as shown in Figure 1d. The base material selected for this study was Q235 steel (similar to ASTM 36 steel).

2.2. Fabrication of Alloy Steel Coatings

The experiment was conducted using PTA equipment (PTA–BX–400b, Shanghai Ben Xi Machinery Electromechanical Co., Ltd., Shanghai, China), with the optimal experimental parameters listed in Table 1. The PTA alloy coating had a thickness of approximately 5 mm. During the experiment, argon gas was utilized for protection purposes. The various conditions of PTA alloy coatings were labeled as P0, P025, P05, P075, and P1, corresponding to the different contents of CNRs in the composite powder (0 wt.%, 0.25 wt.%, 0.5 wt.%, 0.75 wt.%, and 1 wt.%).

2.3. Physical and Chemical Characterization

The microstructure was examined using a field emission scanning electron microscope (FE-SEM, Zeiss-Sigma500, ZEISS, Jena, Germany) and an optical microscope (OM, Zeiss Imager-A1m, ZEISS, Germany). Utilizing the energy dispersive spectrometer (EDS, Zeiss-Sigma500, ZEISS, Germany), an analysis was conducted to examine the chemical makeup of the phase constituents.
Utilizing X-ray diffraction (XRD), the phase structure was analyzed. The XRD Parameters were as follows: the utilization of Cu Kα radiations (λ = 0.15406 nm), scanning from 20° to 80° at a rate of 2θ per minute, with a scanning speed of 5 °/min. Utilizing the EPMA (JXA–iHP200F, JEOL, Tokyo, Japan) field emission electron probe microprobe analyzer, the elemental distribution was measured. A high-resolution transmission electron microscope (HR–TEM, FEI–Talos–F200S, Thermo Fisher Scientific, Waltham, MA, USA) was employed to determine the crystal lattice structure. The sample was prepared by mechanical polishing and ion milling. The Ce element content was measured using the inductively coupled plasma mass spectrometer (ICP, PerkinElmer–Nexion300Q, PerkinElmer, Waltham, MA, USA). The assessment of O element content was conducted using the oxygen and nitrogen determination method (OND, HORIBA–EMGA820, HORIBA, Kyoto, Japan).

2.4. Mechanical Properties

The sample’s Vickers hardness was determined using a microhardness tester (Everone, EM-4500, EVERONE, Shanghai, China) with a load of 100 g (equivalent to 0.98 N) applied for 15 s. The tensility of the test sample was evaluated using the universal testing machine (AG-Xplus, Shimadzu, Kyoto, Japan) [19,29,30]. The samples were cut along the X and Y axis directions and clamped by the ends of the dog-bone-shaped samples. The tensile rate was set at 0.5 mm/min. Figure 2a shows the specimen was sectioned along both the directions of the X-axis and Y-axis. Figure 2b shows the fatigue sample prepared per the nonproportional specimen design outlined in GB/T 228.1-2021 (Chinese standard) [31]. Tensile samples were prepared using wire-cutting equipment, and their thickness was 1 mm. The position of each stretch sheet was carefully chosen to be 1 mm below the surface following oxide removal. This specific height selection ensures the uniformity of sample positioning and avoids influence on the experimental results.
The wear resistance of the P coatings was measured using a surface profilometer (MFT-4000, Huahui Instrument, Lanzhou, China). The ceramic balls made of Si3N4, with a diameter of 3 mm and a hardness of 2200 Hv, were used as the friction pairs. The experimental conditions included a wear load of 10 N, a wear rate of 50 mm/min, a scratch length of 5 mm, and a dry sliding condition. To ensure accurate results, the coating specimens were polished before the trial to minimize the impact of surface roughness.
The wear resistance of the specimens was evaluated using the NUS-ISO3 wear tester (Shanghai Hapoin, Shanghai, China), measured in terms of weight loss. The friction materials consisted of dry abrasive papers (80 mesh SiC), which were used as the friction material in the wear tests. The dry abrasive papers had a hardness of 2265.3 ± 224.5 Hv (Vickers hardness). The weight loss was determined by measuring the wear at four different times. Each sample underwent three groups of wear tests, and the average value was calculated. Q235 steel was chosen as the reference material for assessing the relative wear resistance (ε), which was determined using the following formula:
ε = Wsample/WQ235
To minimize errors, the coating samples underwent meticulous polishing and were weighed using an electronic balance (BSA224S) with a precision of 0.0001 g. The friction pairs consisted of dry abrasive paper (80 mesh SiC) with a hardness of 2265.3 ± 224.5 Hv and the test samples. In each scratch path, the wear wheel was rotated by 0.9° to create a fresh friction surface on the lower side of the sample.

3. Results and Discussion

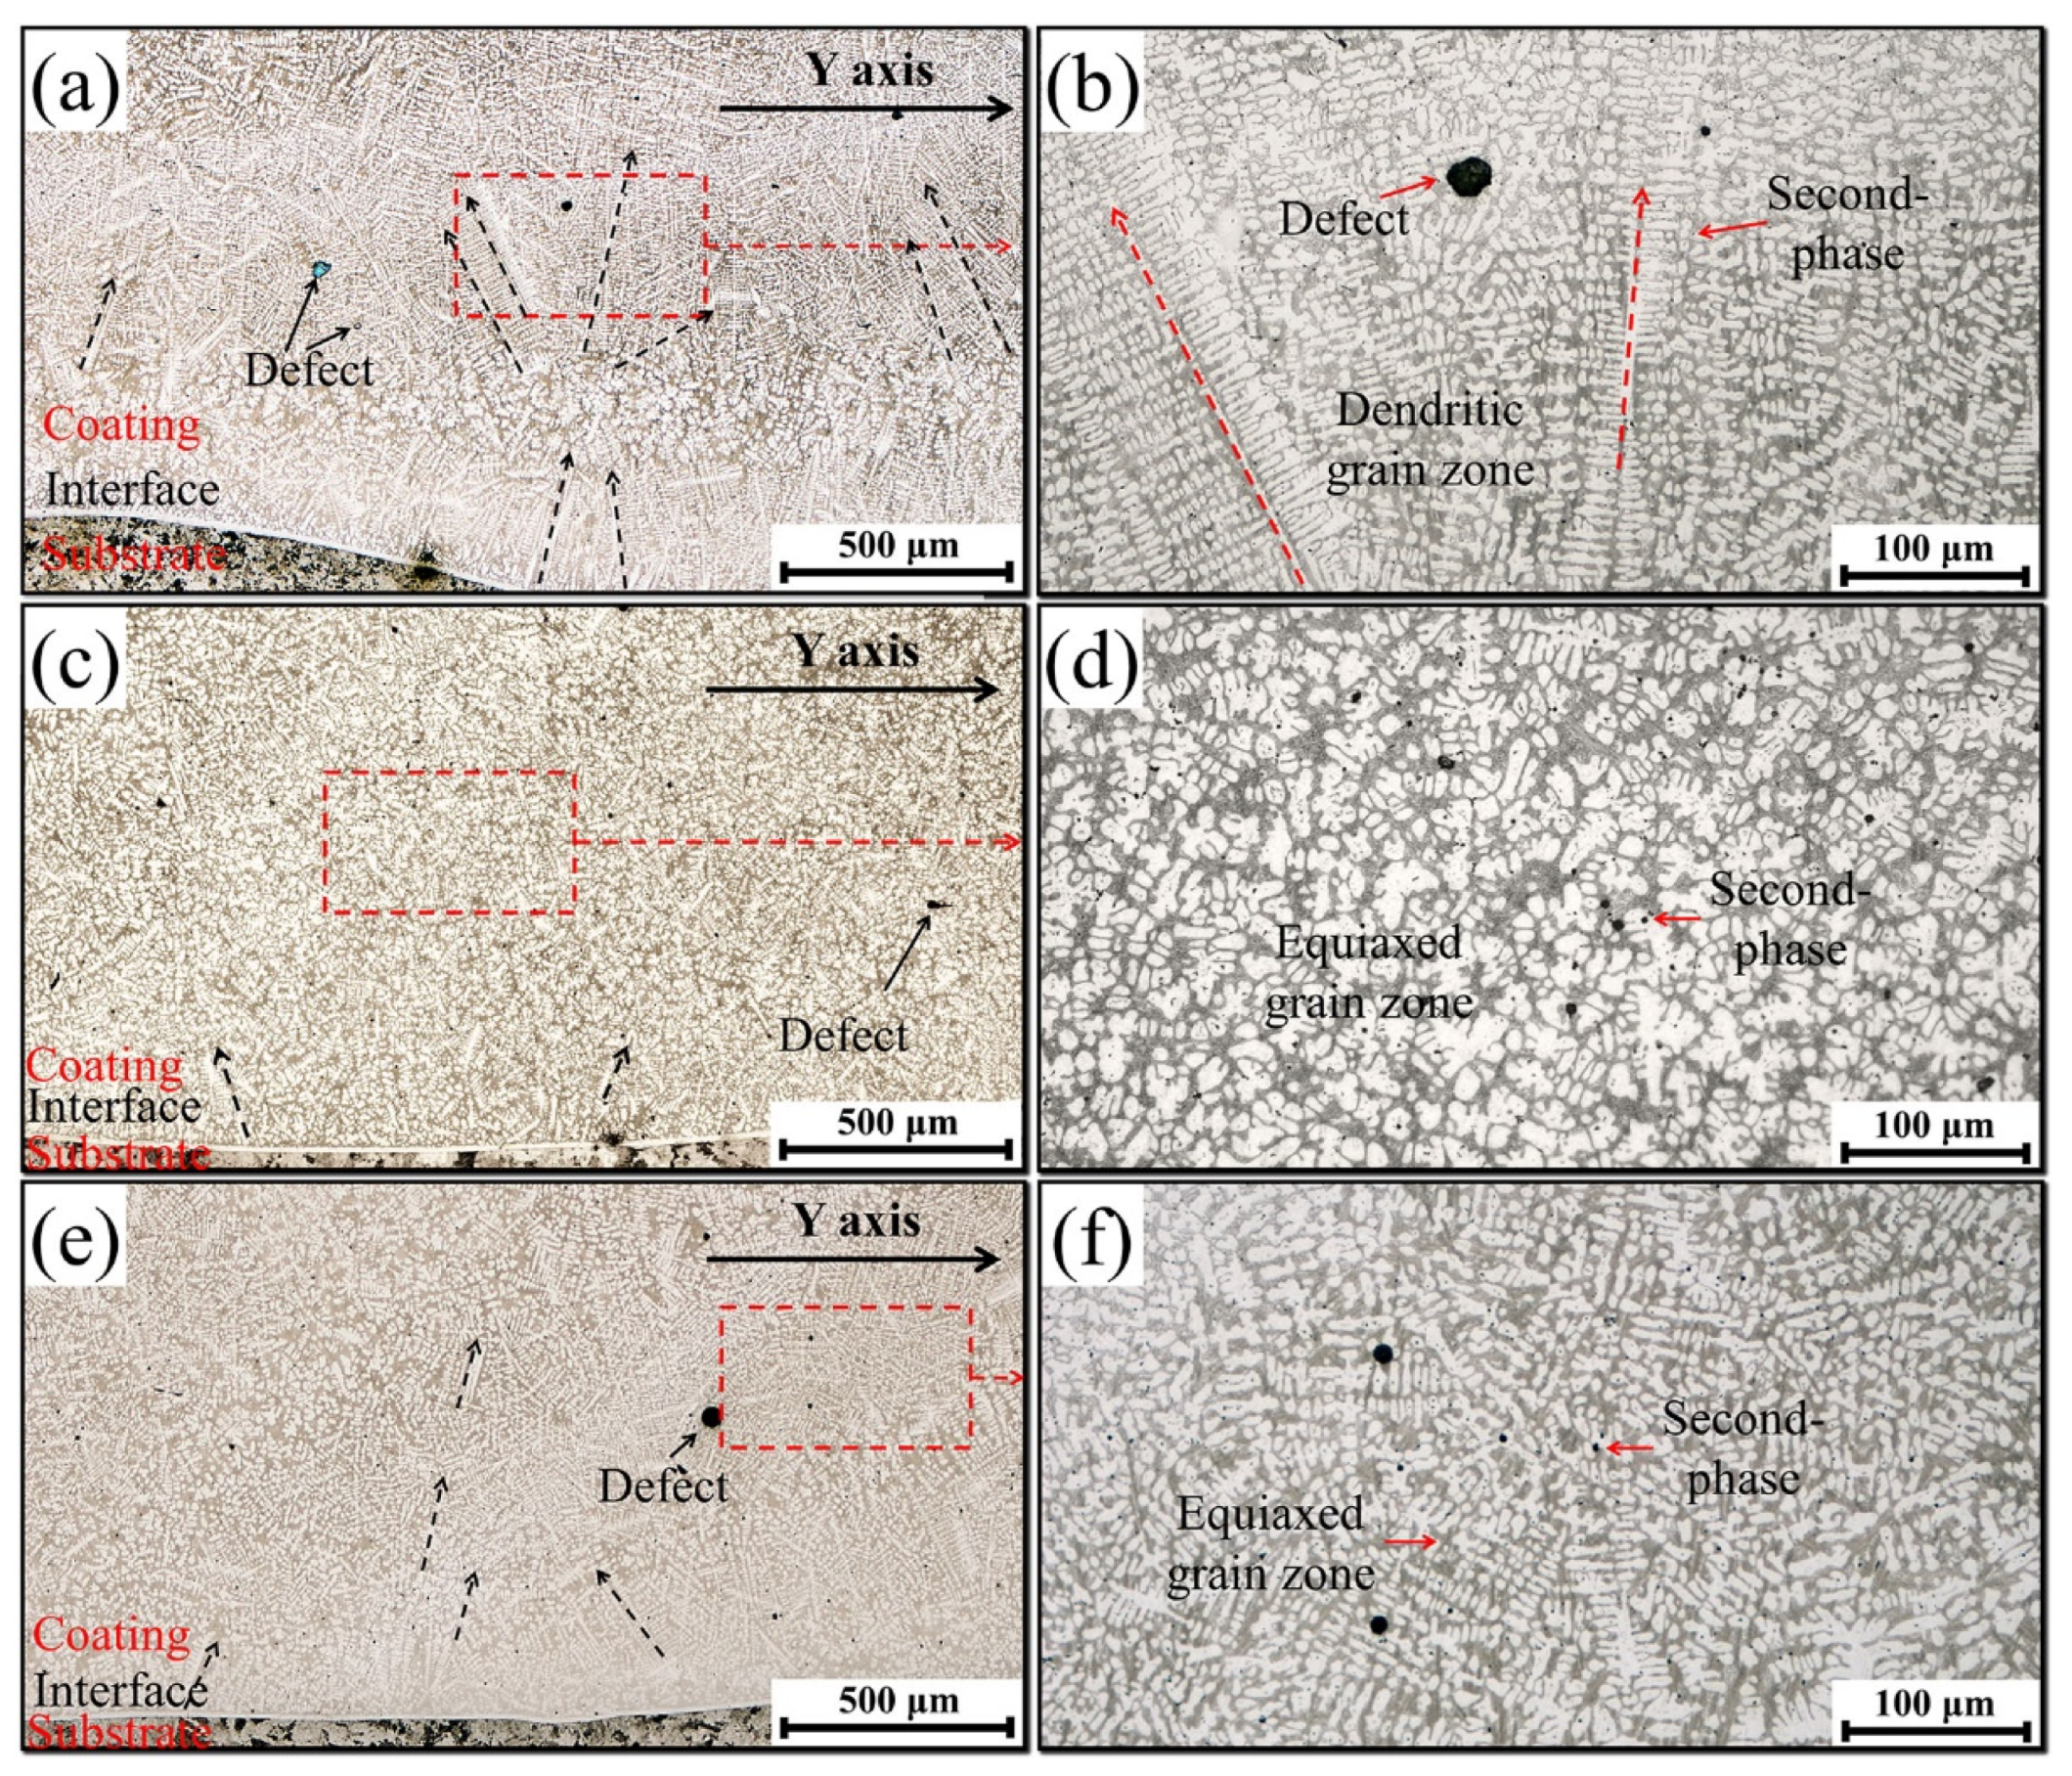
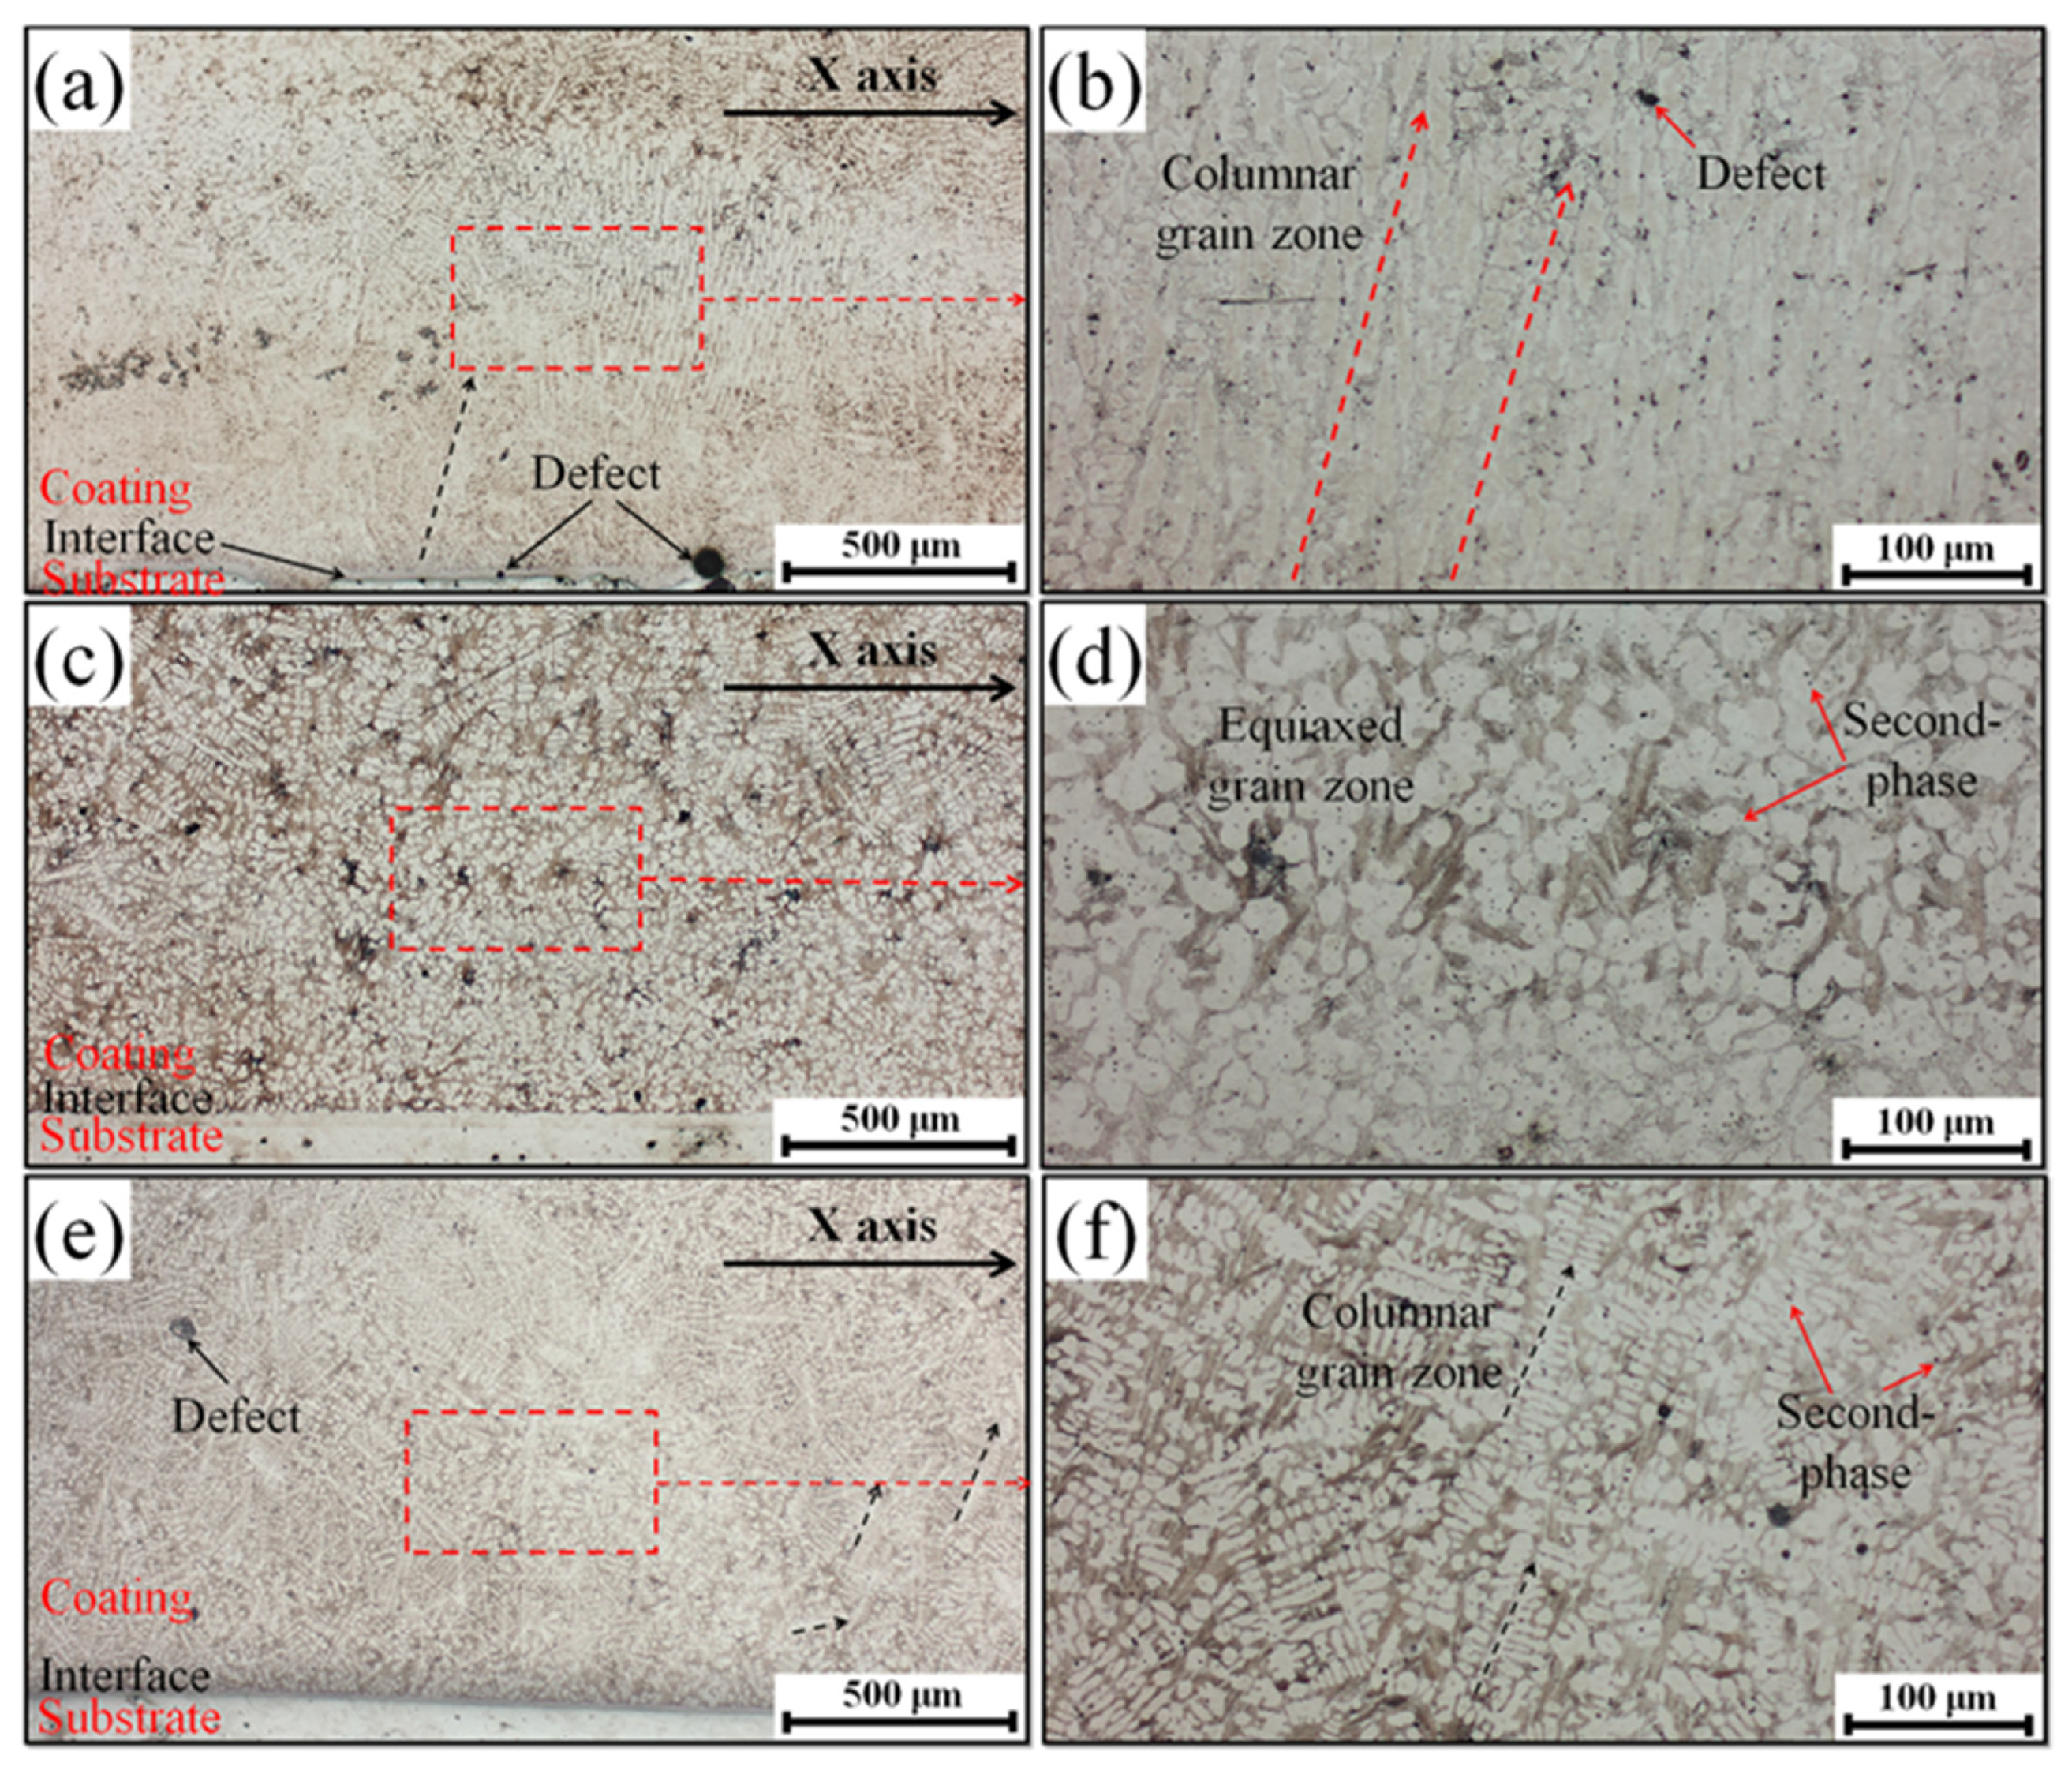
3.1. Microstructural Characterization

Figure 3 shows the cross-sectional metallographic image of P coatings in the Y–Z direction. In the P0 sample, structural defects were observed in the alloy steel coating. The P0 sample exhibited evident growth of radial long-range dendrites and columnar solidified structures from the bottom of the molten pool to the center, as shown in Figure 3a. To facilitate a more detailed examination of grain structure and structural defects in the P0 samples, an amplification was applied to P0. The internal grain structure of the P0 sample revealed a columnar crystal formation, as shown in Figure 3b. However, the addition of 0.5 wt.% CNRs led to a Grain Orientation Reduction, as shown in Figure 3c. The formation of long-range dendritic and columnar solidification structures was less than that in P0, and an equiaxed crystal structure was formed [32], as shown in Figure 3d. When 1 wt.% CNR was incorporated into the coating, the reoccurrence of columnar crystals could be observed, as shown in Figure 3e. Furthermore, there was a noticeable increase in internal impurities and gas pores, as shown in Figure 3f.
Figure 4 shows the metallographic image of the P coatings in the cross-sectional X–Z orientation. In the P0 sample, the long-range columnar crystal structure propagated upwards from the metallurgical bonding zone, as shown in Figure 4a. The internal grain structure of the sample exhibited a formation of columnar crystals, as shown in Figure 4b. However, the addition of CNRs significantly increased the abundance of equiaxed crystals, as shown in Figure 4c. Furthermore, an internally dispersed distribution of second-phase particles was observed within the coating, as shown in Figure 4d. An enhanced coating orientation was observed for the P1 sample, as depicted in Figure 4e, accompanied by a resurgence of columnar crystals, as illustrated in Figure 4f. This observation result was similar to that of the grain growth in the Y–Z direction of the P coatings. The addition of 0.5 wt.% CNRs diminished the grain size and facilitated the formation of equiaxed crystals. The possible mechanism has been described subsequently. Ce is a surface-active element [33]. It can decrease the surface tension of the melt [33]. It can also increase the convective heat transfer in the molten pool [34,35,36]. During the rapid heating stage, CNRs partially melted and released Ce ions, resulting in greater undercooling of the alloy system [23], lower melting point, and improved flow of the molten pool [33,34,35,37]. Simultaneously, during the initial stage of rapid cooling, the low solubility of Ce in Fe promoted the formation of a separate Ce-rich phase in the solid state [33]. Thus, the decomposition of dendritic crystals into small grains was promoted, thereby inhibiting the growth of dendrite crystals. However, the excessive addition of CNRs caused grain fusion and growth. This is because the growth and coalescence of equiaxed crystals were dominated by the austenitic maturation effect [18].

3.2. XRD Analysis

Figure 5 shows the XRD patterns of the P coatings. Figure 5a reveals the presence of the Fe–Cr (PDF#97–062–5865) phase and Cr (PDF#97–067–1428) phase in the P coatings. The corresponding diffraction peaks were observed at 44.5°, 64.5°, and 43.5°, respectively. The XRD pattern displayed additional peaks corresponding to SiO2 (PDF#97–020–0479) and CeVO4 (PDF#01–072–0282) between 20° and 30°, as shown in Figure 5b. The solubility of CeO2 in Fe alloys is low, and its concentration in the alloy is also limited, which does not have a significant impact on the phase composition [36,37].

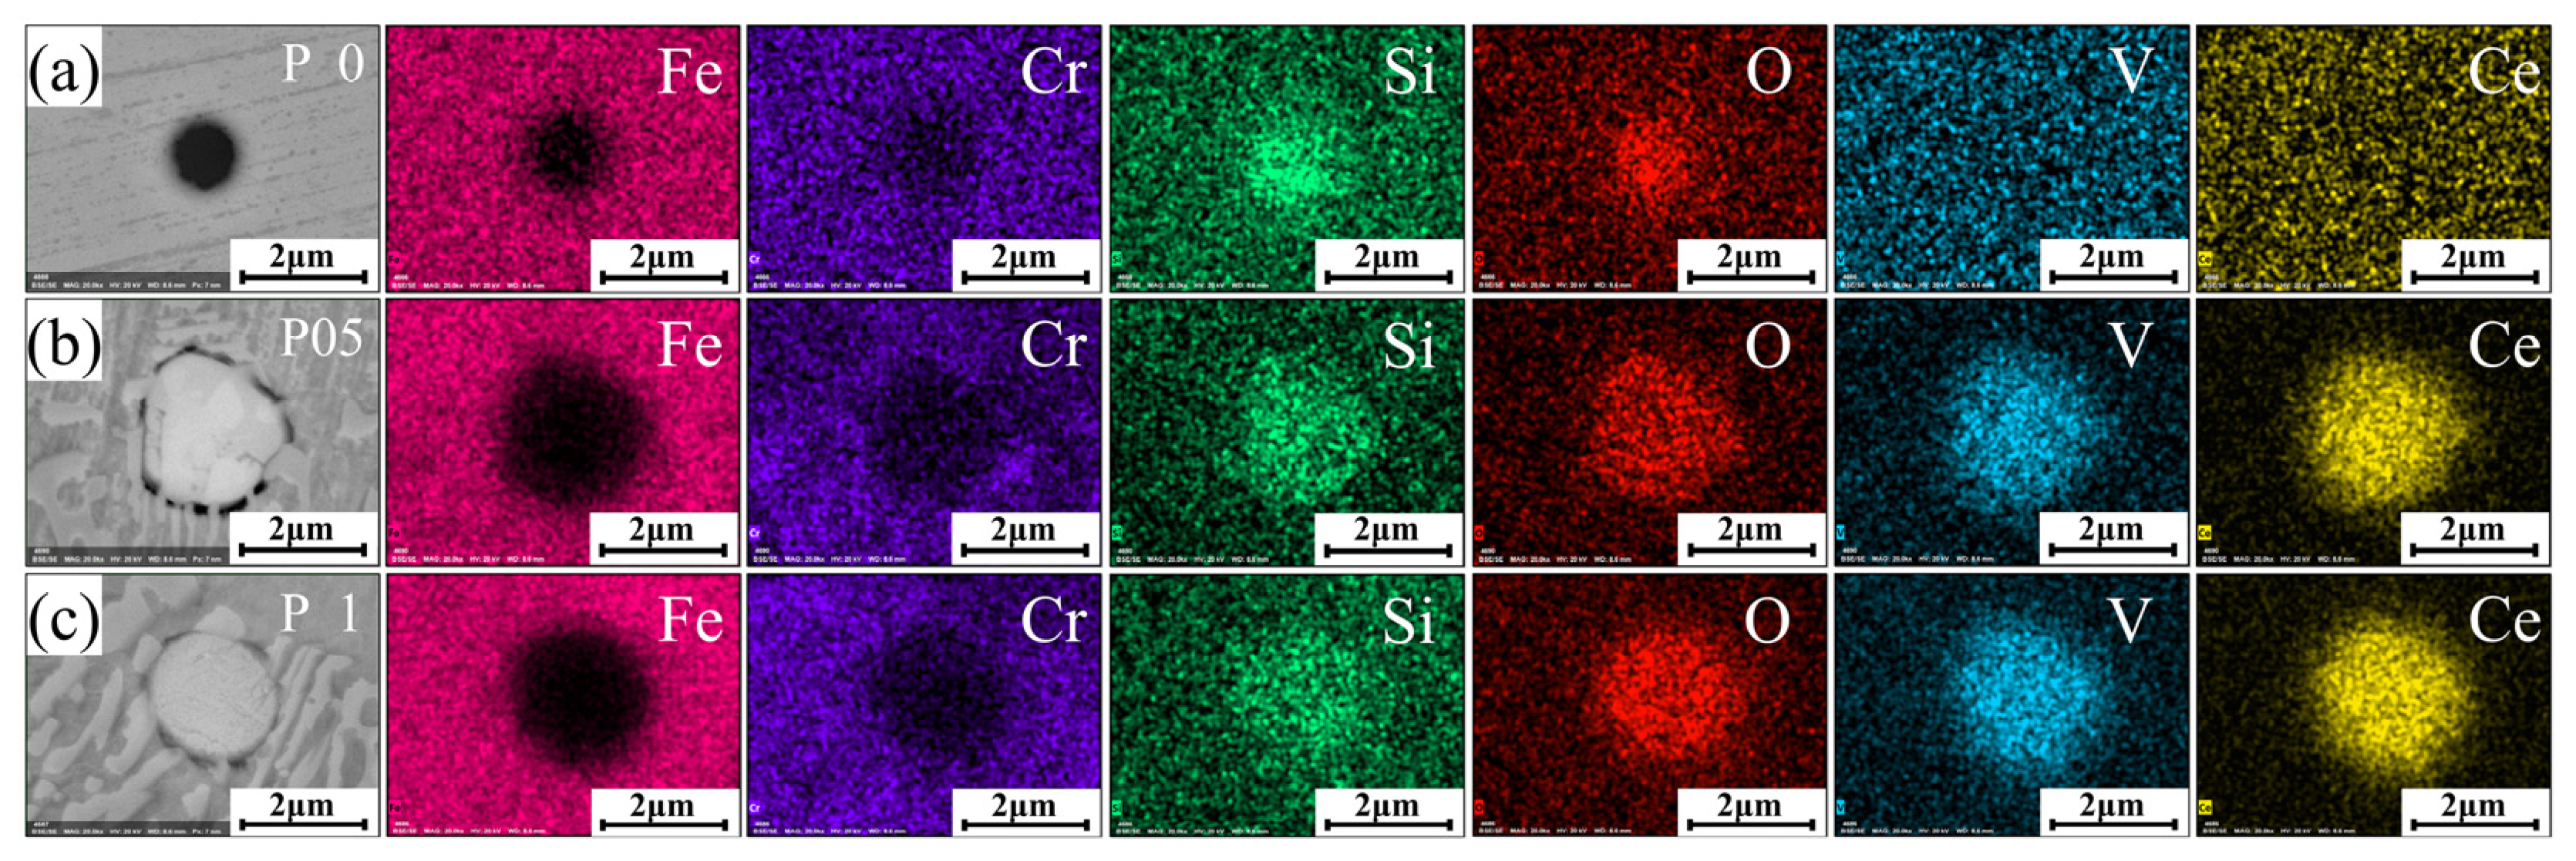
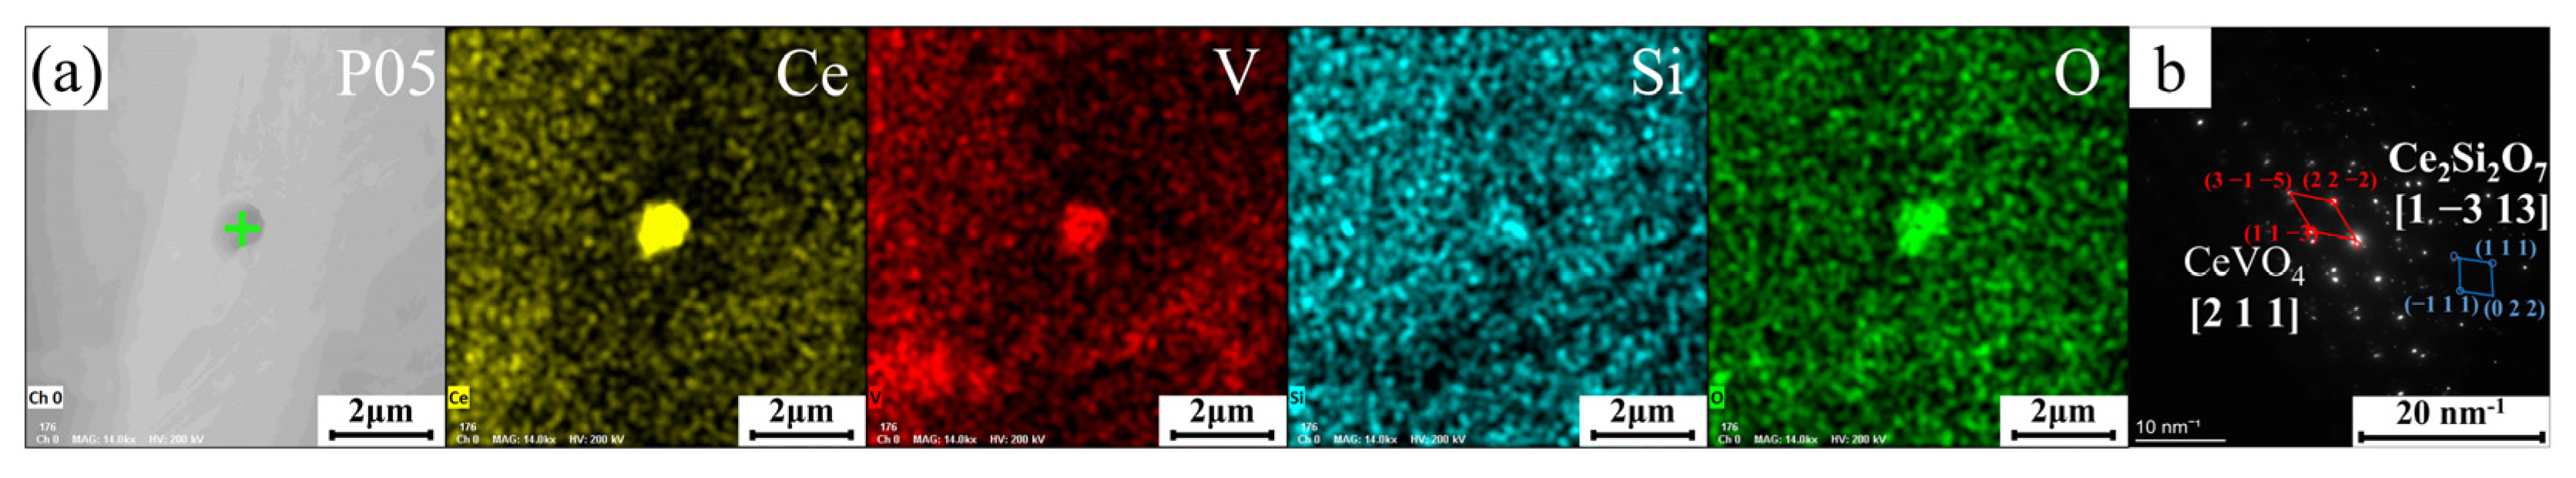
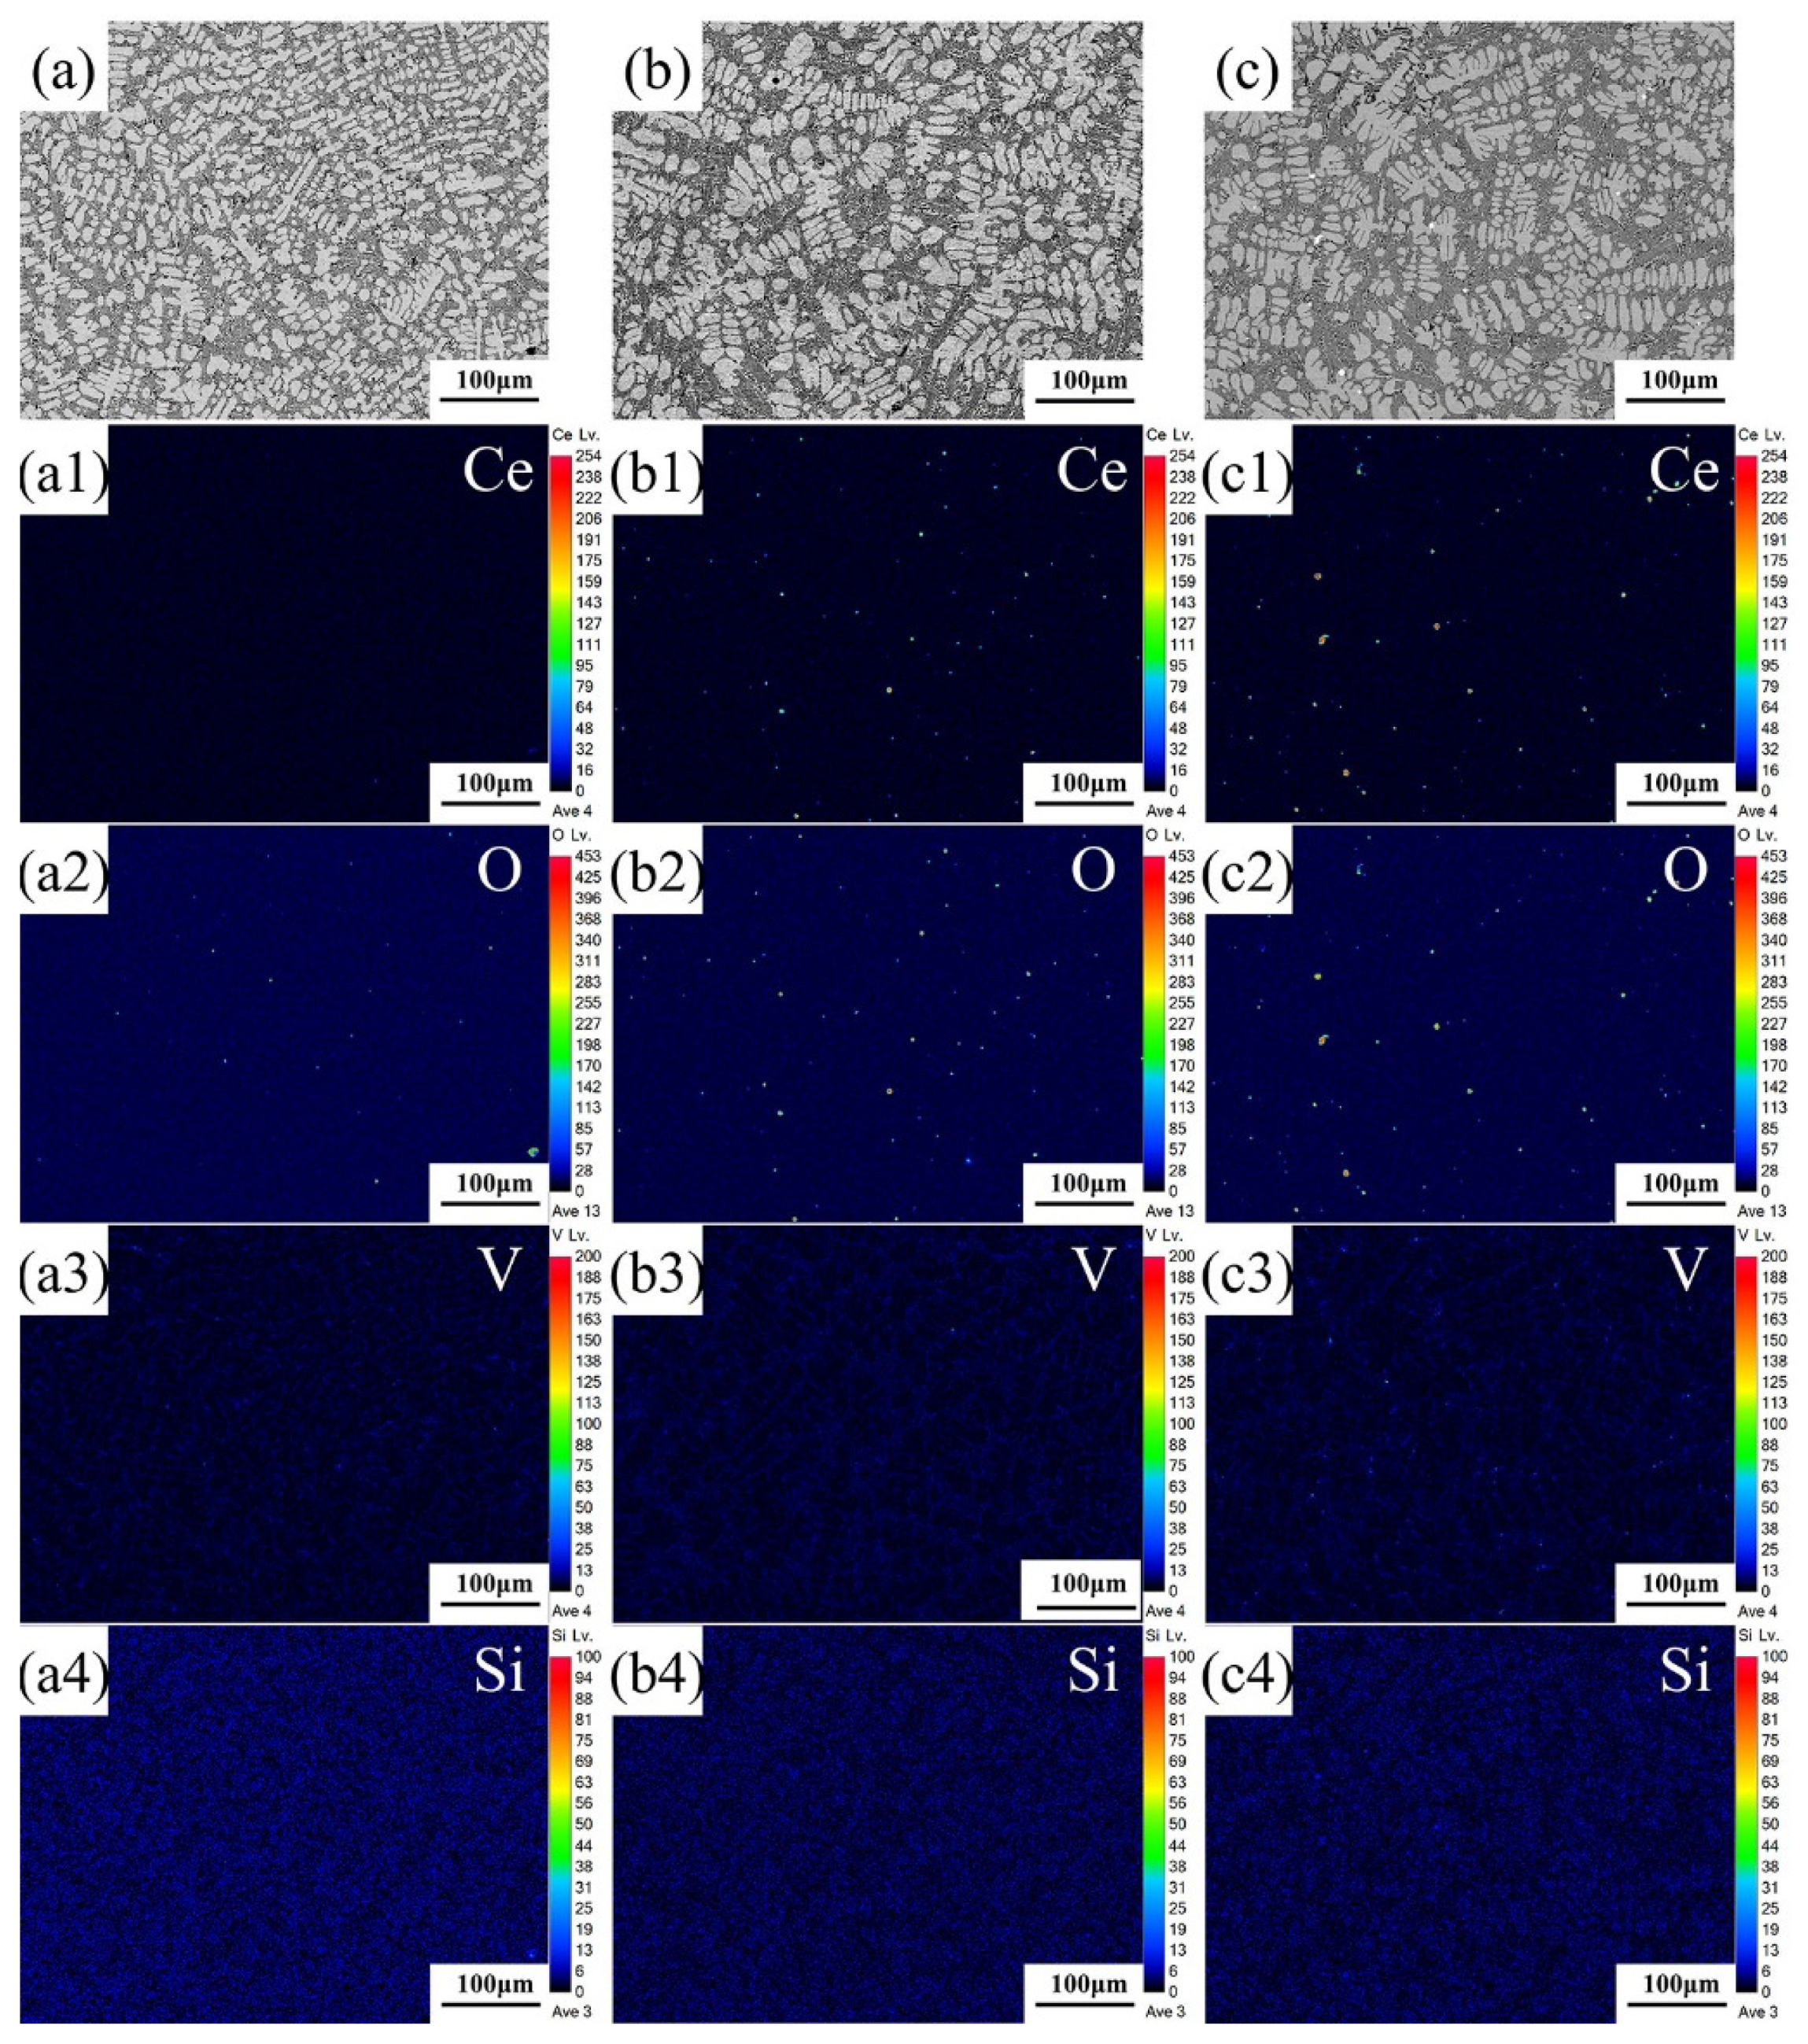
3.3. Analysis of Elemental Distribution

Figure 6 shows the composition of the Ce-rich phase in the P coatings determined by an EDS map. Figure 6a reveals a distribution of silicon oxide in the P0 sample. The Ce element combined with the V, Si, and O elements, forming a micro-scale particle in the internals of the P05 and P1 samples, as shown in Figure 6b,c. In the traditional CeO2 addition mechanism, the Ce element tends to form impurities with other elements and aggregate at the boundary positions, resulting in the creation of micro-cracks in the specimen and subsequently reducing its performance [33]. In the present study, the element Ce was observed to combine with V, Si, and O, resulting in the formation of second-phase particles. This phenomenon plays a crucial role in promoting heterogeneous nucleation.
The submicron particles in the P05 sample were further investigated using the HRTEM, and the obtained EDS and SAED images are presented in Figure 7, respectively. The presence of CeVO4 (PDF#01–072–0282) and Ce2Si2O7 (PDF#00–022–0545) within the particle was detected, as shown in Figure 7b. It confirmed that the partial Ce combines with V and Si elements to form submicron particles, which could influence the heterogeneous nucleation of the sample. In this study, Ce (0.182 nm) formed micro-scale substitutional solid solutions with V (0.134 nm) and Si (0.118 nm), which was comparatively matched to the Fe solid solution (0.126 nm) [38].
Figure 8 shows the analysis of the P coatings surface (X–Y direction) conducted using EPMA. The second-phase particles present on the surface of the P coating were subjected to statistical analysis (Figure 8, approximately 0.215 mm2). Figure 8a reveals the distribution of Si-O particles in sample P0, with a particle count of 26. The oxygen may come from the air. The particle count of Ce-rich particles in the P05 sample was calculated as 67, which was more dispersed than the Si-O particle of the P0 sample, as shown in Figure 8b. These uniformly distributed particles increased the nucleation rate of the P coatings, resulting in coarse dendrites decomposing in multiple directions. However, Figure 8c shows that the further addition of CNRs resulted in excessive Ce-rich oxide particles (82) in P1, resulting in an excess of O content in the Fe phase of the sample. Such results correspond to those in Table 2, which shows the increase in Ce and O content within the sample.

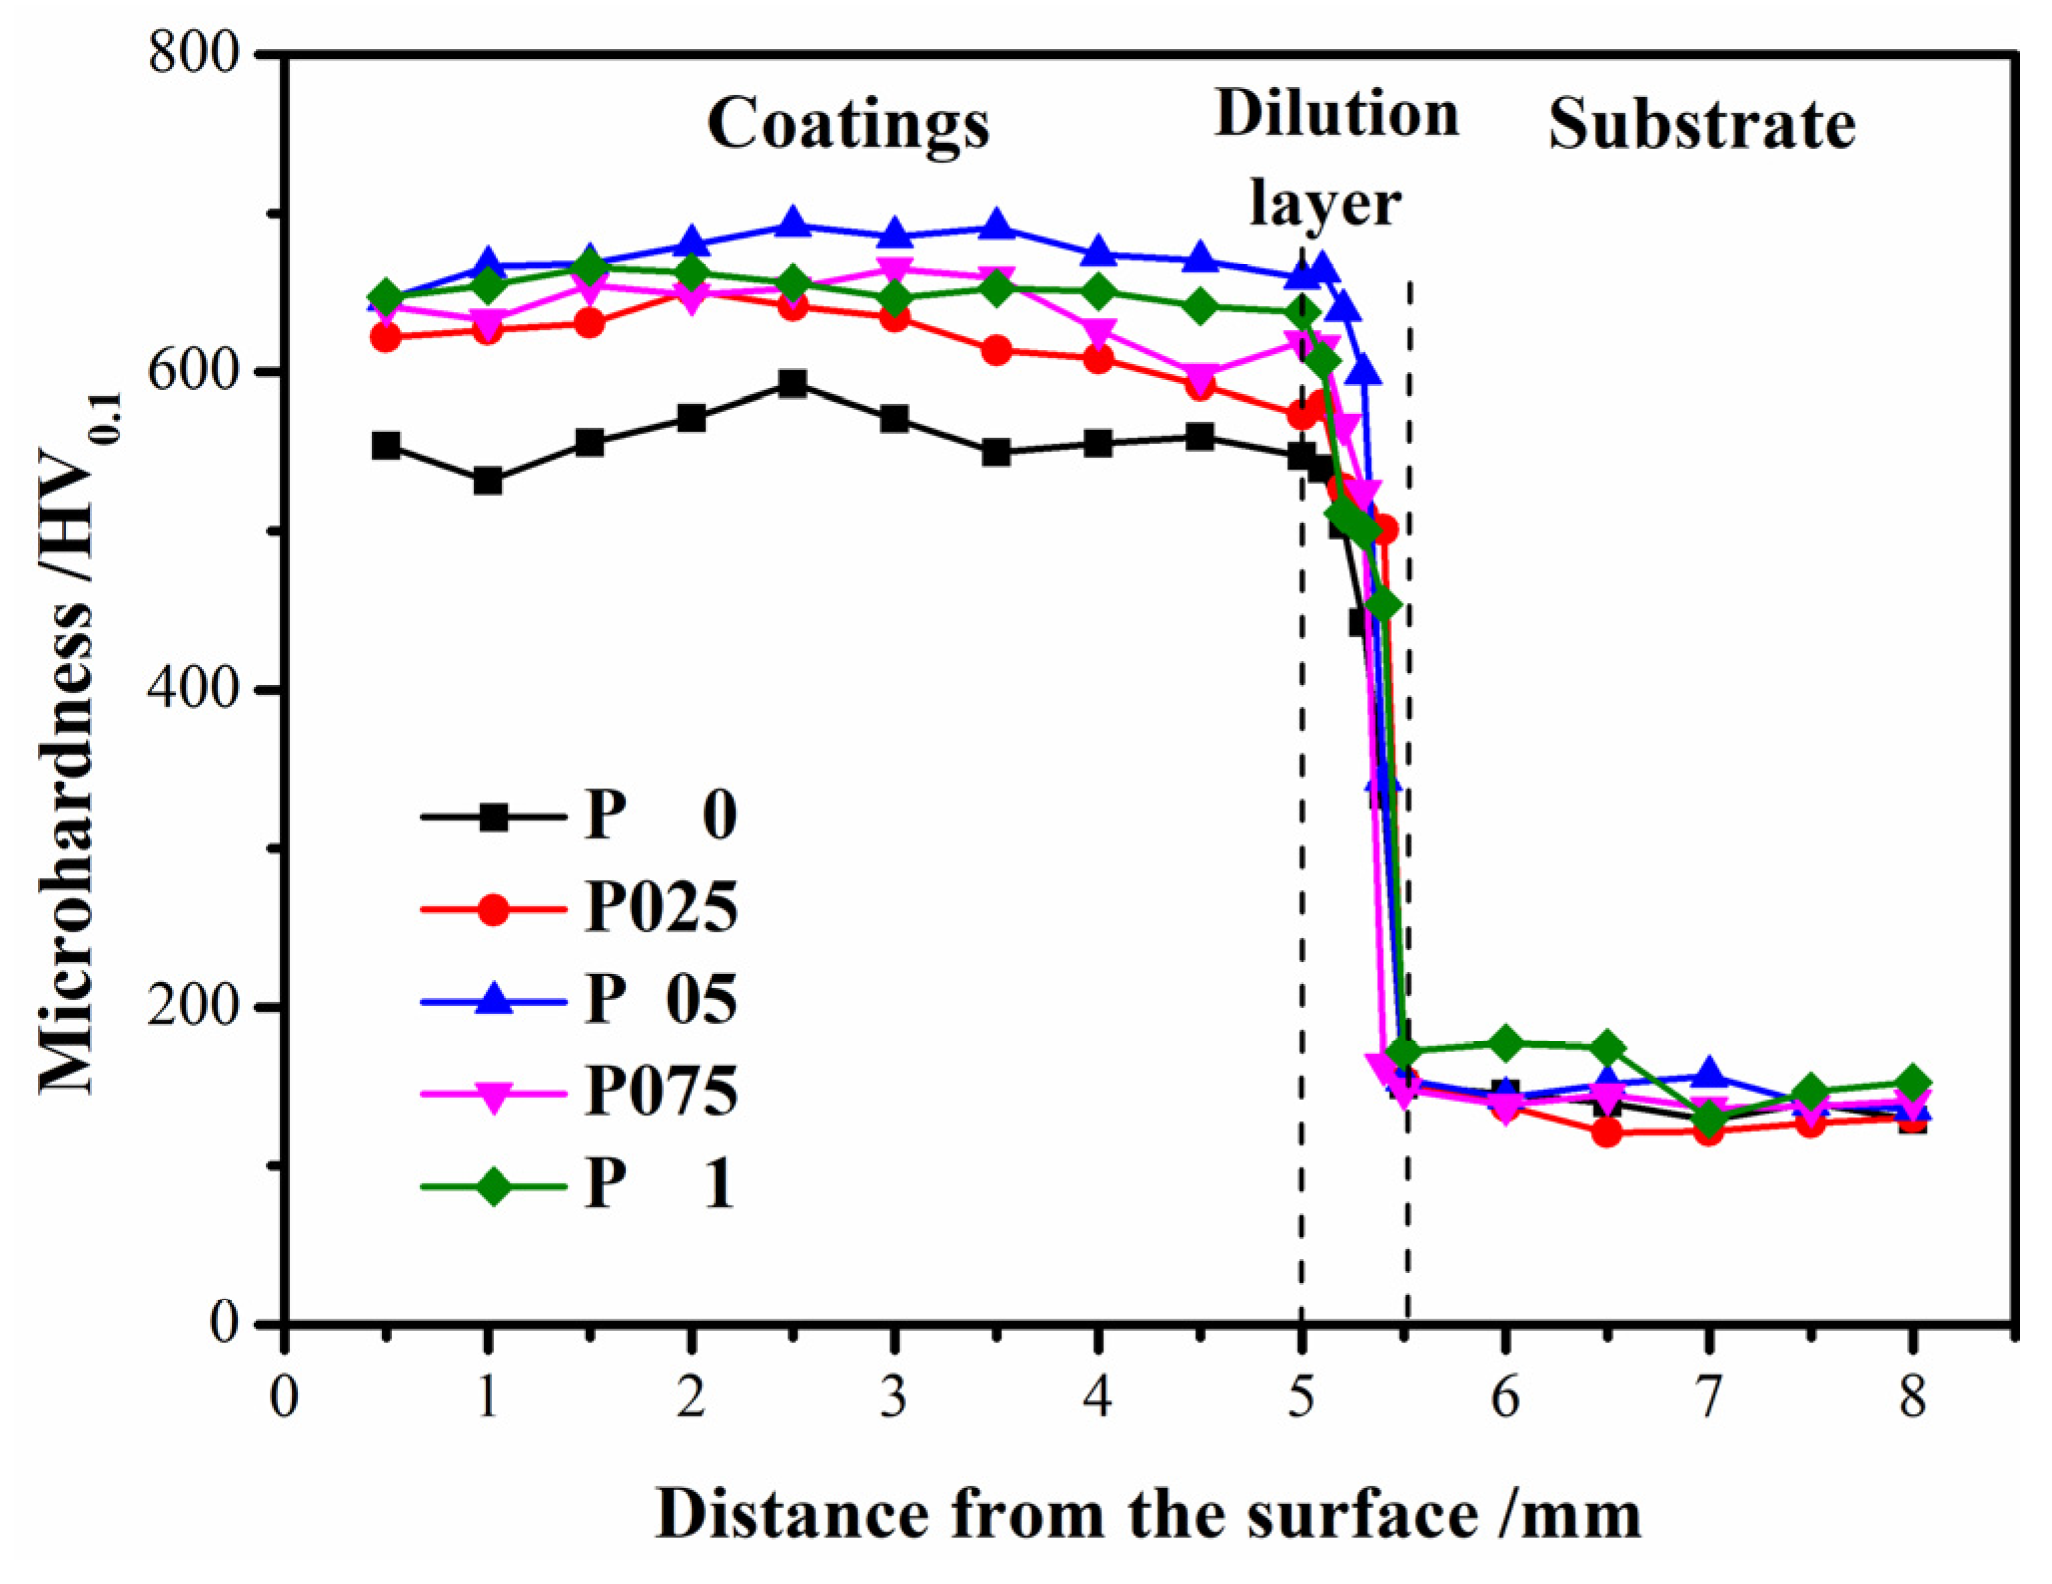
3.4. Mechanical Properties

Figure 9 shows the distribution of microhardness in the P coatings along the Y–Z direction. The average hardness values for the P coatings are given in Table 3. Among these, sample P05 exhibited the highest average microhardness, which was approximately 20.4% higher than P0. Uniform equiaxed crystal microstructure and dispersed Ce-rich oxide particles could be responsible for the increase in microhardness, which formed during the rapid solidification process with the addition of CNR.
Figure 10 shows the tensile plots of the P coatings. To distinguish the influence of crystal growth in different crystallographic directions on the tensile properties, the tensile properties of the sample in the along deposition direction (X-axis direction) and perpendicular deposition direction (Y-axis direction) were analyzed separately. The tensile strengths in the X-axis direction are given in Table 3. After adding CNRs, the tensile strength of the P05 sample increased by 97.6%. The elongation of the P05 also increased by 58.9%.
Similarly, the tensile strengths of the P coatings in the Y-axis direction are given in Table 3. P05 exhibited a marked improvement in the tensile strength in the Y-axis direction by 88.1%. The CNRs also enhanced the elongation of the P05 sample by 39.9%. The addition of CNRs up to 0.5 wt.% promoted grain nucleation and reduced preferred orientation along the X and Y axes, resulting in superior tensile properties of the sample. The tension strength in the Y-axis direction was lower when compared with that of the P coatings in the X-axis direction, which is related to the grain orientation inside the coating. This is because the grain growth along X-axis directions experienced lapped annealing during the alloy powder deposition. This behavior can be attributed to the inner structure of the coating, specifically its uniformity. The grain structure in the X-axis direction was smaller and more dispersed, as depicted in Figure 3c. In the Y-axis direction, the grains exhibited a more disordered arrangement, with larger intergranular regions, as shown in Figure 4c. The non-uniform internal structure of the coating ultimately led to a reduction in both strengths along the Y-axis direction.
The micrograph of the fractured specimen under tensile deformation along the X-axis direction is shown in Figure 11. The P0 sample exhibited significant tearing and peeling marks on its fracture surface, along with numerous noticeable cleavage planes, steps, and pores. Furthermore, the fracture surface of the P0 sample exhibited residual pits resulting from peeled-off spherical oxides (Figure 11a). After prolonged tearing, peeling, and flaking, numerous larger cleavage surfaces, steps, and river-like patterns were formed (Figure 11b). This is characteristic of cleavage fractures and intergranular fractures. The P0 sample fractured along the growth direction of the columnar dendritic solidification structure. This phenomenon can be attributed to the heterogeneous internal composition of the P coatings, which leads to cleavage fractures and reduces their tensile characteristics [30]. The fracture morphology of the P05 sample (Figure 11c,d) exhibited river-like patterns, cleavage steps, and microcracks, indicating the occurrence of quasi-cleavage fractures. However, the long-range tearing disintegrated into short-range tearing, while the dendritic crystals refined into equiaxed crystals, resulting in improved tensile properties. The P1 sample presented a greater number of micro-particles than the P05 sample (Figure 11e,f), leading to an excess stress concentration around inclusions and the formation of potential crack sites [35]. This induced brittle cleavage fracture in P1 and reduced its tensile strength.

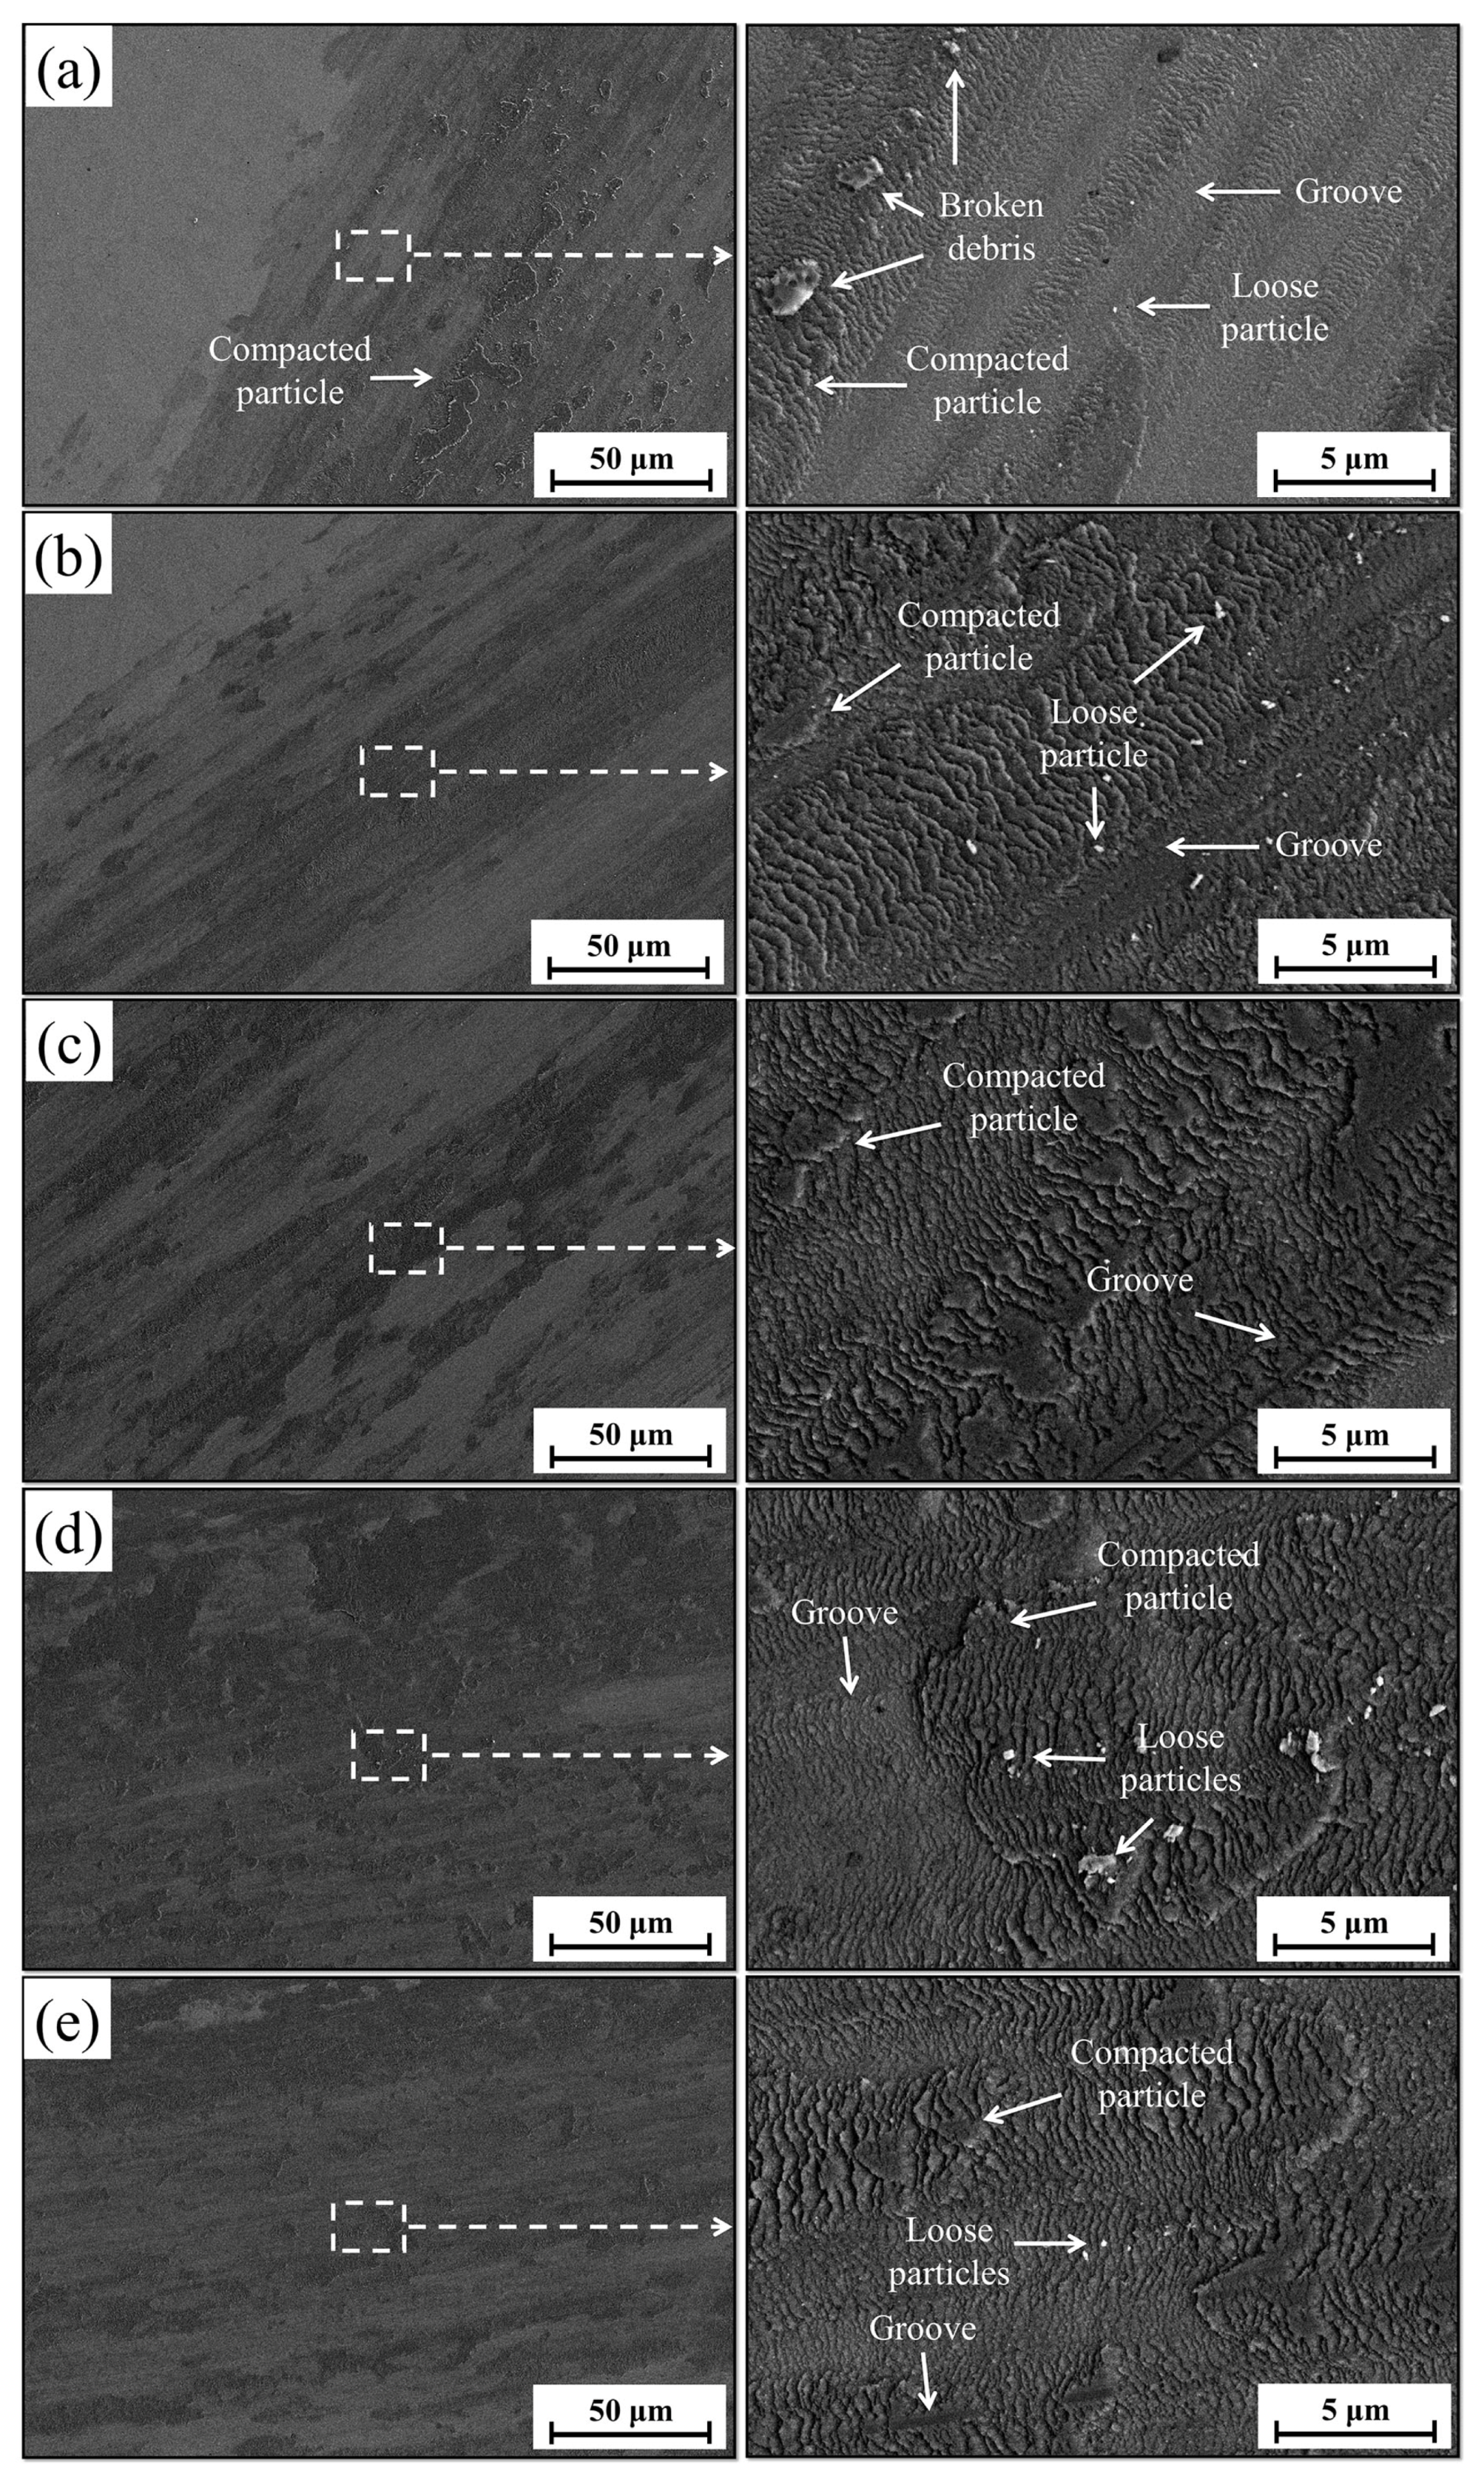
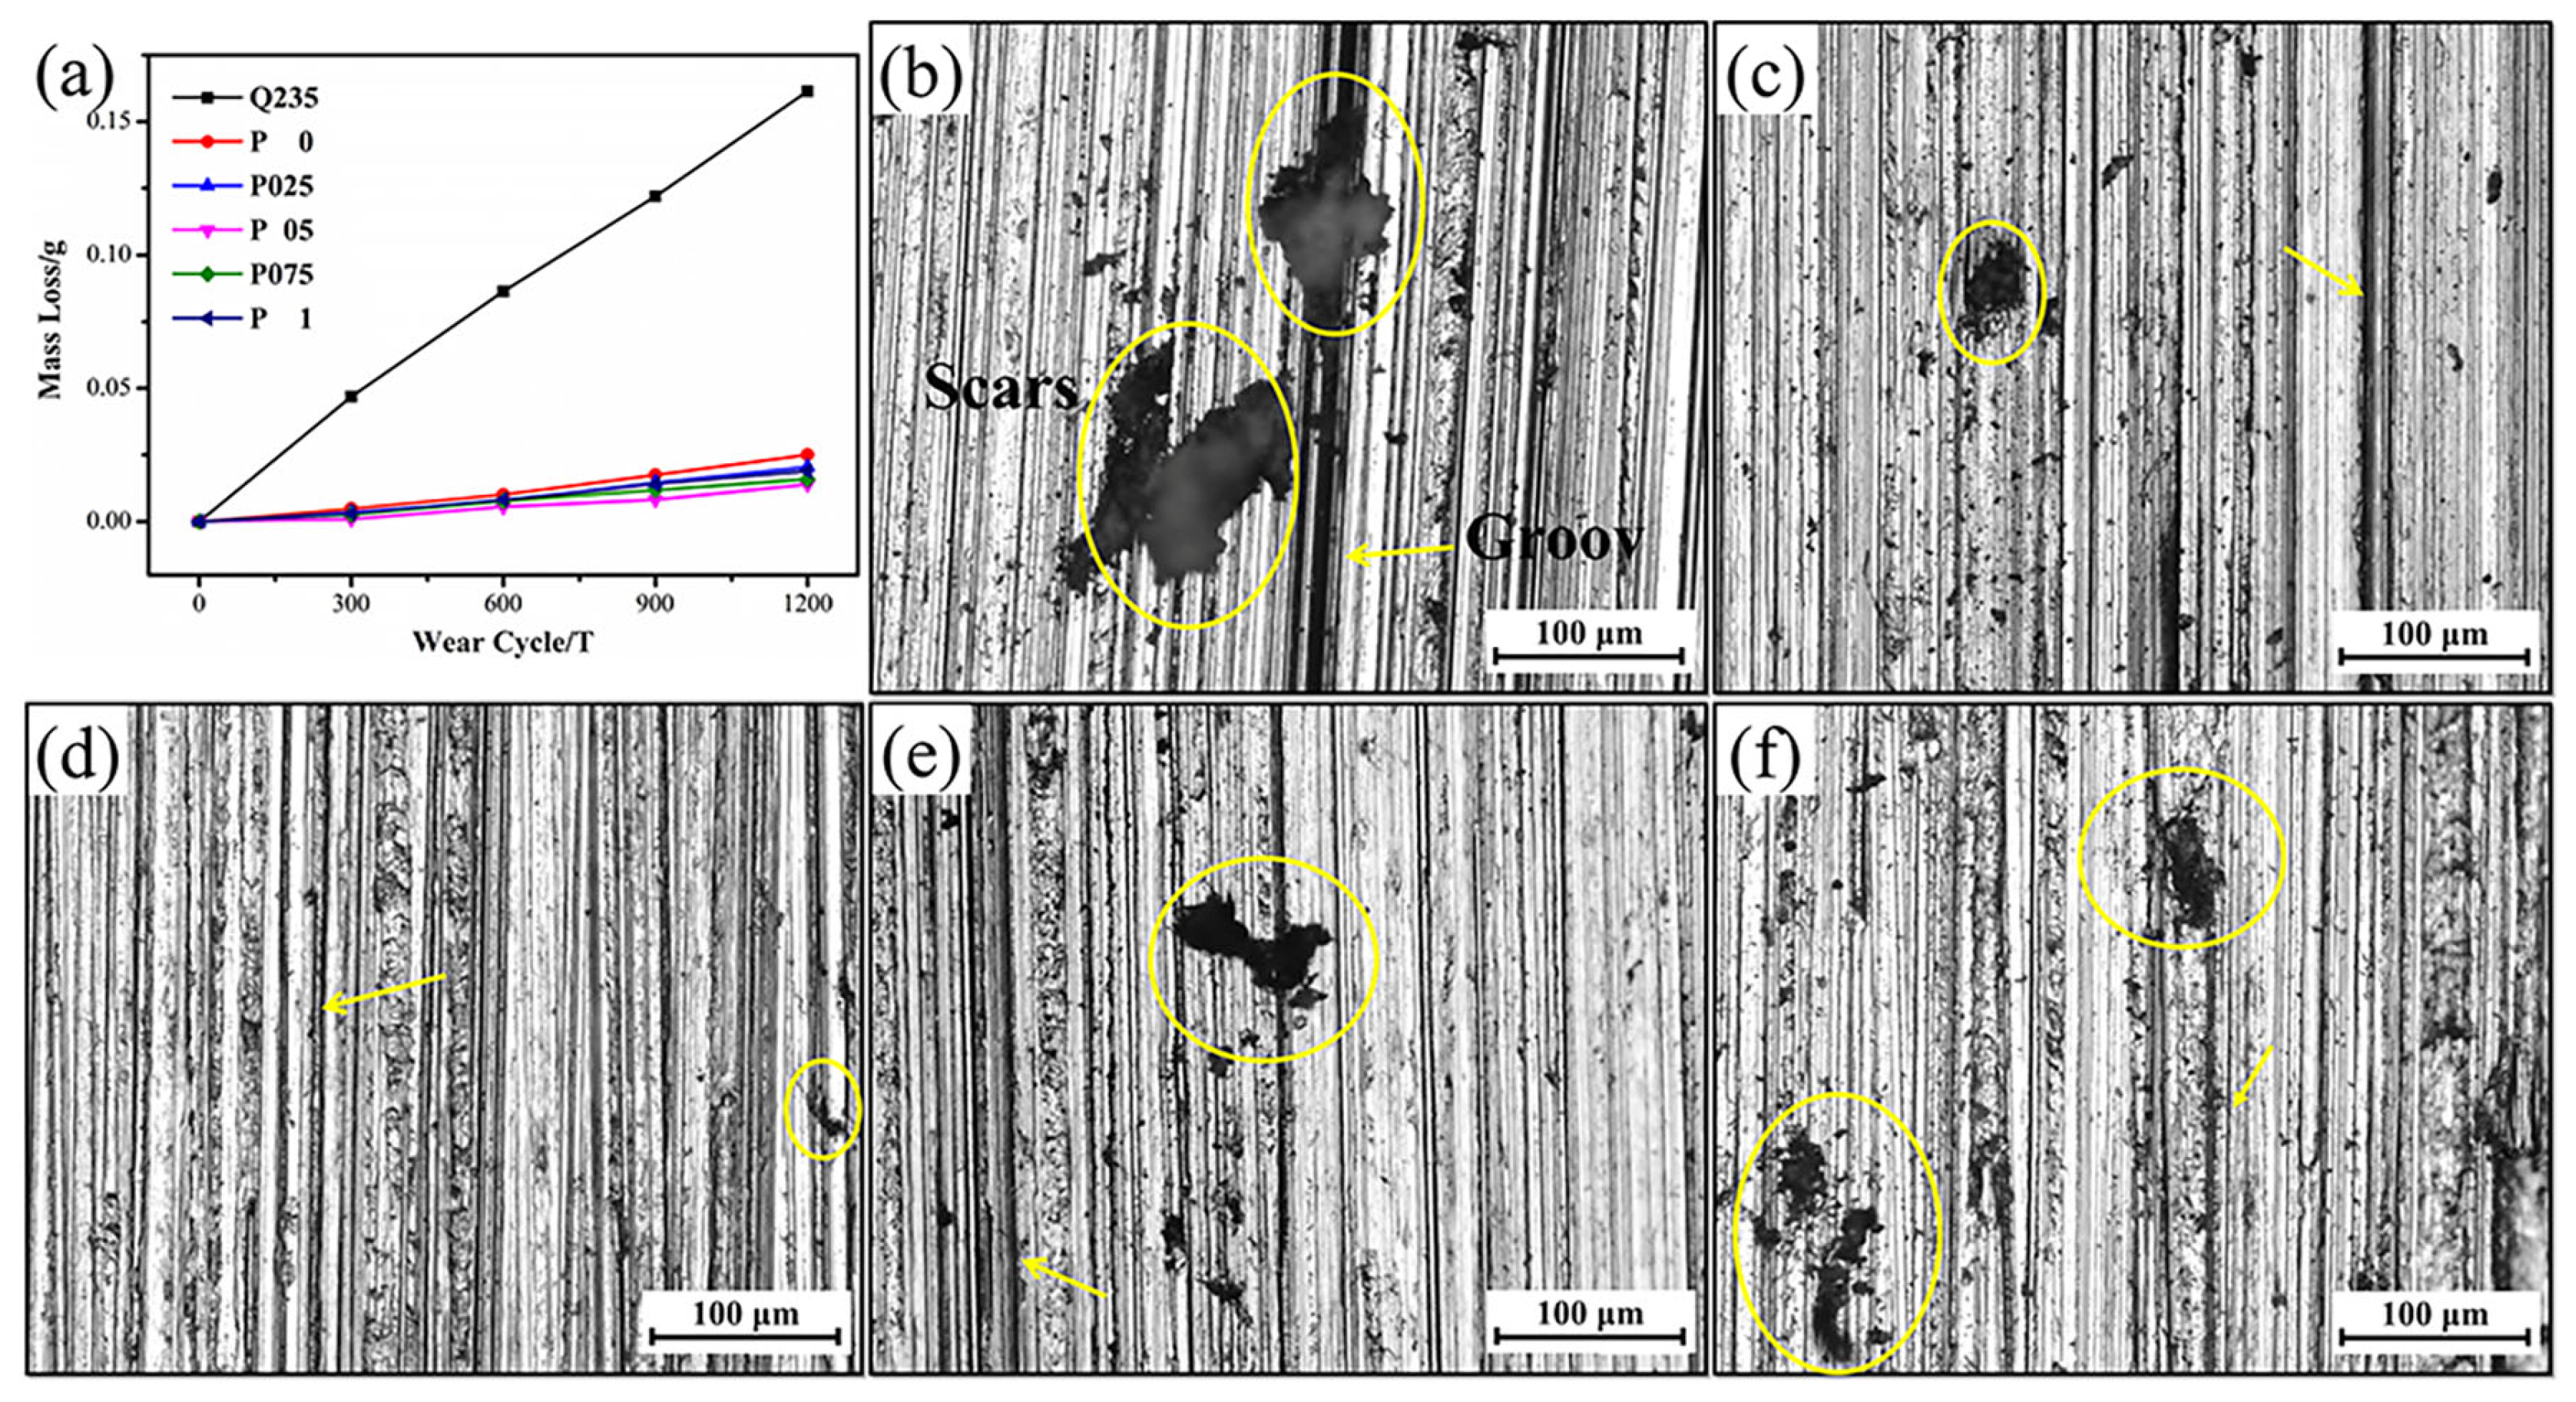
3.5. Wear Performance

Figure 12 shows the worn micrograph on the surface of the P coatings subjected to low-speed dry sliding. The existence of fish scale-like friction patterns on the sample surface indicates that the friction mechanism is plastic deformation and adhesive wear caused by delamination [36,39]. The P0 sample surface displayed long furrows and debris accumulation, which intensified the three-body wear [40]. The rapid cooling process resulted in nonuniform heat distribution within the molten pool, leading to the formation of dendritic crystals. These dendritic crystals along the cladding direction contributed to the formation of broken debris during the dry sliding process [18,19,34,36]. By incorporating an appropriate amount of CNRs (P05), the dendritic crystals transformed into equiaxed crystals, reducing the generation of loose particles and debris [41,42]. This transformation improved the wear mechanism, which was dominated by three-body friction. However, excessive CNRs caused the enrichment of micro-scale oxides, leading to inhomogeneity and the exacerbation of the peeling of surface debris, ultimately decreasing the material wear resistance.
Figure 13 shows the weight loss wear cycle curves for the surface of P coatings under an 18 N load for 1000 cycles, along with the surface morphology of the worn samples. The wear performance of the P coatings is summarized in Table 4. As shown in Figure 13a, P05 exhibited the lowest weight loss, about 91.3% and 44.2% lower than that of Q235 steel and P0, respectively. The relative wear resistance (RWR) for each wear specimen was calculated by assuming Q235 steel to have the standard unit of 1. The corresponding values are given in Table 4. Figure 13b reveals large scratches and irregular peeling pits on the P0 sample surface. These peeling particles exacerbated the friction process of three-body wear during the abrasion process. In contrast, shallower furrows and slight peeling existed on the sample surface of the P05 sample, leading to a 79.3% improvement, as shown in Figure 13d. The observed phenomenon can be attributed to the transition of the plastic deformation mechanism to a slight spalling mechanism on the surface of the coating, which is caused by grain refinement. However, with an increase in CNR content to 1 wt.%, the furrows on the surface of the P1 sample became coarser, and large chunks started to peel off, as shown in Figure 13f. The possible reason for this phenomenon is that excessive Ce-rich microparticles present as inclusion had a weaker bonding strength with the matrix within the P coatings, leading to peeling under repeated wear. The peeled high-hardness impurities were retained in the abrasion grooves, becoming fine abrasives that repeatedly scratched the P coating surface in the formed furrows, exacerbating the wear of the P coating surface.

4. Conclusions

The 14Cr2NiSiVMn alloy powder was successfully coated with small amounts of CNRs by low-speed mixing, and the coatings with low preferential grain orientation in different directions were prepared by the PTA technique. The influence of CNRs on the microstructure and mechanical properties of P coatings in various orientations was investigated, with a focus on their refinement and heterogeneous nucleation effects. The following conclusions are drawn:
  • These Ce ions hindered the directional growth of the long-range dendritic solidification structure in the P coatings. Meanwhile, during the rapid solidification process, Ce combined with trace amounts of V and Si elements to form dispersed submicron Ce-rich particles as nucleation sites, promoting equiaxed crystal growth;
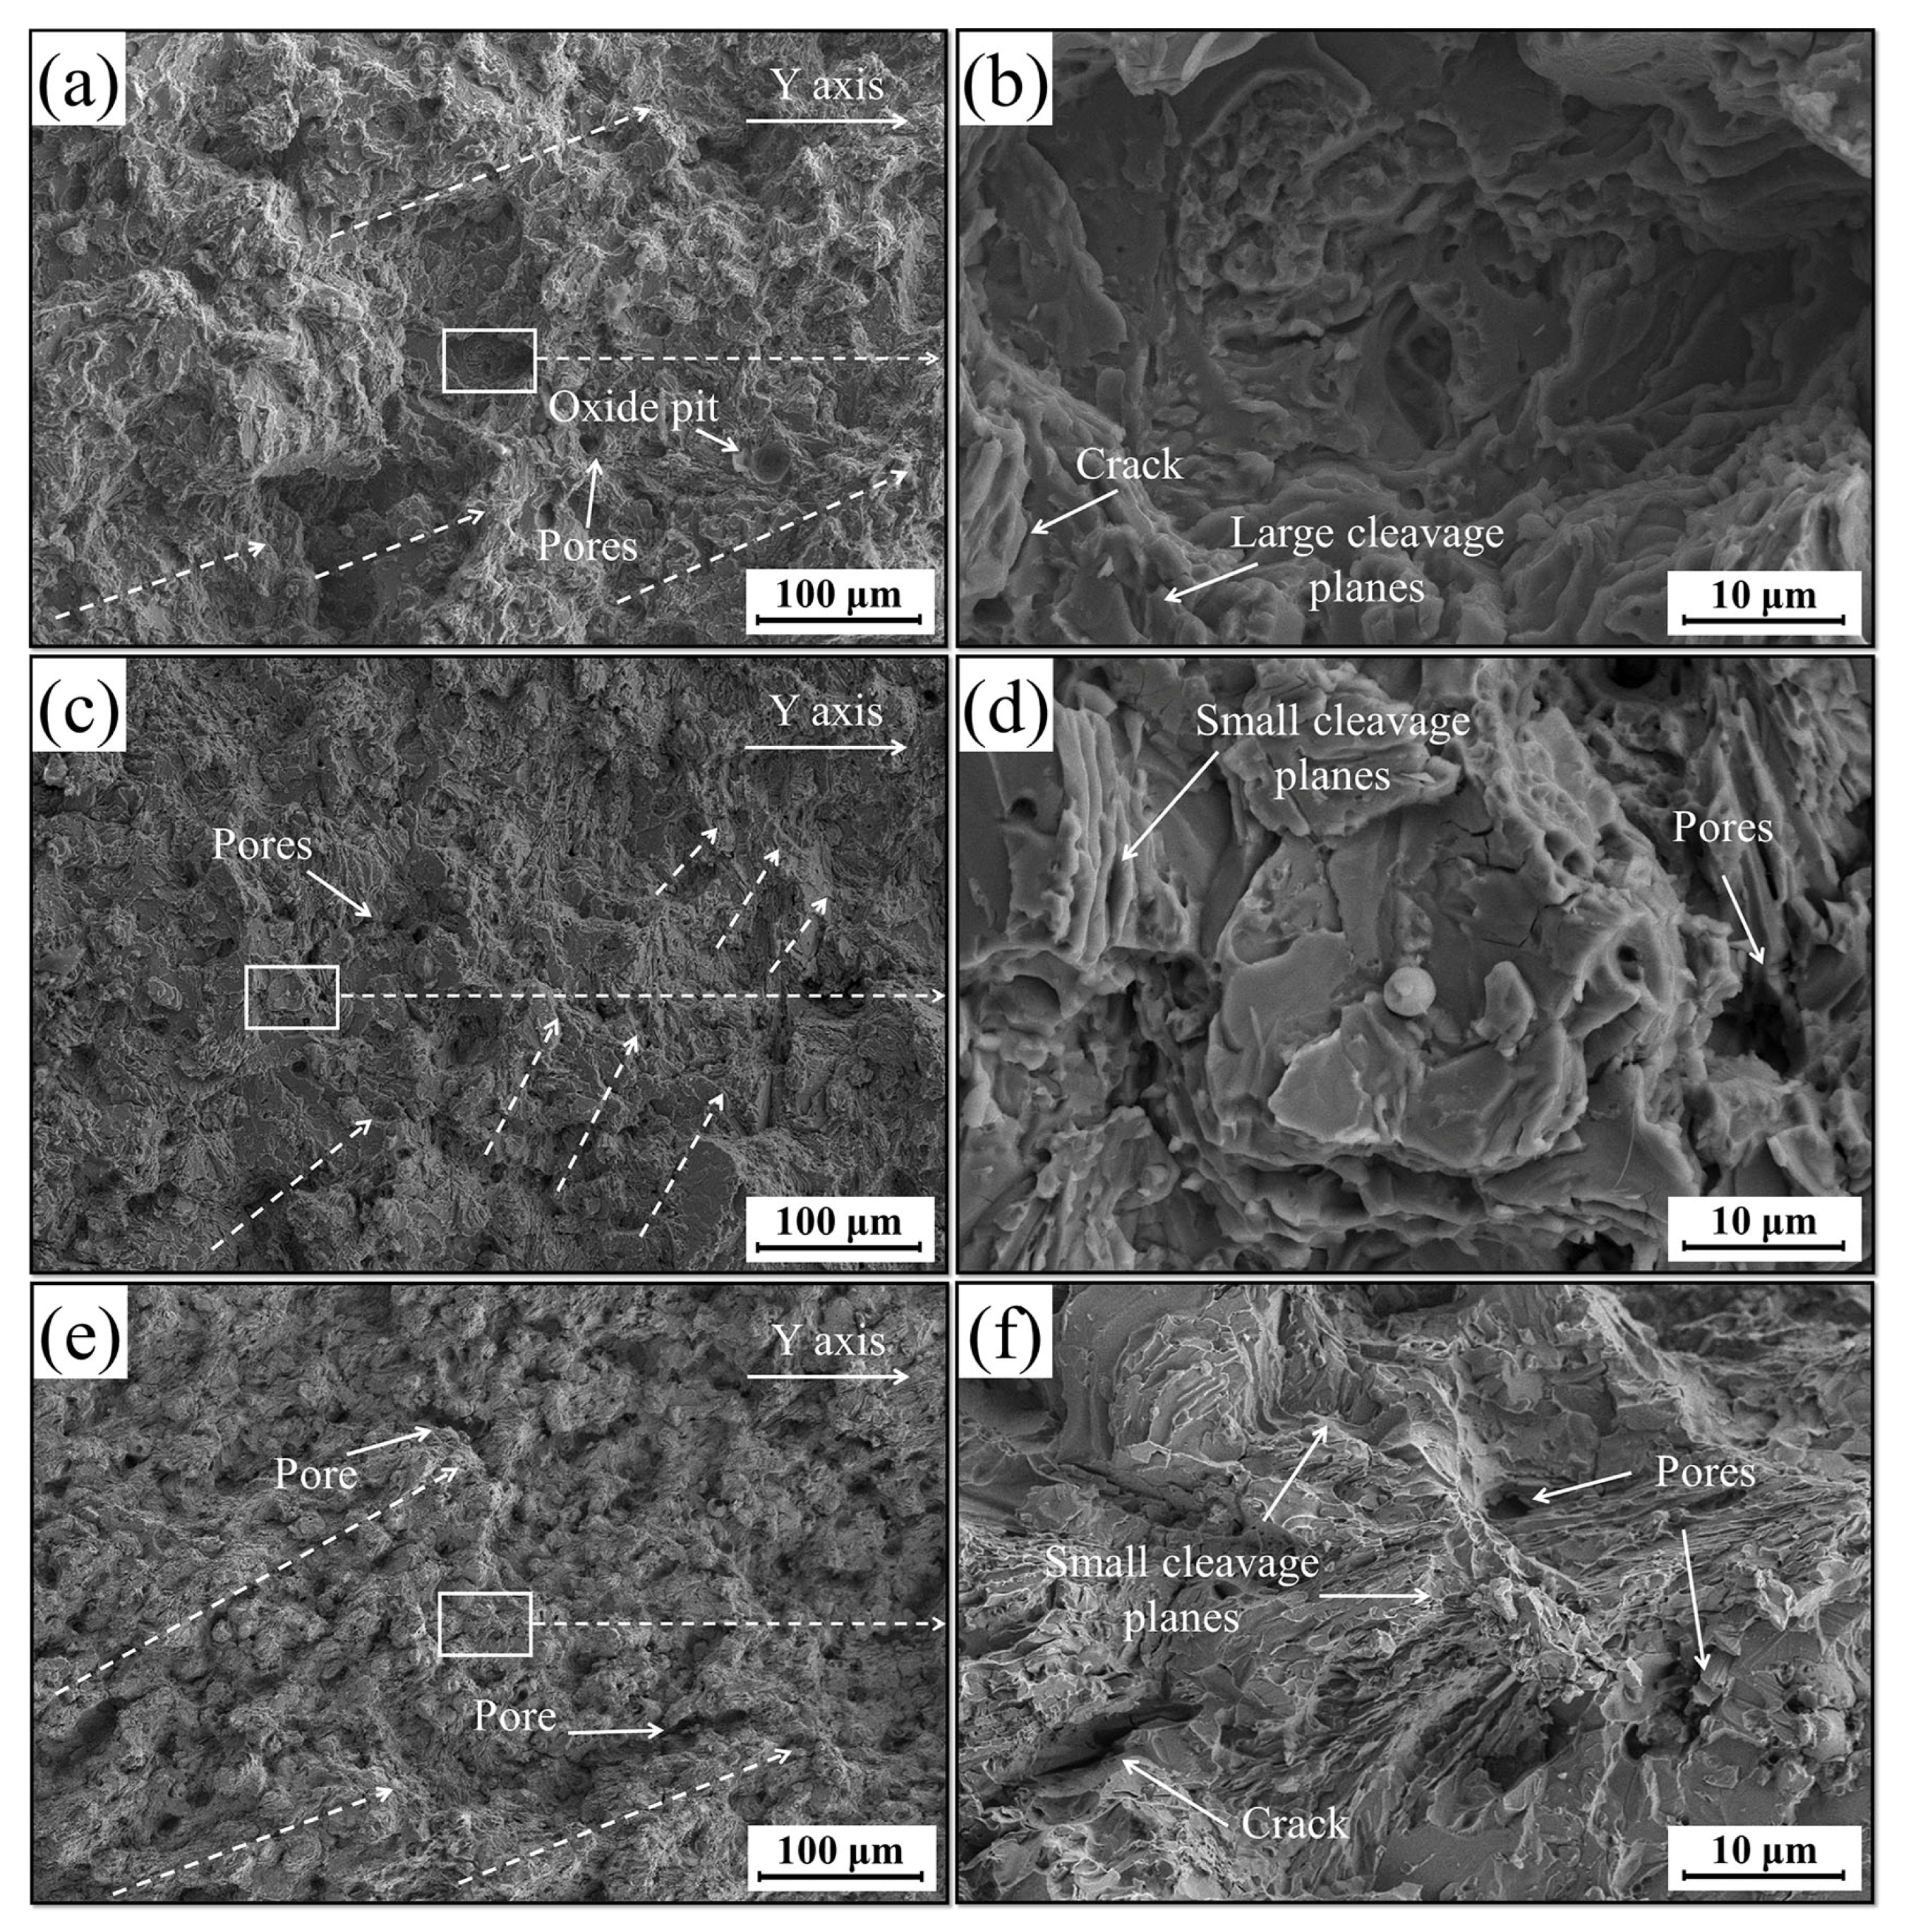
  • With the optimal addition of 0.5 wt.% CNRs, the mechanical properties of the P coating improved significantly. In the deposition direction, the microhardness and tensile strength exhibited respective increases of 20.4% and 97.6%, while the elongation demonstrated an improvement of 59%. There was an 88.1% enhancement in the tensile strength in the perpendicular deposition direction, while the elongation was augmented by 33.9%. Meanwhile, the wear weight loss decreased by 44.2%, accompanied by an augmentation in the relative wear resistance by 79.3%;
  • Excessive CNRs beyond 0.5 wt.% increased the O element content within the P coatings, leading to the formation of inclusions and subsequently causing a decline in their mechanical properties.

Author Contributions

Conceptualization, J.-Y.Y. and P.-C.J.; methodology, J.-Y.Y. and P.-C.J.; software, L.-S.Z.; validation, J.-Y.Y. and P.-C.J.; formal analysis, Y.S.; investigation, L.-S.Z.; resources, Y.S. and F.L.; data curation, J.-Y.Y.; writing—original draft preparation, J.-Y.Y.; writing—review and editing, Y.S., R.-Y.Z. and W.-D.C.; visualization, J.-Y.Y.; supervision, Y.S.; project administration, Y.S.; funding acquisition, Y.S. All authors have read and agreed to the published version of the manuscript.

Funding

This research was funded by the Natural Science Foundation of Inner Mongolia Autonomous Region, grant number 2020LH05017. This research was funded by the Science and Technology Research Project of Inner Mongolia Autonomous Region, grant numbers 2021GG0252 and 2021GG0262.

Data Availability Statement

Where data is unavailable due to privacy or ethical restrictions.

Conflicts of Interest

Author Jun-Yu Yue was employed by the Baotou Research Institute of Rare Earths. The remaining authors declare that the research was conducted in the absence of any commercial or financial relationships.

References

  1. Yu, Y.; Wu, Y.P. Microstructure and wear behavior of the (AlCoCrFeNi)x/(WC–10Co)1−x composite coatings produced via high velocity oxy-fuel thermal spraying. Ceram. Int. 2023, 49, 28560–28570. [Google Scholar] [CrossRef]
  2. Omar, A.; Rehan, A. Influence of Feedstock and Thermal Spray Process on the Phase Composition of Alumina Coatings and Their Sliding Wear. J. Therm. Spray Technol. 2023, 32, 2028–2053. [Google Scholar]
  3. MohammadBagher, S.; Hossein, T. Utilization of Ni-Cu/Al2O3 co-deposition composite coatings on mild steel surface via electroplating method and evaluation of its tribological, electrochemical properties. Surf. Coat. Technol. 2023, 475, 130118. [Google Scholar]
  4. Ullah, Z.A.; Yasir, M.K. A review on laser cladding of high-entropy alloys, their recent trends and potential applications. J. Manuf. Process 2021, 68, 225–273. [Google Scholar]
  5. Liu, Y.A.; Ding, Y. Research and progress of laser cladding on engineering alloys: A review. J. Manuf. Process 2021, 66, 341–363. [Google Scholar] [CrossRef]
  6. Li, Y.; Cui, X.F. Interfacial bonding properties between cobalt-based plasma cladding layer and substrate under tensile conditions. Mater. Des. 2017, 123, 54–63. [Google Scholar] [CrossRef]
  7. Liu, T.Z.; Chang, M. Characteristics of WC reinforced Ni-based alloy coatings prepared by PTA + PMI method. Surf. Coat. Technol. 2020, 383, 125232. [Google Scholar] [CrossRef]
  8. Lai, Y.B.; Wang, D.Y. Influence of Process Parameter on the Residual Stress of the Co-based Alloy Plasma Cladding. Surf. Technol. 2019, 48, 314–321. [Google Scholar]
  9. Zhou, Y.X.; Zhang, J. Microstructure and properties of NiCrBSi coating by plasma cladding on gray cast iron. Surf. Coat. Technol. 2019, 361, 270–279. [Google Scholar] [CrossRef]
  10. Huang, H.H.; Han, G. Characterizing the magnetic memory signals on the surface of plasma transferred arc cladding coating under fatigue loads. J. Magn. Magn. Mater. 2017, 443, 281–286. [Google Scholar] [CrossRef]
  11. Gnyusov, S.F.; Degterev, A.S. The effect of plasma torch weaving on microstructural evolution in multiple-pass plasma-transferred arc Fe-Cr-V-Mo-C coating. Surf. Coat. Technol. 2018, 344, 75–84. [Google Scholar] [CrossRef]
  12. Deng, X.K.; Zhang, G.J. Investigations on microstructure and wear resistance of Fe-Mo alloy coating fabricated by plasma transferred arc cladding. Surf. Coat. Technol. 2018, 350, 480–487. [Google Scholar] [CrossRef]
  13. Li, X.; Lai, Y.B. Process optimization and properties of Fe-Cr-C alloy coating prepared by plasma cladding. Surf. Technol. 2020, 49, 177–184. [Google Scholar]
  14. Zhang, D.K.; Xue, H.B. Effect of Y2O3 on Microstructure and Properties of Fe-Al-Si-B Cladding by Plasma Transferred Arc. Rare Met. Mater. Eng. 2018, 47, 469–473. [Google Scholar]
  15. Sigolo, E.; Soyama, J. Wear resistant coatings of boron-modified stainless steels deposited by Plasma Transferred Arc. Surf. Coat. Technol. 2016, 302, 255–264. [Google Scholar] [CrossRef]
  16. Zhou, Y.C.; Wang, Q.Y. Effect of Cr3C2 content on microstructure and properties of 310 stainless steel coating by PTA welding. Surf. Eng. 2020, 14, 464–471. [Google Scholar] [CrossRef]
  17. Deng, L.; Luo, J.R. Achieving excellent mechanical properties of ODS steel by Y2O3 addition. Mater. Sci. Eng. A 2023, 872, 145008. [Google Scholar] [CrossRef]
  18. Yue, J.Y.; Liu, X.Y. Combined effect of Y2O3 nanoparticles and Si second-phase oxide on microstructure and wear resistance of plasma-clad steel coating. Surf. Coat. Technol. 2020, 403, 126348. [Google Scholar] [CrossRef]
  19. Yue, J.Y.; Sui, Y. Influence of Y Nano-Oxide and Its Secondary Phase on Microstructure, Mechanical Properties, and Wear Behavior of the Stainless Steel Coatings Fabricated by Plasma Transfer Arc. Metals 2022, 12, 942. [Google Scholar] [CrossRef]
  20. Singla, Y.K.; Arora, N. Dry sliding adhesive wear characteristics of Fe-based hard facing alloys with different CeO2 additives—A statistical analysis. Tribol. Int. 2017, 105, 229–240. [Google Scholar] [CrossRef]
  21. Wang, W.J.; Fu, Z.K. The role of lanthanum oxide on wear and contact fatigue damage resistance of laser cladding Fe-based alloy coating under oil lubrication condition. Tribol. Int. 2016, 94, 470–478. [Google Scholar] [CrossRef]
  22. Wang, X.H.; Zhang, M. Microstructure and properties of laser clad TiC+NiCrBSi+rare earth composite coatings. Surf. Coat. Technol. 2002, 161, 195–199. [Google Scholar] [CrossRef]
  23. Quazi, M.M.; Fazal, M.A. Effect of rare earth elements and their oxides on the tribomechanical performance of laser claddings: A review. J. Rare Earths 2016, 34, 549–564. [Google Scholar] [CrossRef]
  24. Li, Q.; Lei, Y. Laser cladding in-situ NbC particle reinforced Fe-based composite coatings with rare earth oxide addition. Surf. Coat. Technol. 2014, 239, 102–107. [Google Scholar] [CrossRef]
  25. Ding, L.; Hu, S.S. Effect of nano-CeO2 on microstructure and wear resistance of Co-based coatings. Surf. Coat. Technol. 2015, 276, 565–572. [Google Scholar] [CrossRef]
  26. Alinger, M.J.; Odette, G.R. On the role of alloy composition and processing parameters in nanocluster formation and dispersion strengthening in nanostructured ferritic alloys. Acta Mater. 2009, 57, 392–406. [Google Scholar] [CrossRef]
  27. Ukai, S.; Ohtsuka, S.; Kaito, T.; Sakasegawa, H.; Chikata, N.; Hayashi, S.; Ohnuki, S. High-temperature strength characterization of advanced 9Cr-ODS ferritic steels. Mater. Sci. Eng. A 2009, 510, 115–120. [Google Scholar]
  28. London, A.J.; Santra, S. Effect of Ti and Cr on dispersion, structure and composition of oxide nano-particles in model ODS alloys. Acta Mater. 2015, 97, 223–233. [Google Scholar] [CrossRef]
  29. Liu, X.Y.; Sui, Y. Laser metal deposited steel alloys with uniform microstructures and improved properties prepared by addition of small amounts of dispersed Y2O3 nanoparticles. Mater. Sci. Eng. A 2021, 806, 140827. [Google Scholar] [CrossRef]
  30. Liu, X.Y.; Sui, Y. Dimension effect of Y2O3 nanomaterial on microstructure and tensile properties of laser metal deposited stainless steel coatings. Surf. Coat. Technol. 2021, 419, 127259. [Google Scholar] [CrossRef]
  31. GB/T 228.1-2021; Metallic Materials—Tensile Testing—Part 1: Method of Test at Room Temperature. Chinese Standard: Beijing, China, 2021.
  32. Zhang, L.S.; Zhang, M. Effects of nano-CeO2 on microstructure and properties of Ni625 alloy prepared by laser cladding. J. Alloys Compd. 2022, 918, 165571. [Google Scholar] [CrossRef]
  33. Yang, C.; Jing, C.N. Effect of CeO2 on the microstructure and properties of AlCoCrFeNi2.1 laser cladding coatings. J. Alloys Compd. 2024, 976, 172948. [Google Scholar] [CrossRef]
  34. Han, G.Y.; Zhang, Y. Effect of the Addition of CeO2 on the Microstructure and Corrosion of in-situ TiB/Ti Composite Coatings Prepared by Laser Cladding Technology. Int. J. Electrochem. Sc. 2021, 2, 16. [Google Scholar] [CrossRef]
  35. Gao, Z.T.; Ren, H.B. Effect of CeO2 on the microstructure and microhardensss of laser-cladded Ni60 on 35CrMoV alloys. Micron 2021, 150, 103146. [Google Scholar] [CrossRef] [PubMed]
  36. Liu, Y.N.; Sun, R.L. Effects of CeO2 on Microstructure and Properties of Tic/ti2ni Reinforced Ti-based Laser Cladding Composite Coatings. Opt. Laser Eng. 2019, 120, 84–94. [Google Scholar]
  37. Wei, C.; Wei, Y.S. Improving Resistance to Crack and Corrosion of Laser-Cladded TiC/Co-based Composite Coatings by Doping Minor CeO2. Int. J. Electrochem. Sci. 2022, 17, 220622. [Google Scholar] [CrossRef]
  38. Lu, Y.Z.; Huang, G.K. Crack-free Fe-based amorphous coating synthesized by laser cladding. Mater. Lett. 2017, 210, 46–50. [Google Scholar] [CrossRef]
  39. Fatih, D.G.; Erhan, D.R. Tribology Study of Pulse Electrodeposited Ni-B-SWCNT Composite Coating. TMS 2022, 74, 574–583. [Google Scholar]
  40. Sheng, L.Y.; Xiao, Y.N. Influence of layer number on microstructure, mechanical properties and wear behavior of the TiN/Ti multilayer coatings fabricated by high-power magnetron sputtering deposition. J. Manuf. Process 2021, 70, 529–542. [Google Scholar] [CrossRef]
  41. Zhang, Z.Y.; Lu, X.C. Rare earth effect on microstructure, mechanical and tribological properties of CoCrW coatings. Mater. Sci. Eng. C 2007, A444, 92–98. [Google Scholar] [CrossRef]
  42. Zhang, Z.Y.; Lu, X.C. Rare earth effect on the microstructure and wear resistance of Ni-based coatings. Mater. Sci. Eng. A 2007, 454–455, 194–202. [Google Scholar] [CrossRef]
Figure 1. (a) SEM image of 14CrSiVMn alloy powder, (b) enlarged image of (a), (c) morphologies of CeO2 nanorods, and (d) surface of 14CrSiVMn powder covered with 0.5 wt.% CeO2 nanorods.
Coatings 14 00713 g001
Figure 2. (a) Location of tensile specimens extracted from the coatings, and (b) schematic illustration of tensile specimens.
Coatings 14 00713 g002
Figure 3. The cross-sectional (Y-Z direction) morphologies of the P coatings: (a) P0, (b) enlarged image of (a), (c) P05, (d) enlarged image of (c), (e) P1, and (f) enlarged image of (e).
Coatings 14 00713 g003
Figure 4. The cross-sectional (X-Z direction) morphologies of the P coatings: (a) P0, (b) enlarged image of (a), (c) P05, (d) enlarged image of (c), (e) P1, and (f) enlarged image of (e).
Coatings 14 00713 g004
Figure 5. XRD spectra and phase composition of the P coatings: (a) XRD spectra range from 20° to 80°, and (b) XRD spectra range from 20° to 30°.
Coatings 14 00713 g005
Figure 6. Map scanning image and the element composition of the secondary phase: (a) P0, (b) P05, and (c) P1.
Coatings 14 00713 g006
Figure 7. (a) STEM-EDS mapping images of the P05 and (b) SAED patterns of the submicron particles.
Coatings 14 00713 g007
Figure 8. EPMA analysis of the P coatings: (a) P0, (a1) the EPMA signal of Ce in (a), (a2) the EPMA signal of O in (a), (a3) the EPMA signal of V in (a), (a4) the EPMA signal of Si in (a), (b) P05, (b1) the EPMA signal of Ce in (b), (b2) the EPMA signal of O in (b), (b3) the EPMA signal of V in (b), (b4) the EPMA signal of Si in (b), (c) P1, (c1) the EPMA signal of Ce in (c), (c2) the EPMA signal of O in (c), (c3) the EPMA signal of V in (c), and (c4) the EPMA signal of Si in (c).
Coatings 14 00713 g008
Figure 9. The microhardness distribution of the P coatings (Y–Z direction).
Coatings 14 00713 g009
Figure 10. (a) The stress-strain curve (X-axis) of the P coatings, (b) the elongation (X-axis) of the P coatings, (c) the stress-strain curve (Y-axis) of the P coatings, and (d) the elongation (Y-axis) of the P coatings.
Coatings 14 00713 g010
Figure 11. SEM morphology of fracture of the tensile specimen (X-axis) of the P coatings: (a) P0, (b) enlarged image of (a), (c) P05, (d) enlarged image of (c), (e) P1, and (f) Enlarged image of (e).
Coatings 14 00713 g011
Figure 12. Wear surface image of P coatings: (a) P0, (b) P025, (c) P05, (d) P075, and (e) P1.
Coatings 14 00713 g012
Figure 13. (a) Weight loss wear cycle curves, Worn surface image of P coatings: (b) P0, (c) P025, (d) P05, (e) P075, and (f) P1.
Coatings 14 00713 g013
Table 1. Experimental process parameters.
ELParameter
Arc length (mm)10
Current (A)175
Plasma gas flow (L/s)0.1
Protective gas flow (L/s)0.12
Feeding gas flow (L/s)0.1
Powder feeding rate (mg/s)400
Scanning velocity (mm/s)1
Overlap (%)40
Table 2. Ce and O element content of the P coatings.
P0P025P05P075P1
Ce (wt.%)00.0380.0400.0440.046
O (wt.%)0.0110.0210.0230.0260.027
Table 3. Summarizes the mechanical properties of the various P coatings.
Coating ConditionAverage Hardness Values (HV0.1)Tensile Strength in X-Axis (MPa)Elongation in X-Axis (%)Elastic Modulus in X-Axis (Gpa)Tensile Strength in Y-Axis (MPa)Elongation in Y-Axis (%)Elastic Modulus in Y-Axis (Gpa)
confidence intervals of 95%(565.28, 691.92)(627.87 989.73)(2.551, 4.225)(135.77, 162.39)(573.34, 932.26)(3.09, 4.09)(73.06, 87.464)
P05596812.89118.25043.0668.03
P02561910213.15147.56063.1778.57
P0567313464.59161.19484.2888.87
P07564010763.34166.38994.1186.67
P16529202.97153.37073.3379.17
Table 4. Variation of wear performance with respect to P coating.
Bare Surface (Q235)P0P025P05P075P1Confidence Intervals of 95%
Weight loss (g)0.16140.02510.02060.0140.0160.0189(0.0103, 0.0259)
Relative wear resistance16.4307.83511.52910.1518.540(7.146, 10.248)
Disclaimer/Publisher’s Note: The statements, opinions and data contained in all publications are solely those of the individual author(s) and contributor(s) and not of MDPI and/or the editor(s). MDPI and/or the editor(s) disclaim responsibility for any injury to people or property resulting from any ideas, methods, instructions or products referred to in the content.

