Article

Experimental Analysis and Wear Prediction Model Based on Friction Heat for Dry Sliding Contact

Harbin University of Commerce, Harbin 150080, China
*
Author to whom correspondence should be addressed.
Coatings 2024, 14(6), 742; https://doi.org/10.3390/coatings14060742
Submission received: 15 May 2024 / Revised: 3 June 2024 / Accepted: 6 June 2024 / Published: 12 June 2024

Abstract

:
In this study, the influence of the frictional heat effect on the degree of wear is explored from the perspectives of initial contact positive pressure and frictional relative slip velocity. Experiments based on a multifunctional friction and wear machine show that the friction temperature increases with an increase in friction relative velocity and initial normal contact load, which exacerbates the frictional thermal expansion and normal load fluctuation, and with the generation of frictional heat, the normal force fluctuates periodically; the wear mass and temperature in the contact area iterate cyclically, which results in the wear mass increasing. 316L stainless steel, 5A06 aluminium alloy and pure titanium are used in the Archard wear model due to their applications in severe wear environments. Since 316L stainless steel, 5A06 aluminium alloy and pure titanium are mostly used in wear-intensive environments, the Archard wear model is optimised based on the frictional heat effect of these three materials, and the accuracy of the improved model in 316L stainless steel, 5A06 aluminium alloy and pure titanium is improved by 52.6%, 7.4% and 23.9%, respectively, when compared with the conventional model. This study lays a theoretical foundation for the wear prediction models of 316L stainless steel, 5A06 aluminium alloy and pure titanium.

1. Introduction

Nowadays, frictional wear can bring severe consequences to fields such as aviation and healthcare, etc. [1,2,3], because it can reduce the precision and working life of components, so predicting the wear degree of components is essential. In the mid-1950s, J.F. Archard [4] found that the wear rate is positively correlated with the load in experiments of frictional wear and expounded the relationship of wear mass with material hardness, load, and slip distance as:
V = K H P s
where V denotes the wear mass; K and H represent the wear coefficient and the hardness of materials, respectively; P and s represent the load and the relative slip distance, respectively. Currently, there exist commonly used wear equations in the field of tribology, including the Cattaneo–Mindlin model, the Lim–Ashby model, the Rabinowicz wear model and the Archard wear equation. The Cattaneo–Mindlin model [5] is used to describe the contact problem on solid surfaces, especially when elastic deformation and sliding between the contacting surfaces are taken into account. Sliding between the contact surfaces has important applications. Since the Cattaneo–Mindlin model takes into account small sliding effects, the computational process is relatively complex and requires high computational costs, so a large amount of experimental data or validation is required to determine the parameters in the model, which limits the scope of application for the model. The Lim–Ashby model is an empirical model for describing the wear behaviour of a material, which is based on the material properties’ parameters such as the material hardness and elastic modulus to predict the wear behaviour of a material. The material property parameters are used to predict the wear rate of the material, whereas the Lim–Ashby model [6] considers only some of the material property parameters and may have limitations for complex wear mechanisms and specific working conditions. Rabinowicz’s wear model [7] is an empirical model used to describe friction and wear phenomena. The model is based on parameters, such as contact pressure, sliding velocity and material hardness of the friction surfaces, and is used to predict the wear rate and life, whereas the model is based on some simplifying assumptions, such as uniform contact pressure distribution, which may lead to deviations from the actual situation. So, many workers in the field of tribology predict the working life of components using the Archard wear equation. For example, Guangwei Yu [8] predicted the service life of deep groove ball bearings based on Archard wear theory.
However, some workers in this field pointed out that the factors in the wear equation proposed by J.F. Archard are comprehensive enough. Arvin Taghizadeh Tabrizi et al. [9] indicated that the effect of surface modification was not considered in this equation. According to their studies, the hardness of materials is a fixed value, only involving the hardness of soft surfaces but not that of hard ones. In addition, the authors, who conducted the pin-on-disc wear test after performing the surface modification of titanium by plasma chemical vapor deposition, pointed out that the wear mass is also related to roughness, hardness of soft and hard surfaces, surface roughness and irregular slope. Yanfei Liu et al. [10] put forward that the surface could be damaged during the micromotion of two objects, thus resulting in a tribologically transformed structure (TTS) on their surfaces. The authors adopted alumina balls for the micro-motion experiment on 316L stainless steel, pure copper and Ti6Al4V, based on which, they indicated that the dynamic change in the TTS layer was not considered in the Archard equation and proposed an optimized Archard model consequently.
Tobias Dyck et al. [11] described the available wear mass of hemispheres and U shapes numerically and established a wear model based on the horizontal distribution of Archard work intensity. As indicated, the surface hardness depended on base materials, as well as bottom and surface courses. Moreover, they discussed the optimization of the Archard equation using theoretical and experimental methods. Generally, scholars optimized the wear equation from the perspective of material hardness, which, in their opinion, could not be constant throughout the process of frictional wear. However, in these studies, they failed to consider the influence of frictional thermal expansion, namely the local expansion of contact materials caused by frictional heat on external load and wear mass.
Wear arises from complex chemical and physical processes, with many key parameters (including sliding velocity, ambient or local temperature [12], applied pressure [13], surface roughness [14]) appearing in a variety of forms (e.g., adhesive wear, abrasive wear, surface fatigue, micromotion wear, erosive wear, corrosive and oxidative wear). Wear consists of many complex mechanisms [15], including contact, friction, inelastic deformation, etc., which make wear a very complex phenomenon. Frictional thermal expansion greatly impacts the mechanical properties of components in the wear process [16]. As the temperature rises, such expansion will become more significant, and the contact load will change more evidently, thus intensifying the wear degree, which cannot be neglected. At present, nevertheless, no reliable wear model has been established to tackle this problem. To fill this gap, a frictional wear model based on the frictional heating effect is proposed in this study by optimizing the Archard equation. Meanwhile, a series of experiments are conducted to verify its precision, which plays an essential role in predicting the reliability of this model and the overall tribological properties of components.

2. Proposal of a Wear Model Based on the Frictional Heating Effect

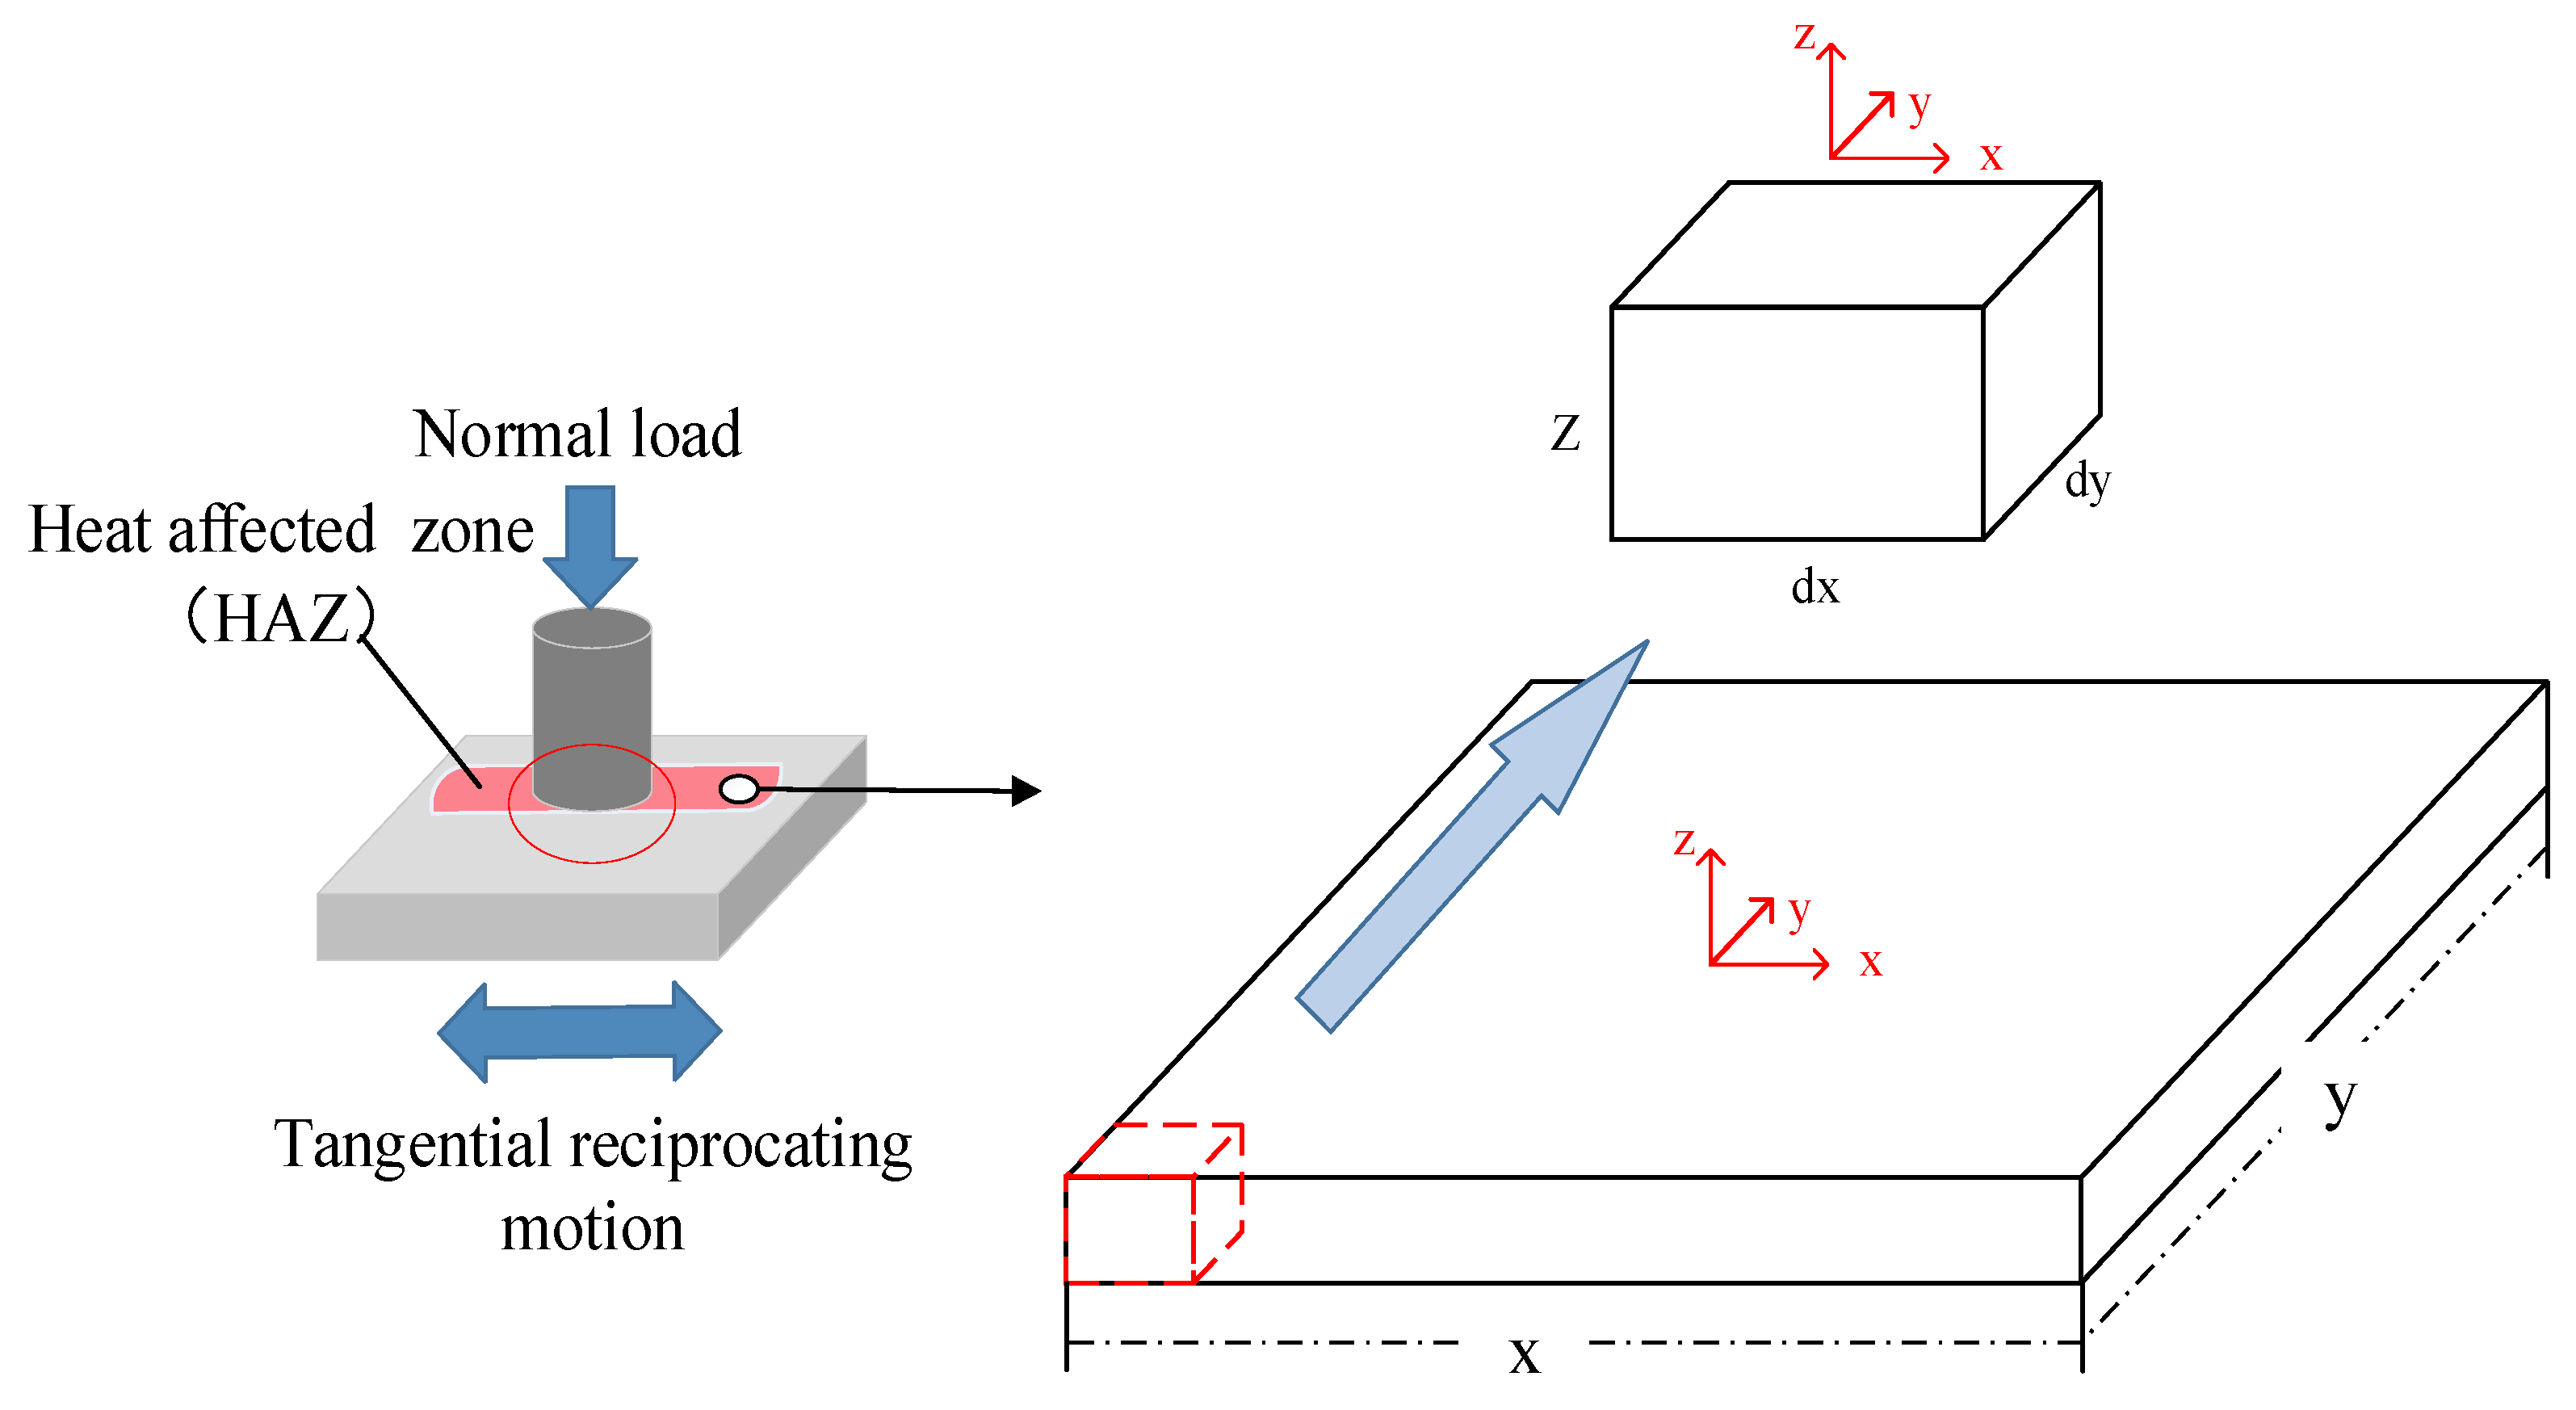
We believe that friction will lead to a heat-affected zone under the action of normal load and reciprocating motion (Figure 1a). Due to the additional pressure of thermal expansion generated in the contact area of such expansion (Figure 1b), the contact pressure and temperature will increase in this area, resulting in a relatively high-temperature zone (Figure 1c), which, under the effect of thermal expansion at elevated temperatures, will be worn rapidly (Figure 1d). At this point, the new contact temperature of this area will be higher than the initial one, and the normal contact load will be higher than the initial positive contact pressure due to thermal expansion. Then, after repeating the steps in Figure 1b–d on this basis, the temperature and degree of wear in the contact area increase dramatically with the number of iterative cycles.
On this basis, a model for wear prediction was proposed based on the frictional heating effect in this study:
K = H M P 0 + n = 1 n L ρ 0 y 0 x Δ P n d s     1 H M Δ T α E S + P 0 L ρ                       ( 2 )
In this equation, H represents the hardness of materials; M represents the wear mass; P0 represents the initial contact pressure; ΔPn represents the increment in contact pressure within n dt periods; ΔT represents the temperature difference; α represents the coefficient of thermal expansion; ρ represents the sample density; Z represents the sample length; E represents the elasticity modulus; S represents the contact area; and L represents the relative slip distance. Equation (1) is used when the temperature difference is unknown, while Equation (2) is used when this difference is known.
The derivation is mainly carried out as per the following steps. First, the heat-affected zone in Figure 1 is considered to be regular, as shown in Figure 2. Then, the micro-unit is extracted with a height of Z, a length of dx, and a width of dy. In addition, the change in positive contact pressure within the dt period is considered in this micro-unit, and the equation below shall be made true:
n = t d t
where n represents the positive integer; t represents the friction time; and dt represents the micro-unit of t, with its value close to zero. Thus, we can obtain the energy consumed when the frictional work is converted into a heat source:
Q = P 0 μ t V t d t γ
In this equation, Q represents the heat energy; P0 represents the initial positive contact pressure; μ t represents the time function of friction coefficient; V(t) represents the time function of relative slip velocity; and γ represents the conversion factor of frictional work into heat energy. Thus, the temperature rise can be expressed as:
Δ T = Q C m e
where Δ T represents the temperature rise; C represents the specific heat capacity; and m e represents the mass of the heat-affected zone. Thus, we can obtain the distance of thermal expansion in the Z direction:
Δ l = Δ T α Z
where Δ l represents the strain in the Z direction; α represents the coefficient of thermal expansion in this direction; and Z represents the original length of friction parts. The strain in the Z direction is:
ε = Δ T α
Thus, we can obtain the increment in normal contact pressure for the micro-unit under the effect of thermal expansion:
Δ P = ε E d x d y
where Δ P represents the increment in normal contact pressure, and E represents the elasticity modulus. Thus, the normal contact pressure of this micro-unit can be expressed as:
P 1 = Δ P 1 + P 0
When the second dt is considered, the following equation can be obtained:
P 2 = Δ P 1 + Δ P 2 + P 0
When the friction time is t, the equation below is used:
P n = n = 1 n Δ P n + P 0  
Therefore, by considering the whole heat-affected zone, we can obtain the following equation:
d s = d x d y
P c o r r e c t i o n = P 0 + n = 1 n 0 y 0 x Δ P n d s  
At this point, the modified wear model is expressed as:
K = H M P c o r r e c t i o n L ρ
where K represents the wear coefficient; H represents the hardness of materials; M represents the wear mass; L represents the relative slip distance; and ρ represents the density of wearing parts.
The simplified equation below can be used when the temperature difference before and after the friction is known:
M = K Δ T α E S + P 0 L H
As mentioned above, this is suitable for dry friction and under heavy load. For electrical contact, theoretically, Equation (4) can add Joule heat:
Q = P 0 μ t V t + I 2   R t d t γ
In this equation, Q represents the heat energy; P0 represents the initial positive contact pressure; μ t represents the time function of friction coefficient; V(t) represents the time function of relative slip velocity; I represents the current; R(t) represents the temperature function of resistance; and γ represents the conversion factor of energy into heat. In this study, due to the limitation of experimental conditions, only dry friction is studied, so the heat energy is described in Equation (4).

Experimental Settings

After a large number of pre-experiments and related studies, 16 sets of friction and wear experiments are designed in this section to verify the accuracy of the above wear equations. This study includes three common engineering materials: 316L stainless steel, pure titanium and 5A06 aluminium alloy. Their dimensions are 20 mm × 20 mm × 5 mm, the upper specimen is a cylinder of stainless steel (stainless-steel cylinder diameter of 6 mm), the lower specimens are 316L stainless steel, pure titanium and 5A06 aluminium alloy, the top and bottom specimens are sanded with 800-mesh, 1000-mesh and 2000-mesh sandpaper. Following this, the surface was polished to a roughness of Ra < 0.8 μm. The upper and lower specimens were polished with 800-mesh, 1000-mesh and 2000-mesh sandpaper, respectively, and then the surface was polished to a roughness of Ra < 0.8 μm and finally cleaned with deionised water and acetone. It was then placed in the air to dry naturally.
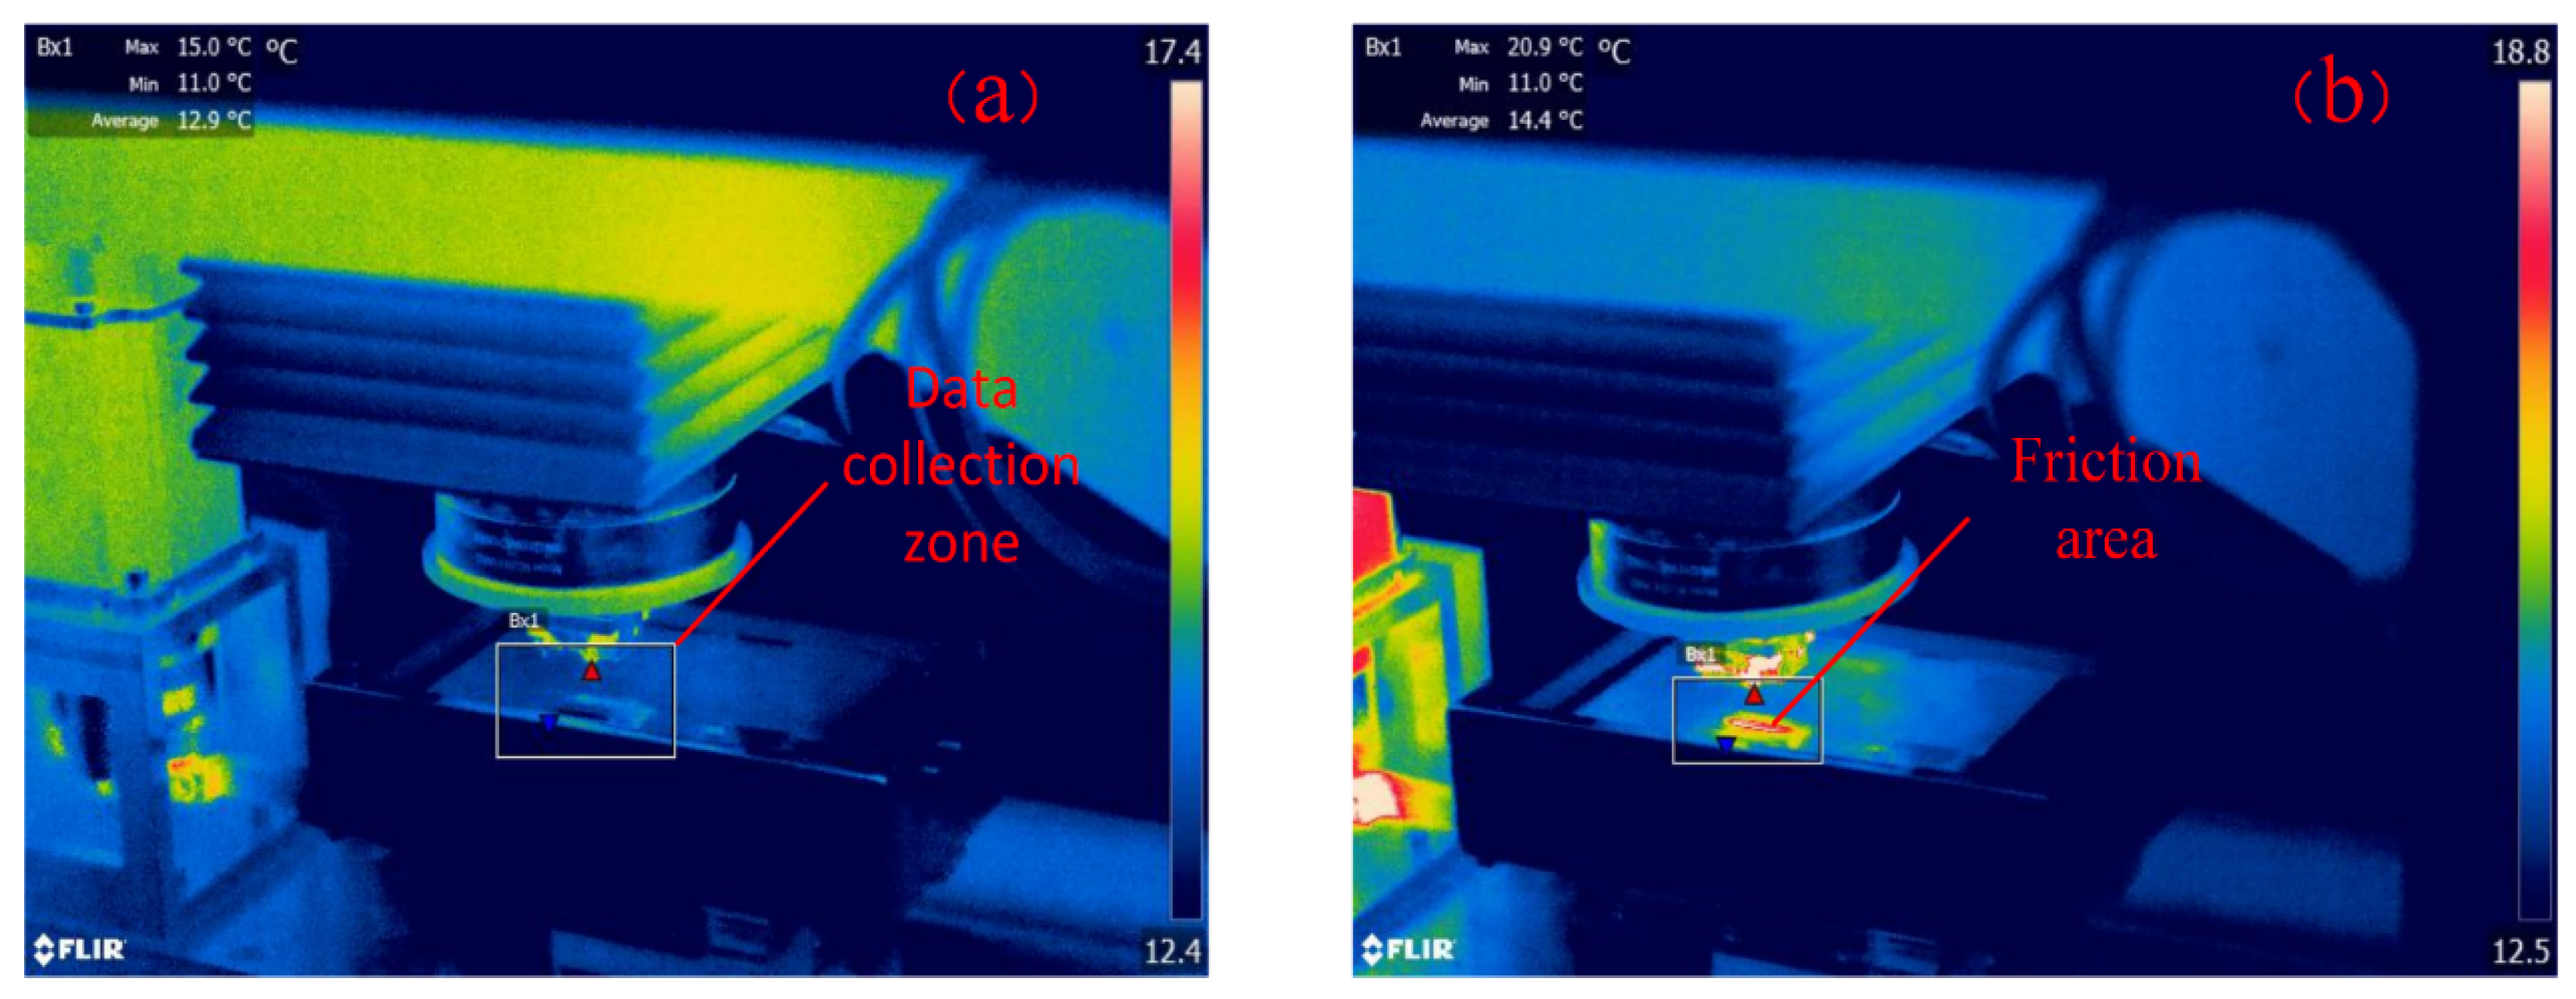
In this study, the system for the friction experiment includes an FTM M30 frictional wear tester, FLIR A615 high-precision thermal infrared imager (Wilsonville, OR, USA) and BSM-220.4 0.1 mg electronic balance (Petra Mechatronics, Dubai, United Arab Emirates). One of the FLIR sensors (temperature range −10° to 150°) has an accuracy of 0.01% FS of the instrumental accuracy. Before the experiment, ultrasonic cleaning was performed, and the mass of the wearing parts (m0) was measured. Then, the high-precision thermal infrared imager was placed in the position shown in Figure 3a; its operating platform was set with an area for temperature detection in Figure 4a to read the highest temperature of the friction zone in real time, as presented in Figure 4b. In this experiment, samples and pins were fixed onto the reciprocating and Y-stroke modules, respectively (Figure 3b).
Then, the reciprocating platform’s parameters, including reciprocating frequency and stroke, initial positive contact pressure and friction time, were set on the platform for the frictional wear experiment. The principle is illustrated in Figure 3c. Pins were moved in the negative direction of Y. Then, when these pins almost touched the samples, they were pressed down constantly at a very low speed till the specific value on the normal force sensor reached the preset initial contact pressure. At this point, the reciprocating module began to run. While samples and pins rubbed against each other, the tangential and normal force fluctuations were measured by tangential and normal force sensors, respectively. The experiments were carried out at room temperature and after friction, ultrasonic cleaning was carried out to measure the mass of the worn mass (mend) and, finally, the mass of the worn mass (m0mend) to ensure the accuracy of the measured mass.
In this study, ten sets of experiments were carried out on 316L stainless steel according to the parameters in Table 1 and Table 2, and the average values were obtained to ensure the reliability of the experiments in order to investigate the influence of friction velocity and initial normal load on the frictional heating effect. In addition, three sets of experiments on 316L stainless steel, pure titanium and 5A06 aluminium alloy were also carried out under the conditions listed in Table 3 and averaged to investigate how the thermal expansion caused by this effect affects the normal contact load and wear quality of the different materials.

3. Results and Discussion

3.1. Influence of the Initial Positive Contact Pressure on Frictional Heat and Wear Mass

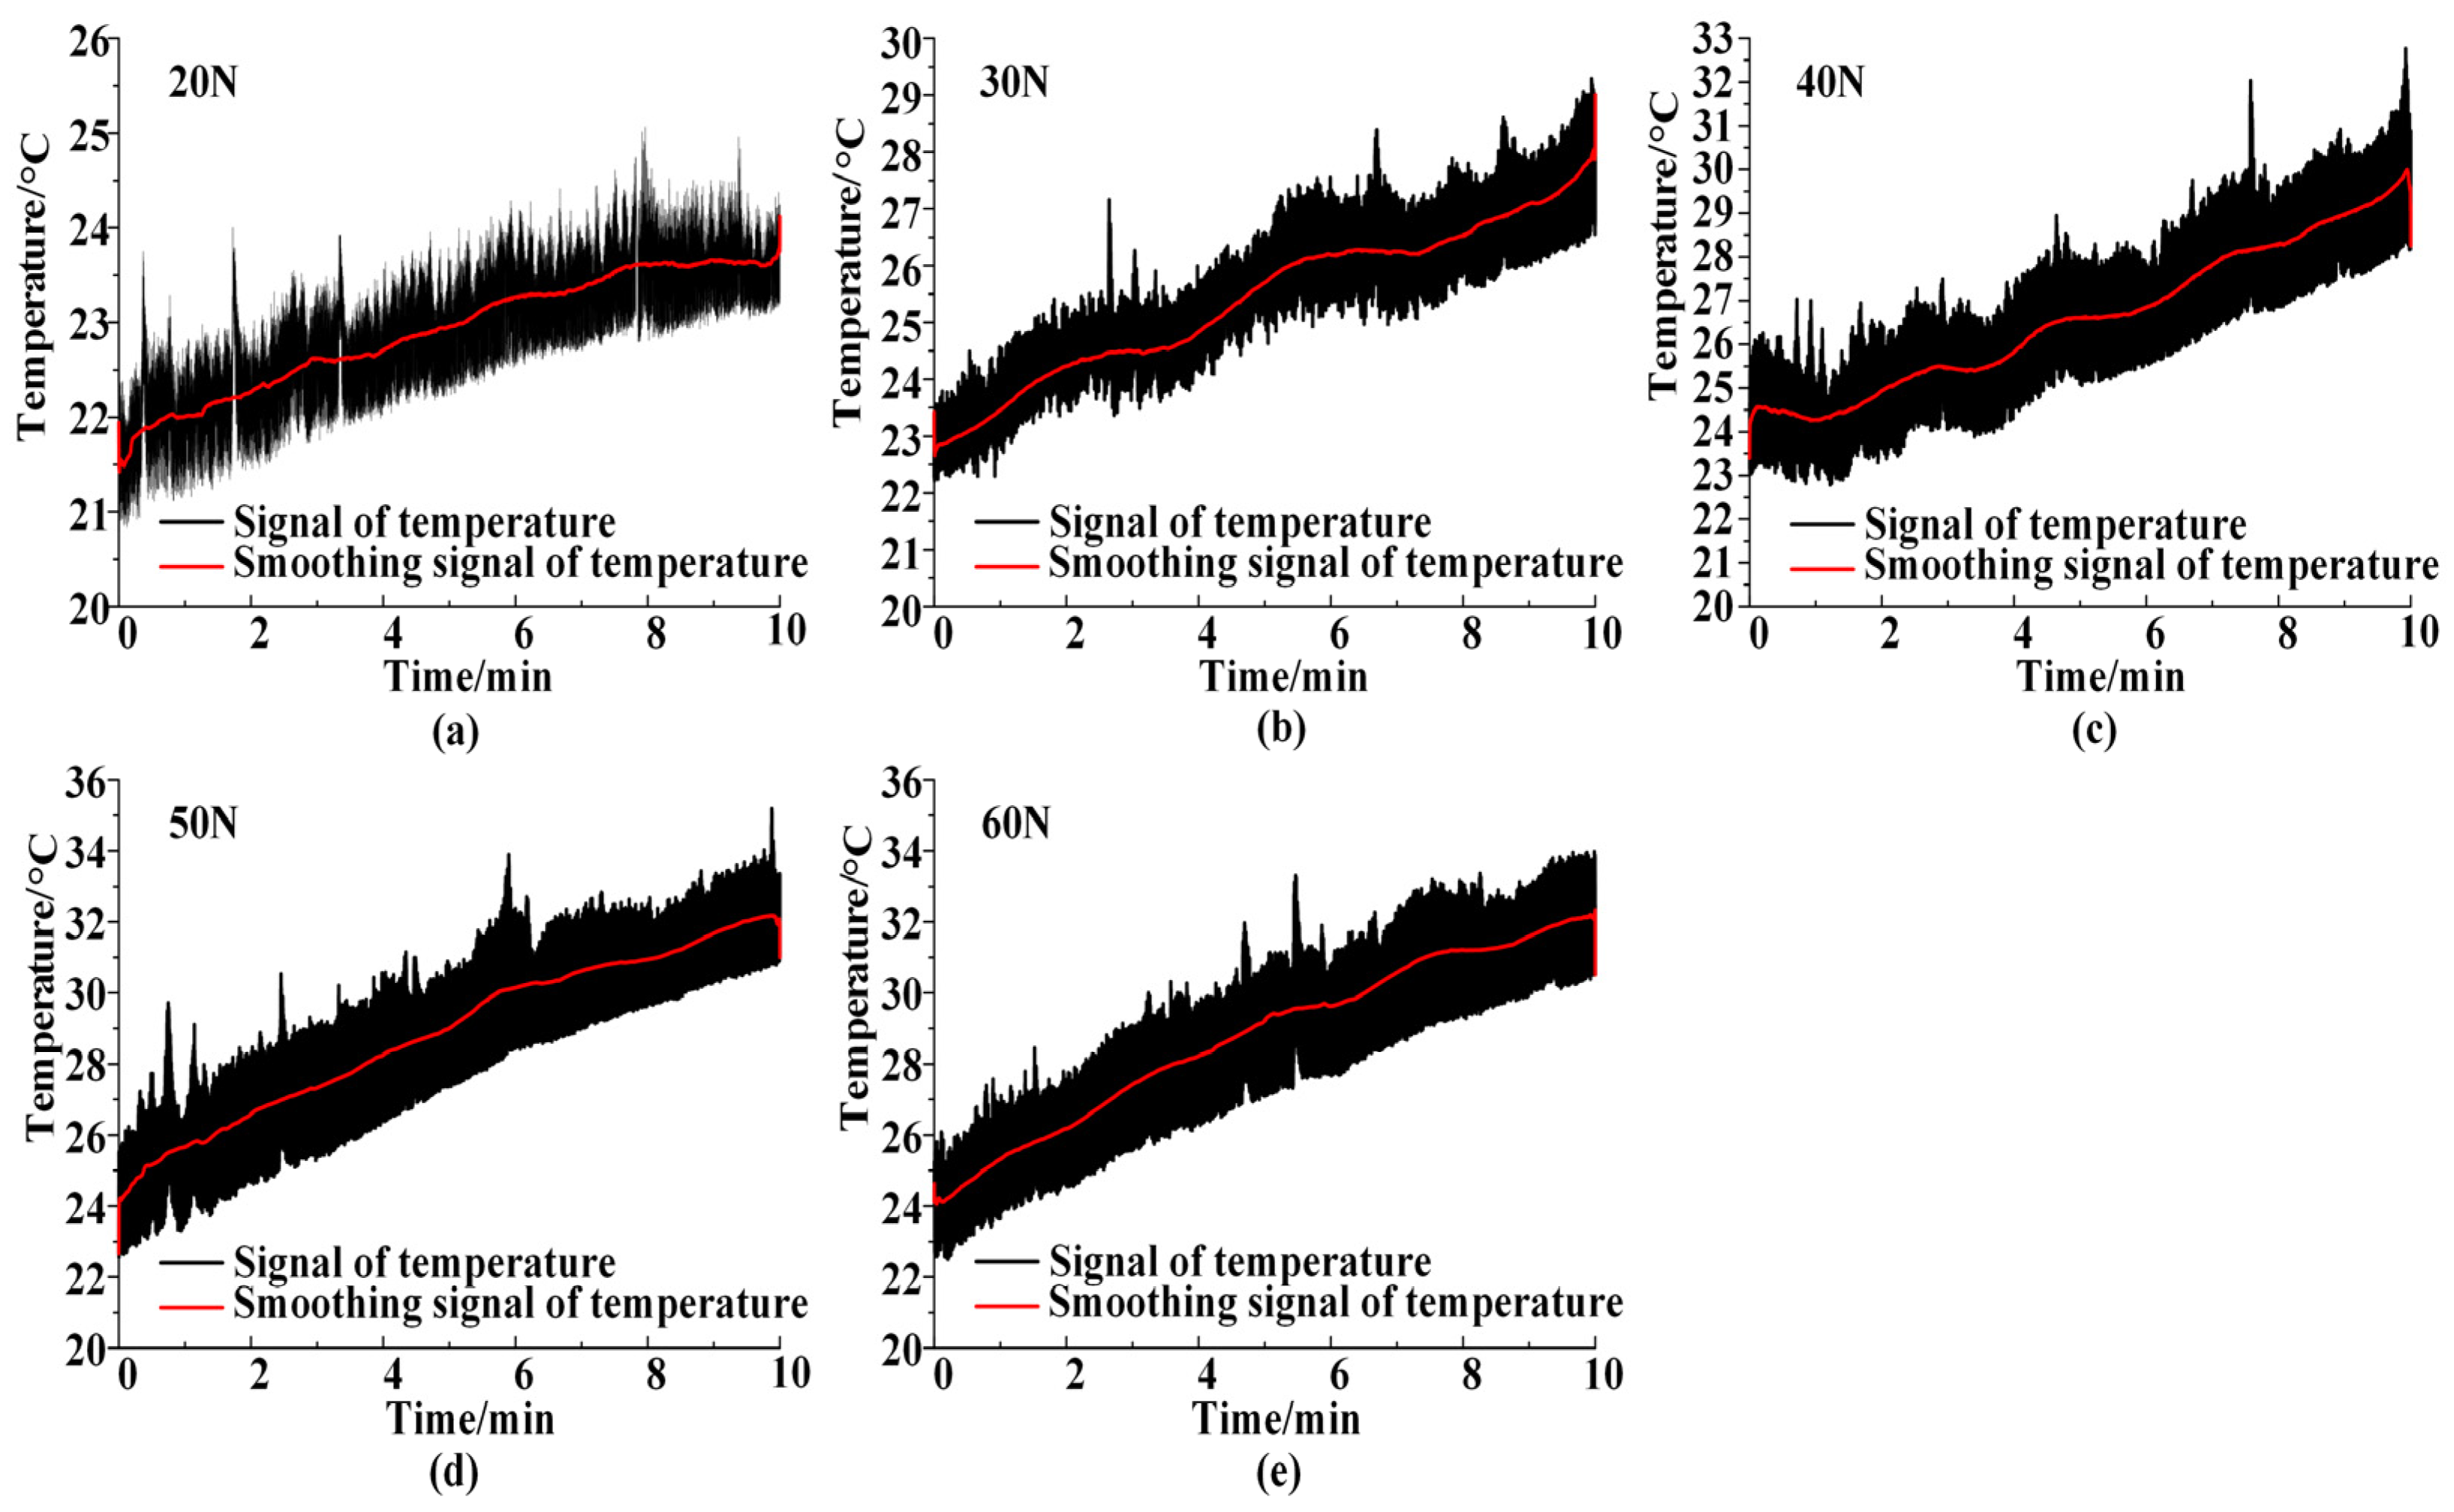
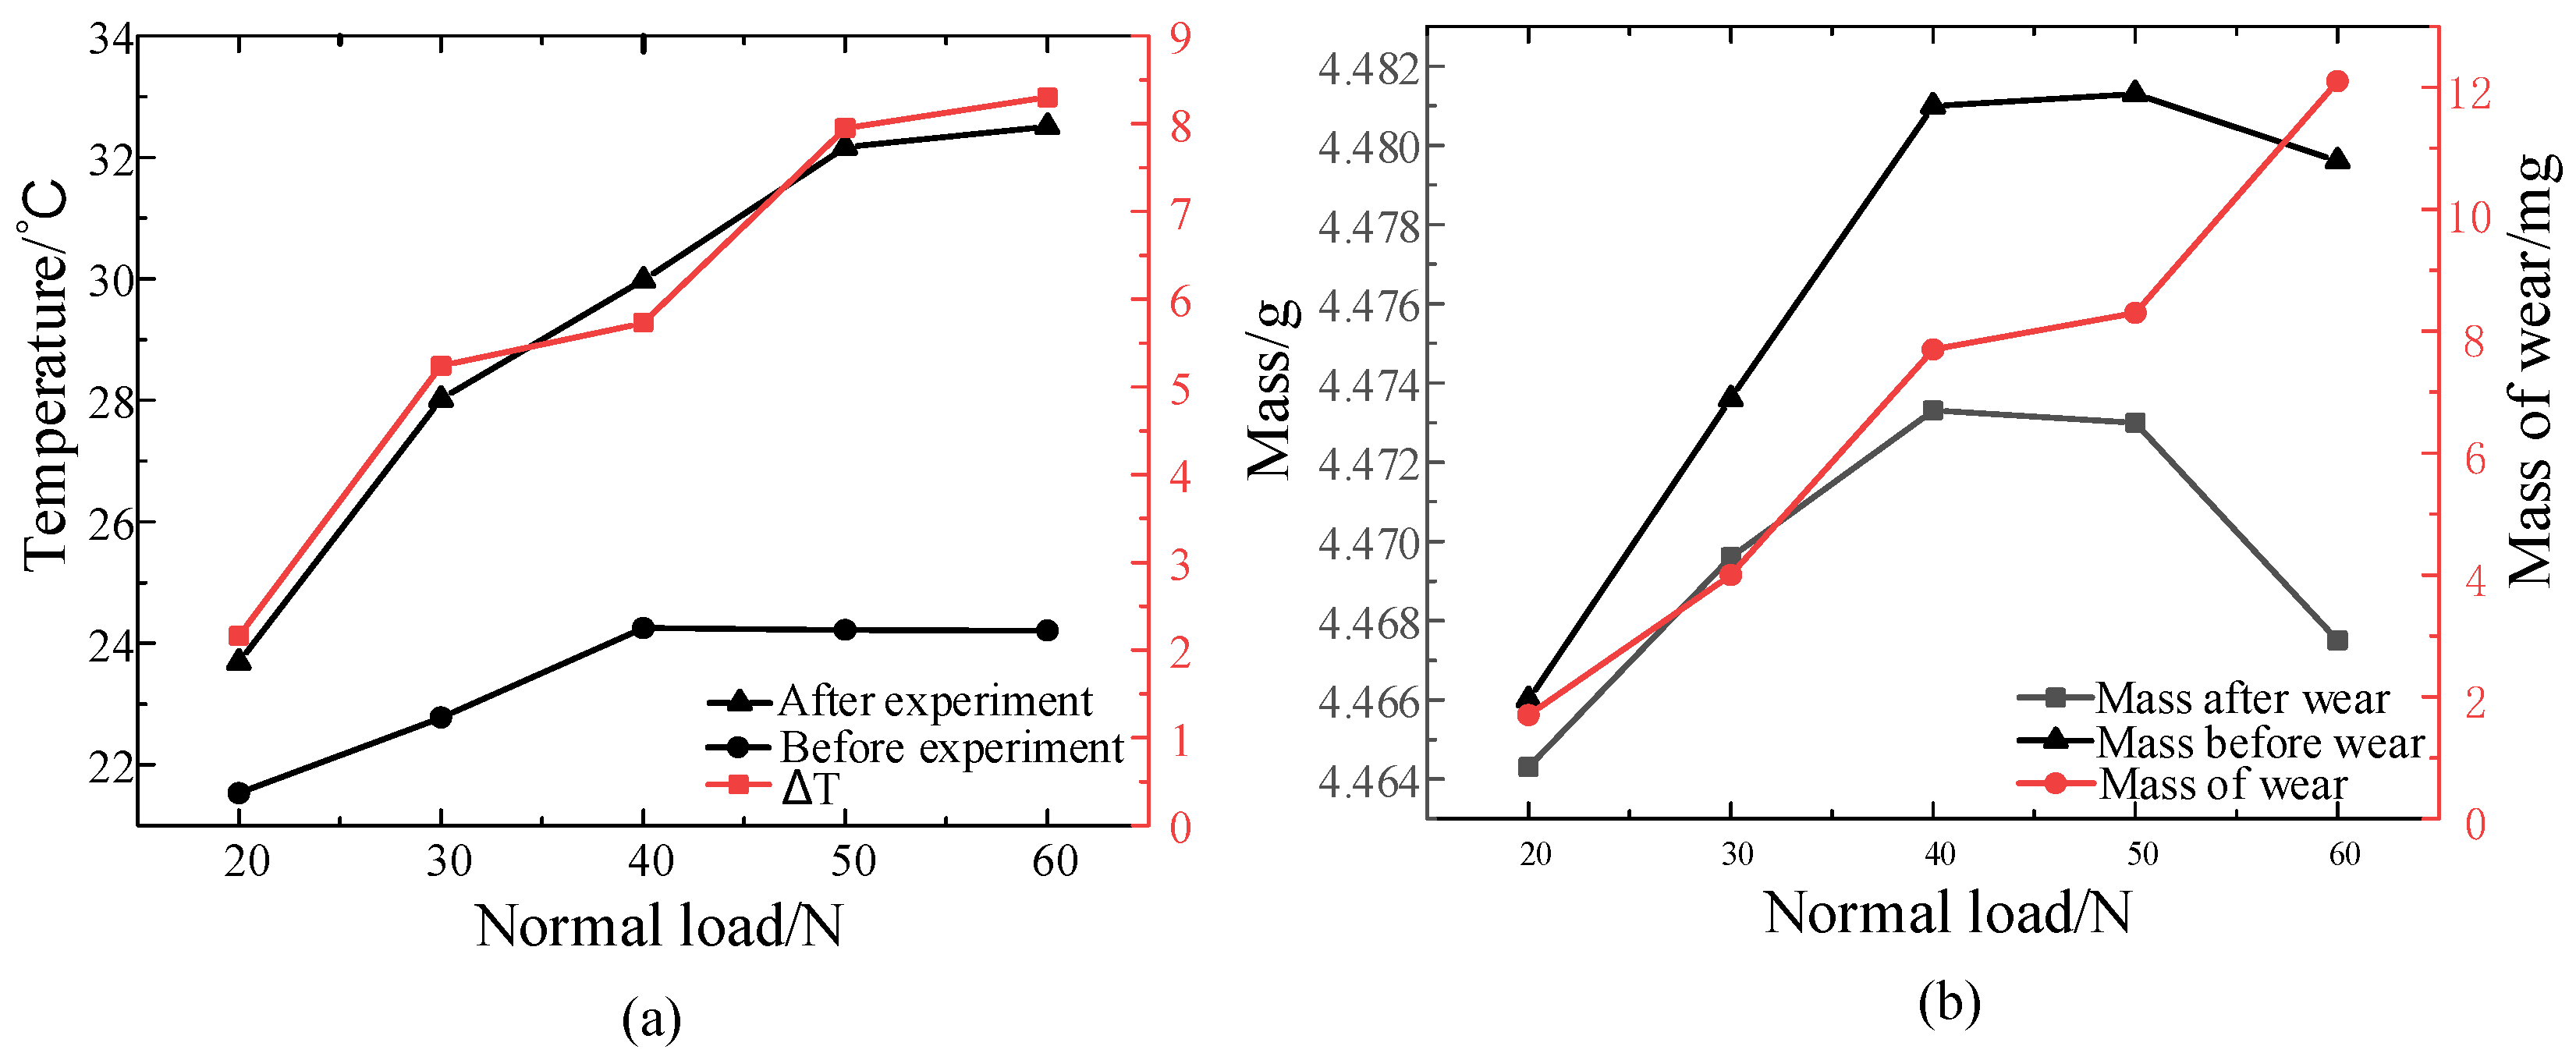
A time–history curve was made for the frictional temperature of 316L stainless steel under different initial positive contact pressures (20 N, 30 N, 40 N, 50 N and 60 N), as shown in Figure 5. Meanwhile, it was smoothed by the neighbourhood averaging method and is presented by the red curve in Figure 5. In the experiment, the reciprocating frequency was set at 10 Hz, and the friction time was controlled at 10 min. It could be seen that the temperature in the friction zone increased with the time. According to Figure 6a, the temperature difference before and after the friction became increasingly larger as the initial positive contact pressure increased. This is due to the fact that during friction, the friction surface may undergo localised plastic deformation due to the two surfaces being under high pressure, causing the friction surface to generate deformation heat. This heat from plastic deformation leads to an increase in the temperature of the friction surface. Thereinto, the difference was minimum under pressure of 20 N, with the value being 2.16 °C; those under 30 N and 40 N had values of 5.24 °C and 5.86 °C, respectively; and the differences under 50 N and 60 N were 7.95 °C and 8.3 °C, respectively. As analysed with Equation (1), the frictional heat energy (Q) increased with the positive contact pressure (Fn) and relative slip distance (L). In addition, the temperature difference ( Δ T ) was directly proportional to Q. Therefore, when the reciprocating frequency was constant, the frictional temperature increased with the friction time. That is, the larger the value of s, the higher the temperature. In addition, under the same stroke, the temperature difference increased with the positive contact pressure.
Q = P μ γ
Δ T = Q c m e
In the above equations, Q denotes the frictional heat energy; P is the normal contact pressure; μ represents the friction coefficient; L represents the relative slip distance; γ represents the conversion factor of frictional work into heat energy; Δ T represents the temperature difference; c represents the specific heat capacity; and me represents the mass of the heat-affected zone. As shown in Figure 6b, the wear mass increased with the positive contact pressure, which was particularly prominent under pressure of 20 N, 30 N and 40 N, corresponding to values of 1.7 mg, 4 mg and 7.7 mg. In addition, this mass showed a similar value of 8.3 mg under 50 N and 40 N and reached the highest value of 12 mg under 60 N. Therefore, it was found that the cycle in Figure 1b–d could be intensified when the frictional temperature increased with the positive contact pressure, thus resulting in a higher wear mass.

3.2. Influence of the Reciprocating Frequency on Frictional Heat and Wear Mass

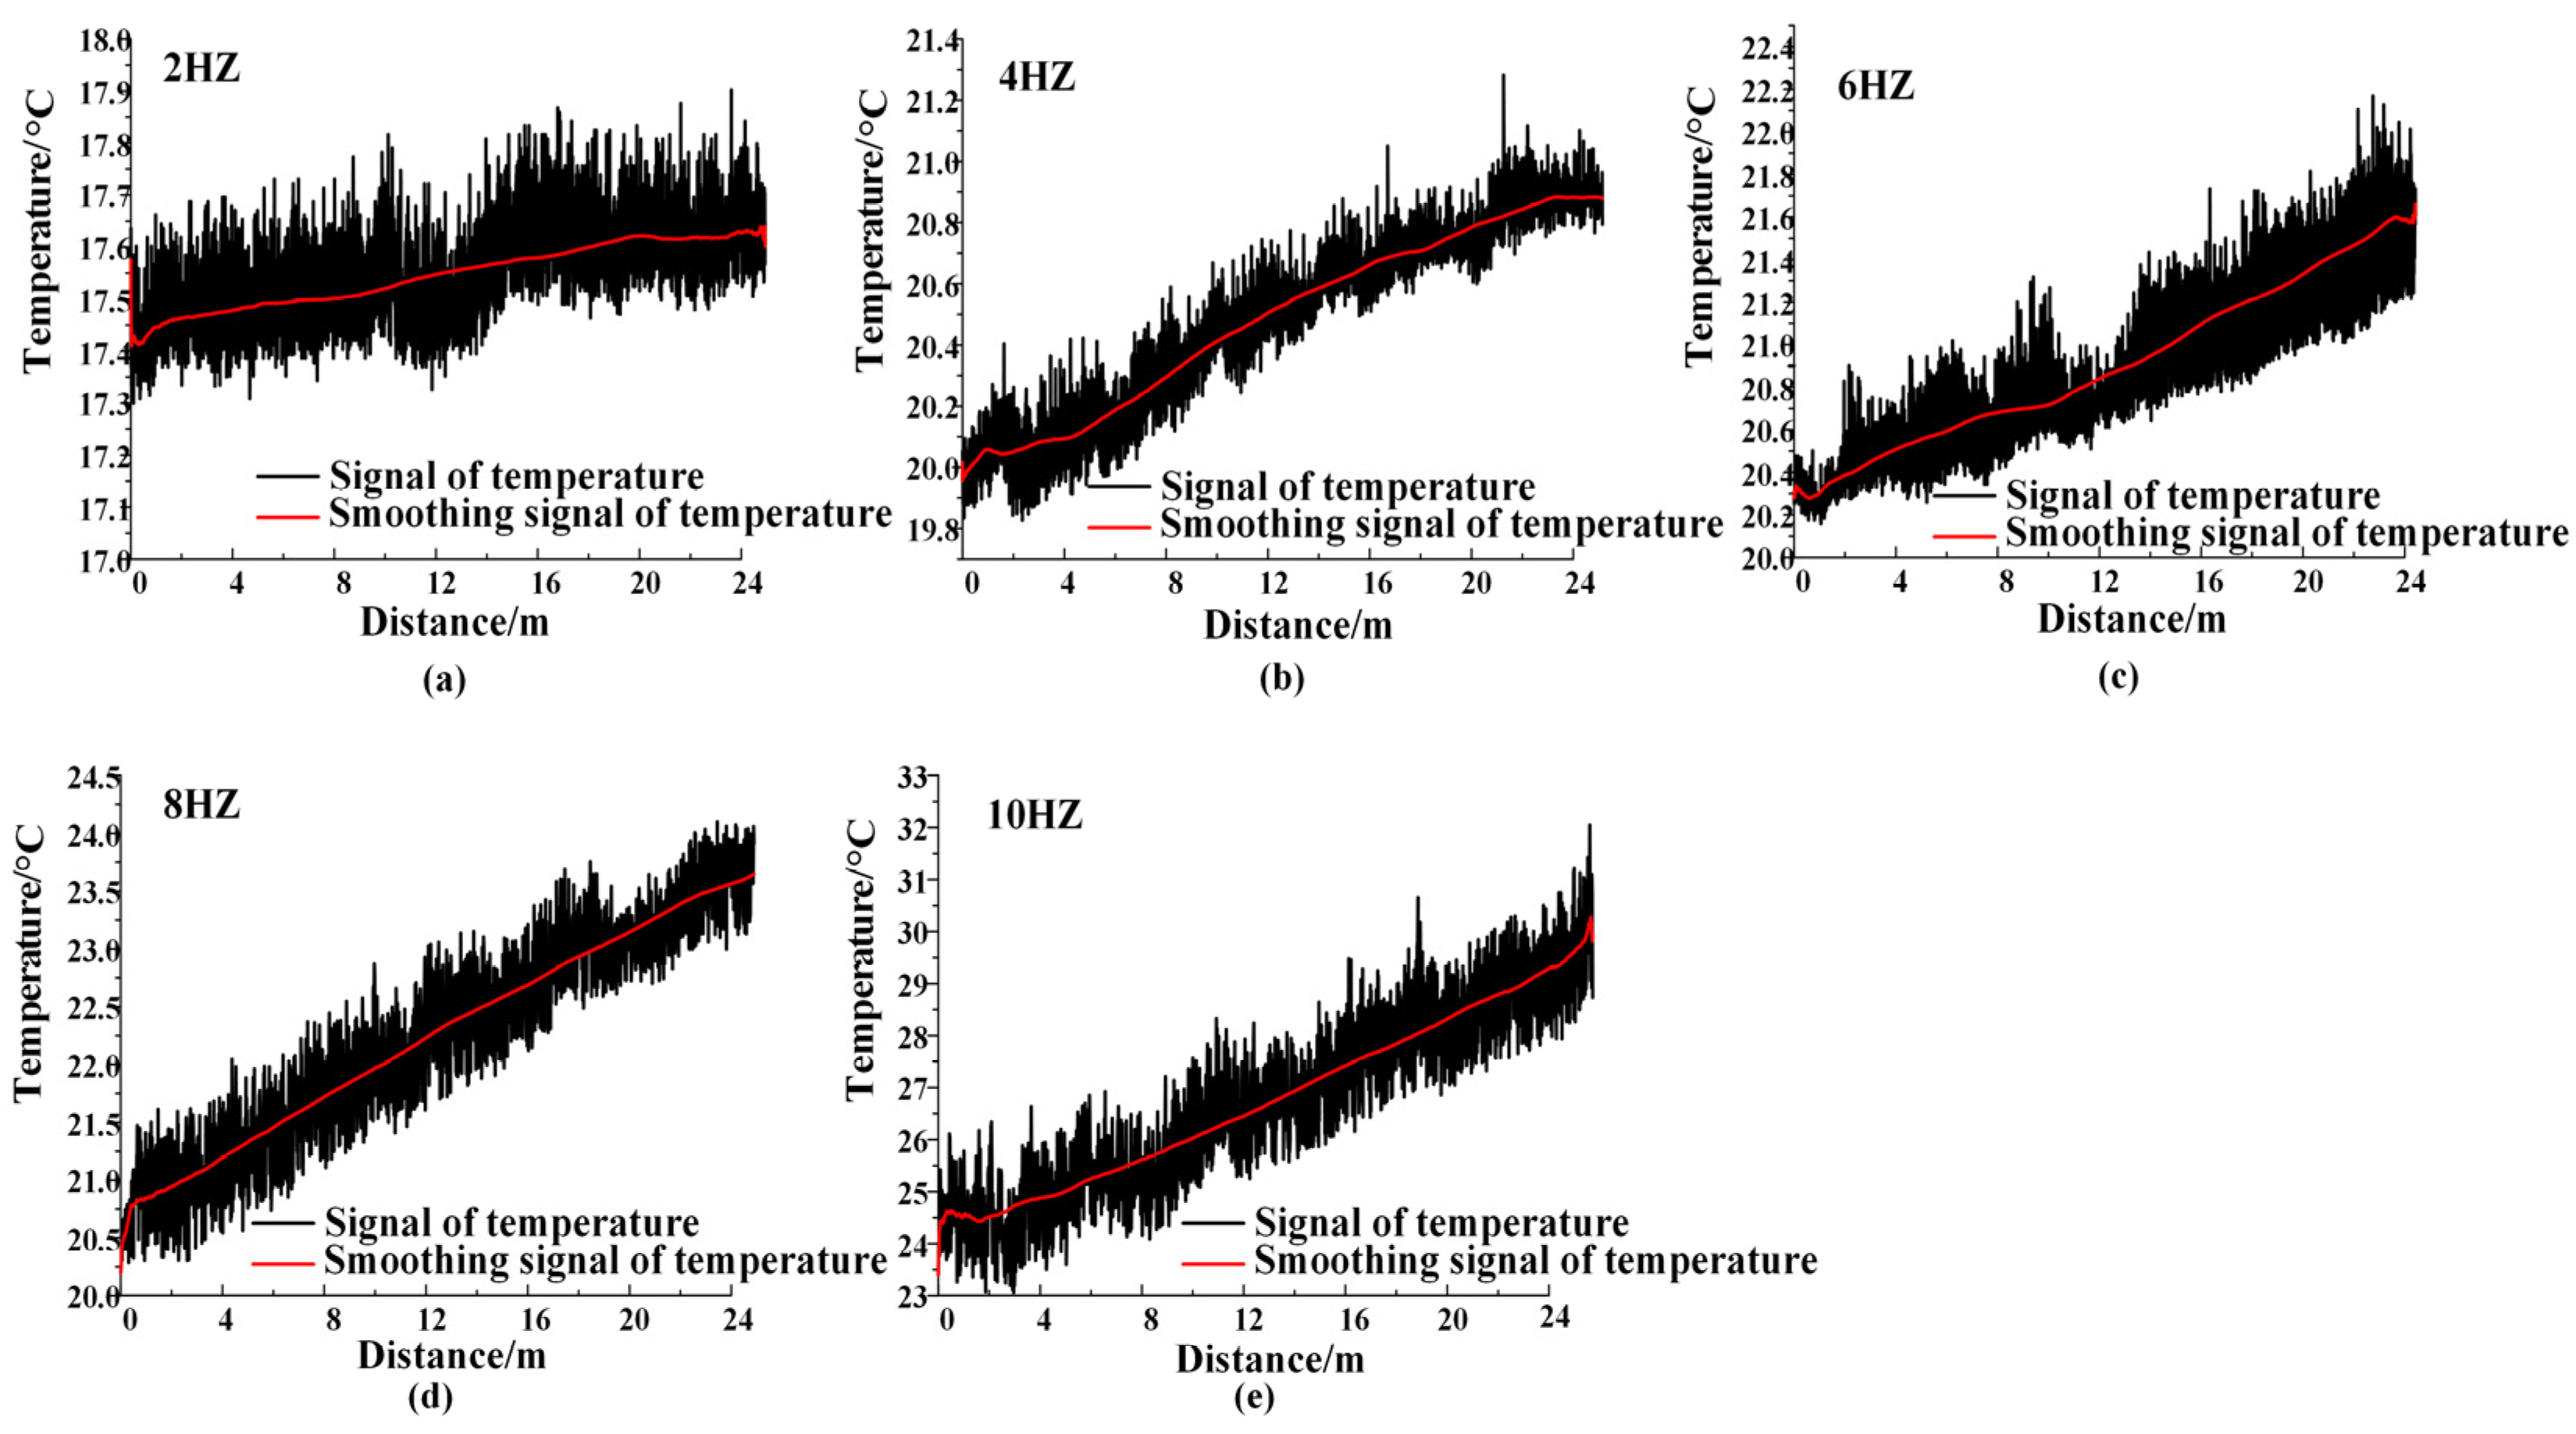
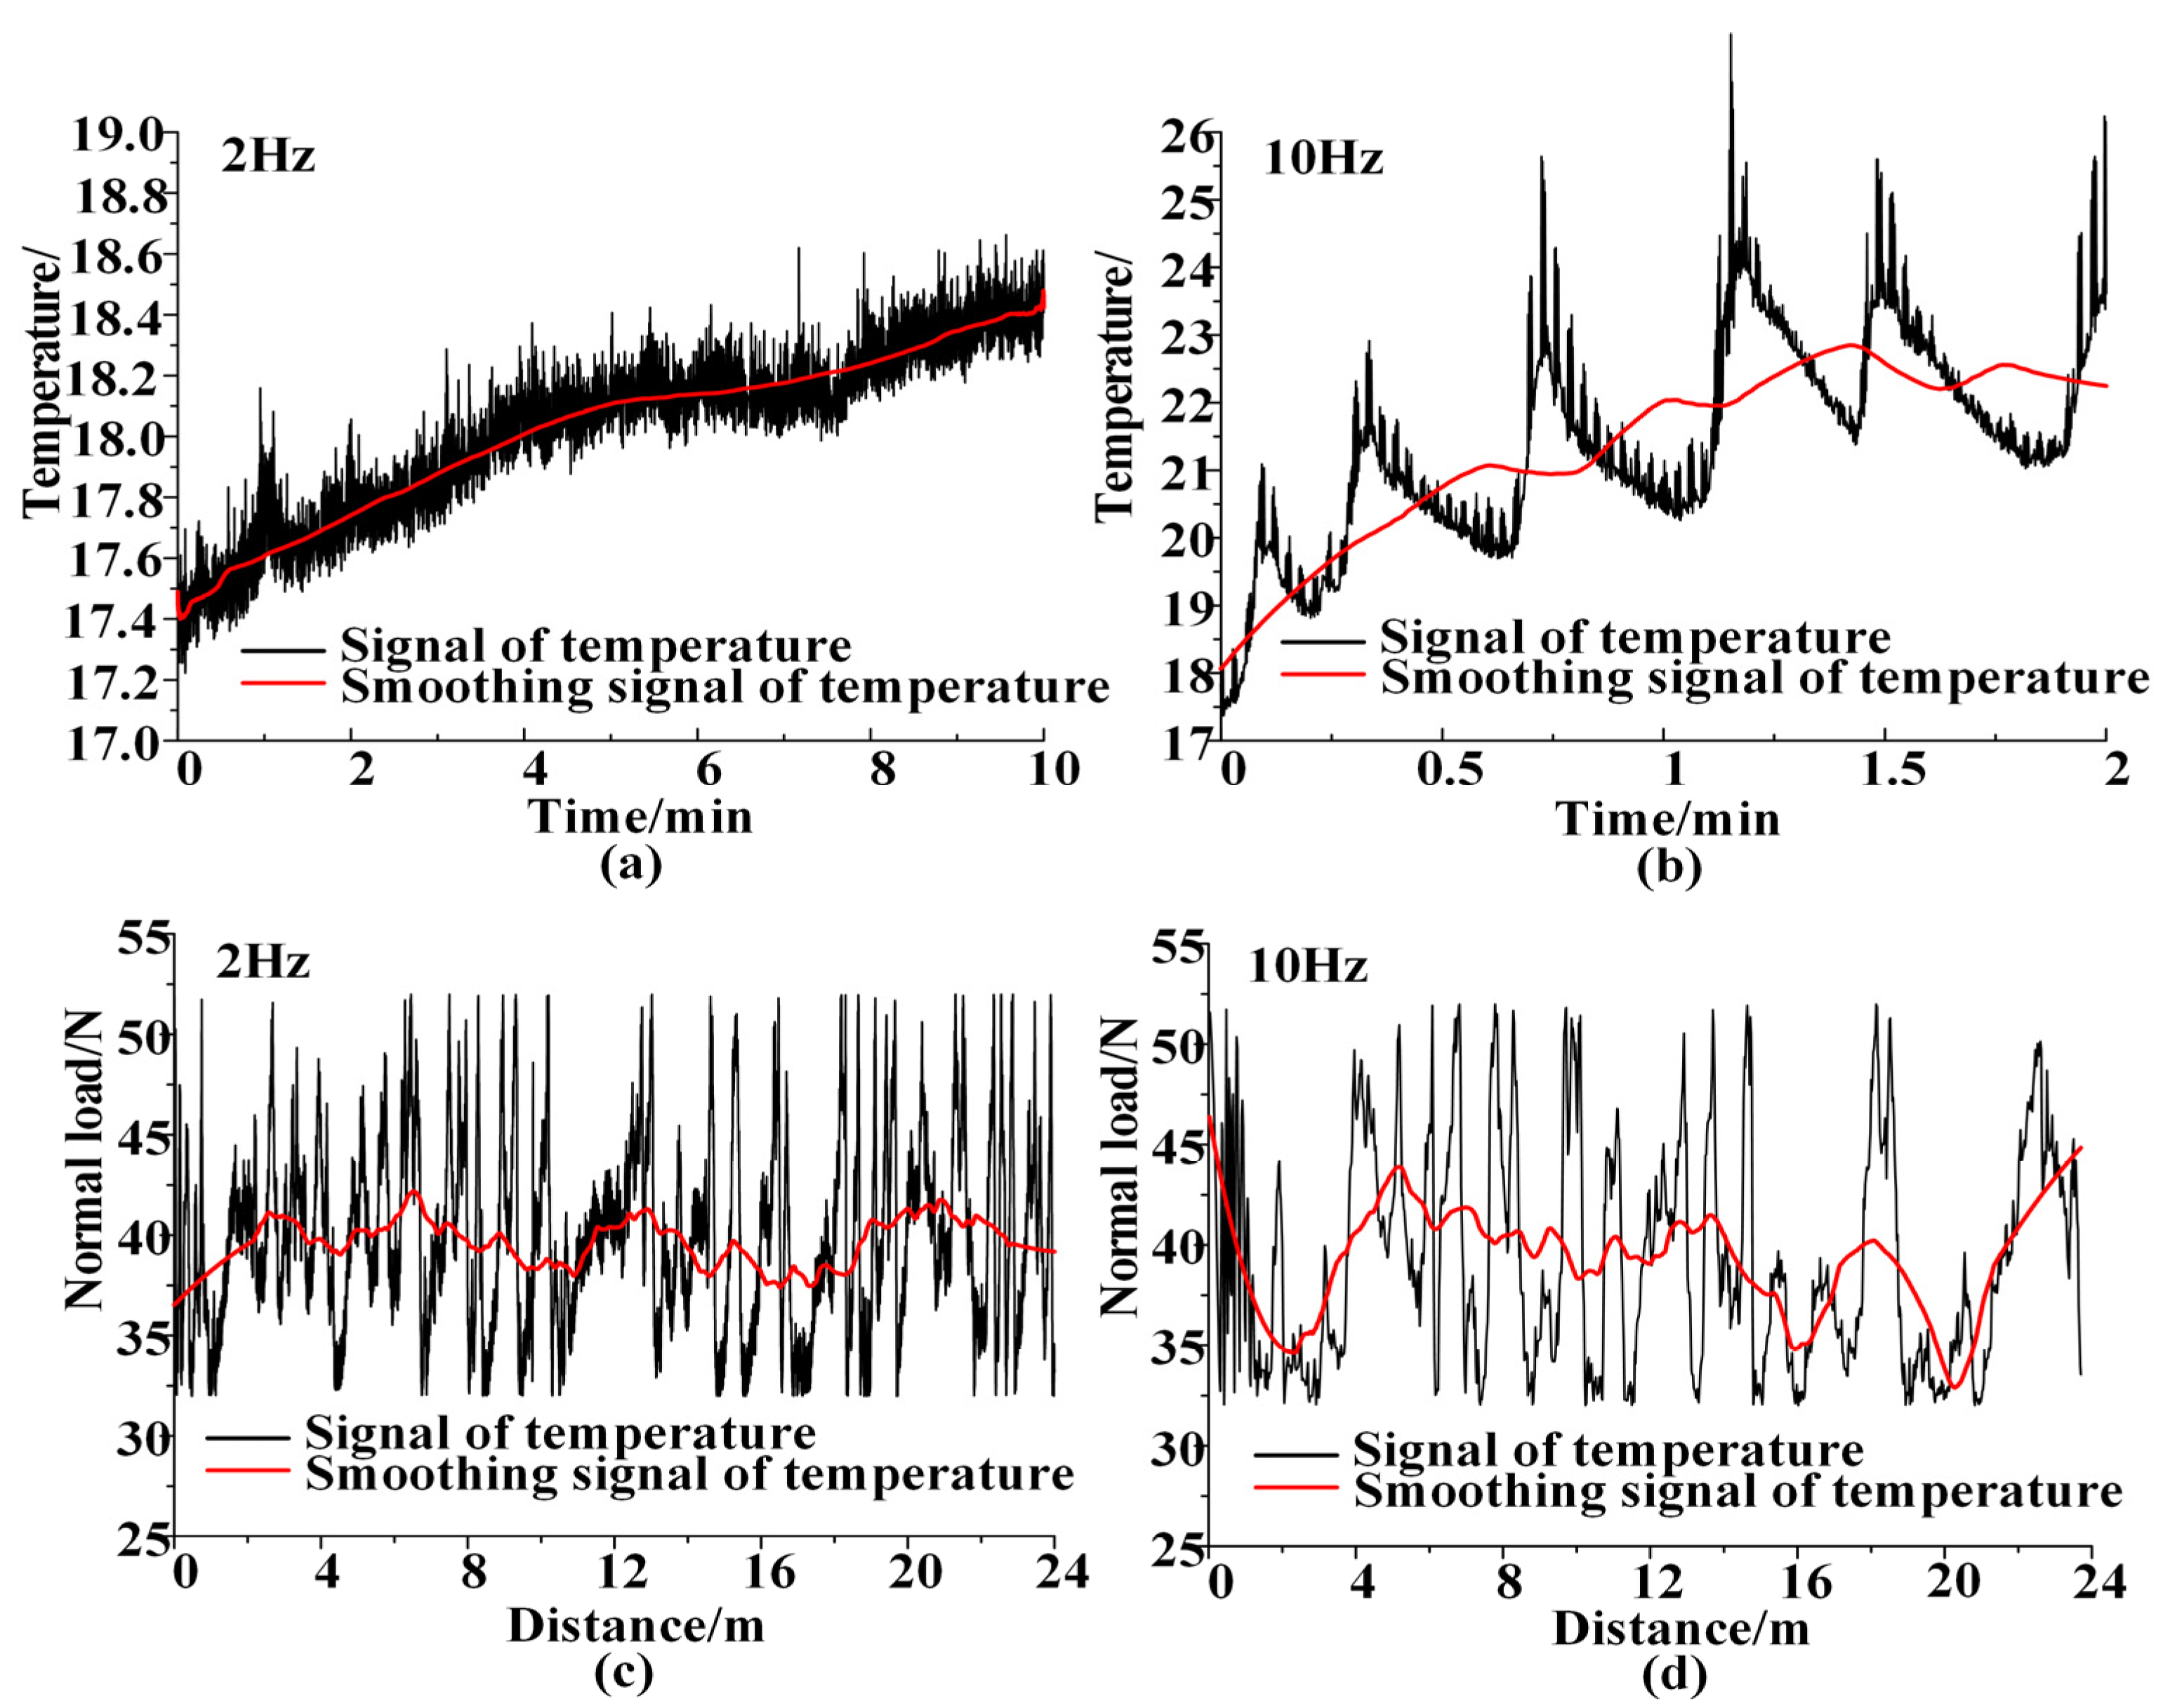
Figure 7 presents a time–history curve for the frictional temperature of 316L stainless steel at different reciprocating frequencies (2 Hz, 4 Hz, 6 Hz, 8 Hz and 10 Hz). In the experiment, this curve was smoothed by the neighbourhood averaging method, as shown by the red curve in Figure 7. Then, the positive contact pressure was set at 40 N, and the relative slip distance was controlled at 24 m. It could be seen that the temperature in the friction zone increased with this distance. For the convenience of comparison, the change in temperature at different reciprocating frequencies is illustrated in Figure 8a. It was found that the temperature difference before and after friction increased with the increase in frequency. Among them, the smallest temperature difference is 0.21 °C at 2 Hz, the similar temperature difference is 0.9 °C and 1.44 °C at 4 Hz and 6 Hz, and the temperature difference increases significantly at 8 Hz and 10 Hz, which are 2.87 °C and 5.46 °C, respectively. Especially in the initial stage of friction, the temperature also increases with the increase in reciprocating frequency. This is because during friction, due to the friction generated by the relative motion of the two surfaces, part of the mechanical energy is converted into thermal energy. These losses of mechanical energy lead to an increase in the temperature of the friction surface.
Figure 8b presents the change in wear mass with this frequency: the former increased with the latter. Thereinto, the wear mass was minimum at a frequency of 2 Hz, showing a value of 0.6 mg; it was maximum at 10 Hz, showing a value of 7.7 mg. Meanwhile, this mass increased slowly at 4 Hz, 6 Hz and 8 Hz, with corresponding values of 1.8 mg, 2.4 mg and 3.3 mg. As analysed using Equation (1), when the stroke and initial positive pressure were constant, the frictional work should have been unchanged as well. However, in unit time, the cycle in Figure 4b–d was repeated increasingly with the frequency. Therefore, the phenomenon of heat accumulation became relatively prominent. At the same time, the temperature rose significantly, and the thermal expansion was intensified. Thus, the normal contact pressure fluctuated, which increased the degree of wear.

3.3. Influence of the Frictional Heating Effect on Normal Contact Load and Wear Mass

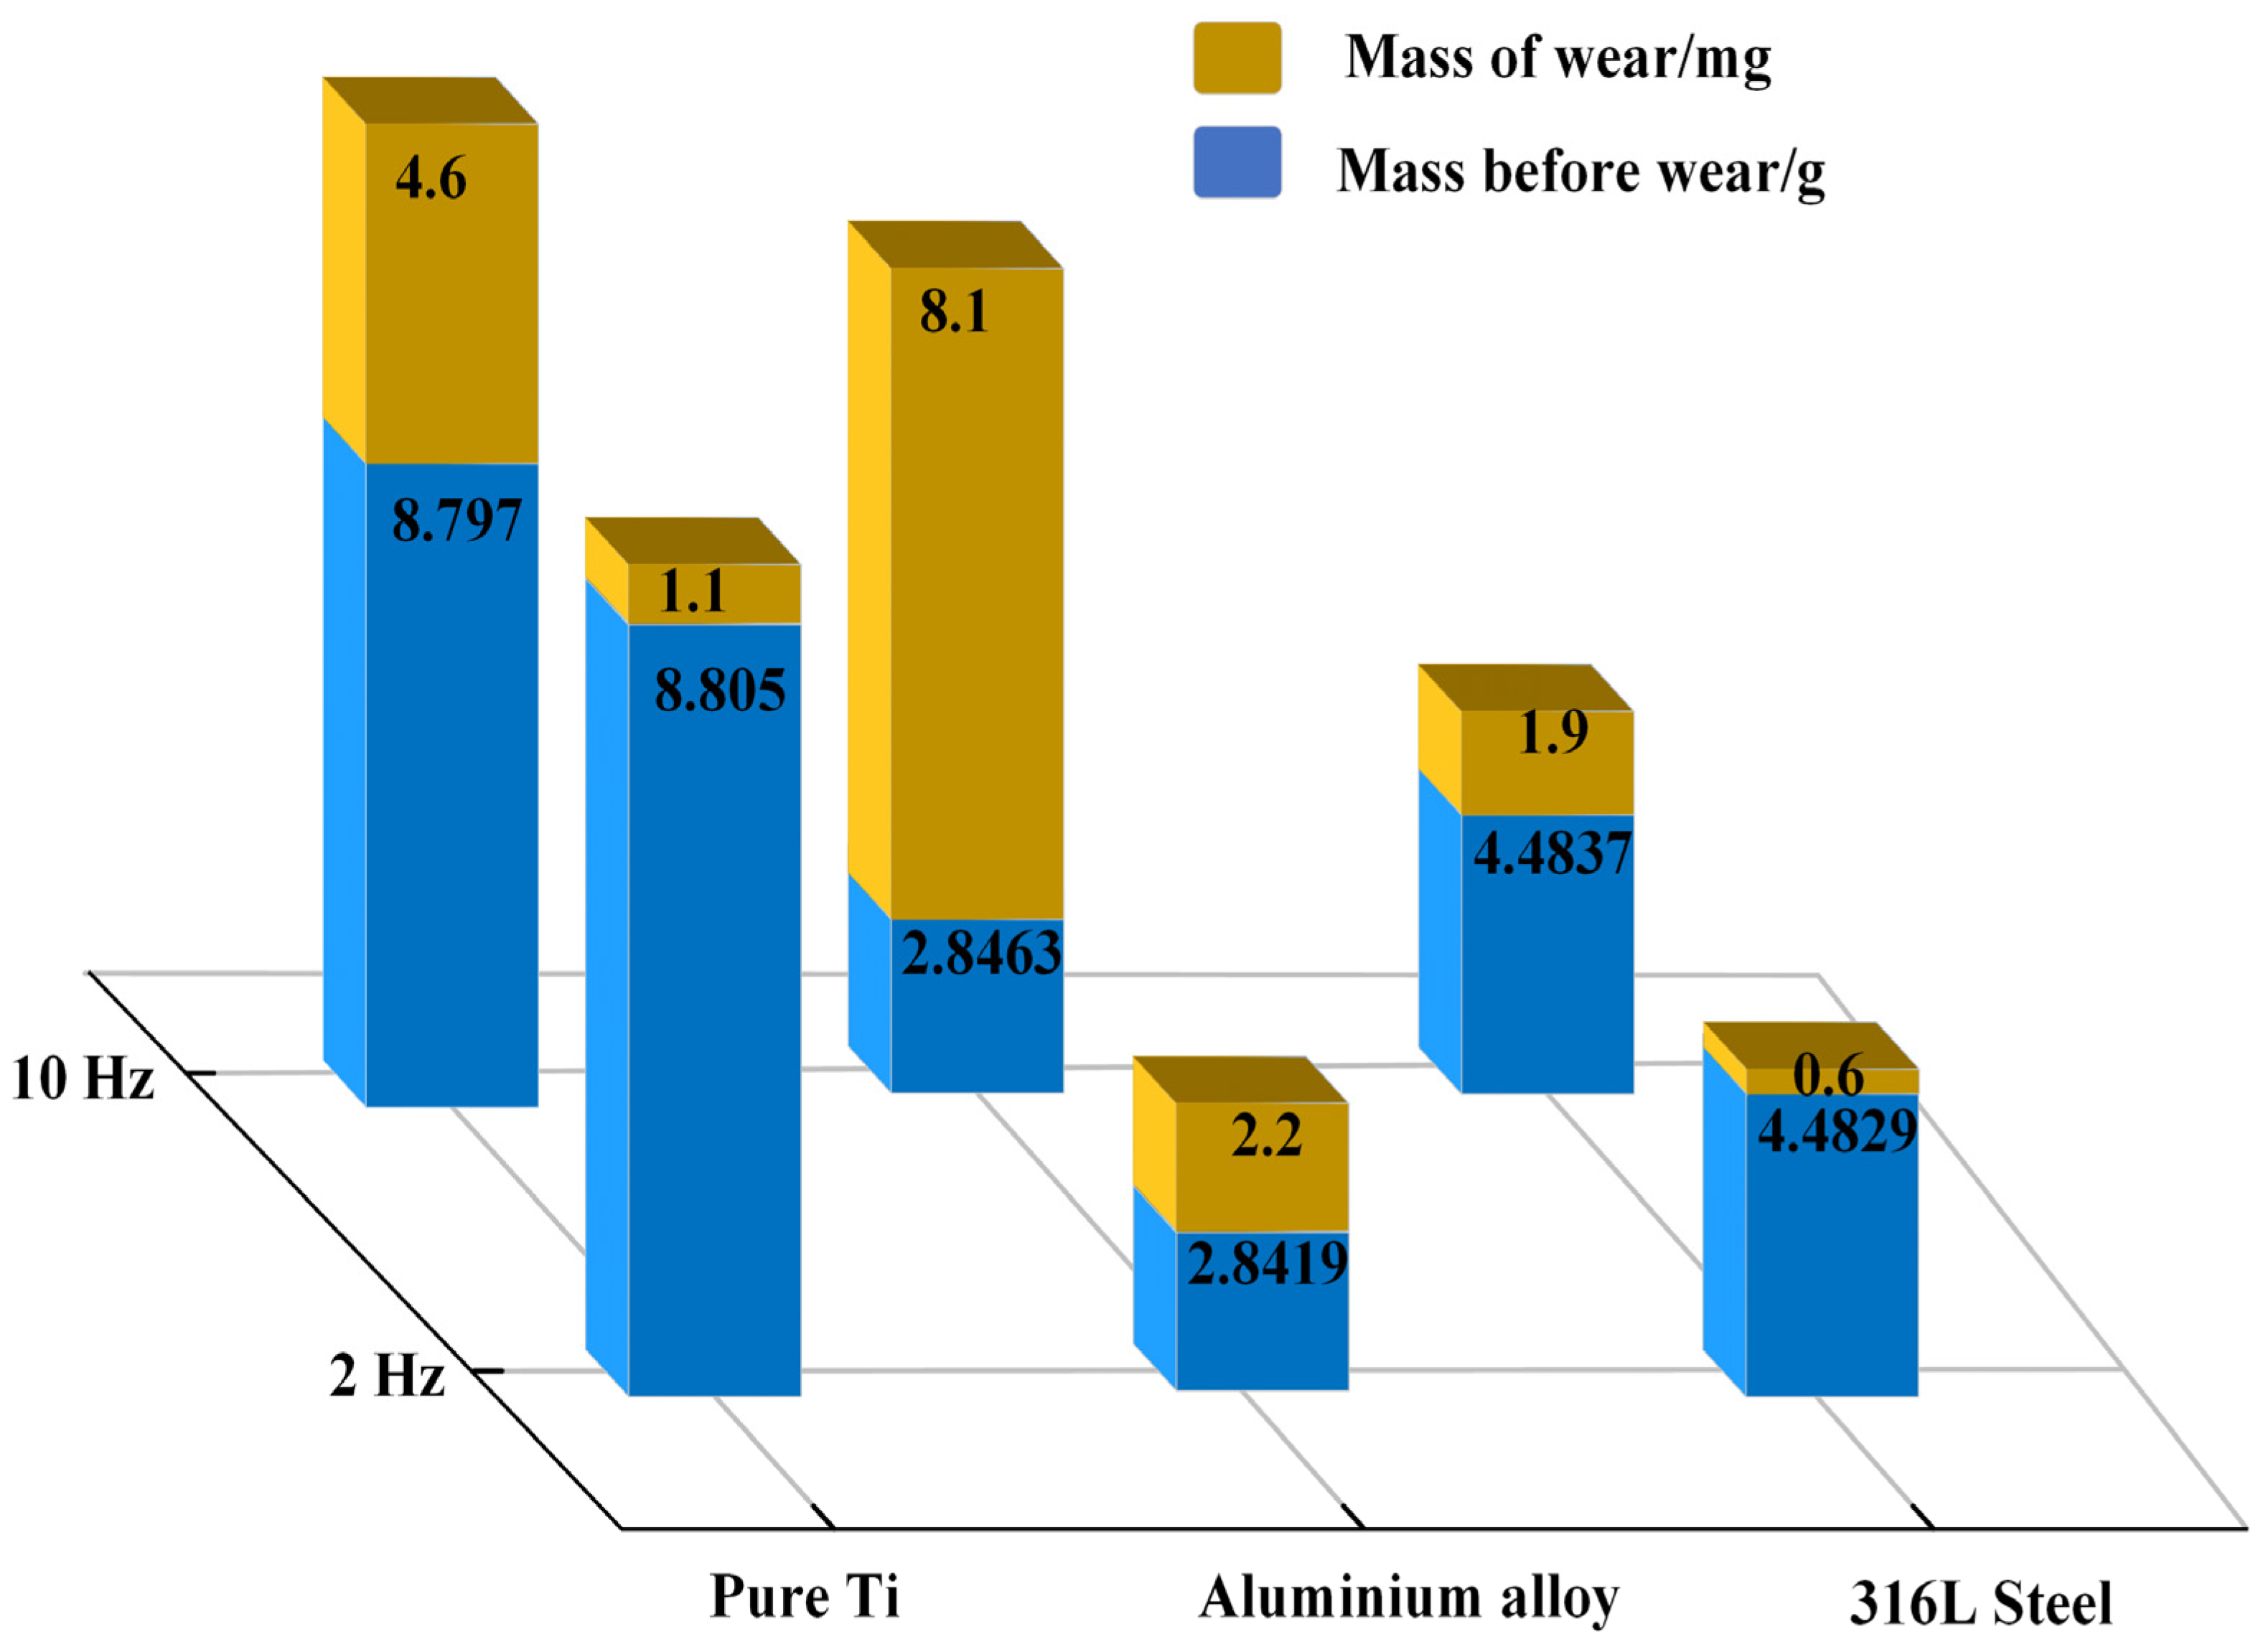
Figure 9 shows the wear mass under the same stroke (24 m) and initial positive contact pressure (40 N) but at different reciprocating frequencies (2 Hz and 10 Hz). It was found that the wear mass of pure titanium, 5A06 aluminium alloy and 316L stainless steel was 4.6 mg, 8.1 mg and 1.9 mg, respectively, at a frequency of 10 Hz, while the values were 1.1 mg, 2.2 mg and 0.6 mg, respectively, at 2 Hz. In accordance with the Archard wear equation, this mass is expressed as:
M = ρ V
where M, ρ , and V represent the mass, density, and the volume. The same material had identical wear volume under the same initial positive contact pressure and stroke. Under such circumstances, the wear mass should be identical as well. However, the error between the actual wear mass of three materials and that predicted by the Archard model was more than 300%, which was not reasonable. By analysing the above equation, it can be found that the frictional heat is not considered, but it is an important factor affecting the frictional wear. This is because the thermal expansion caused by such heat can affect the normal contact pressure, thus influencing the degree of wear. Therefore, this equation shall be optimized.
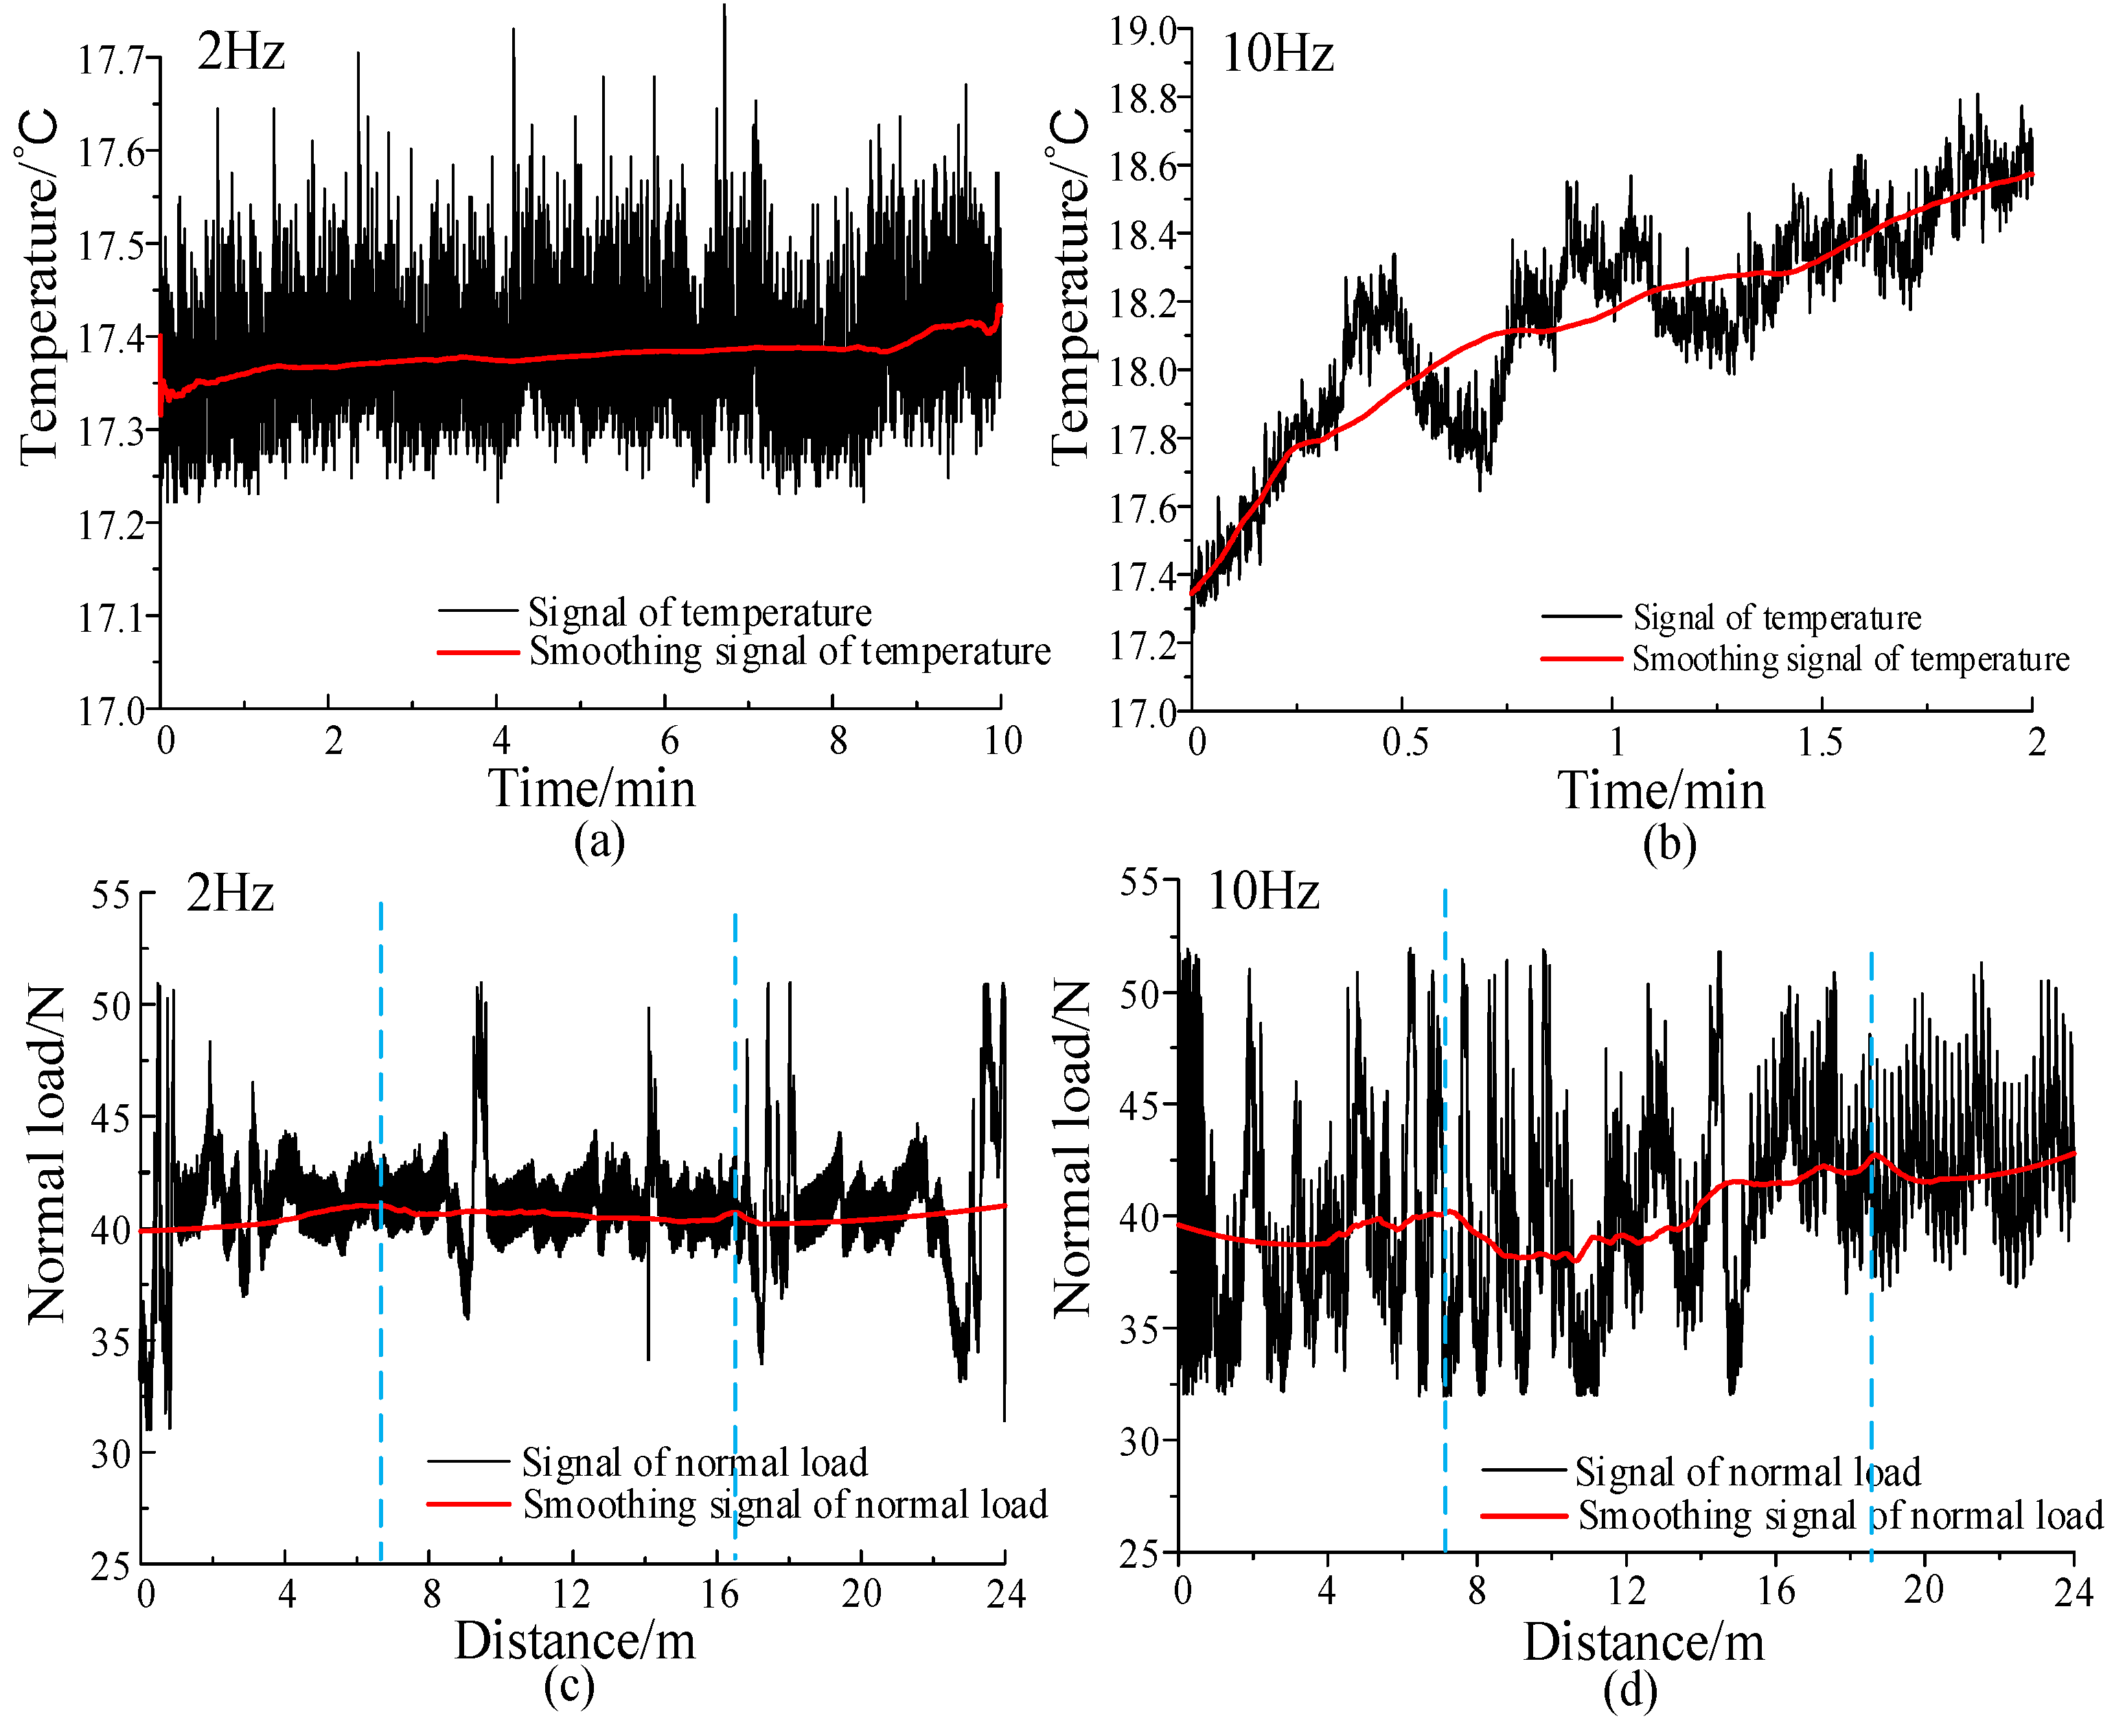
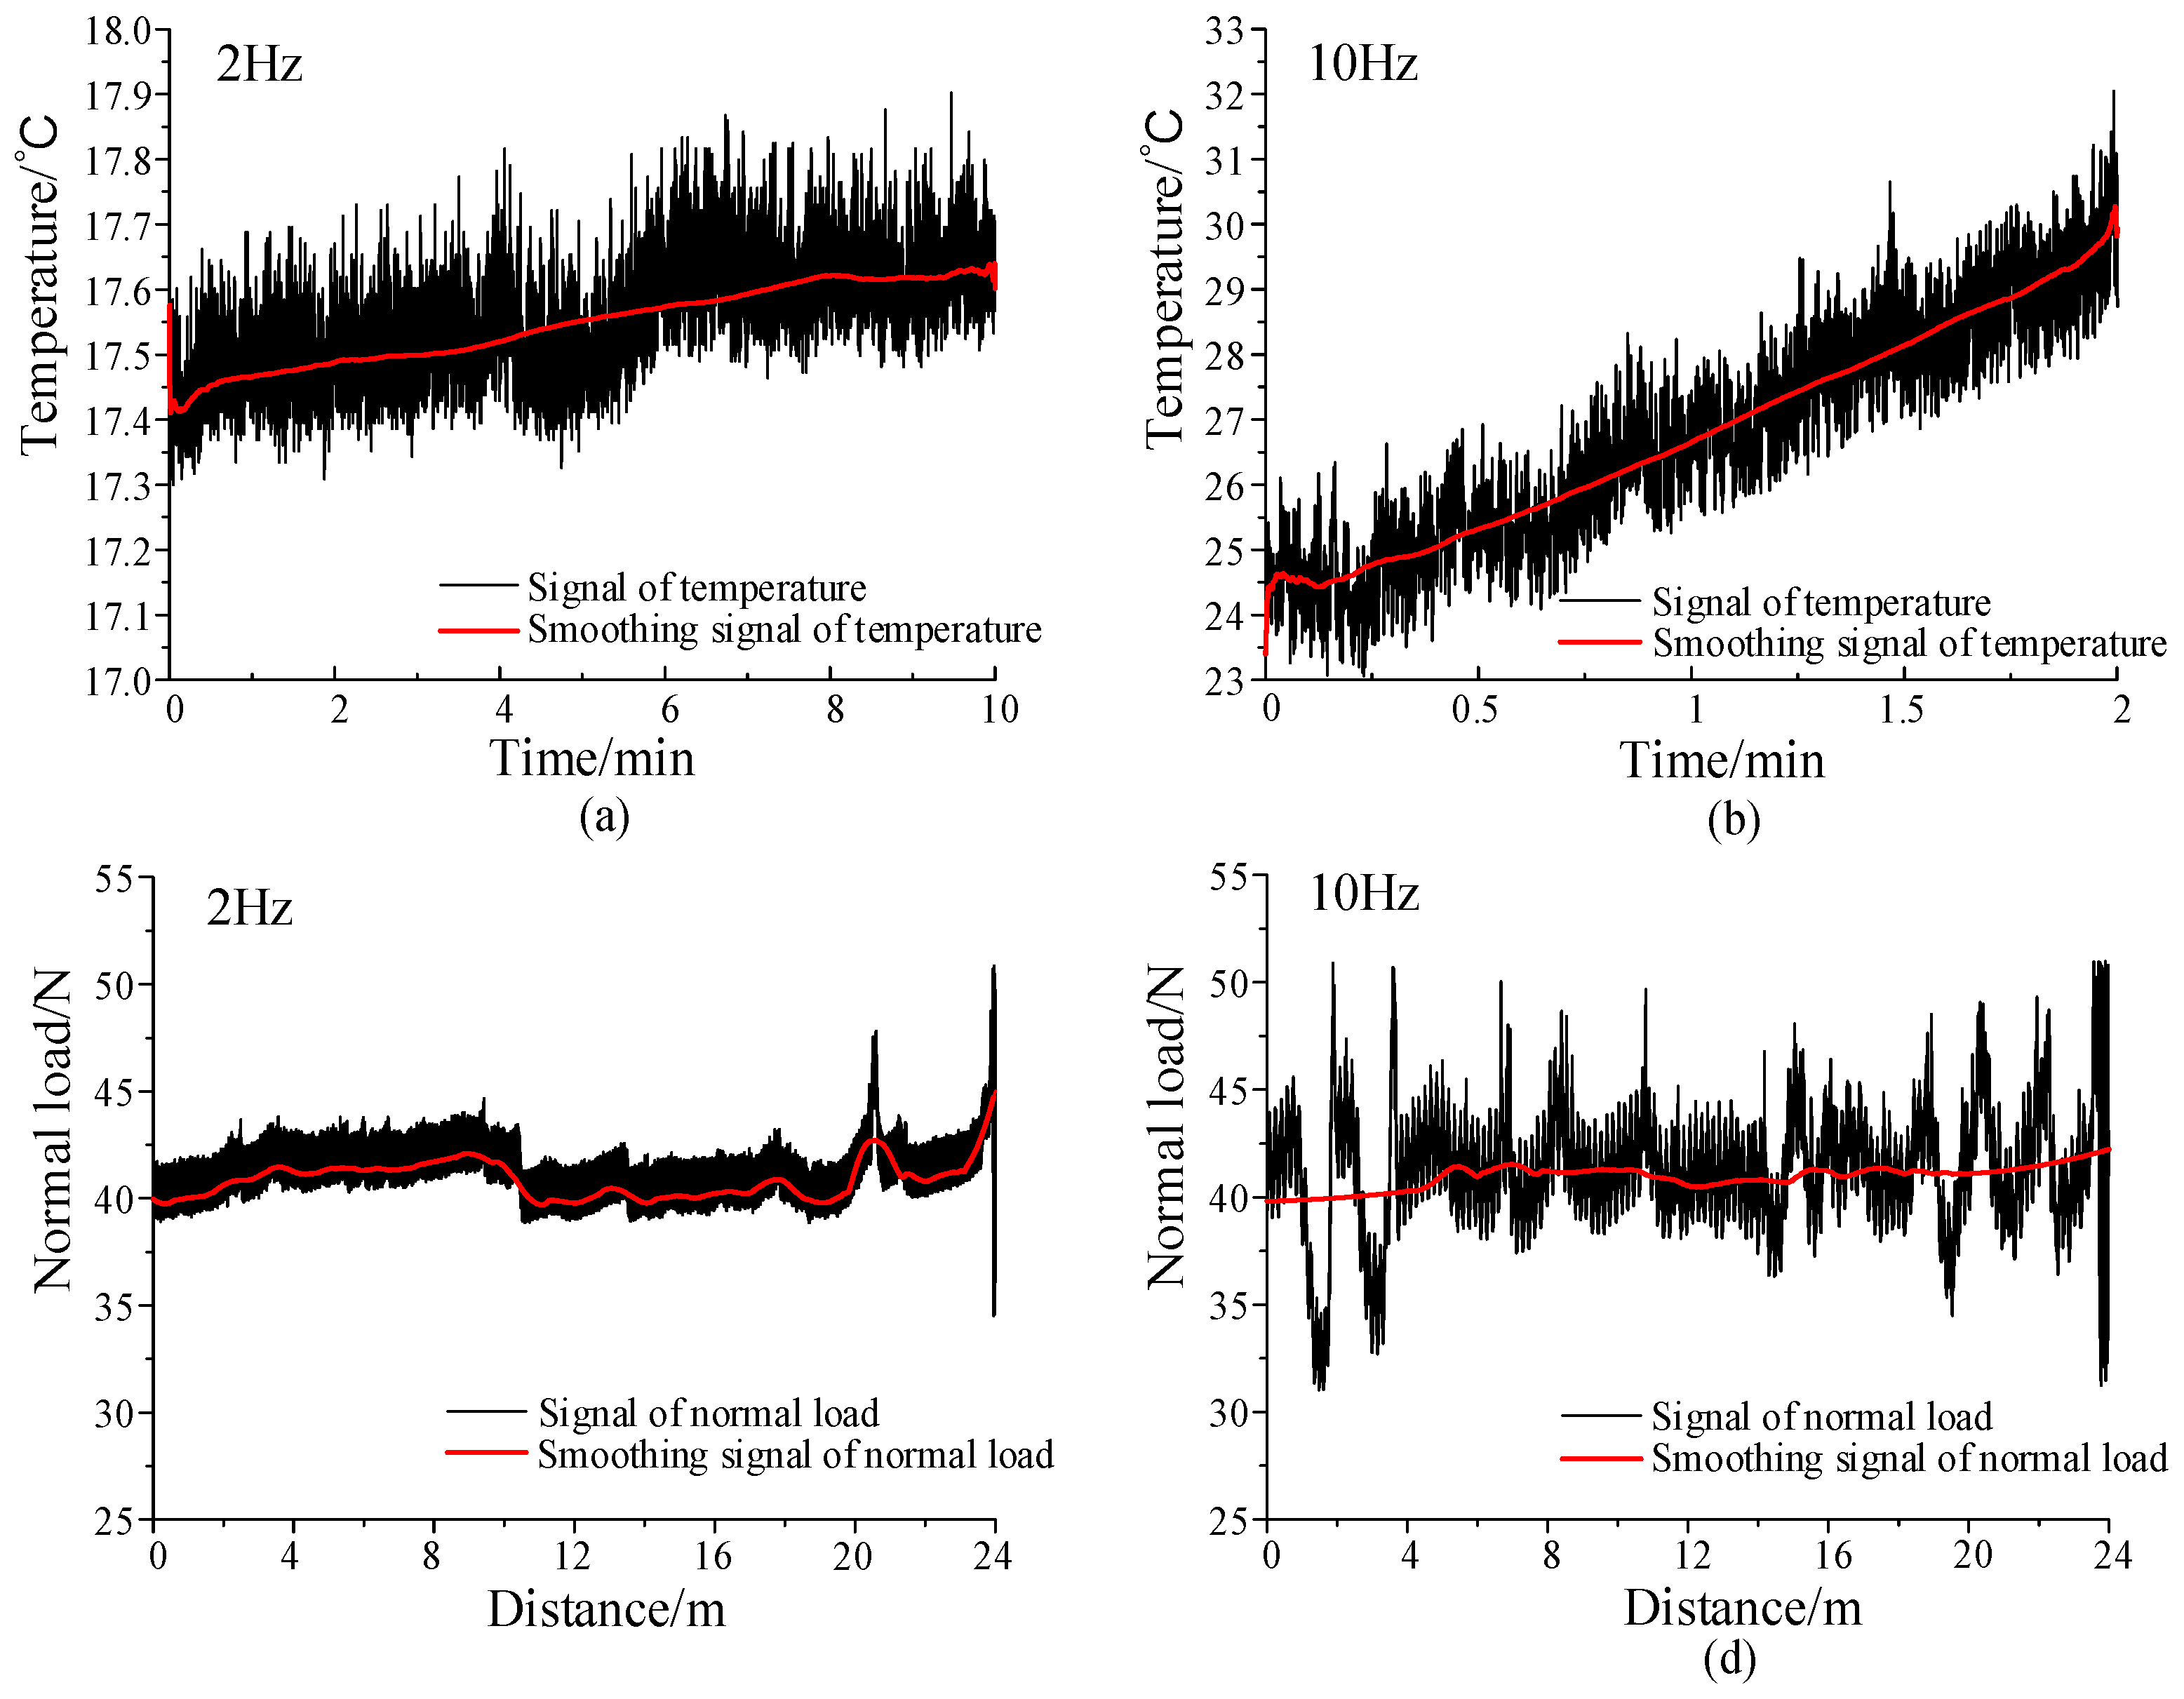
Figure 10, Figure 11 and Figure 12 present the variation curves for the temperature and normal contact pressure of 5A06 aluminium alloy, 316L stainless steel and pure titanium at reciprocating frequencies of 2 Hz and 10 Hz, respectively. First, these curves were smoothed using the neighbourhood averaging method. Then, the initial positive contact pressure was set at 40 N, and the relative slip distance was controlled at 24 m. Under the same stroke, the temperature rise at 10 Hz was more significant than that at 2 Hz. For 5A06 aluminium alloy, the temperature increased by 0.5 °C at 2 Hz but 1.3 °C at 10 Hz. For 316L stainless steel, the temperature increased by 0.3 °C at 2 Hz but 4.5 °C at 10 Hz, showing a more significant rise. For pure titanium, the temperature increased by 1.2 °C at 2 Hz but 4.2 °C at 10 Hz, showing a rising trend. These results are in accordance with the above analysis about the influence of reciprocating frequency on frictional temperature.
Regarding the normal positive contact pressure, the normal load of these three materials at 10 Hz was more fluctuant than that at 2 Hz, which was caused by various factors, such as frictional vibration and systematic noise. When the reciprocating frequency was low, the degree of vibration was also relatively low. However, as this frequency, i.e., the relative velocity, increased, the phenomenon of vibration was more likely to occur. Notably, the normal load of pure titanium fluctuated violently at both frequencies (2 Hz and 10 Hz), as shown in Figure 12. This is because this material has high stiffness and good thermal stability. Hence, in the case of relative friction, the frictional vibration will occur easily, and the whole friction system tends to be unstable [17].
As shown by smooth curves, the normal force was on the rise both at 10 Hz and 2 Hz, showing certain periodic fluctuations. By amplifying the curve of 5A06 aluminium alloy along the Y axis in Figure 10c, it was found (Figure 13) that the normal contact pressure increased in the first segment (Figure 13(I)) due to the frictional thermal expansion, but it declined slightly in the second segment because the relatively high-temperature zone was worn and ground [18] (Figure 13(II)). Furthermore, in the third segment, the worn surface experienced thermal expansion again (Figure 13(III)), which was consistent with the cycle in Figure 1. Thus, the normal positive contact pressure increased, showing certain periodicity. The fluctuation trends for the normal force of 316L stainless steel (Figure 11c,d) and pure titanium (Figure 12c,d) basically accorded with this fluctuating upward trend.

3.4. Model Verification

The proposed model was verified based on the above experimental results. In this study, the wear coefficient was obtained from the Archard equation below:
K = M H P 0 L ρ
Due to the inconspicuous influence of frictional thermal expansion on the degree of wear at the reciprocating frequency of 2 Hz, the wear mass of pure titanium, 316L stainless steel and 5A06 aluminium alloy at this frequency was used to calculate their respective wear coefficients, as shown in Table 4. In addition, this table also includes these materials’ elasticity modulus [19,20,21], yield strength [22,23,24], density [25,26,27] and coefficient of thermal expansion [28,29,30]. Figure 14 shows the actual wear mass and that predicted by modified and Archard models under a stroke of 24 m, initial normal contact load of 40 N and reciprocating frequency of 10 Hz. It can be found that the wear mass predicted by the modified model is more precise than that by the Archard one.
When the wear mass was predicted by Archard and modified models, the errors for pure titanium were 32.6% and 8.7%, respectively, showing that the latter’s precision was improved by 23.9%. For 5A06 aluminium alloy, the errors were 72.8% and 65.4%, respectively, and the precision was improved by 7.4%. For 316L stainless steel, the errors were 68.4% and 15.8%, respectively, and the precision was improved by 52.6%. Thereinto, the errors for the wear mass of 5A06 aluminium alloy predicted by both models were above 50%, which is due to the fact that the hard particles that are produced in the process of friction have a “plough-cutting” effect on this relatively soft material [18].
As shown in Figure 14, the error was relatively large between the actual wear mass and that calculated with the typical Archard model. However, the value calculated with the modified model was closer to the actual one. Therefore, it can be concluded that the modified Archard wear model, with a higher precision, is suitable for the working condition in which the friction time is long and the frictional heat is obvious, for example, the wear prediction of the brake disc.

4. Conclusions

In this study, 316L stainless steel was first adopted to reveal the mapping relation of the initial normal contact load, average velocity, frictional heat, and wear mass. Then, based on this finding, the influences of different reciprocating frequencies and temperatures on the normal load were discussed for 316L stainless steel, pure titanium and 5A06 aluminium alloy to explore the mechanism of frictional thermal wear. Finally, a new model for the prediction of wear mass was proposed. The main conclusions are as follows:
(1)
The frictional temperature increases with the initial positive contact pressure, reciprocating frequency and friction time.
(2)
The wear mass also increases with rising temperature.
(3)
The mechanism of frictional thermal wear is analysed. With the generation of frictional heat, the normal force fluctuates periodically, and the wear mass and temperature increase in a cyclic iterative manner in the contact area.
(4)
A wear model based on frictional thermal expansion is proposed. The actual wear mass, the predicted wear mass by the modified model and the predicted wear mass by Archard were measured at a reciprocating frequency of 10 Hz, an initial normal contact load of 40 N and a travel distance of 24 m. The results show that the modified model can predict the wear mass more accurately than the traditional Archard wear model, and the accuracy of the modified model is improved by 52.6%, 7.4% and 23.9% for the 316L stainless steel, the 5A06 aluminium alloy and the pure titanium, respectively. Since the proposed model is limited to specific workpiece types and operating conditions, it will be a reliable model for predicting workpiece material wear under these conditions for future studies.

Author Contributions

Conceptualization and validation, Q.S.; writing—original draft preparation and visualization, D.Z.; formal analysis and methodology, Q.S.; resources, D.Z.; supervision, Q.S.; investigation, D.Z.; writing—review and editing, Q.S. All authors have read and agreed to the published version of the manuscript.

Funding

This research received no external funding.

Institutional Review Board Statement

Not applicable.

Informed Consent Statement

Not applicable.

Data Availability Statement

Data is contained within the article.

Conflicts of Interest

The authors declare no conflicts of interest.

References

  1. Davanageri, M.B.; Narendranath, S.; Kadoli, R. Modeling and Optimization of Wear Rate of AISI 2507 Super Duplex Stainless Steel. Silicon 2019, 11, 1023–1034. [Google Scholar] [CrossRef]
  2. Rao, T.B.; Ponugoti, G.R. Characterization, Prediction, and Optimization of Dry Sliding Wear Behaviour of Al6061/WC Composites. Trans. Indian Inst. Met. 2021, 74, 159–178. [Google Scholar] [CrossRef]
  3. Khatkar, S.K.; Verma, R.; Sumankant; Thakur, A.; Sharma, R. Optimization and Effect of Reinforcements on the Sliding Wear Behavior of Self-Lubricating AZ91D-SiC-Gr Hybrid Composites. Silicon 2021, 13, 1461–1473. [Google Scholar] [CrossRef]
  4. Archard, J.F. Contact and Rubbing of Flat Surfaces. J. Appl. Phys. 1953, 24, 981–988. [Google Scholar] [CrossRef]
  5. Porter, J.H.; Brake, M.R.W. Towards a predictive, physics-based friction model for the dynamics of jointed structures. Mech. Syst. Signal Process. 2023, 192, 110210. [Google Scholar] [CrossRef]
  6. Wei, X.K.; Meng, H.F.; He, J.H.; Jia, L.M.; Li, Z.G. Wear analysis and prediction of rigid catenary contact wire and pantograph strip for railway system. Wear 2020, 442, 203118. [Google Scholar] [CrossRef]
  7. Popov, V.L.; Pohrt, R. Adhesive wear and particle emission: Numerical approach based on asperity-free formulation of Rabinowicz criterion. Friction 2018, 6, 260–273. [Google Scholar] [CrossRef]
  8. Yu, G.; Xia, W.; Song, Z.; Wu, R.; Wang, S.; Yao, Y. Wear-life analysis of deep groove ball bearings based on Archard wear theory. J. Mech. Sci. Technol. 2018, 32, 3329–3336. [Google Scholar] [CrossRef]
  9. Tabrizi, A.T.; Aghajani, H.; Saghafian, H.; Laleh, F.F. Correction of Archard Equation for Wear Behavior of Modified Pure Titanium. Tribol. Int. 2021, 155, 106772. [Google Scholar] [CrossRef]
  10. Yla, B.; Twl, A.; Bdb, C. Dynamic changes of mechanical properties induced by friction in the Archard wear model. Wear 2019, 428, 366–375. [Google Scholar] [CrossRef]
  11. Dyck, T.; Bund, A. An adaption of the Archard equation for electrical contacts with thin coatings. Tribol. Int. 2016, 102, 1–9. [Google Scholar] [CrossRef]
  12. Pastewka, L.; Moser, S.; Moseler, M. Atomistic insights into the running-in, lubrication, and failure of hydrogenated diamond-like carbon coatings. Tribol. Lett. 2010, 39, 49–61. [Google Scholar] [CrossRef]
  13. Aghababaei, R.; Zhao, K. Micromechanics of material detachment during adhesive wear: A numerical assessment of Archard’s wear model. Wear 2021, 476, 203739. [Google Scholar] [CrossRef]
  14. Milanese, E.; Brink, T.; Aghababaei, R.; Molinari, J.-F. Emergence of self-affine surfaces during adhesive wear. Nat. Commun. 2019, 10, 1116. [Google Scholar] [CrossRef] [PubMed]
  15. Popova, E.; Popov, V.L.; Kim, D.E. 60 years of Rabinowicz’ criterion for adhesive wear. Friction 2018, 6, 341–348. [Google Scholar] [CrossRef]
  16. Lichtenberg, K.; Weidenmann, K.A. Effect of Reinforcement Size and Orientation on the Thermal Expansion Behavior of Metallic Glass Reinforced Metal Matrix Composites Produced by Gas Pressure Infiltration. Thermochim. Acta 2017, 654, 85–92. [Google Scholar] [CrossRef]
  17. Wu, C.; Chen, F.; Long, X. The self-excited vibration induced by friction of the shaft-hull coupled system with the water-lubricated rubber bearing and its stick-slip phenomenon. Ocean. Eng. 2020, 198, 107002. [Google Scholar] [CrossRef]
  18. Shan, C.; Zhang, M.; Zhang, S.; Dang, J. Prediction of machining-induced residual stress in orthogonal cutting of Ti6Al4V. Int. J. Adv. Manuf. Technol. 2020, 107, 2375–2385. [Google Scholar] [CrossRef]
  19. Topolski, K.; Brynk, T.; Garbacz, H. Elastic modulus of nanocrystalline titanium evaluated by cyclic tensile method. Arch. Civ. Mech. Eng. 2016, 16, 927–934. [Google Scholar] [CrossRef]
  20. Bahri, A.; Guermazi, N.; Bargui, M.; Elleuch, K. Estimation of the elastic modulus of the alumina coated AA1050 aluminum: Modeling and experiments. Mater. Sci. Eng. A 2016, 670, 188–195. [Google Scholar] [CrossRef]
  21. Ferriell, W.D.; Batt, G.S.; Desjardins, J.D. Finite element validation of 3D American football faceguard structural stiffness models. Proc. Inst. Mech. Eng. Part P J. Sports Eng. Technol. 2021, 235, 201–211. [Google Scholar] [CrossRef]
  22. Fattah-Alhosseini, A.; Keshavarz, M.K.; Mazaheri, Y.; Ansari, A.R.; Karimi, M. Strengthening mechanisms of nano-grained commercial pure titanium processed by accumulative roll bonding. Mater. Sci. Eng. A 2017, 693, 164–169. [Google Scholar] [CrossRef]
  23. Li, W. Experimental study on tensile mechanical behaviors of 5A06 aluminum alloy under short time elevated temperature. In Proceedings of the Fourth International Conference on Experimental Mechanics, Singapore, 18–20 November 2009. [Google Scholar] [CrossRef]
  24. Mao, X.; Kang, S.H.; Kim, T.K.; Kim, S.C.; Oh, K.H.; Jang, J. Microstructure and Mechanical Properties of Ultrafine-Grained Austenitic Oxide Dispersion Strengthened Steel. Metall. Mater. Trans. A 2016, 47, 5334–5343. [Google Scholar] [CrossRef]
  25. Renaudin, P.; Blancard, C.; Faussurier, G.; Noiret, P. Combined Pressure and Electrical-Resistivity Measurements of Warm Dense Aluminum and Titanium Plasmas. Phys. Rev. Lett. 2002, 88, 215001. [Google Scholar] [CrossRef]
  26. Getmanskii, I.V.; Koval, V.V.; Minyaev, R.M.; Boldyrev, A.I.; Minkin, V.I. Supertetrahedral Aluminum—A New Allotropic Ultralight Crystalline Form of Aluminum. J. Phys. Chem. C 2017, 121, 22187–22190. [Google Scholar] [CrossRef]
  27. Deng, Y.; Mao, Z.; Yang, N.; Niu, X.; Lu, X. Collaborative Optimization of Density and Surface Roughness of 316L Stainless Steel in Selective Laser Melting. Materials 2020, 13, 1601. [Google Scholar] [CrossRef]
  28. Zheng, Z.; Eisenlohr, P.; Bieler, T.R.; Pagan, D.C.; Dunne, F.P.E. Heterogeneous Internal Strain Evolution in Commercial Purity Titanium Due to Anisotropic Coefficients of Thermal Expansion. JOM 2020, 72, 39–47. [Google Scholar] [CrossRef]
  29. Lalet, G.; Kurita, H.; Heintz, J.-M.; Lacombe, G.; Kawasaki, A.; Silvain, J.-F. Thermal expansion coefficient and thermal fatigue of discontinuous carbon fiber-reinforced copper and aluminum matrix composites without interfacial chemical bond. J. Mater. Sci. 2014, 49, 397–402. [Google Scholar] [CrossRef]
  30. Yakout, M.; Elbestawi, M.A.; Veldhuis, S.C. A study of thermal expansion coefficients and microstructure during selective laser melting of Invar 36 and stainless steel 316L-ScienceDirect. Addit. Manuf. 2018, 24, 405–418. [Google Scholar] [CrossRef]
Figure 1. Flow diagram for frictional thermal wear.
Coatings 14 00742 g001
Figure 2. Microgram for the heat-affected zone of friction.
Coatings 14 00742 g002
Figure 3. (a) System and operating platform for the experiment on frictional thermal wear. (b) Reciprocating module in the frictional wear experiment. (c) Operating principle of the reciprocating module for frictional wear.
Coatings 14 00742 g003
Figure 4. (a) Data collection zone of the high-precision thermal infrared imager (FLIR A615). (b) Collection zone of frictional temperature.
Coatings 14 00742 g004
Figure 5. (ae) Trends of the effect of different initial normal loads from 20–60 N on the friction temperature of 316L stainless steel.
Coatings 14 00742 g005
Figure 6. (a) Temperature variation curve of the frictional heat under different initial normal contact loads. (b) Influence curve of the wear mass under different initial normal contact loads.
Coatings 14 00742 g006
Figure 7. (ae) Influence trend of different reciprocating frequencies on the frictional temperature of 316L stainless steel.
Coatings 14 00742 g007
Figure 8. (a) Temperature variation curve of the frictional heat at different reciprocating frequencies. (b) Influence curve of the wear mass at different reciprocating frequencies.
Coatings 14 00742 g008
Figure 9. The wear mass of pure titanium, 5A06 aluminium alloy and 316L stainless steel under stroke of 24 m, initial positive contact pressure of 40 N, and reciprocating frequency of 2 Hz and 10 Hz.
Coatings 14 00742 g009
Figure 10. (ad) Variation curve for the normal contact load of 5A06 aluminium alloy under different frictional heats at the reciprocating frequency of 2 Hz and 10 Hz.
Coatings 14 00742 g010
Figure 11. (ad) Variation curve for the normal contact load of 316L stainless steel under different frictional heats at the reciprocating frequency of 2 Hz and 10 Hz.
Coatings 14 00742 g011
Figure 12. (ad) Variation curve for the normal contact load of pure titanium under different frictional heats at the reciprocating frequency of 2 Hz and 10 Hz.
Coatings 14 00742 g012
Figure 13. The time–history curve of normal contact load smoothed by neighbourhood averaging method and the wear stage corresponding to different segments.
Coatings 14 00742 g013
Figure 14. Comparison diagram of the actual wear mass and that calculated with Archard and modified models.
Coatings 14 00742 g014
Table 1. Pressure identical friction frequency reciprocating experimental parameters.
Parameter
Frequency/
(Hz)
Time/
(min)
Pressure/
(N)
Number
121040
24540
363.340
482.540
510240
Table 2. Frequency same friction frequency reciprocation experimental parameters.
Parameter
Frequency/
(Hz)
Time/
(min)
Pressure/
(N)
Number
1101020
2101030
3101040
4101050
5101060
Table 3. Parameters of friction frequency reciprocation experiments with different materials.
Parameter
Frequency/
(Hz)
Slip Distance/
(m)
Pressure/
(N)
Material
316L2/102440
Pure titanium2/102440
5A06 aluminium alloy2/102440
Table 4. Parameters for 316L stainless steel, pure titanium and 5A06 aluminium alloy.
Parameter KE/(Gpa)H/(Mpa) ρ
(kg/m3)
APL/
(1/°C)
Material
Pure Ti2.03 × 10−4110284451010.5 × 10−6
Aluminum alloy1.90 × 10−470224.25270023.6 × 10−6
316L Steel0.2 × 10−4193310798017.3 × 10−6
Disclaimer/Publisher’s Note: The statements, opinions and data contained in all publications are solely those of the individual author(s) and contributor(s) and not of MDPI and/or the editor(s). MDPI and/or the editor(s) disclaim responsibility for any injury to people or property resulting from any ideas, methods, instructions or products referred to in the content.