Article

Improving Trace Detection of Methylene Blue by Designing Nanowire Array on Boron-Doped Diamond as Electrochemical Electrode

by
Sihan He
,
Kun Lin
,
Shaoheng Cheng
,
Nan Gao
*,
Junsong Liu
* and
Hongdong Li
*
State Key Lab of Superhard Materials, College of Physics, Jilin University, Changchun 130012, China
*
Authors to whom correspondence should be addressed.
Coatings 2024, 14(6), 762; https://doi.org/10.3390/coatings14060762
Submission received: 16 May 2024 / Revised: 3 June 2024 / Accepted: 12 June 2024 / Published: 16 June 2024
(This article belongs to the Special Issue Advances in Diamond Materials and Films)

Abstract

:
In this study, a boron-doped diamond nanowire array (BDD-NWA)-based electrode is prepared by using a microwave plasma chemical vapor deposition system and treated with inductively coupled plasma reactive ion etching. The BDD-NWA electrode is used for trace detection of methylene blue, which has a wide linear range of 0.04–10 μM and a low detection limit of 0.72 nM. Both the superhydrophilicity (contact angle ~0°) and the dense nanowire array’s structure after the etching process improve the sensitivity of the electrochemical detection compared to the pristine BDD. In addition, the electrode shows great repeatability (peak current fluctuation range of −3.3% to 2.9% for five detection/cleaning cycles) and stability (peak current fluctuation range of −5.3% to 6.3% after boiling) due to the unique properties of diamonds (mechanical and chemical stability). Moreover, the BDD-NWA electrode achieves satisfactory recoveries (93.8%–107.5%) and real-time monitoring in tap water.

1. Introduction

Methylene blue (MB) is a common thiazide organic dye that is mostly used in the leather, textile, and cosmetic industries, among others. In most cases, MB is finally discharged into different water resources as environmental pollutants [1]. Due to its strong coloring properties, MB is still visible in water with concentrations below 1 ppm, which affects light and hinders the photosynthesis of plants [2]. In addition, in the medical field, MB is used as a marker for vascular visualization, an antidote to cyanide poisoning, and for staining [3,4,5]. However, MB also induces adverse health effects, such as headache, dizziness, hypertension, mental confusion, vomiting, abdominal pain, and nausea [6,7,8,9]. Therefore, developing a highly sensitive tool for detecting MB at an extremely low level is essential. Various methods have been proposed to examine MB, such as ultraviolet and visible (UV-vis) spectroscopy [10], liquid chromatography with tandem mass spectrometry (LC-MS) [11], and surface-enhanced Raman spectroscopy (SERS) [12]. However, the detection limits of UV-vis and LC-MS/MS are generally several hundred nanomoles [13], meaning that detection of MB at extremely low concentrations cannot be achieved. In addition, it is difficult to achieve accurate quantification of the detected substance in SERS due to the incomplete uniformity of the substrate surface, the uneven distribution of molecules after droplet evaporation, and the wide concentration range of detection. In particular, the electrochemical method has the advantages of high sensitivity, fast response speed, simple equipment, and good selectivity, which has attracted much attention [14,15,16].
In recent decades, due to their outstanding and unique structural properties, carbon materials have been widely used in the field of electrical analysis. The electrocatalytic activity of carbon materials helps to detect or identify biological and environmental materials during electrochemical analysis [17]. Moreover, nanostructures can increase the specific surface area, resulting in higher sensitivity [18]. Therefore, boron-doped carbon nanowalls [19,20,21,22,23], carbon nanotubes [24], and other nanostructured carbon materials are widely used in electrochemical sensors. Conductive boron-doped diamond (BDD) has a wide electrochemical potential window, low background current, excellent chemical and mechanical stability, high surface oxidation resistance, high sensitivity, and low resistance [25,26,27], and it has been widely used in electrochemical detection and analysis [28]. Our previous studies have achieved sensitive detection of bisphenol A [25], 4-nonylphenol [14], aflatoxin B1 [29], clenbuterol [30], acetaminophen [31], and phenacetin [32] using BDD-based electrodes. In addition, the wettability could be modulated [33], which effectively accelerates the thermodynamics of the electrochemical reaction by achieving reactant enrichment and product escape [34]. Therefore, it is necessary to fabricate nanostructured BDD to further improve the electrochemical detection sensitivity of BDD electrodes.
In this study, a superhydrophilic BDD nanowire array (BDD-NWA) electrode is prepared using the microwave plasma chemical vapor deposition (MPCVD) method and inductively coupled plasma reactive ion etching (ICP-RIE) for trace detection of MB. The diameters of the BDD nanowire can be controlled by adjusting the preparation conditions. The electrochemical behaviors of MB on the BDD-NWA electrode are studied. It is found that the electrochemical oxidation process of MB involves one electron and one proton. Compared with the BDD electrode, the BDD-NWA electrode shows better sensitivity, with a wider linear range and a lower detection limit. The widest linear range of 0.04–10 μM and the lowest detection limit of 0.72 nM are achieved through electrochemical detection of samples with different nanowire diameters. The BDD-NWA electrode also exhibits good repeatability, stability, and detection in tap water, achieving satisfactory recoveries (93.8%–107.5%) and real-time monitoring.

2. Experimental

2.1. Materials

MB (>98%) was purchased from Aladdin Reagent Company Limited [35]. Phosphate-buffered saline (PBS) solutions, used as supporting electrolytes and solvents to dilute detected compounds in the experiments, were prepared by combining g potassium dihydrogen phosphate (KH2PO4), sodium hydroxide (NaOH), and deionized water. Phosphoric acid (H3PO4) and NaOH were used to adjust the pH values of the electrolytes.

2.2. Preparation of Electrodes

The polycrystalline BDD film was synthesized on a silicon (Si) substrate using a microwave plasma chemical vapor deposition (MPCVD) system at 2.45 GHz. Before growth, the Si substrate was polished with nano-diamond for 15 min and sonicated in a suspension containing nano-diamond for 30 min. Methane (CH4) and trimethylborate (B(OCH3)3) were used as carbon and boron sources, respectively. The microwave power was 2.2 kW, the pressure was 10 kPa, the temperature was 800 °C, and a mixture of gases comprising hydrogen (H2, 200 sccm), CH4 (8 sccm), and B (OCH3)3 (bubbled and carried by 6 sccm H2) was introduced into the reaction chamber.
To obtain BDD-NWA, the BDD was covered with a thin gold (Au) film using magnetron sputtering for 20–60 s, and then subjected to oxygen plasma etching for 10–20 min using ICP-RIE (DISC-ICP-8100, Beijing, China). In the etching progress, the pressure was 1.33 Pa, the oxygen flow rate was 30 sccm, the ICP power was 700 W, and the radio frequency power was 100 W.

2.3. Characterization of Electrodes

The morphologies and topographies of electrodes were characterized using scanning electron microscopy (SEM, FEI MAGELLAN-400, Waltham, MA, USA), X-ray diffraction (XRD, RigakuD/MAX-RA, Tokyo, Japan), and Raman spectroscopy (Renishaw inVia Raman Microscope, London, UK, equipped with 532 nm laser excitation). The contact angles were measured using contact angle measurements (XG-CAMC33, Shanghai, China) [29,36].

2.4. Electrochemical Measurement

Electrochemical impedance spectroscopy (EIS), cyclic voltammetry (CV), and square wave voltammetry (SWV) were conducted with an electrochemical workstation (CHI 760, Shanghai, China). The electrochemical measurements were conducted in a three-electrode system, which was composed of the obtained sample as the working electrode, platinum foil as the counter electrode, and a saturated silver/silver chloride (Ag/AgCl) as the reference electrode. Different concentrations of MB solutions were obtained by dissolving different masses of MB powders in PBS.

3. Results and Discussion

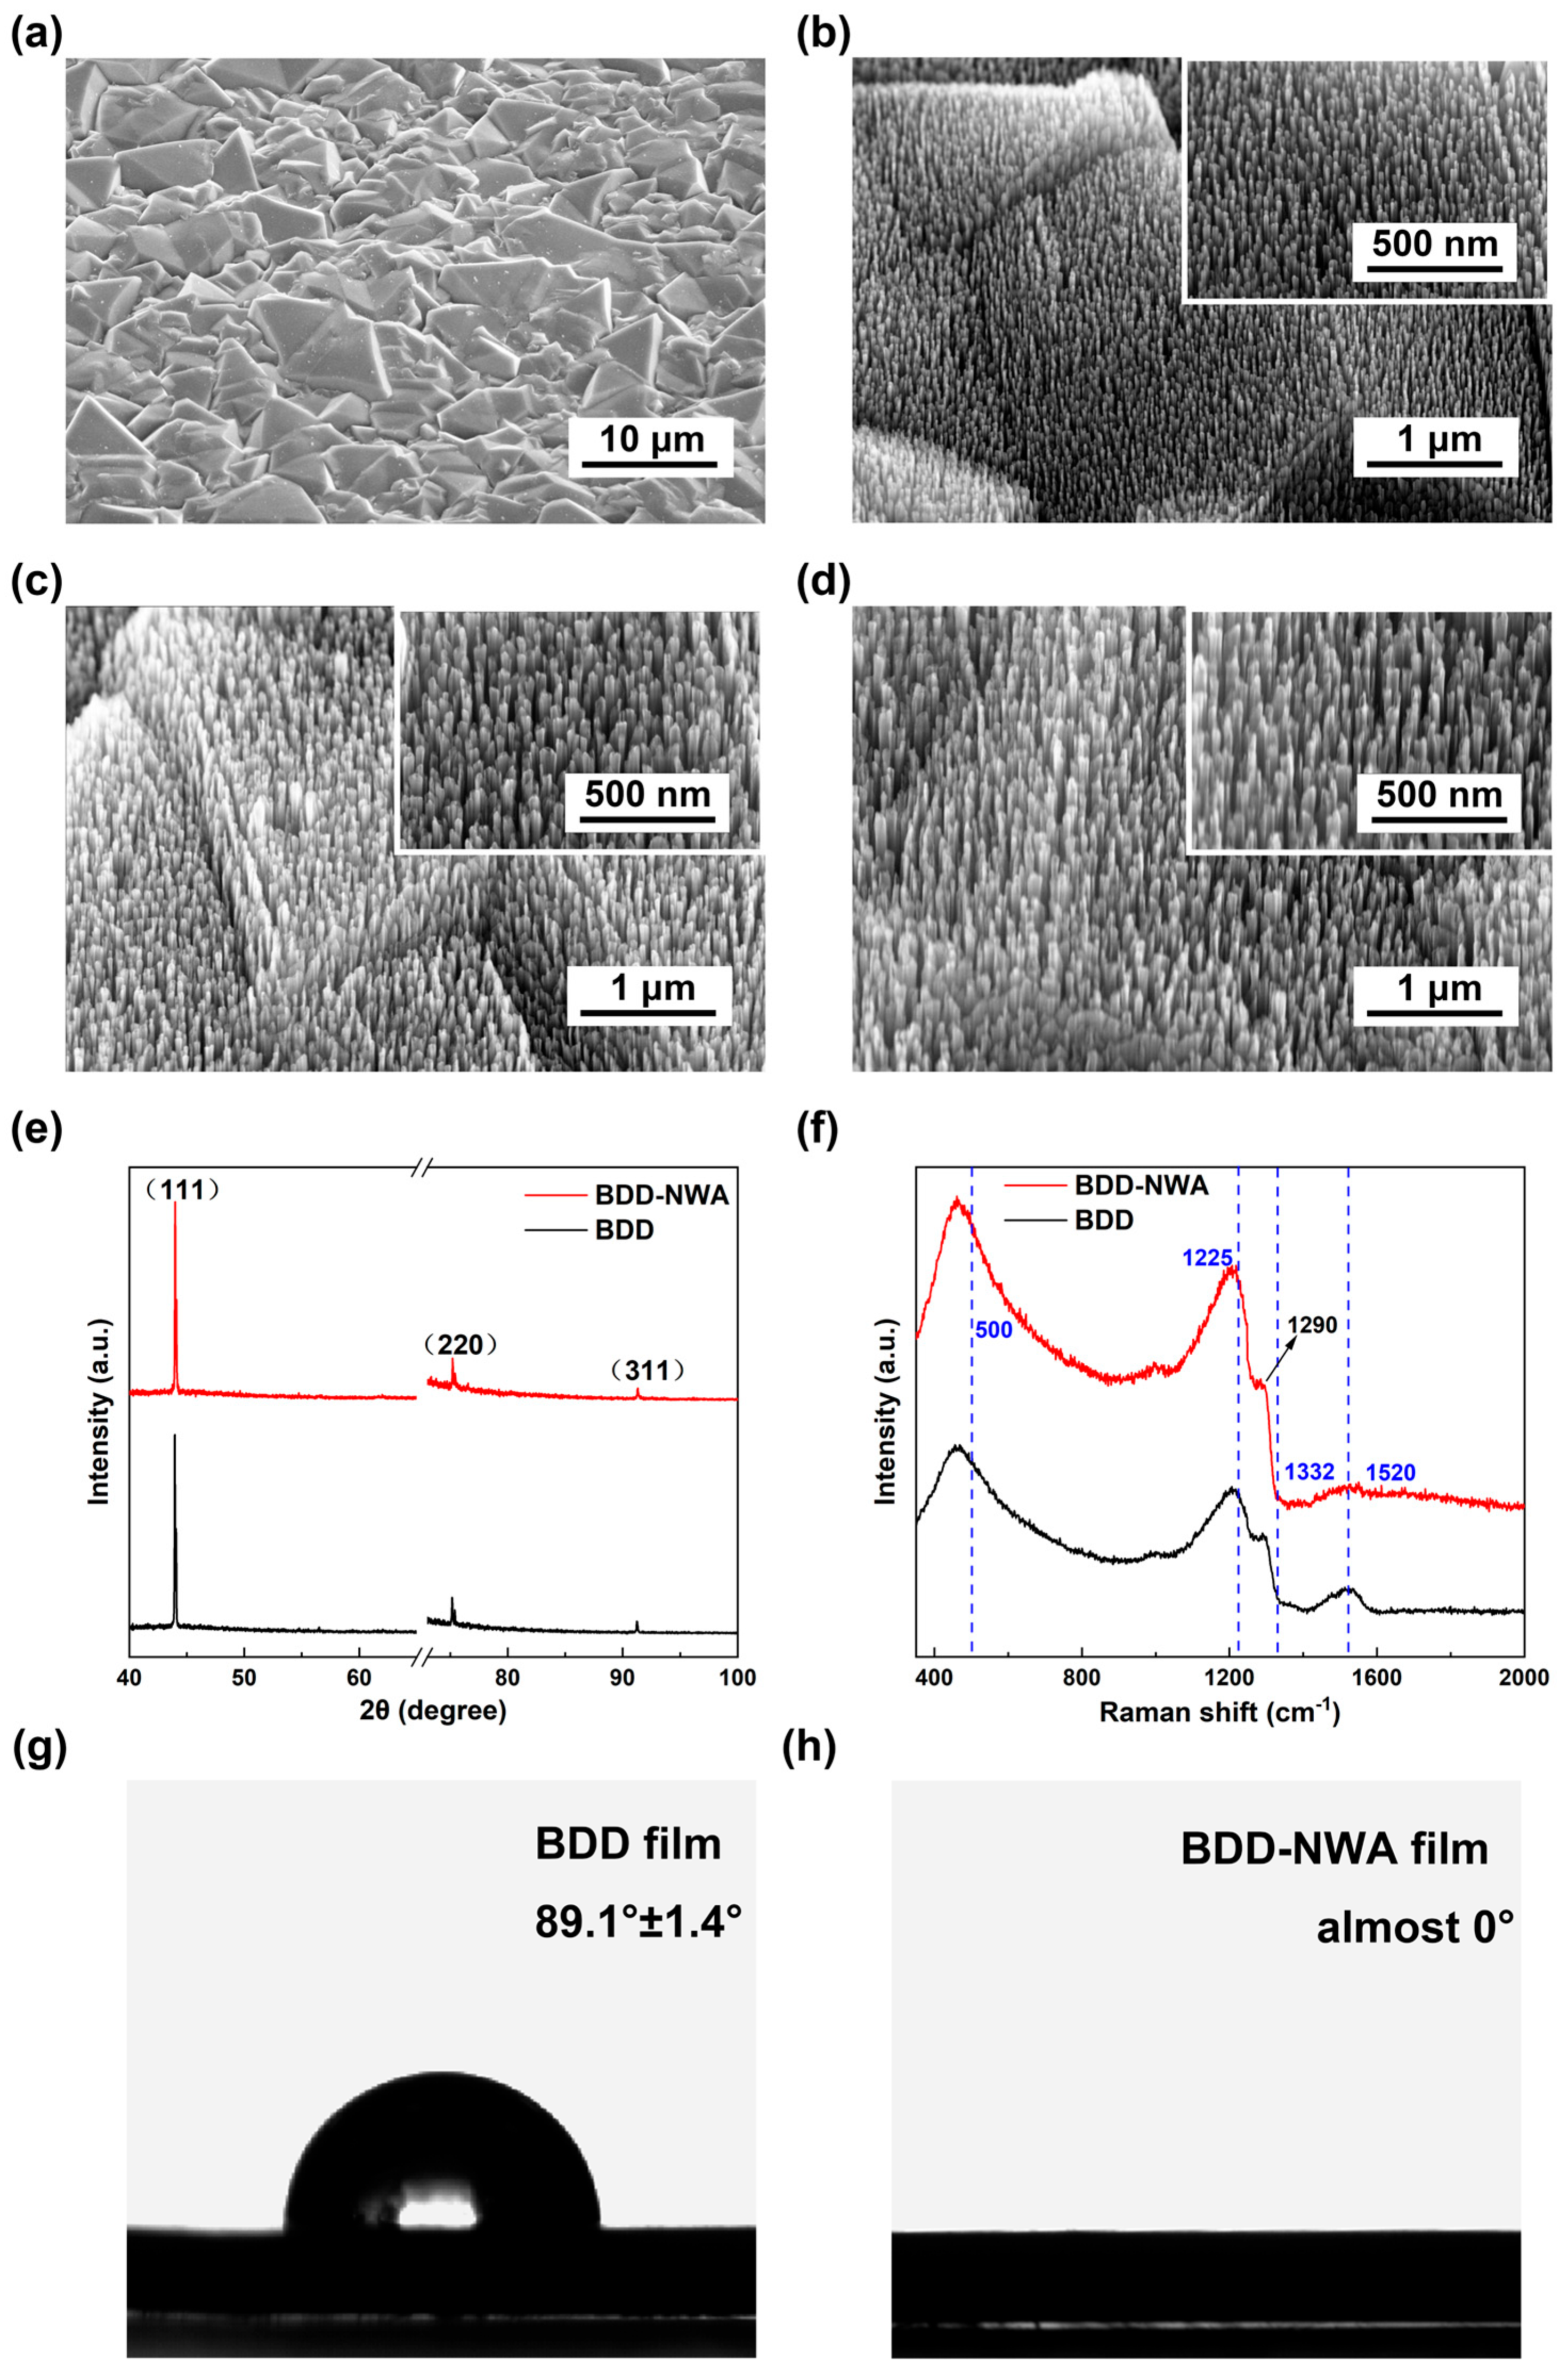
3.1. Characterization of BDD-NWA Electrode

As shown in Figure 1a, the BDD film mainly comprises grains with an average size of about 5 μm. After being covered by the Au film and etched by oxygen plasma, the Au nanoparticles formed from the Au film during the etching process act as masks [37], and thus, the dense nanowire arrays form on the surface. The size of the Au nanoparticles will increase as the thickness of the Au film increases. Therefore, the diameter of the BDD nanowires can be controlled by adjusting the sputtering and etching times. As shown in Figure 1b–d, BDD-NWA with average nanowire diameters of 20 nm (BDD-NWA-20), 38 nm (BDD-NWA-38), and 50 nm (BDD-NWA-50) were fabricated.
The XRD patterns of BDD and BDD-NWA are shown in Figure 1e. Due to the intensity of the Si (400) diffraction peak (located at 69.3°) being several hundred times higher than that of the diamond, the spectrum is truncated from 65° to 73°. The diffraction peaks located at 43.9°, 75.2°, and 91.3° are assigned to the diamond (111), (220), and (311) planes. The (111) diffraction peak dominates the spectra, indicating that the BDD film is mainly composed of diamond (111) planes. According to the substitution model [38], the boron concentrations of the BDD and BDD-NWA samples are estimated to be 1.51 × 10²¹ and 1.49 × 1021 cm−3, respectively.
Figure 1f presents the Raman spectra of the BDD and BDD-NWA electrodes. Two strong bands are observed around 500 and 1225 cm−1, indicating the locally distorted lattice structure caused by boron doping. These two peaks are observed when the concentration of boron atoms reaches 1020–1022 cm−3 [39,40,41]. As a result of the Fano effect (a scattering resonance phenomenon that produces asymmetric lines, caused by a quantum mechanical interference between the zone-center Raman-active optical phonon and the continuum of electronic states induced by the presence of the dopant), caused by heavy boron doping, the zero-phonon vibration modes of BDD and BDD-NWA become asymmetrical and redshift to 1290 cm−1 compared to that of intrinsic diamond (1332 cm−1) [42,43,44]. The obvious G band peak at 1520 cm−1 is attributed to graphite impurities [41]. Compared with the BDD, the G band peak is weaker on the BDD-NWA spectrum, which means that graphite impurities are almost removed after etching with oxygen plasma. According to the Raman spectra, the boron concentrations of the BDD and BDD-NWA samples are estimated using the following equation [40]:
C B = 8.44 × 10 30 e 0.048 W
where CB is the boron concentration, and W is the wave number of the Lorentzian component of the strong band at around 500 cm−1. The boron concentrations of the BDD and BDD-NWA samples are calculated to be 1.55 × 10²¹ and 1.48 × 1021 cm−3, respectively, which match the results obtained from the XRD patterns. The energy required for a boron atom to transfer from boron carbide to diamond comes from the energy gain from converting graphite to diamond, in addition to the entropy effect of dissolving the boron atom in diamond [45].
Figure 1g,h show the contact angle images of 5 µM MB in pH 7 PBS drops on the BDD and BDD-NWA films. The contact angle of the MB solution on the BDD film is 89.1 ± 1.4° (Figure 1g), which indicates that the BDD film is hydrophobic. It is attributed to the H-terminated surface of the as-grown BDD film. The MB solution droplet spreads out quickly when it contacts the BDD-NWA film, and the contact angle is almost 0° (Figure 1h), showing the superhydrophilicity of the BDD-NWA film. The O-terminated surface caused by oxygen plasma treatment and the micro-nano-structure jointly lead to the superhydrophilicity. Therefore, the BDD-NWA film would be completely wetted by the electrolyte solution as an electrode, which results in a higher electroactive surface area, as well as a faster charge transfer rate and higher current response [34].

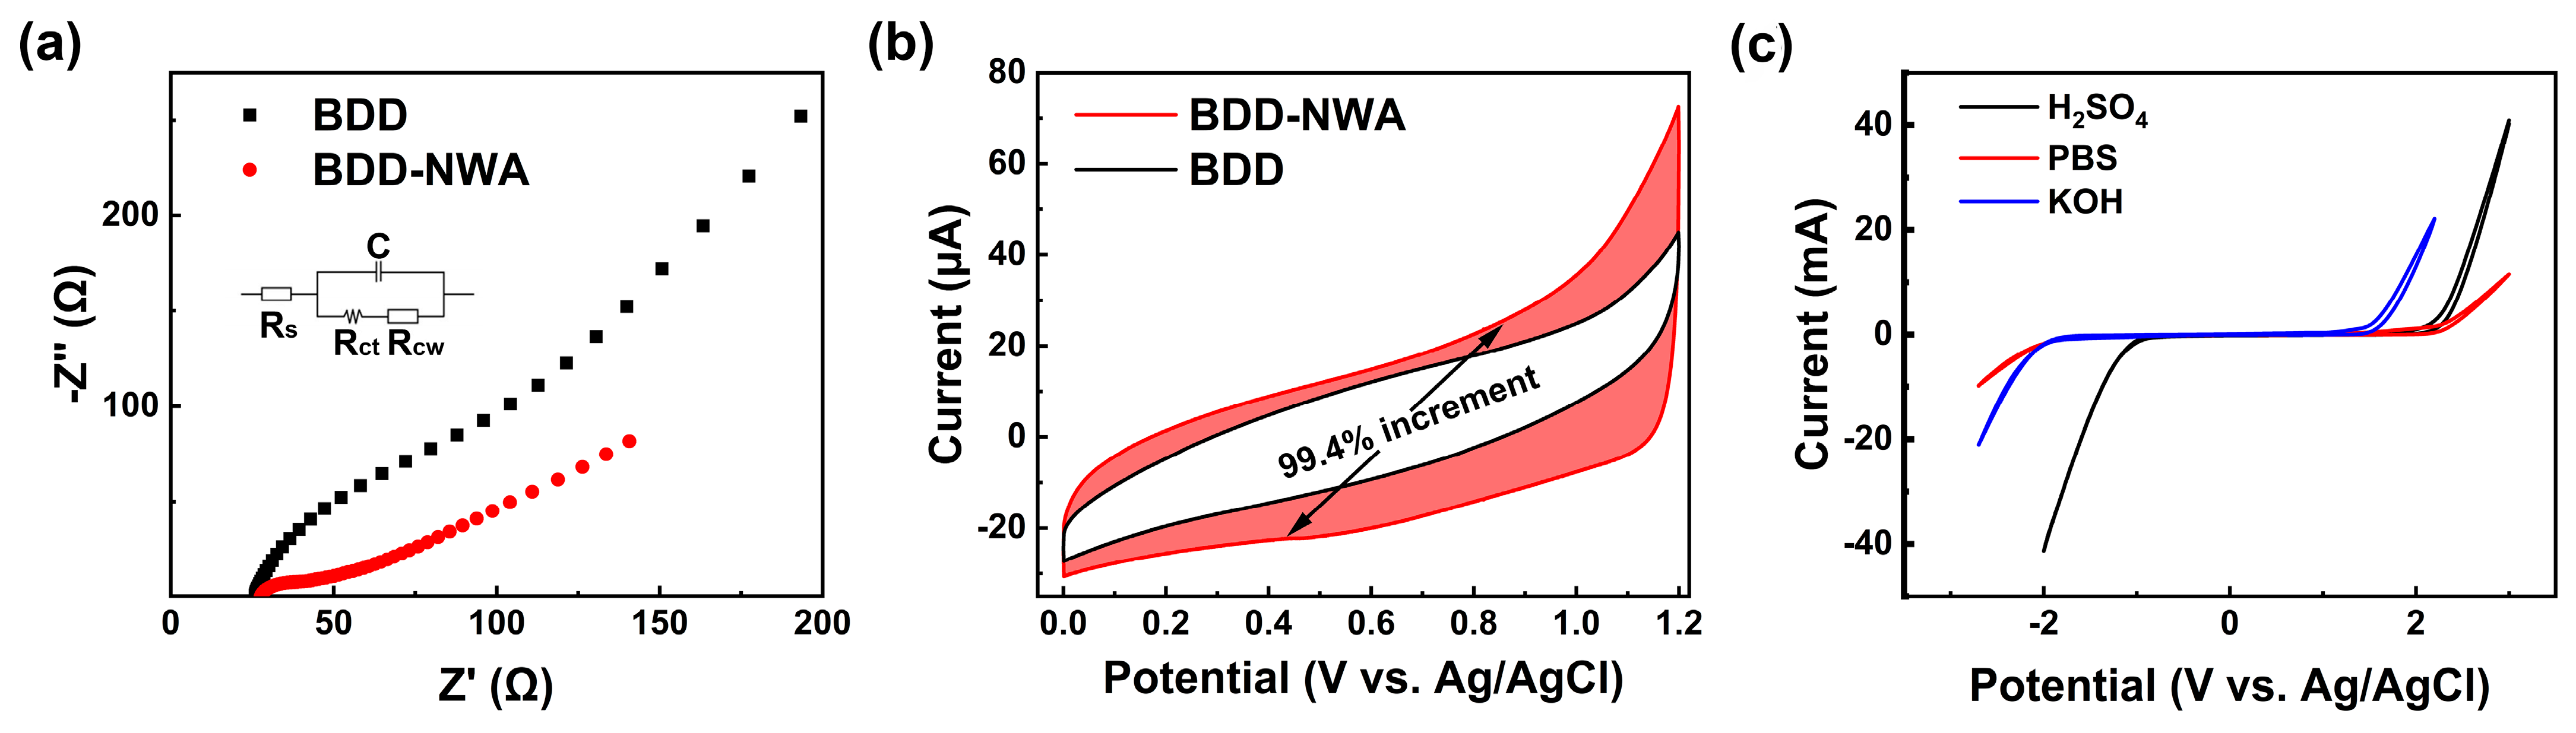
3.2. Electrochemical Characterization of BDD-NWA Electrode

EIS spectra were used to evaluate the charge transfer resistance and ion diffusion process of the BDD and BDD-NWA electrodes in Figure 2a. The charge transfer resistance (Rct) between the electrode and solution is reflected by the semicircular portion in the high frequency range, and the ion diffusion process is reflected by the straight part in the low frequency range [46]. The Rct of the BDD and BDD-NWA are fitted to be 325 and 20 Ω, respectively, indicating that the BDD-NWA electrode has a faster charge transfer rate. Figure 2b shows the CV curves of the BDD and BDD-NWA electrodes tested in PBS. With a scan rate of 50 mV s−1, the highest currents were obtained from the BDD and BDD-NWA electrodes at 1.2 V is 44.91 and 72.51 μA, respectively, and the lowest currents were obtained from the BDD and BDD-NWA electrodes at 0 V is −27.28 and −30.65 μA, respectively. The area formed by the CV curve of the BDD-NWA electrode is almost twice that of the BDD electrode, which means that the BDD-NWA electrode has a higher electroactive surface area to provide more active sites for electrochemical behaviors. Figure 2c shows the CV curves of the BDD-NWA electrode in different electrolytes with a scan rate of 100 mV s−1. The potential windows in sulfuric acid (H2SO4), PBS, and potassium hydroxide (KOH) are about 3.5, 4.4, and 3.7 V, respectively. The BDD-NWA electrode has wide potential windows in acidic, neutral, and alkaline solutions, with the widest being that in neutral solutions.

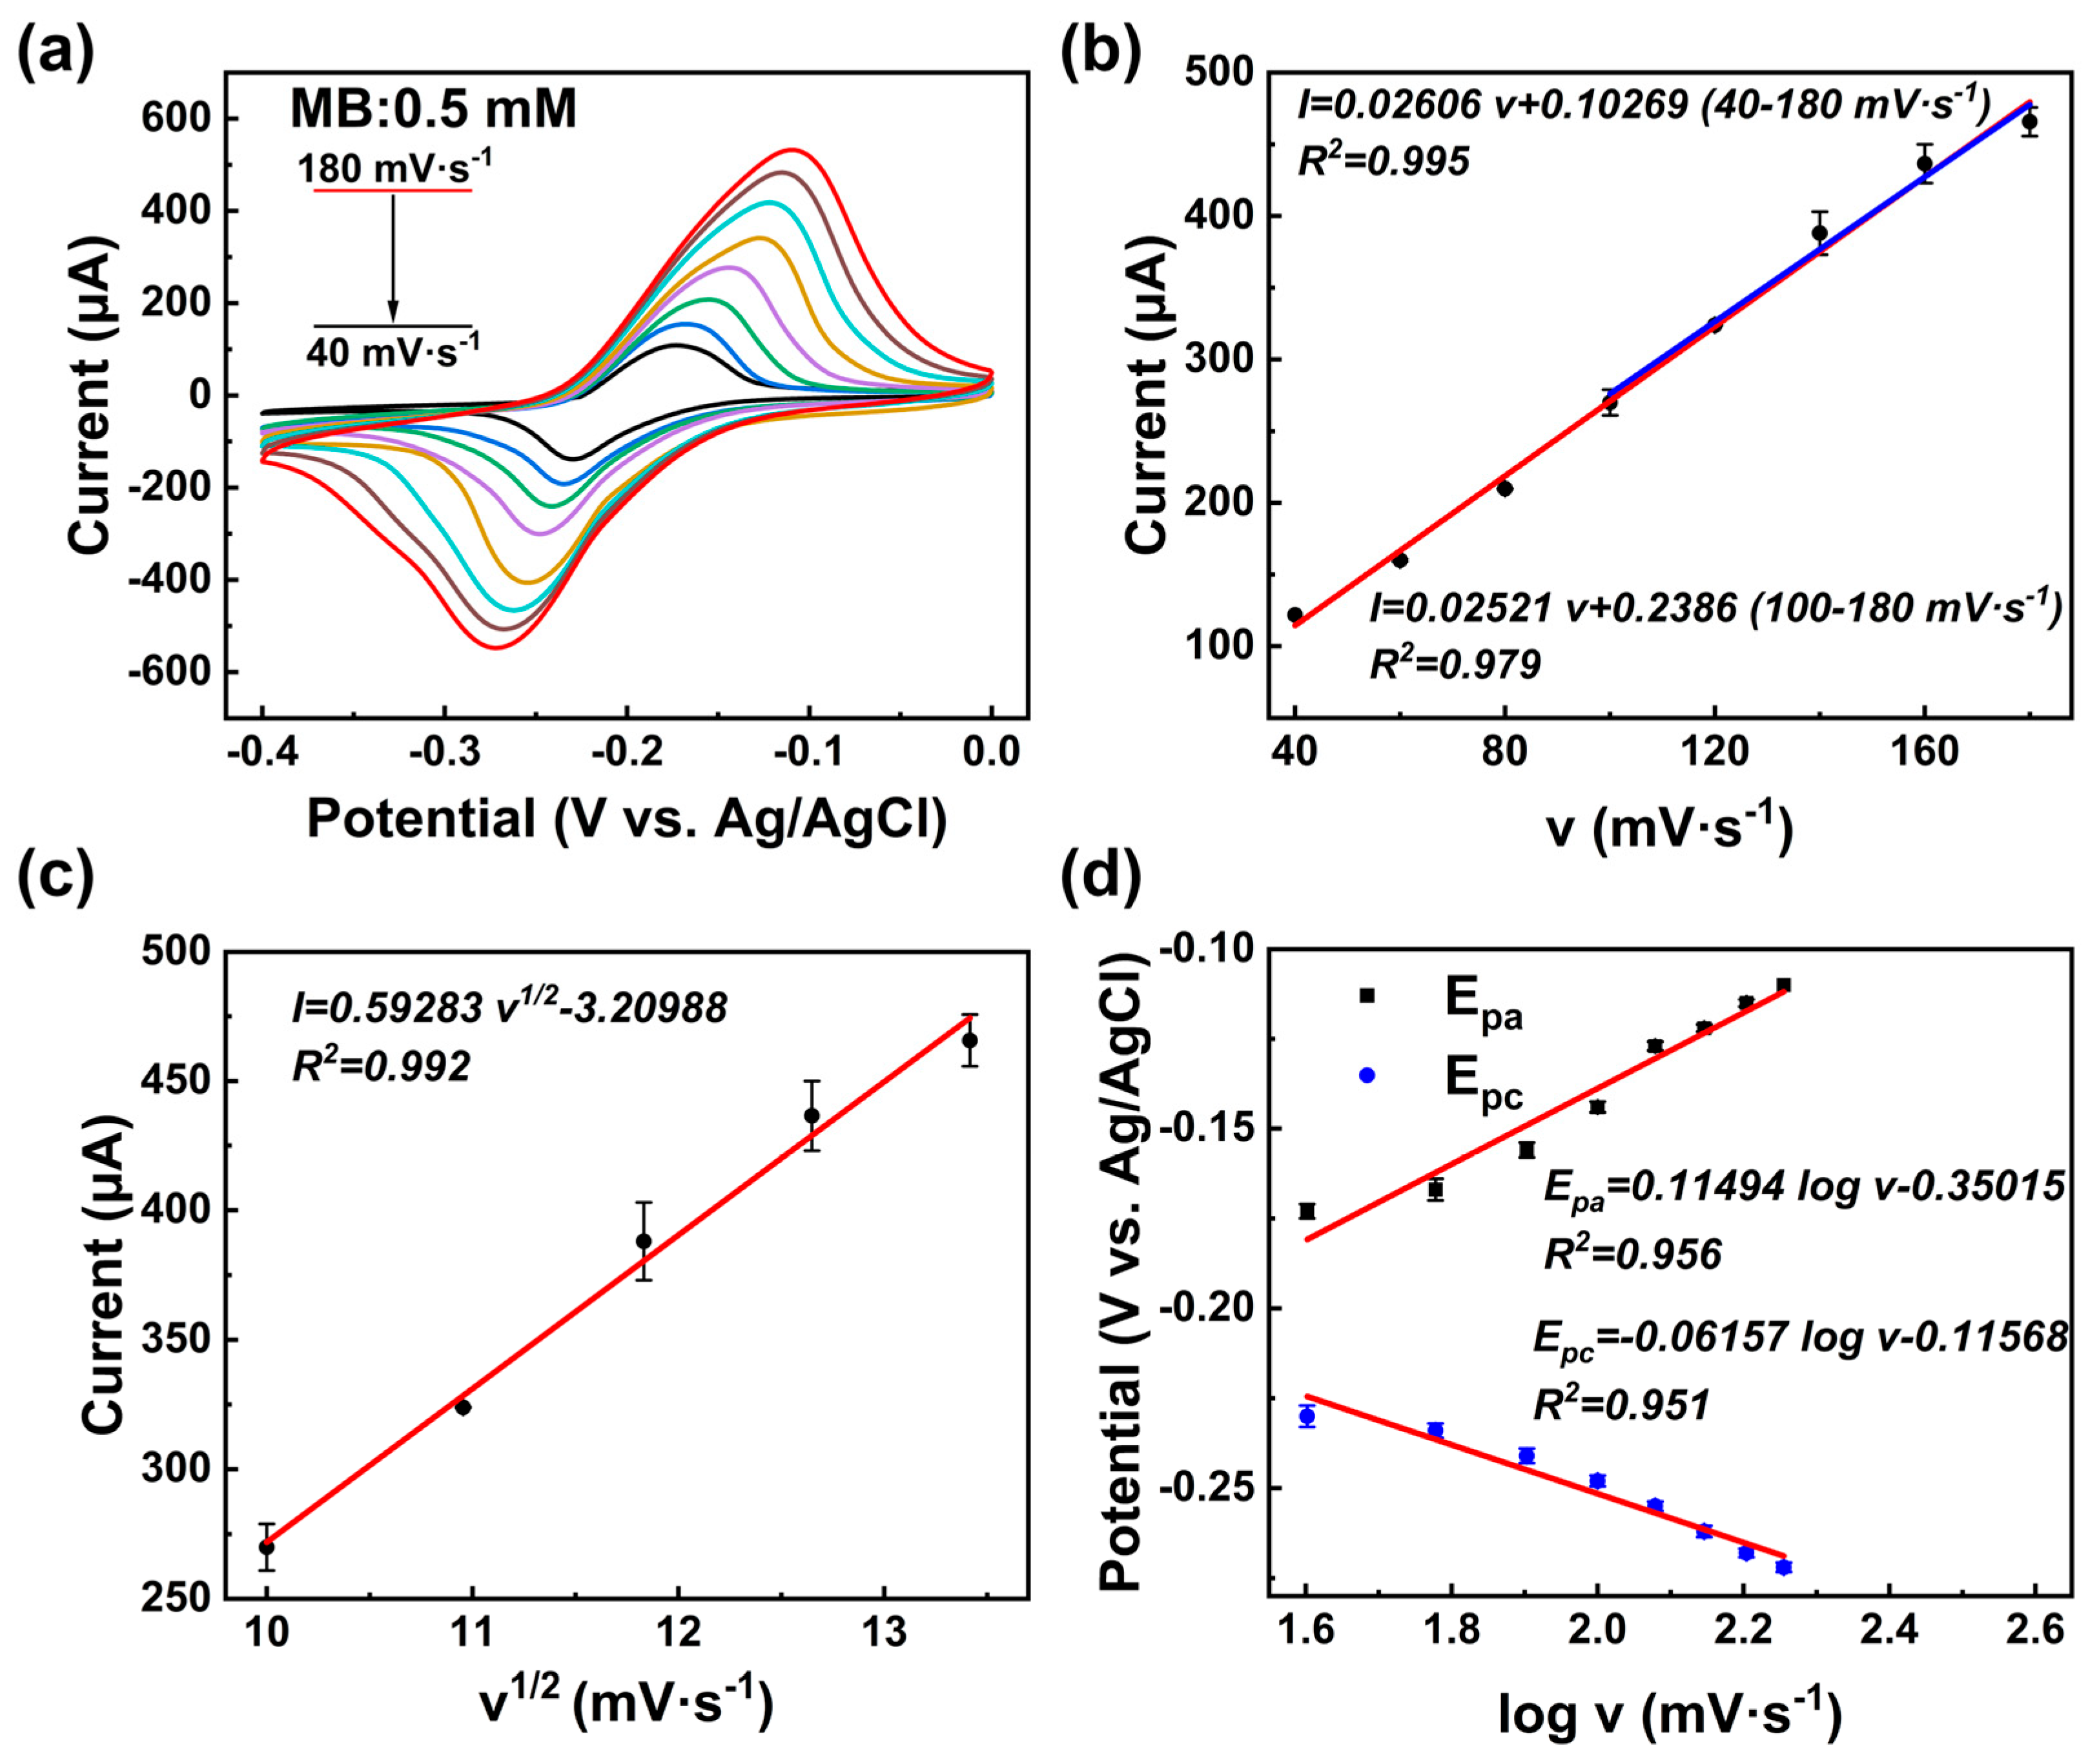
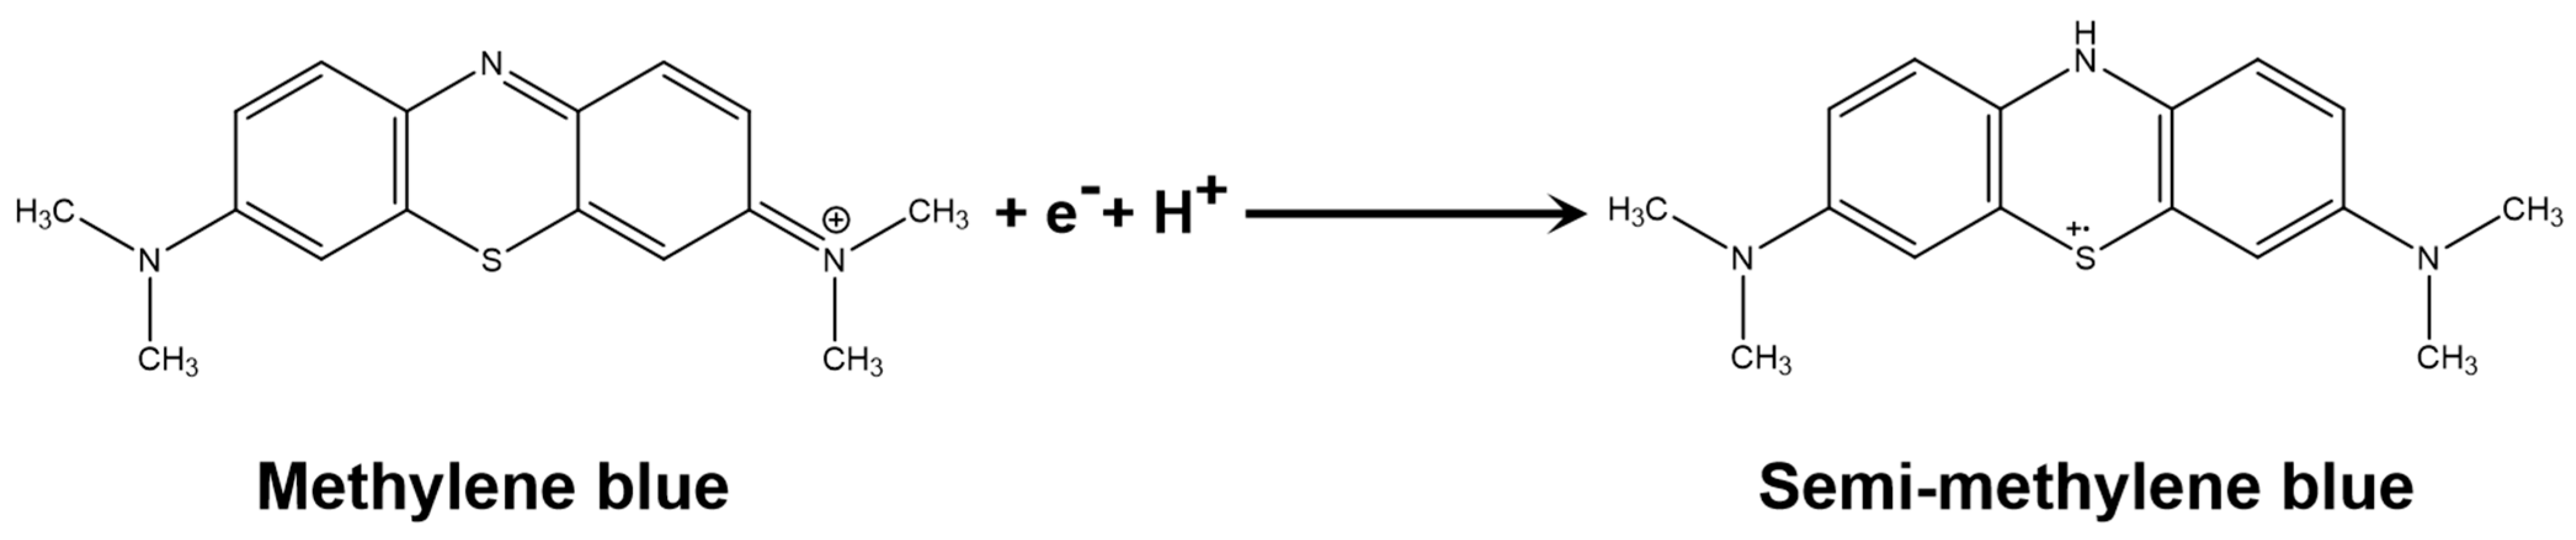
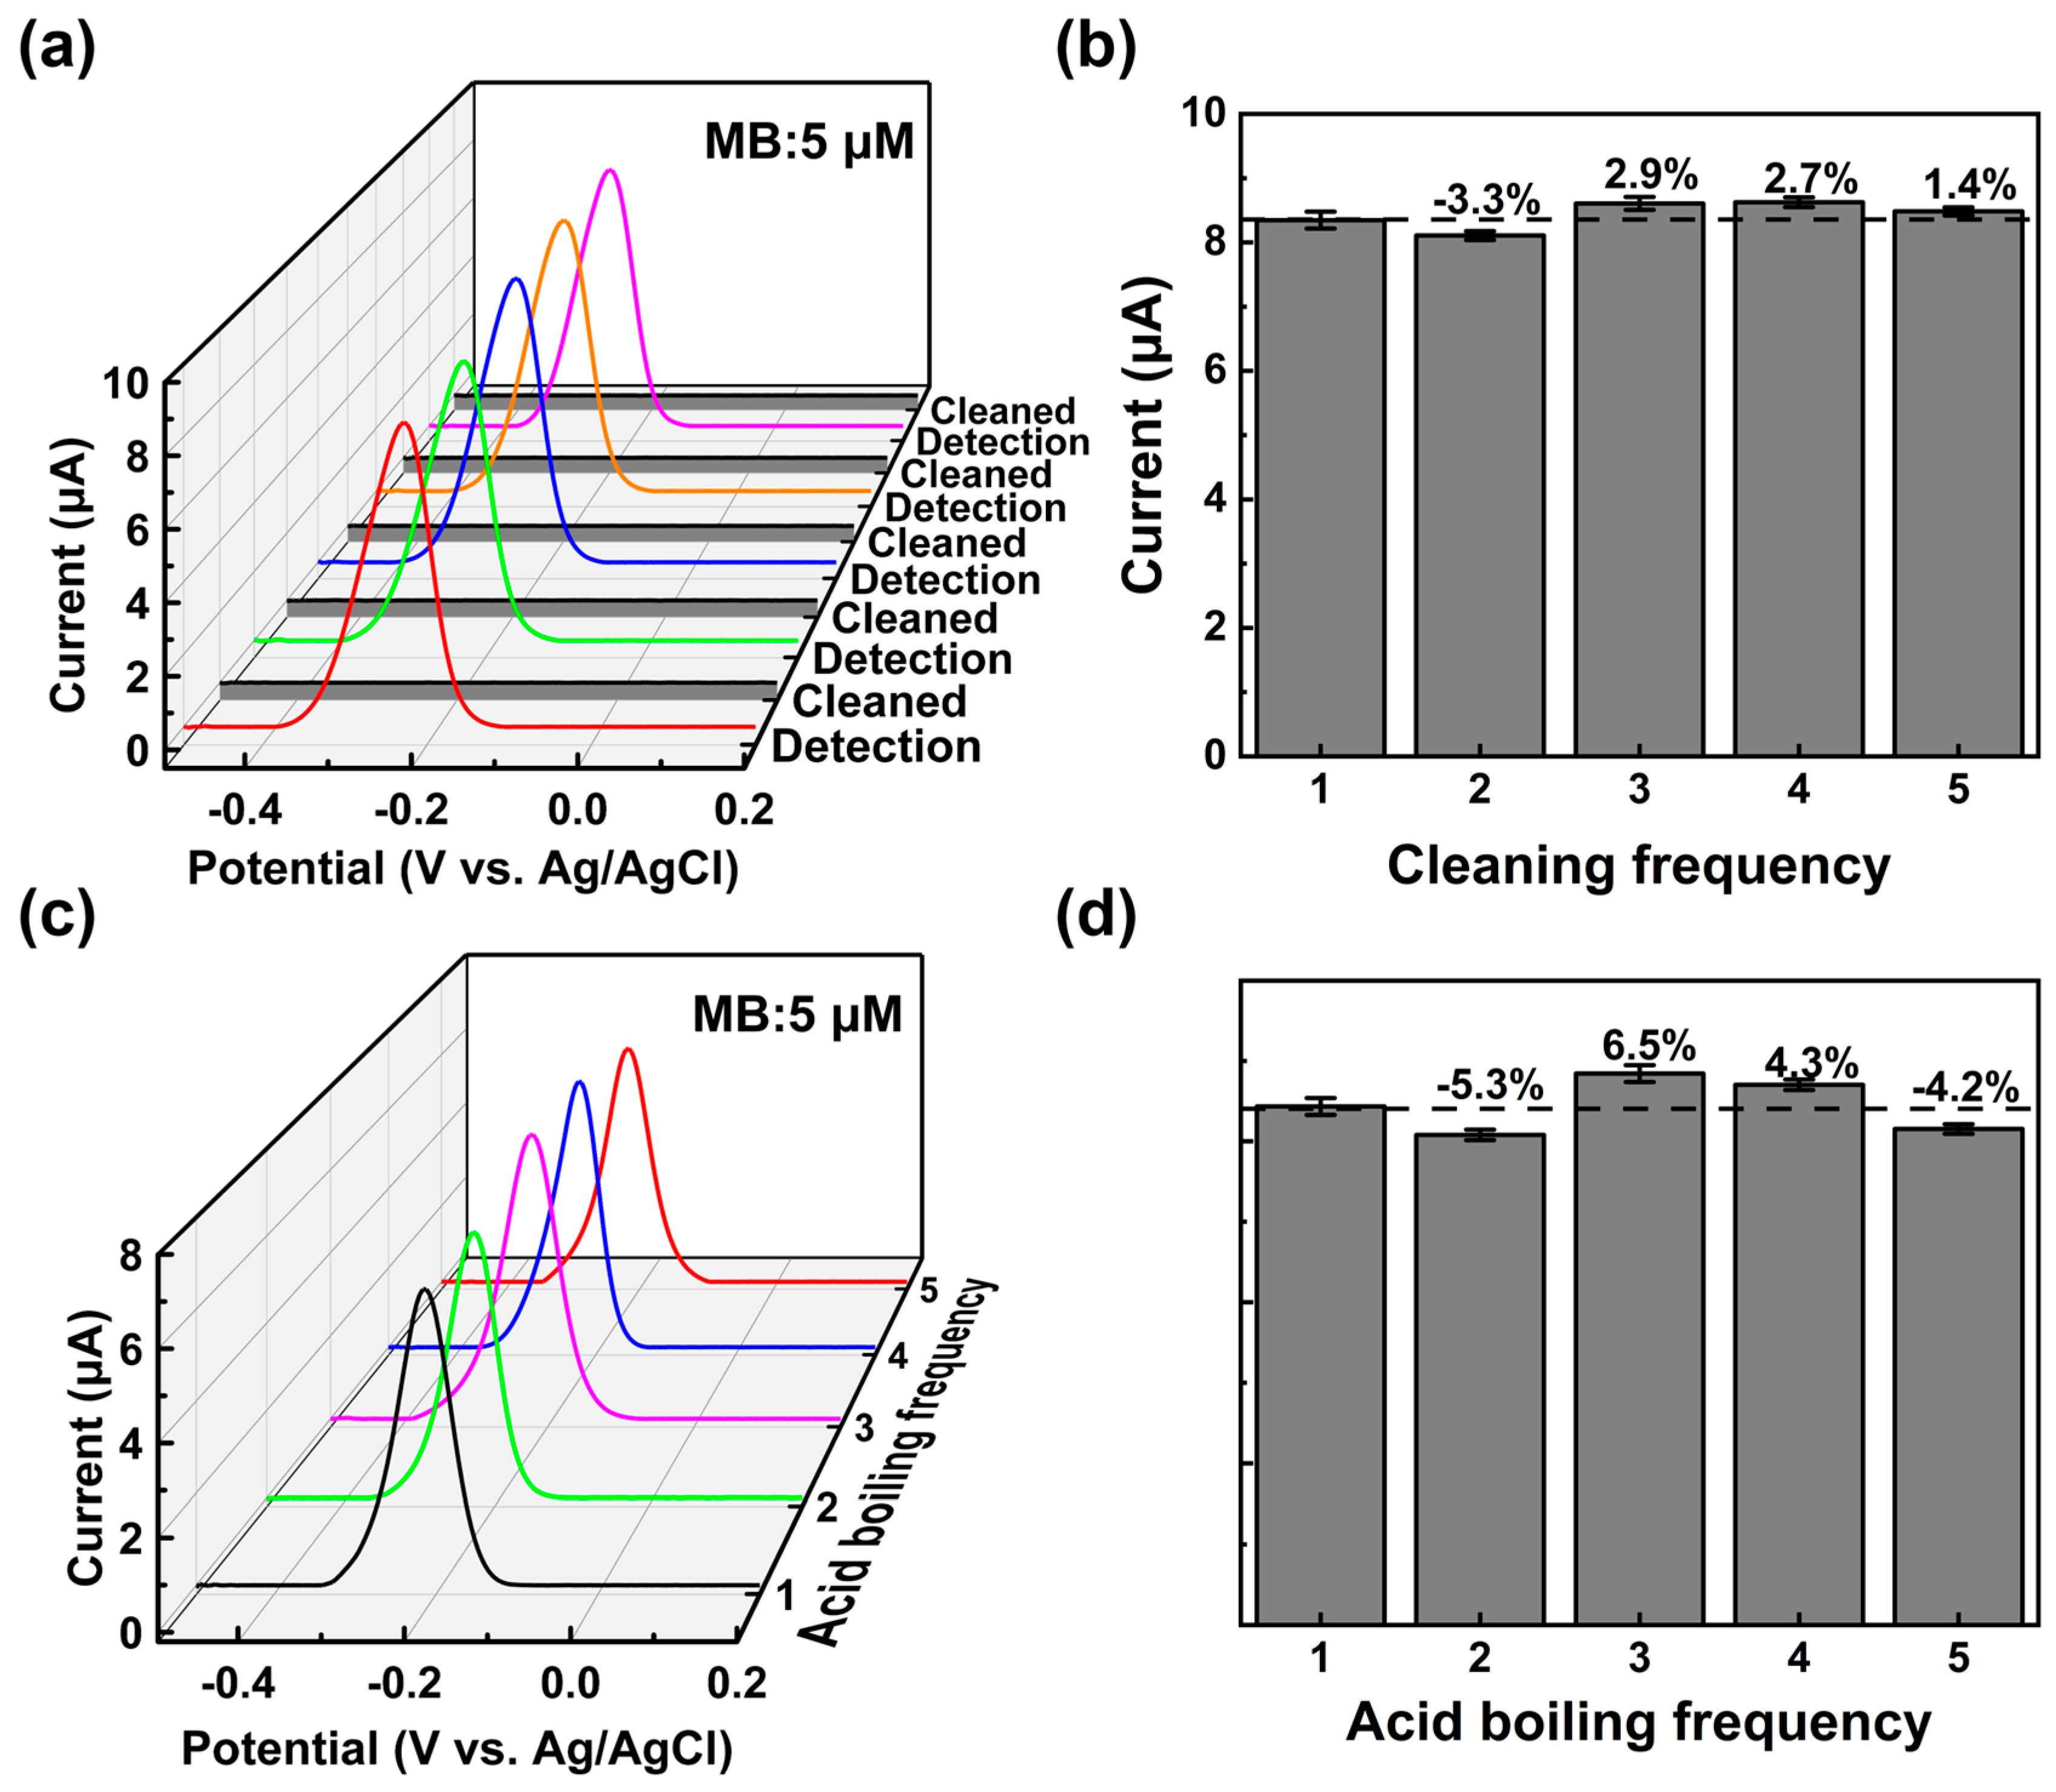
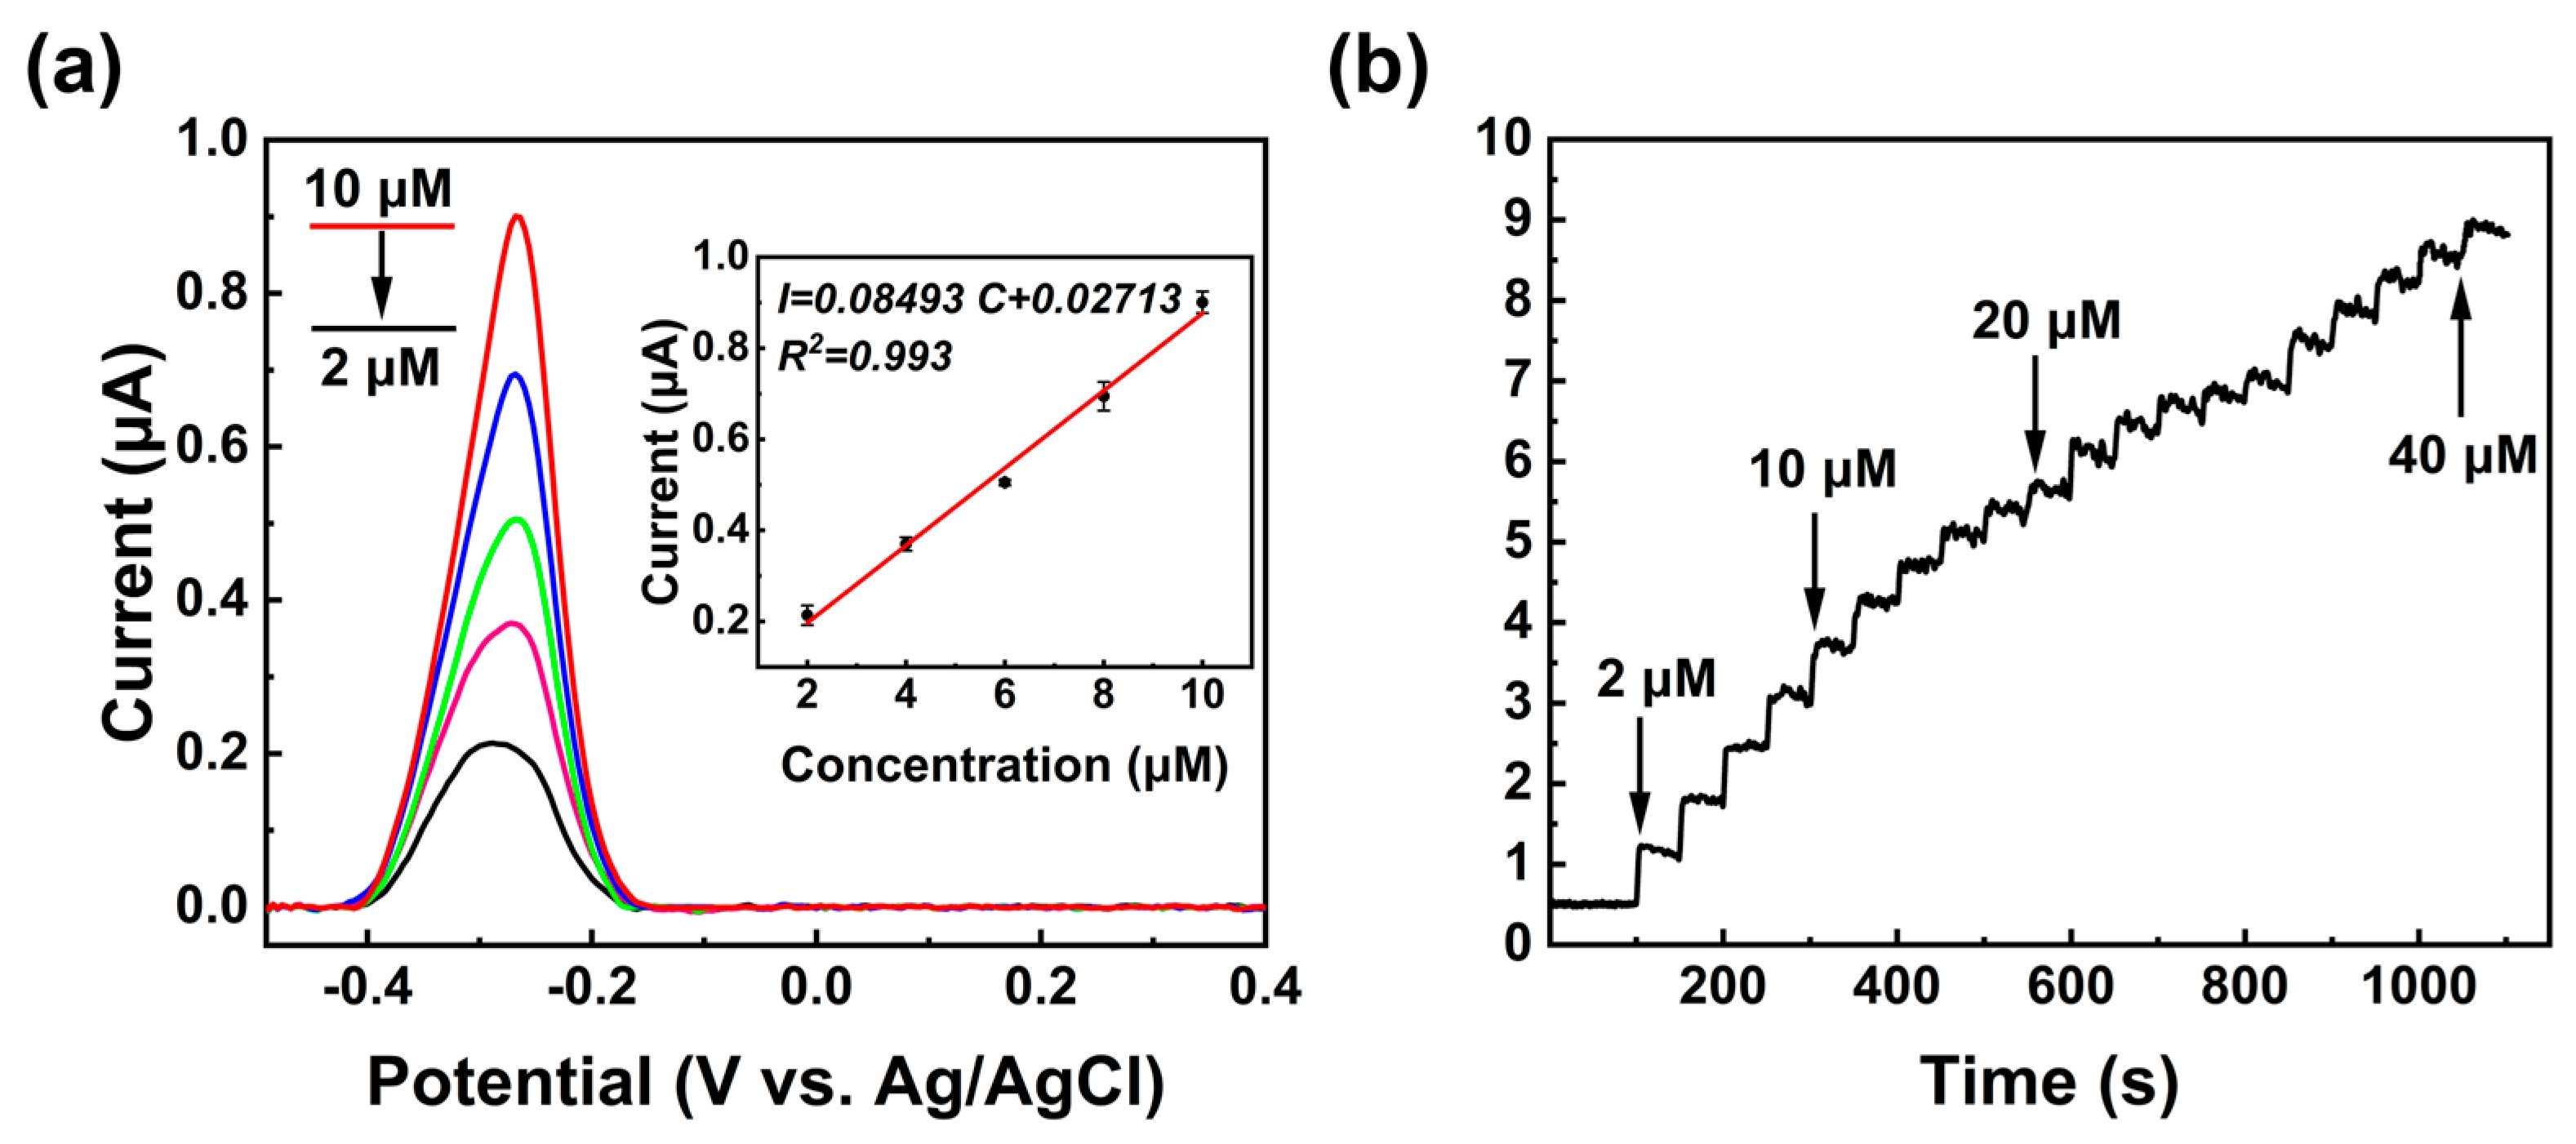
3.3. Detection of MB

The SWV technique was applied to investigate the effect of pH on the response of MB (10 μM) in PBS at a pH value between 4 and 10 (Figure 3a). The peak current increases as the pH value increases from 4 to 7, and then it decreases for pH = 7–10; thus, a maximum current appears at pH = 7 (Figure 3b). Therefore, further experiments were conducted at pH = 7. As shown in Figure 3c, the peak potential (Ep) shifts negatively as the pH value increases. The linear relationship is expressed as: Ep = −0.5214 pH + 0.15586 (R2 = 0.994). The ratio of protons and electrons involved can be estimated by using the following equation [47]:
Δ E p Δ p H = 2.303 R T m F n
where R is the gas constant (8.314 J K−1 mol−1), T is the temperature (298 K), F is the Faraday constant (96,485 C mol−1), m is the number of proton transfers, and n is the number of electron transfers. The value of m/n is calculated to be 0.9 ≈ 1, indicating that the number of electrons and protons involved in the electrochemical oxidation process are equal.
The CV was used to investigate the effect of scan rates on the peak current and potential of MB in PBS for the BDD-NWA electrode in Figure 4a. The CV curve with a scan rate of 40 mV s−1 was chosen to estimate the Gibbs free energy (ΔG0) and the equilibrium constant (Kc), which are calculated by using the following equations [48]:
Δ G 0 = 2.303 R T log K c
K c = 0.434 n F R T Δ E p
where ΔEp is the difference between the anodic peak potential (Epa) and cathodic peak potential (Epc). With Epa = −0.173 V and Epc = −0.23 V, ΔG0 and Kc are calculated to be −5499.6 J mol−1 and 9.2, respectively, indicating that the redox reaction is spontaneous and reversible. The CV curves are not completely symmetrical, denoting a quasi-reversible process. The anodic peak currents are linearly related to the scan rate (Figure 4b), suggesting that the oxidation is an absorption-controlled process. At the high scan rate from 100 mV s−1 to 180 mV s−1, the anodic peak currents are linearly related to the square root of the scan rate (Figure 4c), suggesting that the oxidation is a diffusion-controlled process. By comparing the fitted R2 of the absorption-controlled process and diffusion-controlled process at high scan rates (100–180 mV s−1), the diffusion-controlled process is dominant as a result of the stronger correlation between the peak current and scan rate.
As shown in Figure 4d, there is a positive shift of Epa and a negative shift of Epc with the increasing scan rates, and the peak potentials change linearly with an increase in the logarithm of the scan rate (log ν). The relationship can be expressed as Epa = 0.11494 log v-0.35015 (R2 = 0.956) and Epc = −0.06157 log v-0.11568 (R2 = 0.951). According to Laviron’s equation, the number of electrons involved and the charge transfer coefficient are calculated by using the following equations [49]:
E pc = E 0 2.3 R T α n F log v
E pa = E 0 + 2.3 R T ( 1 α ) n F log v
where E0 is the formal potential and α is the charge transfer coefficient. Based on the fitted linear relationships, α is 0.7 and n is 1.3. As a result, the electrochemical oxidation of MB at the BDD-NWA electrode is a one-electron transfer reaction. Based on the above results, the oxidation mechanism of MB involves one electron and one proton (Figure 5).
Figure 6a shows the SWV curves for different concentrations of MB in PBS, obtained with the BDD electrode. The peak potential of MB is around −0.28 V, and the peak currents increase gradually as the concentration increases. As shown in Figure 6b, the linear dependence of the peak current and concentration is within a linear range of 0.25–10 μM, and the linear equation is described as I = 0.41313 C + 0.00967 (R2 = 0.976). As shown in Figure 6c,d, for the BDD-NWA-38 electrode, the peak current values show a similar tendency, and for the linear dependence of the peak current and concentration with a wider linear range (0.04–10 μM), the linear relationship is I = 5.6987 C − 2.17029 (R2 = 0.981). The detection limit, or limit of detection (LOD), is calculated by using the following equation [50]:
L O D = 3 σ k
where σ is the standard deviation of 10 current values at the peak position in blank solutions, and k is the slope of the fitting linear curve. The LOD of the BDD and BDD-NWA-38 electrodes is 75.8 and 0.72 nM, respectively. To investigate the effect of the BDD nanowires’ size on the detection performance, the SWV curves of the BDD-NWA-20 and BDD-NWA-50 electrodes were also tested, and the linear dependence of the peak current and concentration is shown in Figure 6e,f. The LOD of the BDD-NWA-20 and BDD-NWA-50 electrodes is calculated to be 7.2 and 9.7 nM, respectively, indicating that the BDD-NWA-38 electrode has the best detection performance. The LOD of the BDD-NWA electrode is about 100 times lower than that of the BDD electrode, suggesting that the BDD-NWA electrode has higher sensitivity. This is attributed to the higher electroactive surface area and the superhydrophilicity, which provide more active sites and accelerate the charge transfer rate. Compared with previous results (Table 1), the detection limit of the BDD-NWA electrode is close to or even exceeds some SERS substrates. Compared to some other electrodes, the BDD-NWA electrode has a wide linear range.
The repeatability and stability of the BDD-NWA electrode were tested. Figure 7a shows five detection/cleaning cycles of MB detection, obtained with the BDD-NWA electrode, with a concentration of 5 µM in PBS. After each detection, the electrode was ultrasonically cleaned in ethanol for 10 min, and then tested in PBS without MB (blank solution). There was no MB response in the blank solutions, meaning that the MB molecules had been efficiently removed. Compared with the first detection, the peak current fluctuation range tested multiple times was −3.3% to 2.9% (Figure 7b), indicating the repeatability of the BDD-NWA electrode. Subsequently, the electrode was boiled five times in a mixture of concentrated sulfuric acid and concentrated nitric acid, with an SWV detection of 5 µM MB in PBS after each acid boiling. A sensitive and stable MB response was still obtained (Figure 7c). Compared with the first detection after acid boiling, the peak current fluctuation range was within −5.3% to 6.5% (Figure 7d), indicating the stability of the BDD-NWA electrode. Moreover, it was easy to remove some stubborn pollutants by acid boiling without affecting the performance of the BDD-NWA electrode.
The detection of MB in environmental water was performed to demonstrate the feasibility of using the BDD-NWA electrode in practical samples. Tap water was used as the actual sample. As shown in Figure 8a, the peak currents obtained from tap water were lower than those obtained from PBS, while a high linear correlation of peak current and concentration in the concentration range of 2–10 µM were still achieved (inset of Figure 8a). The BDD-NWA electrode showed satisfactory recoveries of 93.8%–107.5%, and the relative standard deviation (RSD) was 0.6%–3.1% (Table 2). Figure 8b shows the amperometric response of different concentrations of MB in tap water at a constant potential of 1 V with stirring. Starting from the 100th second, the concentration of MB was increased by 2 M every 50 s. The current increased rapidly with each change in concentration, and the increase in the current was relatively stable. Therefore, the BDD-NWA electrode is expected to achieve real-time monitoring of MB in environmental water.
Based on the above results, the electrochemical detection performance of the BDD-NWA electrode is significantly improved compared to the BDD electrode due to the high electroactive surface area and superhydrophilicity. The performance can be further improved by adjusting the size of the nanowire. Moreover, according to the wide potential window and the performance of detection in tap water, the utility of the BDD-NWA electrode can be further extended to other substances.

4. Conclusions

In summary, a BDD-NWA electrode was prepared using MPCVD and ICP-RIE. The BDD-NWA electrode with different nanowire diameters was fabricated by adjusting the sputtering and etching times. The BDD-NWA electrode demonstrated superhydrophilicity, higher charge transfer efficiency, and a higher current than the BDD electrode. It was found that the electrochemical oxidation of MB on the BDD-NWA involves one electron and one proton. The BDD-NWA-38 electrode sensor had the widest linear range (0.04–10 μM) and the lowest detection limit (0.72 nM) for MB detection, which was attributed to numerous active ports, provided by the high electroactive surface area and fast charge transfer rate. In addition, the BDD-NWA electrode exhibited high sensitivity, repeatability, and stability for detecting MB. Moreover, the BDD-NWA electrode achieved satisfactory recoveries (93.8%–107.5%) and real-time monitoring in tap water. Considering the wide potential window (3.5–4.4 V) and the satisfactory performance in tap water, the BDD-NWA electrode is expected to be implemented for trace detection of more substances in complex environments. However, the function may be limited if the concentration is too high.

Author Contributions

Conceptualization, H.L. and J.L.; Formal analysis, S.H., K.L., S.C., N.G., J.L. and H.L.; Investigation, S.H. and K.L.; Data curation, S.H. and K.L.; Writing—original draft, S.H., N.G. and H.L.; Writing—review and editing, N.G., J.L. and H.L.; Funding acquisition, H.L. All authors have read and agreed to the published version of the manuscript.

Funding

This work was supported by the National Natural Science Foundation of China (NSFC) (Grant No. 52172044), Program of Science and Technology Development Plan of Jilin Province of China (Nos. 20210203167 SF, 20230201151 GX) and the Natural Science Foundation of Jilin Province (SKL202302006).

Institutional Review Board Statement

Not applicable.

Informed Consent Statement

Not applicable.

Data Availability Statement

Data are contained within the article.

Acknowledgments

The authors acknowledge the kind help of the Instrument and Equipment Sharing Platform of State Key Laboratory of Superhard Materials, Jilin University.

Conflicts of Interest

The authors declare no conflicts of interest.

References

  1. Hassan, S.S.; Sirajuddin; Solangi, A.R.; Agheem, M.H.; Junejo, Y.; Kalwar, N.H.; Tagar, Z.A. Ultra-fast catalytic reduction of dyes by ionic liquid recoverable and reusable mefenamic acid derived gold nanoparticles. J. Hazard. Mater. 2011, 190, 1030–1036. [Google Scholar] [CrossRef] [PubMed]
  2. Emmanuel, S.S.; Adesibikan, A.A. Bio-fabricated green silver nano-architecture for degradation of methylene blue water contaminant: A mini-review. Water Environ. Res. 2021, 93, 2873–2882. [Google Scholar] [CrossRef] [PubMed]
  3. Chen, W.S.; Chen, L.; Yang, S.S.; Chen, Z.Q.; Qian, G.N.; Zhang, S.X.; Jing, J.J. A novel technique for localization of small pulmonary nodules. Chest 2007, 131, 1526–1531. [Google Scholar] [CrossRef] [PubMed]
  4. Hamel, J. A Review of Acute Cyanide Poisoning with a Treatment Update. Crit. Care Nurse 2011, 31, 72–82. [Google Scholar] [CrossRef] [PubMed]
  5. Mathelin, C.; Croce, S.; Brasse, D.; Gairard, B.; Gharbi, M.; Andriamisandratsoa, N.; Bekaert, V.; Francis, Z.; Guyonnet, J.L.; Huss, D.; et al. Methylene Blue Dye, an Accurate Dye for Sentinel Lymph Node Identification in Early Breast Cancer. Anticancer Res. 2009, 29, 4119–4125. [Google Scholar] [PubMed]
  6. Peter, C.; Hongwan, D.; Küpfer, A.; Lauterburg, B.H. Pharmacokinetics and organ distribution of intravenous and oral methylene blue. Eur. J. Clin. Pharmacol. 2000, 56, 247–250. [Google Scholar] [CrossRef] [PubMed]
  7. Salhab, M.; Al Sarakbi, W.; Mokbel, K. Skin and fat necrosis of the breast following methylene blue dye injection for sentinel node biopsy in a patient with breast cancer. Int. Semin. Surg. Oncol. ISSO 2005, 2, 26. [Google Scholar] [CrossRef] [PubMed]
  8. Bai, S.W.; Huh, E.H.; Jung, D.J.; Park, J.H.; Rha, K.H.; Kim, S.K.; Park, K.H. Urinary tract injuries during pelvic surgery: Incidence rates and predisposing factors. Int. Urogynecol. J. 2006, 17, 360–364. [Google Scholar] [CrossRef] [PubMed]
  9. Lipskikh, O.I.; Korotkova, E.I.; Khristunova, Y.P.; Barek, J.; Kratochvil, B. Sensors for voltammetric determination of food azo dyes—A critical review. Electrochim. Acta. 2018, 260, 974–985. [Google Scholar] [CrossRef]
  10. Rengelshausen, J.; Burhenne, J.; Fröhlich, M.; Tayrouz, Y.; Singh, S.K.; Riedel, K.D.; Müller, O.; Hoppe-Tichy, T.; Haefeli, W.E.; Mikus, G.; et al. Pharmacokinetic interaction of chloroquine and methylene blue combination against malaria. Eur. J. Clin. Pharmacol. 2004, 60, 709–715. [Google Scholar] [CrossRef]
  11. Xu, J.Z.; Dai, L.; Wu, B.; Ding, T.; Zhu, J.J.; Lin, H.; Chen, H.L.; Shen, C.Y.; Jiang, Y. Determination of methylene blue residues in aquatic products by liquid chromatography-tandem mass spectrometry. J. Sep. Sci. 2009, 32, 4193–4199. [Google Scholar] [CrossRef] [PubMed]
  12. Nicolai, S.H.D.; Rodrigues, P.R.P.; Agostinho, S.M.L.; Rubim, J.C. Electrochemical and spectroelectrochemical (SERS) studies of the reduction of methylene blue on a silver electrode. J. Electroanal. Chem. 2002, 527, 103–111. [Google Scholar] [CrossRef]
  13. Razmara, R.S.; Daneshfar, A.; Sahrai, R. Determination of methylene blue and sunset yellow in wastewater and food samples using salting-out assisted liquid-liquid extraction. J. Ind. Eng. Chem. 2011, 17, 533–536. [Google Scholar] [CrossRef]
  14. Yuan, X.X.; Gao, N.; Gao, X.; Qiu, D.C.; Xu, R.; Sun, Z.L.; Jiang, Z.G.; Liu, J.S.; Li, H.D. Nanopyramid boron-doped diamond electrode realizing nanomolar detection limit of 4-nonylphenol. Sens. Actuator B-Chem. 2019, 281, 830–836. [Google Scholar] [CrossRef]
  15. Ma, Y.B.; Xu, X.Y.; Yang, T.Y.; Shen, Y.Y.; Jiang, F.; Zhang, Y.W.; Lv, X.T.; Liu, Y.M.; Feng, B.; Che, G.B.; et al. CO2 reduction synergistic tetracycline degradation toward Co-BiOBr ultrathin nanosheets with rich defects and (102) active faces. J. Alloy Compd. 2024, 970, 10. [Google Scholar] [CrossRef]
  16. Li, C.; Zhao, T.; Wei, Q.P.; Den, Z.J.; Long, H.Y.; Zheng, K.Z.; Li, H.C.; Guo, Y.H.; Yu, Z.M.; Ma, L.; et al. The effect of heat treatment time on the carbon-coated nickel nanoparticles modified boron-doped diamond composite electrode for non-enzymatic glucose sensing. J. Electroanal. Chem. 2019, 841, 148–157. [Google Scholar] [CrossRef]
  17. Yence, M.; Cetinkaya, A.; Ozcelikay, G.; Kaya, S.I.; Ozkan, S.A. Boron-Doped Diamond Electrodes: Recent Developments and Advances in View of Electrochemical Drug Sensors. Crit. Rev. Anal. Chem. 2022, 52, 1122–1138. [Google Scholar] [CrossRef] [PubMed]
  18. Luo, D.B.; Wu, L.Z.; Zhi, J.F. Fabrication of Boron-Doped Diamond Nanorod Forest Electrodes and Their Application in Nonenzymatic Amperometric Glucose Biosensing. ACS Nano. 2009, 3, 2121–2128. [Google Scholar] [CrossRef] [PubMed]
  19. Olejnik, A.; Ficek, M.; Szkodo, M.; Stanislawska, A.; Karczewski, J.; Ryl, J.; Dolega, A.; Siuzdak, K.; Bogdanowicz, R. Tailoring Diffusional Fields in Zwitterion/Dopamine Copolymer Electropolymerized at Carbon Nanowalls for Sensitive Recognition of Neurotransmitters. ACS Nano 2022, 16, 13183–13198. [Google Scholar] [CrossRef]
  20. Olejnik, A.; Ficek, M.; Siuzdak, K.; Bogdanowicz, R. Multi-pathway mechanism of polydopamine film formation at vertically aligned diamondised boron-doped carbon nanowalls. Electrochim. Acta 2022, 409, 12. [Google Scholar] [CrossRef]
  21. Boonkaew, S.; Dettlaff, A.; Sobaszek, M.; Bogdanowicz, R.; Jönsson-Niedziólka, M. Electrochemical determination of neurotransmitter serotonin using boron/nitrogen co-doped diamond-graphene nanowall-structured particles. J. Electroanal. Chem. 2022, 926, 12. [Google Scholar] [CrossRef]
  22. Niedzialkowski, P.; Cebula, Z.; Malinowska, N.; Bialobrzeska, W.; Sobaszek, M.; Ficek, M.; Bogdanowicz, R.; Anand, J.S.; Ossowski, T. Comparison of the paracetamol electrochemical determination using boron-doped diamond electrode and boron-doped carbon nanowalls. Biosens. Bioelectron. 2019, 126, 308–314. [Google Scholar] [CrossRef] [PubMed]
  23. Sain, S.; Ficek, M.; Olejnik, A.; Sawczak, M.; Bogdanowicz, R.; Roy, S.S. Direct determination of paraquat herbicide by square-wave voltammetry by two-step transfer mechanism at heterogeneous boron-doped carbon nanowall electrodes. Diam. Relat. Mat. 2023, 140, 12. [Google Scholar] [CrossRef]
  24. Hou, X.L.; Shen, G.J.; Meng, L.; Zhu, L.; Guo, M. Multi-walled carbon nanotubes modified glass carbon electrode and its electrocatalytic activity towards oxidation of paracetamol. Russ. J. Electrochem. 2011, 47, 1262–1267. [Google Scholar] [CrossRef]
  25. Ma, Y.B.; Liu, J.S.; Li, H.D. Diamond-based electrochemical aptasensor realizing a femtomolar detection limit of bisphenol A. Biosens. Bioelectron. 2017, 92, 21–25. [Google Scholar] [CrossRef] [PubMed]
  26. He, Y.P.; Dong, Y.J.; Huang, W.M.; Tang, X.Q.; Liu, H.H.; Lin, H.B.; Li, H.D. Investigation of boron-doped diamond on porous Ti for electrochemical oxidation of acetaminophen pharmaceutical drug. J. Electroanal. Chem. 2015, 759, 167–173. [Google Scholar] [CrossRef]
  27. Fujishima, A.; Rao, T.N. New directions in structuring and electrochemical applications of boron-doped diamond thin films. Diam. Relat. Mat. 2001, 10, 1799–1803. [Google Scholar] [CrossRef]
  28. Sousa, C.P.; Ribeiro, F.W.P.; Oliveira, T.; Salazar-Banda, G.R.; de Lima-Neto, P.; Morais, S.; Correia, A.N. Electroanalysis of Pharmaceuticals on Boron-Doped Diamond Electrodes: A Review. ChemElectroChem 2019, 6, 2350–2378. [Google Scholar] [CrossRef]
  29. Feng, Z.Y.; Gao, N.; Li, J.S.; Li, H.D. Boron-doped diamond electrochemical aptasensors for trace aflatoxin B 1 detection. Anal. Chim. Acta. 2020, 1122, 70–75. [Google Scholar] [CrossRef]
  30. Ma, Z.C.; Wang, Q.L.; Gao, N.; Li, H.D. Electrochemical detection of clenbuterol with gold-nanoparticles-modified porous boron-doped diamond electrode. Microchem. J. 2020, 157, 7. [Google Scholar] [CrossRef]
  31. Wang, P.; Yuan, X.X.; Cui, Z.; Xu, C.Y.; Sun, Z.L.; Li, J.H.; Liu, J.S.; Tian, Y.; Li, H.D. A Nanometer-Sized Graphite/Boron-Doped Diamond Electrochemical Sensor for Sensitive Detection of Acetaminophen. ACS Omega 2021, 6, 6326–6334. [Google Scholar] [CrossRef] [PubMed]
  32. Wan, L.; Liang, Y.; Yang, Y.; Zhang, Q.; Cui, Z.; Liu, J.; Cheng, S.; Gao, N.; Li, H.; Yuan, X. Electrochemical detection of phenacetin with graphite/boron-doped diamond electrode grown at high methane concentration. Diam. Relat. Mat. 2024, 144, 110965. [Google Scholar] [CrossRef]
  33. Feng, X.J.; Jiang, L. Design and creation of superwetting/antiwetting surfaces. Adv. Mater. 2006, 18, 3063–3078. [Google Scholar] [CrossRef]
  34. Zhu, Q.L.; Yang, Y.M.; Gao, H.X.; Xu, L.P.; Wang, S.T. Bioinspired superwettable electrodes towards electrochemical biosensing. Chem. Sci. 2022, 13, 5069–5084. [Google Scholar] [CrossRef] [PubMed]
  35. Wei, Q.Y.; Dong, Q.R.; Sun, D.W.; Pu, H.B. Synthesis of recyclable SERS platform based on MoS2@TiO2@Au heterojunction for photodegradation and identification of fungicides. Spectroc. Acta Pt. A Molec. Biomolec. Spectr. 2023, 285, 11. [Google Scholar] [CrossRef] [PubMed]
  36. Ma, Z.-C.; Gao, N.; Cheng, S.-H.; Liu, J.-S.; Yang, M.-C.; Wang, P.; Feng, Z.-Y.; Wang, Q.-L.; Li, H.-D. Wettability and Surface Energy of Hydrogen- and Oxygen-Terminated Diamond Films. Chin. Phys. Lett. 2020, 37, 046801. [Google Scholar] [CrossRef]
  37. Leem, J.W.; Yu, J.S. Broadband and wide-angle antireflection subwavelength structures of Si by inductively coupled plasma etching using dewetted nanopatterns of Au thin films as masks. Thin Solid Films 2011, 519, 3792–3797. [Google Scholar] [CrossRef]
  38. Brazhkin, V.V.; Ekimov, E.A.; Lyapin, A.G.; Popova, S.V.; Rakhmanina, A.V.; Stishov, S.M.; Lebedev, V.M.; Katayama, Y.; Kato, K. Lattice parameters and thermal expansion of superconducting boron-doped diamonds. Phys. Rev. B 2006, 74, 4. [Google Scholar] [CrossRef]
  39. Ashcheulov, P.; Sebera, J.; Kovalenko, A.; Petrák, V.; Fendrych, F.; Nesládek, M.; Taylor, A.; Zivcová, Z.V.; Frank, O.; Kavan, L.; et al. Conductivity of boron-doped polycrystalline diamond films: Influence of specific boron defects. Eur. Phys. J. B 2013, 86, 9. [Google Scholar] [CrossRef]
  40. Bernard, M.; Deneuville, A.; Muret, P. Non-destructive determination of the boron concentration of heavily doped metallic diamond thin films from Raman spectroscopy. Diam. Relat. Mat. 2004, 13, 282–286. [Google Scholar] [CrossRef]
  41. Wang, H.J.; Wang, Y.B.; Chai, X.; Guo, F.X.; Li, Y.L.; Shi, J.; Gai, Z.G.; Jiang, X. Influence of boron doped level on the electrochemical behavior and seawater salinity detection of boron doped diamond film electrodes. J. Electroanal. Chem. 2023, 931, 9. [Google Scholar] [CrossRef]
  42. May, P.W.; Ludlow, W.J.; Hannaway, M.; Heard, P.J.; Smith, J.A.; Rosser, K.N. Raman and conductivity studies of boron doped microcrystalline diamond, facetted nanocrystalline diamond and cauliflower diamond films. Chem. Phys. Lett. 2007, 446, 103–108. [Google Scholar] [CrossRef]
  43. Bernard, M.; Baron, C.; Deneuville, A. About the origin of the low wave number structures of the Raman spectra of heavily boron doped diamond films. Diam. Relat. Mat. 2004, 13, 896–899. [Google Scholar] [CrossRef]
  44. Yu, Z.M.; Wang, J.; Wei, Q.P.; Meng, L.C.; Hao, S.M.; Long, F. Preparation, characterization and electrochemical properties of boron-doped diamond films on Nb substrates. Trans. Nonferr. Met. Soc. China 2013, 23, 1334–1341. [Google Scholar] [CrossRef]
  45. Shirai, K.; Dekura, H.; Yanase, A. Utilization of high pressure for synthesizing superconducting semiconductors: Analysis of Ekimov’s method. Phys. Status Solidi B Basic Solid State Phys. 2009, 246, 673–678. [Google Scholar] [CrossRef]
  46. Gao, G.Y.; Fang, D.Y.; Yu, Y.; Wu, L.Z.; Wang, Y.; Zhi, J.F. A double-mediator based whole cell electrochemical biosensor for acute biotoxicity assessment of wastewater. Talanta. 2017, 167, 208–216. [Google Scholar] [CrossRef]
  47. Hayat, M.; Shah, A.; Nisar, J.; Shah, I.; Haleem, A.; Ashiq, M.N. A Novel Electrochemical Sensing Platform for the Sensitive Detection and Degradation Monitoring of Methylene Blue. Catalysts 2022, 12, 306. [Google Scholar] [CrossRef]
  48. Morsi, R.M.M.; Mandour, H.S.; Fathi, A.M.; Awad, H.M. Electrical properties, cyclic voltammetry, and anticancer activities of N-(4-(2-hydrazinyl-2-oxoethoxy)phenyl) acetamide complexes. J. Phys. Org. Chem. 2019, 32, 11. [Google Scholar] [CrossRef]
  49. Laviron, E. General expression of the linear potential sweep voltammogram in the case of diffusionless electrochemical systems. J. Electroanal. Chem. Interfacial Electrochem. 1979, 101, 19–28. [Google Scholar] [CrossRef]
  50. Belter, M.; Sajnóg, A.; Baralkiewicz, D. Over a century of detection and quantification capabilities in analytical chemistry—Historical overview and trends. Talanta 2014, 129, 606–616. [Google Scholar] [CrossRef]
  51. Prabhu, B.R.; Varier, M.M.; John, N.S. Fabrication of sandwich structures of Ag/analyte/MoO3 sea urchins for SERS detection of methylene blue dye molecules. Nanotechnology 2023, 34, 14. [Google Scholar]
  52. Patil, M.K.; Gaikwad, S.H.; Mukherjee, S.P. Phase- and Morphology-Controlled Synthesis of Tunable Plasmonic MoO3–x Nanomaterials for Ultrasensitive Surface-Enhanced Raman Spectroscopy Detection. J. Phys. Chem. C. 2020, 124, 21082–21093. [Google Scholar] [CrossRef]
  53. Li, C.; Wu, C.Q.; Zhang, K.; Chen, M.Q.; Wang, Y.S.; Shi, J.J.; Tang, Z.Y. The charge transfer effect on SERS in a gold-decorated surface defect anatase nanosheet/methylene blue (MB) system. New J. Chem. 2021, 45, 19775–19786. [Google Scholar] [CrossRef]
  54. Shaikh, I.; Sartale, S. Spin coated Ag NPs SERS substrate: Trace detection study of methylene blue and melamine. Appl. Phys. A—Mater. Sci. Process. 2023, 129, 12. [Google Scholar] [CrossRef]
  55. Atta, S.; Vo-Dinh, T. Bimetallic Gold Nanostars Having High Aspect Ratio Spikes for Sensitive Surface-Enhanced Raman Scattering Sensing. ACS Appl. Nano Mater. 2022, 9, 12562–12570. [Google Scholar] [CrossRef]
  56. Bélaz-David, N.; Decosterd, L.A.; Appenzeller, M.; Ruetsch, Y.A.; Chioléro, R.; Buclin, T.; Biollaz, J. Spectrophotometric determination of methylene blue in biological fluids after ion-pair extraction and evidence of its adsorption on plastic polymers. Eur. J. Pharm. Sci. 1997, 5, 335–345. [Google Scholar] [CrossRef]
  57. Li, J.; Zhao, F.; Zhao, J.; Zeng, B. Adsorptive and stripping behavior of methylene blue at gold electrodes in the presence of cationic gemini surfactants. Electrochim. Acta 2005, 51, 297–303. [Google Scholar] [CrossRef]
  58. Soto, P.C.; Salamanca-Neto, C.A.R.; Moraes, J.T.; Sartori, E.R.; Bessegato, G.G.; Lopes, F.; Almeida, L.C. A novel sensing platform based on self-doped TiO2 nanotubes for methylene blue dye electrochemical monitoring during its electro-Fenton degradation. J. Solid State Electrochem. 2020, 24, 1951–1959. [Google Scholar] [CrossRef]
  59. Tonlé, I.K.; Ngameni, E.; Tcheumi, H.L.; Tchiéda, V.; Carteret, C.; Walcarius, A. Sorption of methylene blue on an organoclay bearing thiol groups and application to electrochemical sensing of the dye. Talanta 2008, 74, 489–497. [Google Scholar] [CrossRef]
  60. Hassan, S.S.; Nafady, A.; Sirajuddin; Solangi, A.R.; Kalhoro, M.S.; Abro, M.I.; Sherazi, S.T.H. Ultra-trace level electrochemical sensor for methylene blue dye based on nafion stabilized ibuprofen derived gold nanoparticles. Sens. Actuator B-Chem. 2015, 208, 320–326. [Google Scholar] [CrossRef]
Figure 1. SEM images of (a) as-grown BDD film, (b) BDD-NWA-20, (c) BDD-NWA-38, and (d) BDD-NWA-50. The insets are the locally magnified images, while the sample stage is flipped 45° to observe the three-dimensional structure. (e) XRD patterns of BDD and BDD-NWA. The intensities are normalized relative to the diamond (111) diffraction peak. (f) Raman spectra of BDD and BDD-NWA electrodes; contact angle images of 5 µM MB in pH 7 PBS drops on (g) BDD film and (h) BDD-NWA film.
Coatings 14 00762 g001
Figure 2. (a) EIS spectra of BDD and BDD-NWA electrodes measured in 5 mM potassium ferrocyanide (K3[Fe(CN)6]) solution with 0.1 M potassium chloride (KCl); (b) CV curves of BDD and BDD-NWA electrodes tested in PBS with a scan rate of 50 mV s−1; (c) CV curves of BDD-NWA electrode tested in 0.1 M H2SO4, PBS (pH = 7), and 0.1 M KOH with a scan rate of 100 mV s−1.
Coatings 14 00762 g002
Figure 3. (a) SWV curves of MB on BDD-NWA electrode with pH values of 4–10 in PBS with 10 μM MB; (b) plots of the relationship between the peak current and pH value; (c) the linear dependence of peak potential and pH value.
Coatings 14 00762 g003
Figure 4. (a) CV curves of MB (0.5 mM) on BDD-NWA electrode at different scan rates (40–180 mV s−1) in PBS; dependence of peak current on (b) scan rate (ν) and (c) ν1/2; (d) dependence of Epa and Epc on log ν.
Coatings 14 00762 g004
Figure 5. Oxidation mechanism of MB on the BDD-NWA electrode.
Coatings 14 00762 g005
Figure 6. (a) SWV curves for different concentrations of MB in PBS, obtained with the BDD electrode, and the inset is a magnified image within the blue square frame area; (b) linear dependence of the peak current and concentration in the concentration range of 0.25–10 μM, obtained with the BDD electrode; (c) SWV curves for different concentrations of MB in PBS, obtained with the BDD-NWA-38 electrode, and the inset is a magnified image within the blue square frame area; (d) linear dependence of the peak current and concentration in the concentration range of 0.04–10 μM, obtained with the BDD-NWA-38 electrode; (e) linear dependence of the peak current and concentration in the concentration range of 0.06–10 μM, obtained with the BDD-NWA-20 electrode; (f) linear dependence of the peak current and concentration in the concentration range of 0.08–10 μM, obtained with the BDD-NWA-50 electrode.
Coatings 14 00762 g006
Figure 7. (a) Detection/cleaning cycles of MB detection, obtained with the BDD-NWA electrode, with a concentration of 5 µM in PBS; (b) changes in peak current of detection after cleaning; (c) SWV curves of MB in PBS, obtained with the BDD-NWA electrode after acid boiling; (d) changes in peak current of detection after acid boiling.
Coatings 14 00762 g007
Figure 8. (a) SWV curves for different concentrations of MB in tap water, obtained by the BDD electrode, and the inset is the linear dependence of the peak current and concentration. (b) Amperometric detection of MB in a concentration range of 2–40 µM.
Coatings 14 00762 g008
Table 1. Various methods for detecting MB. Ibu-AuNPs: ibuprofen-coated gold nanoparticles; DPV: differential pulse voltammetry; NH2-fMWCNTs: amino-group-functionalized multi-walled carbon nanotubes.
Electrode ModifiersTechniqueLinear Range (μM) Detection Limit (nM)References
-SERS-100[51]
-SERS-10[52]
-SERS-10[53]
-SERS-0.1[54]
-SERS0.00005–0.030.042[55]
-UV-vis0.38–28.5-[56]
-UV-vis0.63–21.9190[13]
AuCV0.2–10-[57]
Self-doped TiO2 nanotubesCV1.0–7.94475[58]
Thiol-functionalized clayCV1.0–14400[59]
Ibu-AuNPsDPV0.01–1.13.9[60]
NH2-fMWCNTsSWV0.01–0.50.21[47]
BDD-NWASWV0.04–100.72This study
Table 2. Detection of MB in tap water samples after standard addition. ND: not detected.
Added (μM)Found (μM)Recovery (%) RSD (%)
0ND--
22.15107.52.1
44.03100.81.5
65.6393.80.6
87.8698.33.1
1010.28102.82.4
Disclaimer/Publisher’s Note: The statements, opinions and data contained in all publications are solely those of the individual author(s) and contributor(s) and not of MDPI and/or the editor(s). MDPI and/or the editor(s) disclaim responsibility for any injury to people or property resulting from any ideas, methods, instructions or products referred to in the content.

