Abstract
In order to explore the influence of high-order micro-texture parameters on the friction, wear, and vibration characteristics of coated cemented carbide pin surfaces, expand the research field of textured coating modification processes. Firstly, a laser was used to prepare micro-texture on the surface of the cemented carbide pin, and AlCrN coating was carried out. The friction and wear test platform of the micro-textured physical vapor deposition (PVD)-coated cemented carbide and titanium alloy substrate was built, and the friction vibration and acoustic vibration signals were obtained as the main analysis media. Secondly, according to the characteristics of the test signal, three time-frequency images are analyzed and compared. The continuous wavelet transform (CWT) method with a better time-frequency analysis effect is selected. Finally, the characteristics and regularity of friction vibration and acoustic vibration are analyzed by using the gray mean of the CWT time-frequency image. The influence mechanism of high-order micro-texture parameters on the surface characteristics of coated cemented carbide pins was obtained. It is concluded that the high-order micro-texture is 1.58% higher than the traditional scale in the stability of friction vibration, 4.47% higher in the stability of acoustic vibration, and 13.16% lower in the friction force, which proves the progress of the size improvement. It provides a practical basis for the extension research of cemented carbide surface modification.
1. Introduction
Cemented carbide is an important tool material. When it is used as a cutting tool to cut difficult-to-machine materials such as titanium alloy, serious adhesive wear occurs on the rake face, which greatly reduces the stability of friction contact and is not conducive to cutting. At present, textured coating technology is a common surface modification method. Most of the micro-texture diameters in the existing research are set in the range of 20–100 μm, and there is a lack of research on the surface modification effect of micro-textures with high-order diameters of 150–300 μm. Therefore, it is of great significance to explore the strengthening effect of high-order micro-texture coating technology for the extension and development of cemented carbide surface modification. Friction vibration and acoustic vibration are important indicators of friction and wear state changes, which efficiently reflect the state changes of cemented carbide surfaces. In this regard, by analyzing the characteristic changes of vibration behavior in the time-frequency domain, the influence of different parameters of high-order micro-texture on the surface modification effect of coated cemented carbide can be indirectly obtained.
At present, in the field of surface performance improvement of alloy materials, scholars have conducted extensive research and analysis on small-size micro-texture and coating technology. Li Yuanyuan et al. [1] explored the influence of micro-texture on tool cutting performance. The use of a micro-texture diameter of 60 μm reduces the friction on the tool-work contact surface and reduces the cutting temperature. Liu Tianxia et al. [2] explored the influence of different micro-texture structure parameters on tribological properties. Through the friction and wear tests of micro-textured steel ball-steel discs, it was concluded that the triangular texture with a size of 50 μm and a spacing of 150 μm had the best anti-friction and anti-wear effects. Georg Schnell et al. [3] studied the effect of micro-texture on the tribological properties of sliding bearings. A small-scale ‘V’-shaped texture was prepared on the half-bearing shell. The symmetrical texture design can significantly reduce the friction of hydrodynamic lubrication. It can be concluded that micro-texture can effectively improve the friction contact state and reduce the negative impact of contact friction between surfaces. Wu X et al. [4] improved the small-size micro-texture machined on the surface of coated tools by adjusting the laser parameters. The existence of micro-texture reduces the wear value of the rake face of the coated tool and improves its service life. Chen Shutong et al. [5] studied the effect of surface coating-texture composite modification on the friction and wear properties of GCr15 material parts. The tribological tests of micro-textured-coated ball samples and disc samples were carried out. The composite modification of coating and micro-texture can effectively reduce wear. Zhang et al. [6] used different texture densities with a diameter of 100 μm to perform laser texture and carburization pretreatment on the surface of the titanium alloy substrate to enhance the adhesion of the diamond carbon film. The texture treatment improves the specific surface area of the substrate, the adhesion of the coating, and the tribological properties. Liu Mingqian et al. [7] studied the effect of micro-grooves on the surface of the brake disc on the interface friction behavior and acoustic vibration characteristics. Through a detailed analysis of friction and acoustic vibration, it is concluded that the groove with a 45-degree distribution has the best noise reduction effect. It can be seen that the synergistic effect of micro-texture and coating can effectively protect the working surface, reduce contact wear, and improve the working life of the substrate. Xu Zhibiao et al. [8] use electrochemical-assisted laser processing technology to process typical micro-texture grooves on the surface of aluminum alloy to improve the wear resistance of the aluminum alloy surface and the tribological properties of the micro-texture in the preparation process. Rajurkar A. and Wang Hongjian et al. [9,10] studied the effect of micro-textures with different morphologies on the surface modification effect of materials. The hexagonal micro-texture with symmetrical structure is more conducive to the improvement of friction performance than the triangular micro-texture, and the concave and groove micro-texture with an angle of 90° on the substrate is beneficial to improving the friction performance in cutting. Different from the above studies, this paper aims to explore the changes in friction and wear properties and vibration behavior of fixed micro-textures after size increases. And it can be seen that most scholars still use small sizes in the study of microtexture. Lack of analysis of high-order size micro-texture modification ability. The study of micro-texture synergistic coating modification with different high-order parameters by analyzing vibration behavior is rarer.
Therefore, this paper takes the friction vibration and acoustic vibration signals on the surface of high-order micro-textured coated cemented carbide as the main analysis basis. The lase modification technique was used to prepare micro-texture on the surface of the cemented carbide pin, and AlCrN coating was carried out. The friction and wear test platform of micro-textured coated cemented carbide and titanium alloy was built to obtain the vibration signal of the whole test. The CWT time-frequency transform is performed on the acquired signal, and the characteristics and regularity of the signal are presented in the time-frequency domain. The vibration trend of the workpiece during the friction and wear process is obtained. The influence mechanism of micro-textures with different sizes and densities on the wear resistance and vibration suppression of AlCrN-cemented carbide surfaces in high-order fields was analyzed by gray-scale analysis results. The performance comparison with the surface treatment of conventional-size micro-texture provides a new idea for the expansion of research on the surface modification of cemented carbide.
2. Friction and Wear Test
2.1. Workpiece Material Selection
The friction and wear test object is a YG8 cemented carbide pin with micro-texture and an AlCrN coating. Firstly, the surface of the original cemented carbide pin is grinded and polished, and the micro-texture is processed on the surface by laser, and then the residual impurities on the surface are cleaned by ultrasonic waves. The surface coating is then applied. The laser processing power is 100 W, and the scanning speed is 750 mm/s. According to the different diameters required, the size of the laser spot is adjusted, and different sizes of micro-textures are gradually processed. Then an AlCrN coating was prepared on the micro-textured surface by PVD arc-ion plating technology. The AlCrN coating has excellent performance and a good synergistic effect with microtexture. The order of preparing the coating after preparing the micro-texture on the surface can preserve the integrity of the coating to the greatest extent [11,12]. The Ti6Al4 V titanium alloy disc was used to study the friction state of the surface when the cemented carbide and the titanium alloy were in contact. Figure 1 is the physical diagram and size of the test workpiece. The chemical composition of the workpieces used is shown in Table 1. The physical properties are shown in Table 2, and the surface material preparation process is shown in Figure 2b.
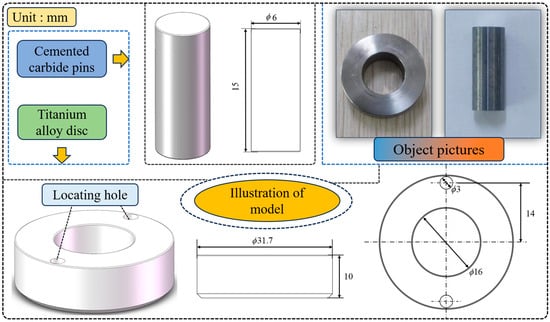
Figure 1.
Friction and wear test workpiece.

Table 1.
Chemical composition of workpieces used (%).

Table 2.
Physical parameters of test materials.
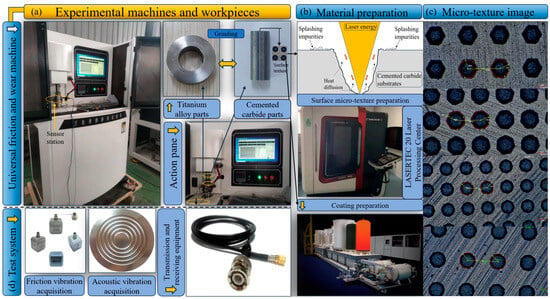
Figure 2.
Test platform construction and material preparation: (a) Test platform; (b) The principle of surface material preparation; (c) Laser micro-texture image preparation; (d) Signal acquisition system.
2.2. Test Design
The surface micro-texture of cemented carbide is the main parameter design object. The coating thickness is 2–3 μm. The AlCrN coating with this thickness has better lubrication performance, hardness, and film-substrate bonding effects [12]. The micro-texture diameter is designed to be 100 μm, 150 μm, 200 μm, 250 μm, and 300 μm, which is divided into five diameter grades, and three distribution densities of 30%, 20%, and 10% were divided under each grade diameter. A total of 15 sets of tests.
2.3. Test Platform Building
The overall construction of the friction and wear test platform is shown in Figure 2. The main test platform is a universal friction and wear testing machine. The load is 40 N, the sliding speed is 100 m/min, and the friction time is 30 min. A three-axis acceleration vibration sensor (Chengke CT1010SLFP-Shanghai, China) and an acoustic vibration sensor (Aihua AWA14423-Hangzhou, China) are installed on both sides of the friction and wear platform base to collect friction vibration and acoustic vibration signals. Each 10 min was a collection interval, and a group of tests were collected a total of three times in 30 min. In the analysis, three large segments of signal data are equally divided into six segments.
3. Analysis Method
3.1. Comparison of Signal Analysis Methods
According to the total amount of data, time length, and amplitude change of the test signal, different methods are used to analyze the time-frequency domain conversion of the signal, and the results are different. Therefore, STFT, HHT, and CWT with strong versatility are used as the basis of time-frequency analysis for comparison and as a research reference for signal data processing. The STFT, CWT, and HHT examples are analyzed by using the x-direction friction vibration and acoustic vibration signals within 5 min of a set of signals in the data set.
3.1.1. STFT Time-Frequency Domain Signal Analysis
The image of the friction vibration signal in the time-frequency domain under STFT is shown in Figure 3. The high energy band of friction vibration is mainly distributed at a frequency of 5–7 Hz, and a small amount is distributed at 0–1 Hz. In the two-dimensional image, a weak boundary appears after 120 s. Combining three-dimensional graphs, the friction vibration energy rises briefly and then enters the low energy stage. However, when STFT is used for analysis, the continuity of time-frequency characteristics along the frequency direction is poor. STFT is prone to problems when balancing the resolution of time and frequency, resulting in poor resolution of time-frequency features [13].
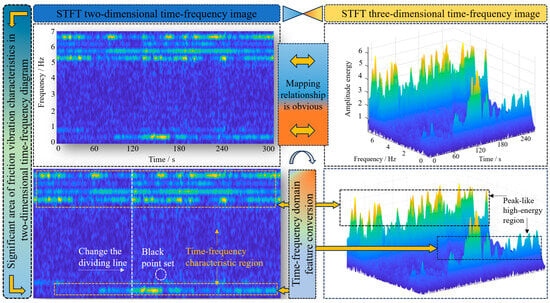
Figure 3.
STFT time-frequency domain image.
3.1.2. CWT Time-Frequency Domain Signal Analysis
It can be clearly observed in Figure 4 that the CWT image and the STFT image have very similar energy amplitude characteristics. However, the CWT image has significant continuity along the frequency direction compared with the STFT, and the changes are more smooth. CWT overcomes the trade-off between time and frequency resolution in STFT. CWT can analyze the frequency characteristics of signals at different time scales and better capture the changes of frequency components in signals with time [14,15,16].
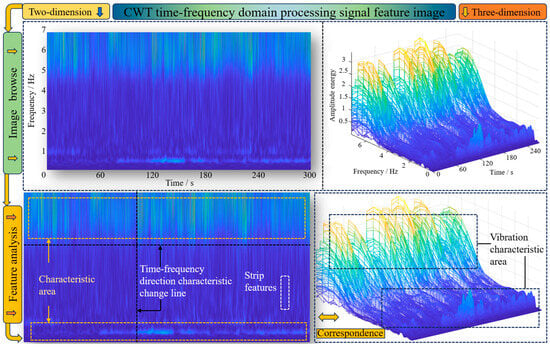
Figure 4.
CWT time-frequency domain image.
3.1.3. HHT Time-Frequency Domain Signal Analysis
Figure 5 is the time-frequency image of HHT, and the three-dimensional image features are obvious. HHT is very sensitive to the local characteristics of the signal, so there are some energy features at the dividing line in the image compared with STFT and CWT [17]. However, compared with STFT and CWT, the feature prominence of the HHT two-dimensional image is significantly reduced. In the two-dimensional image, it is difficult to distinguish the weak boundary of the energy amplitude characteristic change of the friction vibration signal. If the frequency characteristics of the signal vary greatly over the entire time range and are mixed with difficult-to-identify impurity signals, the EMD used in HHT may not be able to effectively decompose the signal. The intrinsic mode function obtained by EMD has serious modal confusion. As a result, the signal feature recognition ability is reduced [18].
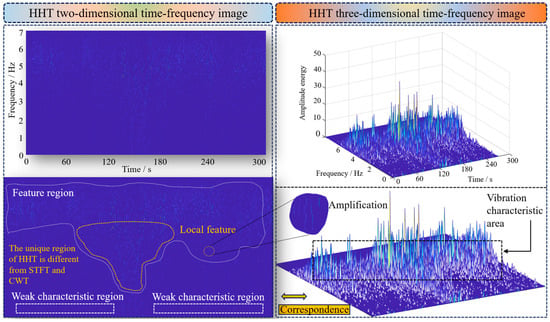
Figure 5.
HHT time-frequency domain image.
3.1.4. Selection of Time-Frequency Analysis Method for Test Signal
According to the comparison results of time-frequency processing methods, CWT is more suitable as a time-frequency method for data analysis of the test signal. Based on the anti-interference ability of time-frequency processing images, the three methods are compared again. As shown in Figure 6, when there are large impurity features in the time-frequency image, both STFT and HHT highlight the impurity features and cover up the original features. The CWT image is less affected by impurities or not affected by impurities and has good anti-interference ability. Compared with the other two methods, CWT has good global analysis and more comprehensive time-frequency characteristics. In summary, CWT is more suitable for analyzing the signals collected under the wear test.
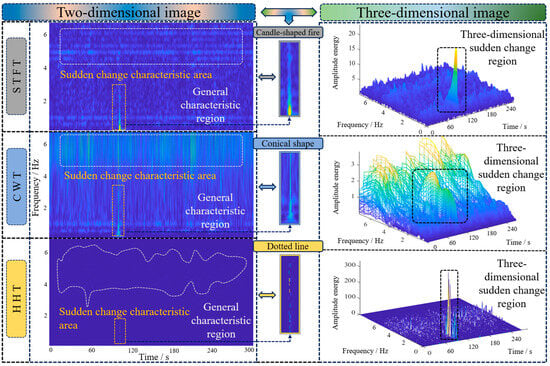
Figure 6.
Comparison of time-frequency methods of friction, vibration, and sudden change characteristics.
3.2. Research on Signal CWT-Grayscale Analysis Method
3.2.1. Time-Frequency Image Feature Analysis
The signal in a unified time period is selected, and the time-frequency transform is performed using CWT to obtain the feature image, as shown in Figure 7a. The comparison found that:
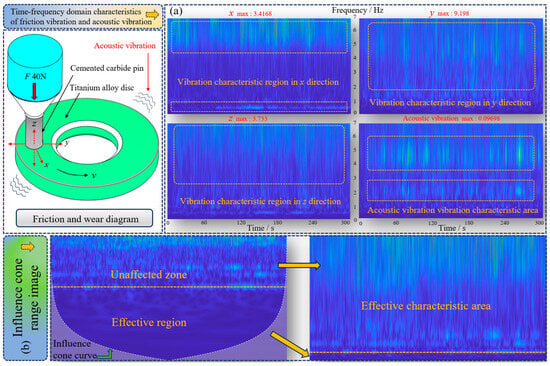
Figure 7.
Time-frequency characteristic region of friction and wear test signal: (a) Friction vibration and acoustic vibration time-frequency feature images; (b) Influence cone range image.
- (a)
- The characteristic regions of the friction vibration signal in the x direction are mainly distributed in the high frequency band, and there are weak characteristics in the low frequency band;
- (b)
- The characteristics of the friction vibration signal in the y direction are almost covered with the whole image; The friction vibration characteristics in the z direction are mainly distributed in the high frequency band, but the distribution is more divergent and fuzzy;
- (c)
- The characteristics of the acoustic vibration signal are distributed in the middle and high frequency regions in two sections, showing a divergent trend;
- (d)
- The acoustic vibration is relatively weak compared with the friction vibration, but the characteristics are distinct.
The influence cone curve is shown in Figure 7b. The feature regions of the time-frequency image are all located in the influence cone curve, which is less affected by the edge effect, and the features are accurate.
3.2.2. Selection of Friction Vibration Analysis
Friction vibration signals are acquired in three directions. Through the analysis of Figure 7a, on the basis of efficient use of data, reducing analysis cost, and ensuring the significance of friction vibration analysis, it is most appropriate to select a y-direction friction vibration signal for analysis. Considering that the test needs to study the influence between acoustic vibration and frictional vibration, The effective value is selected in the time domain of the original signal to analyze the correlation between friction vibration and acoustic vibration [19]. The calculation of the effective value of the signal in the time domain is shown in Figure 8. The correlation between the time domain effective value of the friction vibration signal in the y direction and the acoustic vibration is as high as 0.77, which is much higher than that in the x and z directions. Under comprehensive consideration, the y-direction friction vibration signal is selected as the main analysis direction.
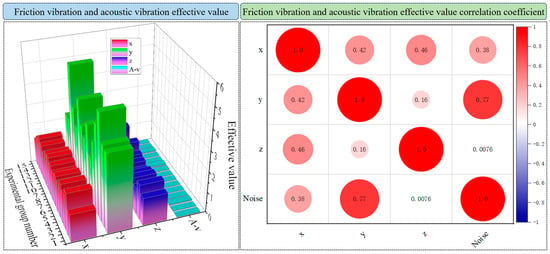
Figure 8.
Analysis of effective value correlation in the signal time domain.
3.3. Time-Frequency Image Analysis Based on Gray Algorithm
3.3.1. Analysis of Light and Dark Characteristics of Time-Frequency Images
When the friction vibration or acoustic vibration signal changes, the image will appear as shown in Figure 9a. The time-energy change direction of the three-dimensional image shown in Figure 9b is analyzed. It is found that the characteristics of the low-energy region generally appear in a clustered manner, and the region displayed in the two-dimensional image is brighter. High-energy regions often appear as separated single peaks, and the areas shown in the two-dimensional image are darker. Therefore, when the signal is stable, the image shows a bright trend. When the signal changes suddenly and the high-energy reaction occurs in the time-frequency domain, the image shows a dark trend. Figure 9b The low-energy image corresponds to the bright area of Figure 9a, and the high-energy image corresponds to the gray area.
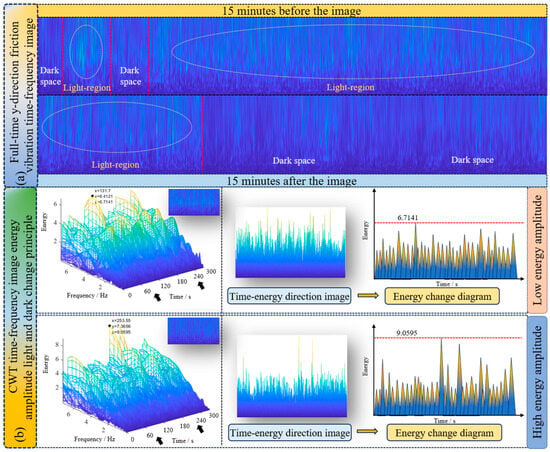
Figure 9.
Time-frequency domain image change mechanism: (a) Y-direction vibration time-frequency image; (b) Principle of time-frequency image feature change.
3.3.2. Numerical Analysis of Gray Feature of Time-Frequency Image
After research, this change feature is very consistent with the principle of using gray mean in the field of image processing.The color and brightness features of the image are converted into gray value variables and stored in the gray image, and the values in the gray domain are extracted to achieve specific mathematical analysis [20,21,22]. As shown in Figure 10, the image feature gray conversion effect in the time-frequency domain is good. According to the gray statistical histogram, the number of pixels in the high gray level of the low energy amplitude image is significantly higher than that of the high energy amplitude image. After calculation, the average gray values of the two are 95.34 and 91.66, respectively. The brighter the image is, the higher the gray mean value is, and the eigenvalue extraction method is feasible.
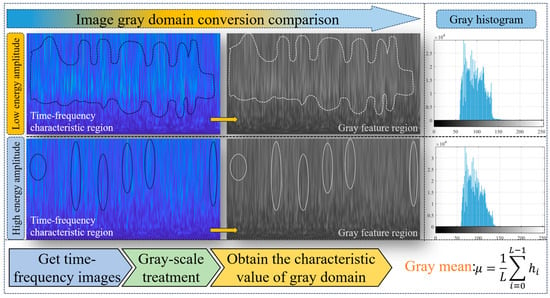
Figure 10.
Grayscale analysis of a time-frequency image.
4. Test Result Analysis
Figure 11 is the data image after the average value of the gray mean value of the friction vibration and acoustic vibration of the six time periods of each group of tests. A group of test signals is characterized by only one average gray mean, for a total of 15 groups. Prepare data for the analysis of the influence of parameter changes in high-order micro-texture on friction performance, friction vibration, and acoustic vibration.
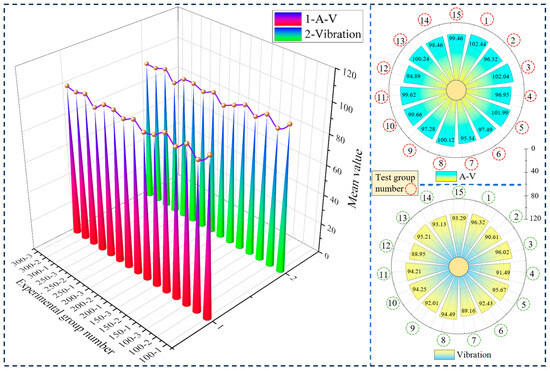
Figure 11.
Average gray mean data of the test signal.
4.1. Analysis of Friction Vibration and Acoustic Vibration Data Change Mechanism
Figure 12 shows the change in the gray mean value of friction vibration and acoustic vibration when the micro-texture diameter is different and the distribution density is 30%, 20%, and 10%. Figure 12: Column 1 and Column 3 are the time-varying images of the gray mean. The second and fourth columns are the group average gray mean change images of the test.
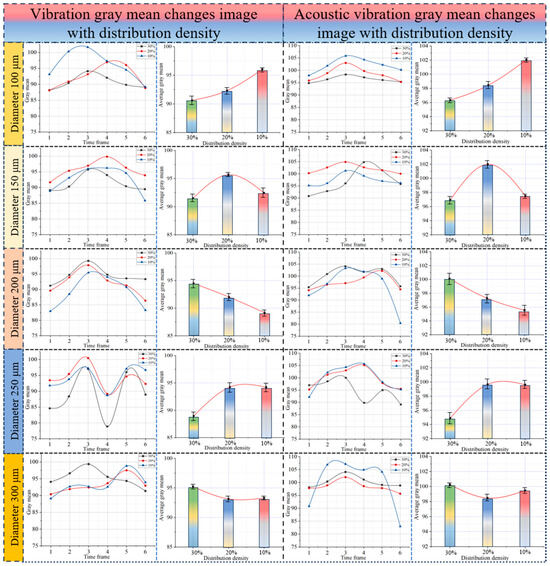
Figure 12.
Gray mean change curve under different micro-texture structure parameters.
According to the change characteristics of the gray mean value obtained by time-frequency domain analysis of vibration behavior, the friction and wear mechanisms of the material surface are analyzed as follows:
- (1)
- Gray mean time change image analysis:
The acquisition position of friction vibration and acoustic vibration signals is different, and the change in wear state makes the friction vibration and acoustic vibration have different changes. Therefore, there are differences in the curves of the gray mean of the two with time. The time curve of the gray mean is mostly the change of a single extreme value. The change in distribution density makes the curve have different degrees of extreme value shift. When the micro-texture diameter is 250 μm, the curve has a significantly distorted bipolar change, which is closely related to the change of friction state and wear mode.
The friction and wear mechanisms of the extreme shift curve: The existence of the micro-textured coating will cause the contact surface to run into a phenomenon in the initial stage of the friction and wear test. And there is a certain probability of forming a plowing effect to destroy the matrix and the workpiece, as shown in Figure 13a. The change in diameter and distribution density of the micro-texture affects the distribution of surface impurities and edge protrusions and changes the initial contact state. It affects the length of the running-in period and leads to the extreme value deviation of the curve.
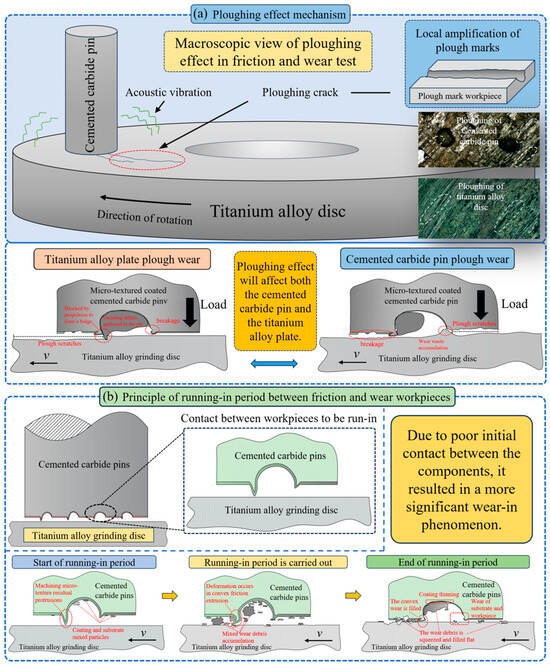
Figure 13.
Friction and wear running-in period and plowing effect mechanism: (a) Ploughing effect principle; (b) The working principle of the running-in period between workpieces.
The friction and wear mechanisms of the double extreme value of the curve are: The decrease after the first peak is related to the occurrence of the second running-in period in the grinding process. The surface material of the workpiece is damaged again, which makes the friction state deteriorate briefly. The secondary accumulation of wear debris and waste affects the surface of the grinding contact, forming a second short running-in period, as shown in Figure 13b. With the progress of friction and wear, the damaged material is gradually squeezed and flattened between the surfaces, forming a new friction pair and friction state; the vibration is alleviated; and the peak value appears again.
- (2)
- Mechanism analysis of the group average gray mean change image in the friction and wear test:
Diameter 100 μm: At this time, the synergistic effect of micro-texture and coating is similar to that of traditional-scale micro-texture. The laser energy absorbed by the material surface during the preparation of micro-texture is relatively deep, but there is no obvious difference from the traditional size. The arrangement rules for the micro-texture distribution density are shown in Figure 14a. When the distribution density is 30%, the number of micro-textures with a diameter of 100 μm is the largest compared with other sizes. The surface of the substrate is subjected to the most laser shock, the matrix has a wide damage area and many residual impurities, and the synergistic effect with the coating is not ideal. The effect of laser preparation on micro-texture and coating is shown in Figure 14b.When the micro-texture distribution density decreases, the number decreases, the impact damage area gradually decreases, and the synergistic coating effect becomes better. The overall wear state has improved.
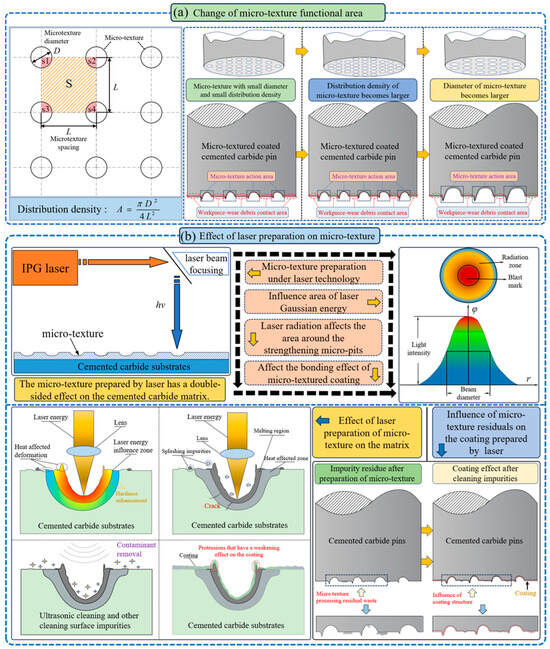
Figure 14.
The influence mechanisms of micro-texture scale, density, and laser preparation process: (a) Micro-texture functional area change principle; (b) The influence mechanism of laser preparation of micro-texture.
Diameter 150 μm: The size of the 150 μm micro-texture is obviously affected by the distribution density. Compared with the diameter of 100 μm, the laser energy borne by the matrix increases during the preparation of 150 μm monomer micro-texture, and the impact and strengthening effect on the matrix are enhanced, as shown in Figure 14b. As the diameter increases, the ability of a single micro-texture to prey on debris also increases. However, too much laser energy, such as a 30% distribution number, will lead to excessive impact on the matrix, resulting in changes in internal stress and easy damage in friction and wear. Coatings are needed to compensate for defects. Therefore, when the micro-texture diameter is 150 μm, the effect is the best at a distribution density of 20%, and it has a strong synergistic effect with the coating. Similarly, when the distribution density is low, the range of laser strengthening becomes smaller, the micro-texture functional area is also reduced, and the ability to capture wear waste is relatively weakened. It leads to an increase in the contact ratio between the workpiece and the wear debris. In Figure 14a, the area of Figure S becomes larger. The friction state has undergone a slight negative change.
Diameter 200 μm: At this time, the micro-texture size is more than doubled compared with the traditional size. When the micro-texture size is 200 μm, the laser coverage of a single micro-texture increases, the diffusion area of the radiation ring increases, the supersaturated laser energy intake has begun to appear, and the texture edge begins to appear brittle. Similarly, the Marangoni effect strengthening area is also expanding, and it is easy to cover the entire matrix surface in the case of a large number of textures, as shown in the upper half of Figure 15a. Therefore, the curve in Figure 12 shows that the micro-texture with a size of 200 μm has the best effect when the distribution density is 30%. When the distribution density decreases, the coverage ratio and functional area of the micro-texture decrease, and the edge of the micro-texture becomes brittle, resulting in a decrease in wear resistance. Therefore, the 200 μm micro-texture has a higher dependence on the lubrication effect of the coating than the small-scale micro-texture.
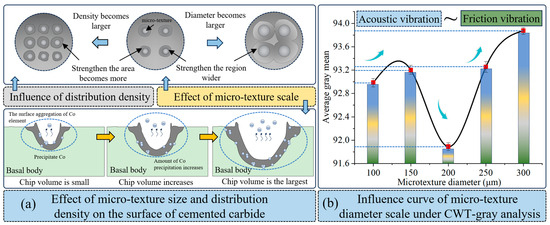
Figure 15.
The influence mechanism of micro-texture structure parameters: (a) The influence mechanism of micro-texture on the surface of cemented carbide; (b) The variation curve of vibration behavior with micro-texture diameter.
Diameter 250 μm: The curve shows that the wear vibration of the micro-textured coating with a size of 250 μm is more intense in the local period. The grinding process under this size is prone to secondary severe wear, which is related to the over-strengthening of the micro-pit edge caused by laser shock. Excessive laser energy exceeds the heat absorption limit of the material, which makes the edge seriously damaged, hard, and brittle and shortens the service life. The micro-textured coating is easy to break in the middle and late stages of friction and wear, forming new polymer waste, and the plowing phenomenon occurs again. Therefore, when the number of micro-textures with a size of 250 μm decreases, the surface integrity of the substrate will improve. The over-strengthening phenomenon is weakened, the dependence on the coating is reduced, and the synergistic effect becomes better. The micro-texture diameter of 250 μm has better chip swallowing ability, which is in balance with the positive and negative effects caused by laser shock. The overall modification effect of 20% and 10% micro-texture distribution density is basically the same.
Diameter 300 μm: At this time, the diameter of the micro-texture reaches the maximum value of the experimental design. The curves show that the micro-textures with different distribution densities have little effect on the wear vibration state of the substrate surface. The preparation of 300 μm micro-texture will lead to over-strengthening of the micro-pit edge. The difference is that the micro-texture of this scale accommodates a larger volume of chips and makes it easier to store broken-edge waste. During the preparation of the micro-texture, the laser energy radiates and penetrates into the deep region of the matrix, which increases the surface aggregation of the Co element in the matrix. The effect of surface distribution on the Co element is shown in Figure 15a. It inhibits the generation of surface cracks, weakens the embrittlement phenomenon, and makes the friction contact surface harder [23]. However, the 300 μm scale micro-texture area is larger, and the edge running-in period of the synergistic effect with the coating is longer.
As shown in Figure 15b, the influence curve of the micro-texture diameter scale is shown. When the diameter of high-order micro-texture is maintained at small and large diameters, the suppression effect on vibration behavior is better, while the wear resistance is poor and the vibration behavior is fierce in the middle size. That is, when the micro-texture diameter is 200 μm, the average gray value of the whole is the lowest. It can be seen from the curve analysis of Figure 12 that the distribution density has a great influence on it, and a higher distribution density should be selected when using a 200-μm-diameter micro-texture.
In summary, friction vibration and acoustic vibration have a close follow-up to the mechanism change of friction and wear processes. The micro-textures with different scale diameters and distribution densities have a significant effect on the surface vibration behavior of coated cemented carbide.
4.2. Comparison of Advantages and Disadvantages between High-Order Micro-Texture and Traditional Size
4.2.1. CWT-Grayscale Analysis Verification
Figure 16 shows the change in the friction coefficient of the test group. According to the extraction principle of the mean gray value of the time-frequency image of the signal data, the change trend of the average gray mean value of the test group is negatively correlated with the material wear, friction, and friction coefficient obtained by the test. It can be seen that the regular change of the group average gray mean curve is basically consistent with the friction coefficient, and the weak change of the friction coefficient will be amplified. Compared with the friction coefficient, the group average gray mean value is more sensitive to the change in the friction state.
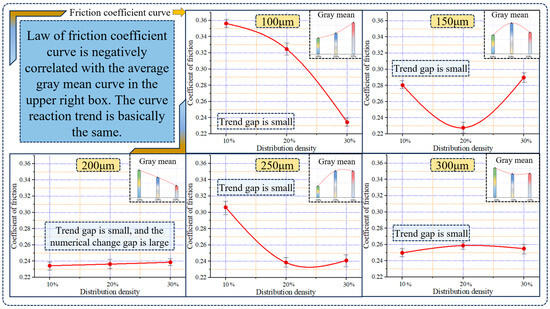
Figure 16.
Comparison of friction coefficient and gray mean.
4.2.2. Comparison of Advantages and Disadvantages of Micro-Texture Magnitude
The friction and wear tests of cemented carbide and titanium alloy with the same micro-texture and AlCrN coating were carried out using the traditional micro-texture diameters of 40 μm, 50 μm, and 60 μm. The friction coefficient, friction vibration, and acoustic vibration signals were collected and compared. The data are shown in Table 3. The standard deviation data show that the calculation of the average value is reasonable. The mean gray values of friction vibration and acoustic vibration signals under high-order micro-texture conditions are higher than those under traditional-order conditions. The frictional vibration stability is 1.58% higher, and the acoustic vibration stability is 4.47% higher.

Table 3.
Comparison of the average gray mean data of the whole group of signals.
The average friction coefficient of traditional micro-texture is 0.31; the average friction coefficient of high-order micro-texture is 0.26. The friction stability is 13.16% higher. As shown in Figure 17, under the same experimental conditions, the wear resistance of the micro-texture is greatly improved compared with the traditional size, and the friction and wear properties are improved.
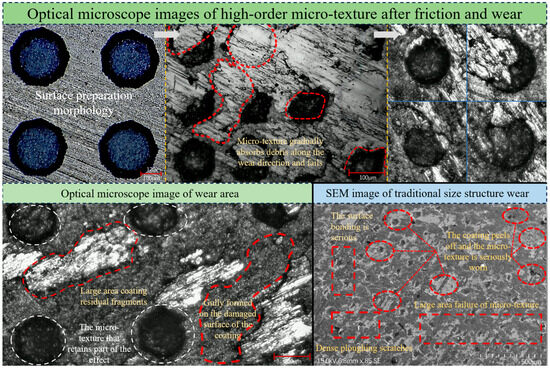
Figure 17.
Friction and wear state and wear condition comparison.
4.3. Analysis of Friction Vibration and Acoustic Vibration Stable Period
The total data image of the gray mean of the time-frequency image of the test signal is shown in Figure 18. The variation of friction vibration and acoustic vibration is basically the same, showing an inverted V-shaped trend with a single inflection point. The signal is in a relatively stable state within 10–20 min and has a unified and highly correlated change at each time point. The correlation coefficient of time-frequency eigenvalues is as high as 0.94. On the whole, the acoustic vibration and friction vibration change together, and the stability of the two decreases greatly after 25 min. Therefore, the stable action time of the high-scale textured coating is 10–25 min, and the optimal action period is 15–20 min.
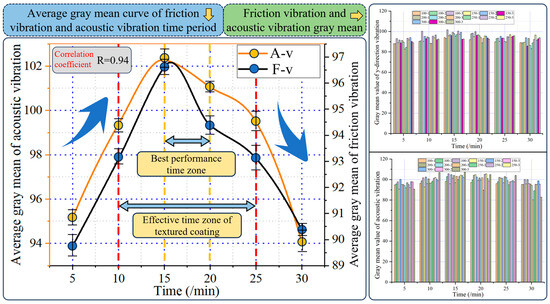
Figure 18.
Experimental friction vibration and acoustic vibration signal gray mean data.
5. Conclusions
- (1)
- For the frictional vibration and acoustic vibration signals with large amounts of data and continuous changes, the time-frequency characteristics obtained by CWT analysis are clearer and more comprehensive.
- (2)
- The size expansion of micro-texture helps to improve its chip-holding function, especially in the sizes of 100–150 μm and 250–300 μm. It can effectively expand the laser Marangoni effect strengthening area. Reduce the contact between the wear debris and the workpiece, and reduce the influence of friction vibration and acoustic vibration. The synergistic effect of surface texture and coating of cemented carbide is improved, and the wear resistance is improved.
- (3)
- Compared with the modification effect of traditional-scale micro-textured AlCrN coating, it is found that when the size of the micro-texture is increased, the friction vibration stability is increased by 1.58%, the acoustic vibration stability is increased by 4.47%, the friction stability is increased by 13.16%, and the friction and wear performance are improved.
- (4)
- The variation of friction vibration and acoustic vibration obtained by friction and wear tests is basically the same. The variation curves of friction vibration and acoustic vibration under CWT-grayscale analysis show that the stable period of high-order textured coating is 10–25 min. The best action period is 15–20 min.
- (5)
- The treatment method of high-order micro-texture synergistic coating can provide a good modification reference for metal surface modification, especially for cutting tools, reduce contact vibration, and enhance tool wear resistance and oxidation resistance. The idea of size expansion can also provide a reference for the development of other directions based on size parameter strengthening modifications.
Author Contributions
Conceptualization, X.T. and S.W.; methodology, S.W.; validation, X.T. and S.W.; formal analysis, S.W.; investigation, X.T.; resources, X.T.; writing—original draft preparation, S.W.; writing—review and editing, S.W.; funding acquisition, X.T. All authors have read and agreed to the published version of the manuscript.
Funding
This research was funded by the National Natural Science Foundation of China, grant no. 52005140.
Institutional Review Board Statement
Not applicable.
Informed Consent Statement
Not applicable.
Data Availability Statement
Data are contained within the article.
Conflicts of Interest
The authors declare no conflicts of interest.
References
- Li, Y.; Yu, X.; Yue, X.; Han, S. Effect of tool micro-texture on cutting performance of 6061 aluminum alloy. Ordnance Mater. Sci. Eng. 2023, 46, 24–28. [Google Scholar]
- Liu, T.; Li, J.; Lu, X.; Jiang, Z. Effect of Surface Texture Parameters on Triblogical Properties of Steel Ball and Steel Disk under Poor Oil Lubrication. Lubr. Eng. 2023, 48, 74–80. [Google Scholar]
- Georg, S.; Hauke, S.; Robert, T.; Hermann, S. Experimental investigations on the friction behavior of partially femtosecond laser-textured journal bearing shells. Tribol. Int. 2023, 188, 108764. [Google Scholar]
- Wu, X.; Zhan, J.; Mei, S. Optimization of Micro-Texturing Process Parameters of TiAlN Coated Cutting Tools by Femtosecond Laser. Materials 2022, 15, 6519. [Google Scholar] [CrossRef] [PubMed]
- Chen, S.; Wang, W.; Cong, J.; Yuan, W.; Guo, Q. Research on composite friction modification method of GCr15 surface coating and texture. Mod. Manuf. Eng. 2023, 5, 1–5. [Google Scholar]
- Zhang, K.; Zhang, C.; Li, H.; Dong, B.; Guo, X. Study on the substrate surface micro-texturing/carburizing regulating the film-substrate adhesion and wear behavior of DLC coatings. Diam. Relat. Mater. 2022, 130, 109535. [Google Scholar] [CrossRef]
- Liu, M.; Wang, D.; Li, J.; Zhu, Z.; Mo, J. Characteristics of the tribological wear, vibration and sgueal noise of brake disc surfaces with grooves. J. Vib. Shock 2018, 37, 236–240. [Google Scholar]
- Xu, H.; Lv, X.; Wang, X.; Feng, J.; Liu, X.; Peng, J.; Wu, H. Electrochemically assisted laser surface microtexture preparation and tribological properties research. J. Manuf. Process. 2024, 122, 54–64. [Google Scholar] [CrossRef]
- Rajurkar, A.; Chinchanikar, S. Investigations on homothetic and hybrid micro-textured tools during turning Inconel-718. Mater. Manuf. Process. 2024, 39, 529–545. [Google Scholar] [CrossRef]
- Wang, H.; Wang, B.; Zhou, F.; Guo, K.; Liu, Y.; Lin, H. Effect of laser surface texturing on friction performance and surface damage of silicon nitride ceramic. J. Asian Ceram. Soc. 2024, 12, 184–193. [Google Scholar] [CrossRef]
- Bondarev, A.; Simonovic, K.; Vitu, T.; Kožmín, P.; Syrovatka, Š. Textured coating or coated texture: Femtosecond laser texturing of aC: H/WC coatings for dry friction applications. Surf. Coat. Technol. 2023, 469, 129808. [Google Scholar] [CrossRef]
- Fan, Q.; Lin, J.; Wang, T. The Latest Research Progress of Tool Coating Materials. Surf. Technol. 2022, 51, 1–19+28. [Google Scholar]
- Ma, Z. Research on Vibration Signal Feature Extraction METHOD Based on Time-Frequency Analysis and Convolutional Neural Network. Master’s Thesis, Harbin Institute of Technology, Harbin, China, 2020. [Google Scholar]
- Su, Y.; Mao, H. Fault diagnosis of scroll compressor based on wavelet transform and CNN. China Meas. Test 2023, 49, 92–97. [Google Scholar]
- Liu, Z.; Bai, Y.; Li, S.; Jia, X. Diesel engine fault diagnosis method based on wavelet time-frequencyDiagram and Swin Transformer. Syst. Eng. Electron. 2023, 45, 2986–2998. [Google Scholar]
- Wang, S.; Zhao, W.; Zhang, G.; Xu, H.; Du, Y. Identification of structural parameters from free vibration data using Gabor wavelet transform. Mech. Syst. Signal Process. 2021, 147, 107122. [Google Scholar] [CrossRef]
- Tong, X.; Li, X. Study on noise behavior of micro-textured composite coated cemented carbide surface grinding titanium alloy based on HHT analysis. J. Vib. Control. 2023. [Google Scholar] [CrossRef]
- Sun, M.; Yang, J.; Wu, L. Time-Frequency Analysis of Noisy Vibration Signal Based on Improved Hilbert-Huang Transform. J. Shanghai Jiaotong Univ. 2023, 57, 1648–1656. [Google Scholar] [CrossRef]
- Tong, X.; Han, P.; Yang, S. Study of the friction behavior of AlCrN coated micro-textured surfaces. Tribol. Int. 2023, 177, 107985. [Google Scholar] [CrossRef]
- Fu, K. Research on Feature Extraction Methods and Its Application to Nonstationary Signal Based on HHT. Master’s Thesis, Chongqing University, Chongqing, China, 2015. [Google Scholar]
- Wang, W.; Xu, Q.; Yang, M. Method of system fault diagnosis basedon opticalgray-image recognition. Chin. J. Quantum Electron. 2019, 36, 699–704. [Google Scholar]
- Tong, X.; Wang, S. STFT—Based surface vibration analysis method for textured coated cemented carbide. Chin. J. Sci. Instrum. 2023, 44, 284–295. [Google Scholar]
- Su, S. Research on Micro-Texture Distribution Design and Anti-Wear and Anti-Friction Mechanism of Ball-End Milling Cutter. Master’s Thesis, Harbin University of Science and Technology, Harbin, China, 2021. [Google Scholar]
Disclaimer/Publisher’s Note: The statements, opinions and data contained in all publications are solely those of the individual author(s) and contributor(s) and not of MDPI and/or the editor(s). MDPI and/or the editor(s) disclaim responsibility for any injury to people or property resulting from any ideas, methods, instructions or products referred to in the content. |
© 2024 by the authors. Licensee MDPI, Basel, Switzerland. This article is an open access article distributed under the terms and conditions of the Creative Commons Attribution (CC BY) license (https://creativecommons.org/licenses/by/4.0/).