
Research on Micro-Triangular Pyramid Array-Based Fly-Cutting Technology Using the Orthogonal Test Method


Abstract
1. Introduction

2. Materials and Methods
2.1. Experimental Platform and Materials
2.2. MTPA and Tool Design Parameters
2.3. Orthogonal Experimental Design
2.3.1. Orthogonal Experimental Factor Levels
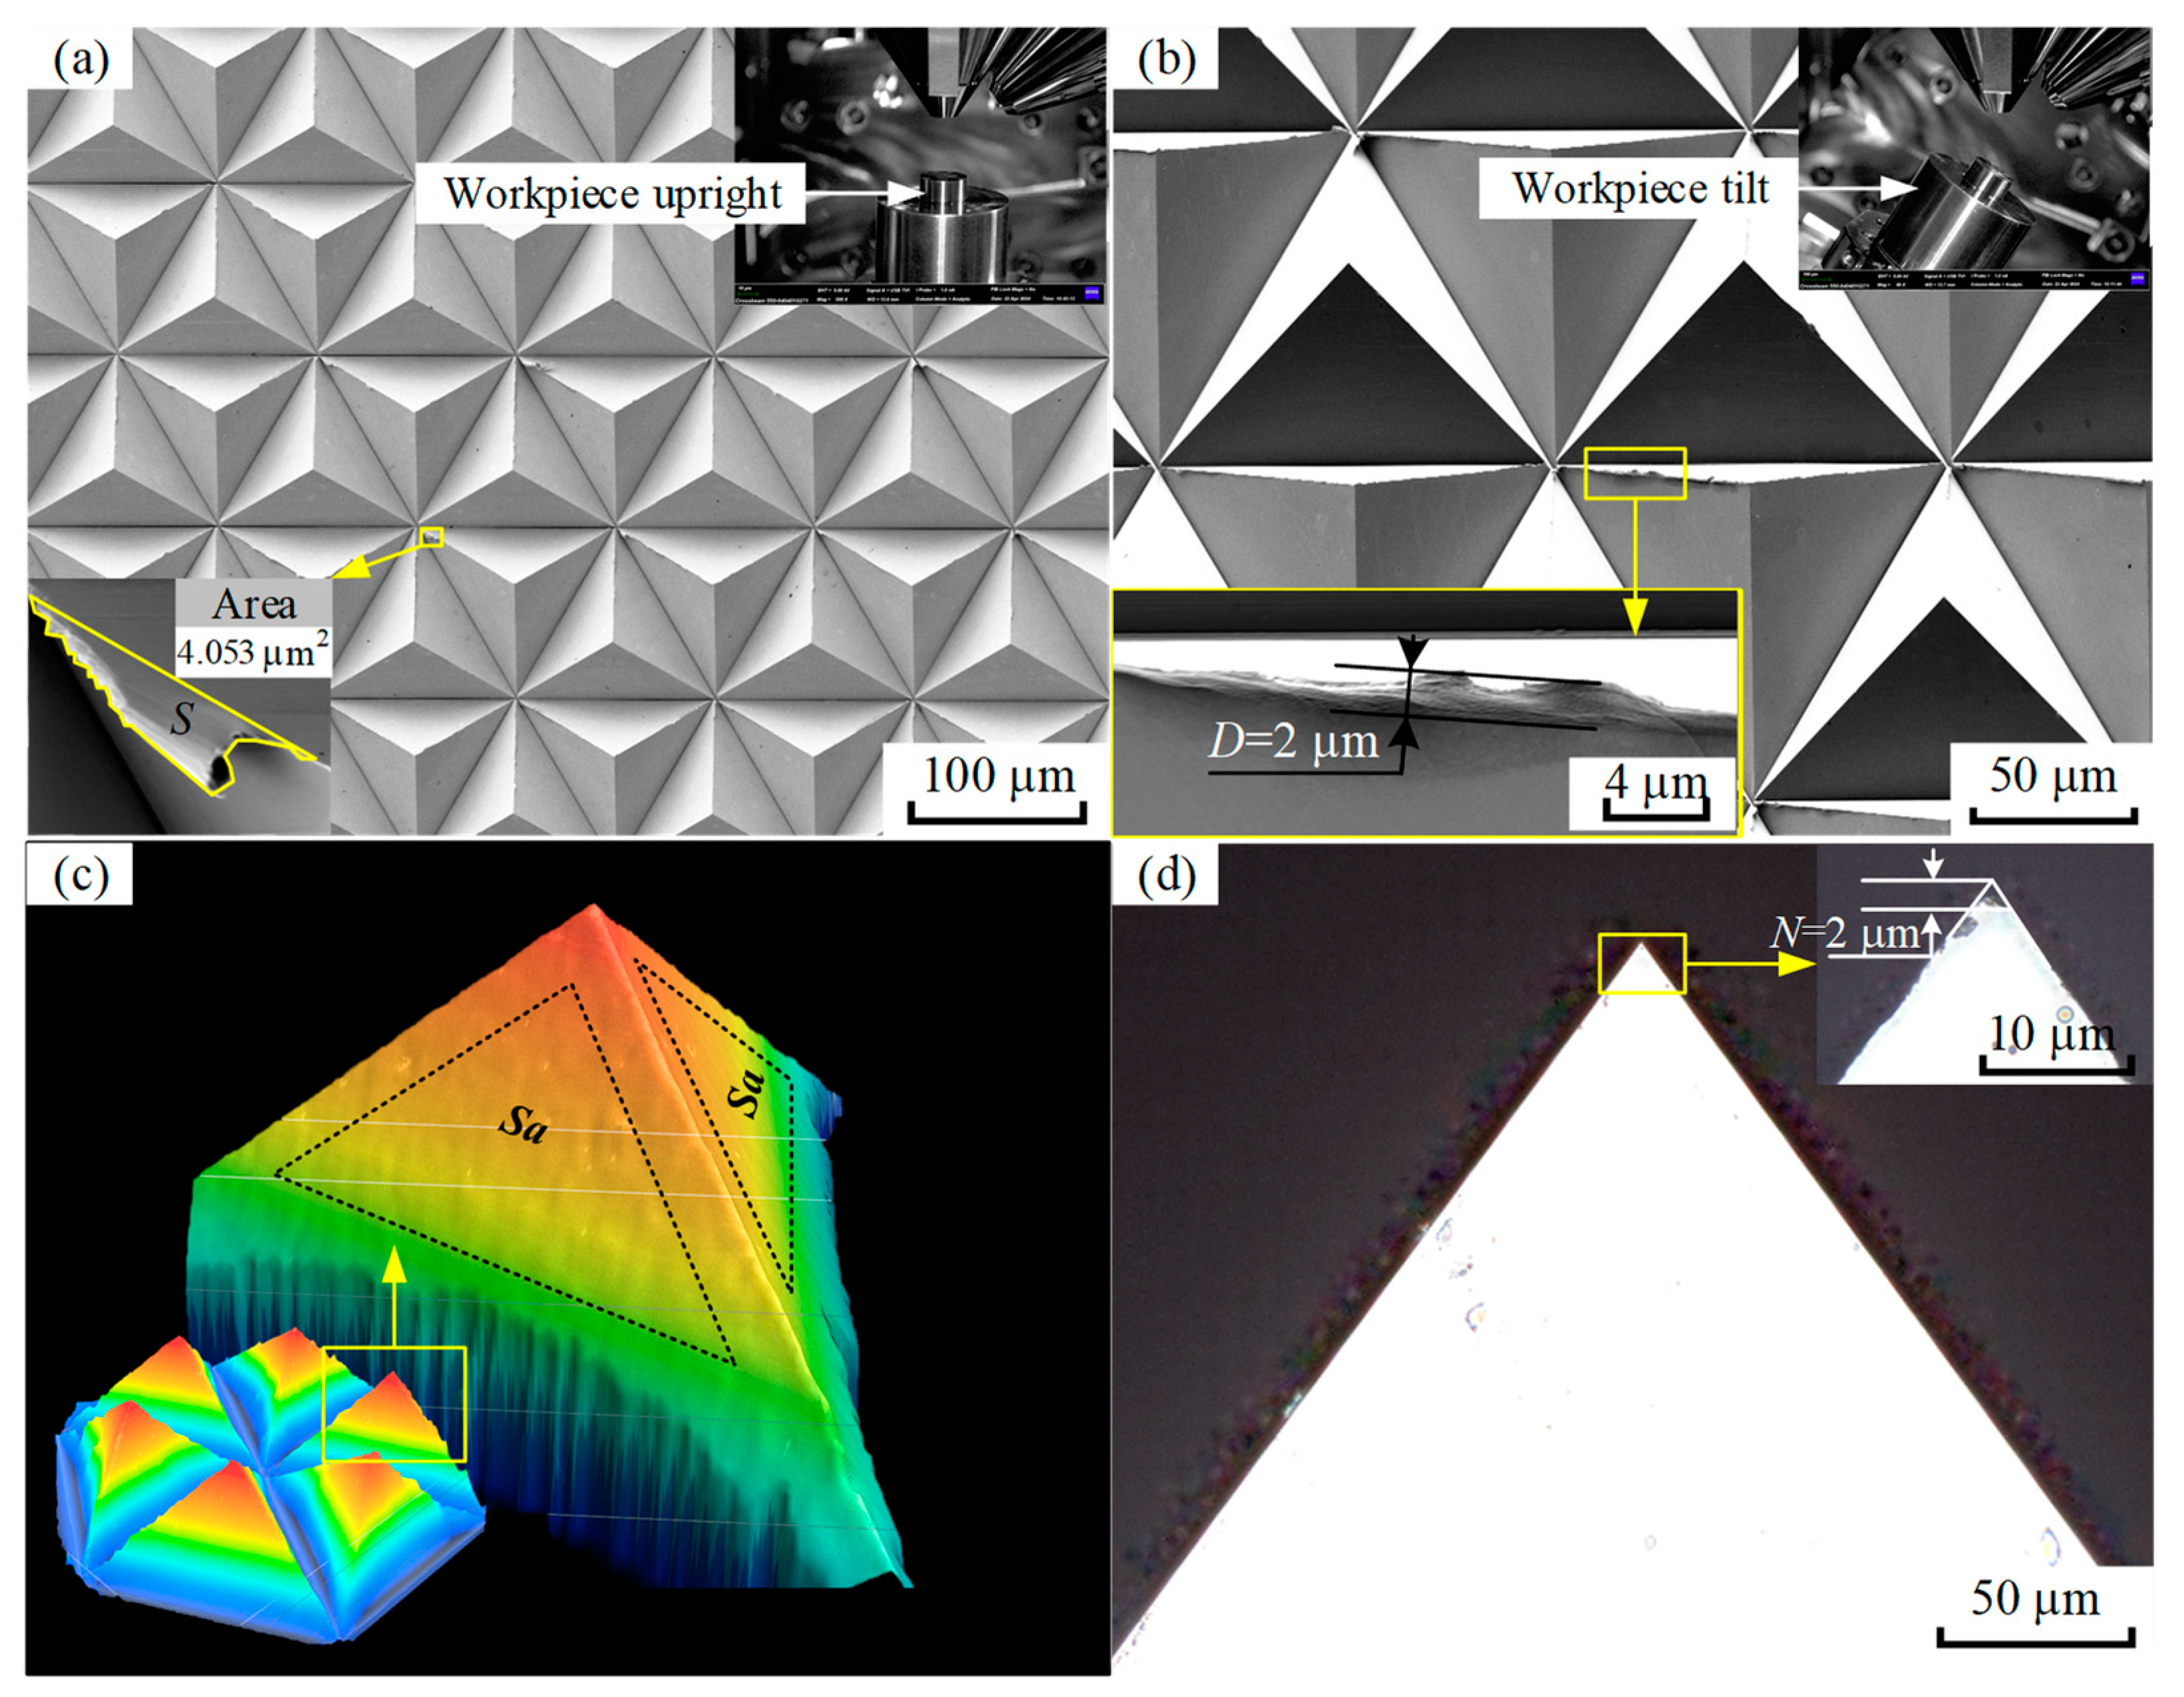
2.3.2. Orthogonal Experimental Indices and Measurement Methods
3. Results
3.1. Orthogonal Experimental Results
3.2. Range Analysis Results
3.3. Experimental Verification of the Optimal Program
4. Discussion
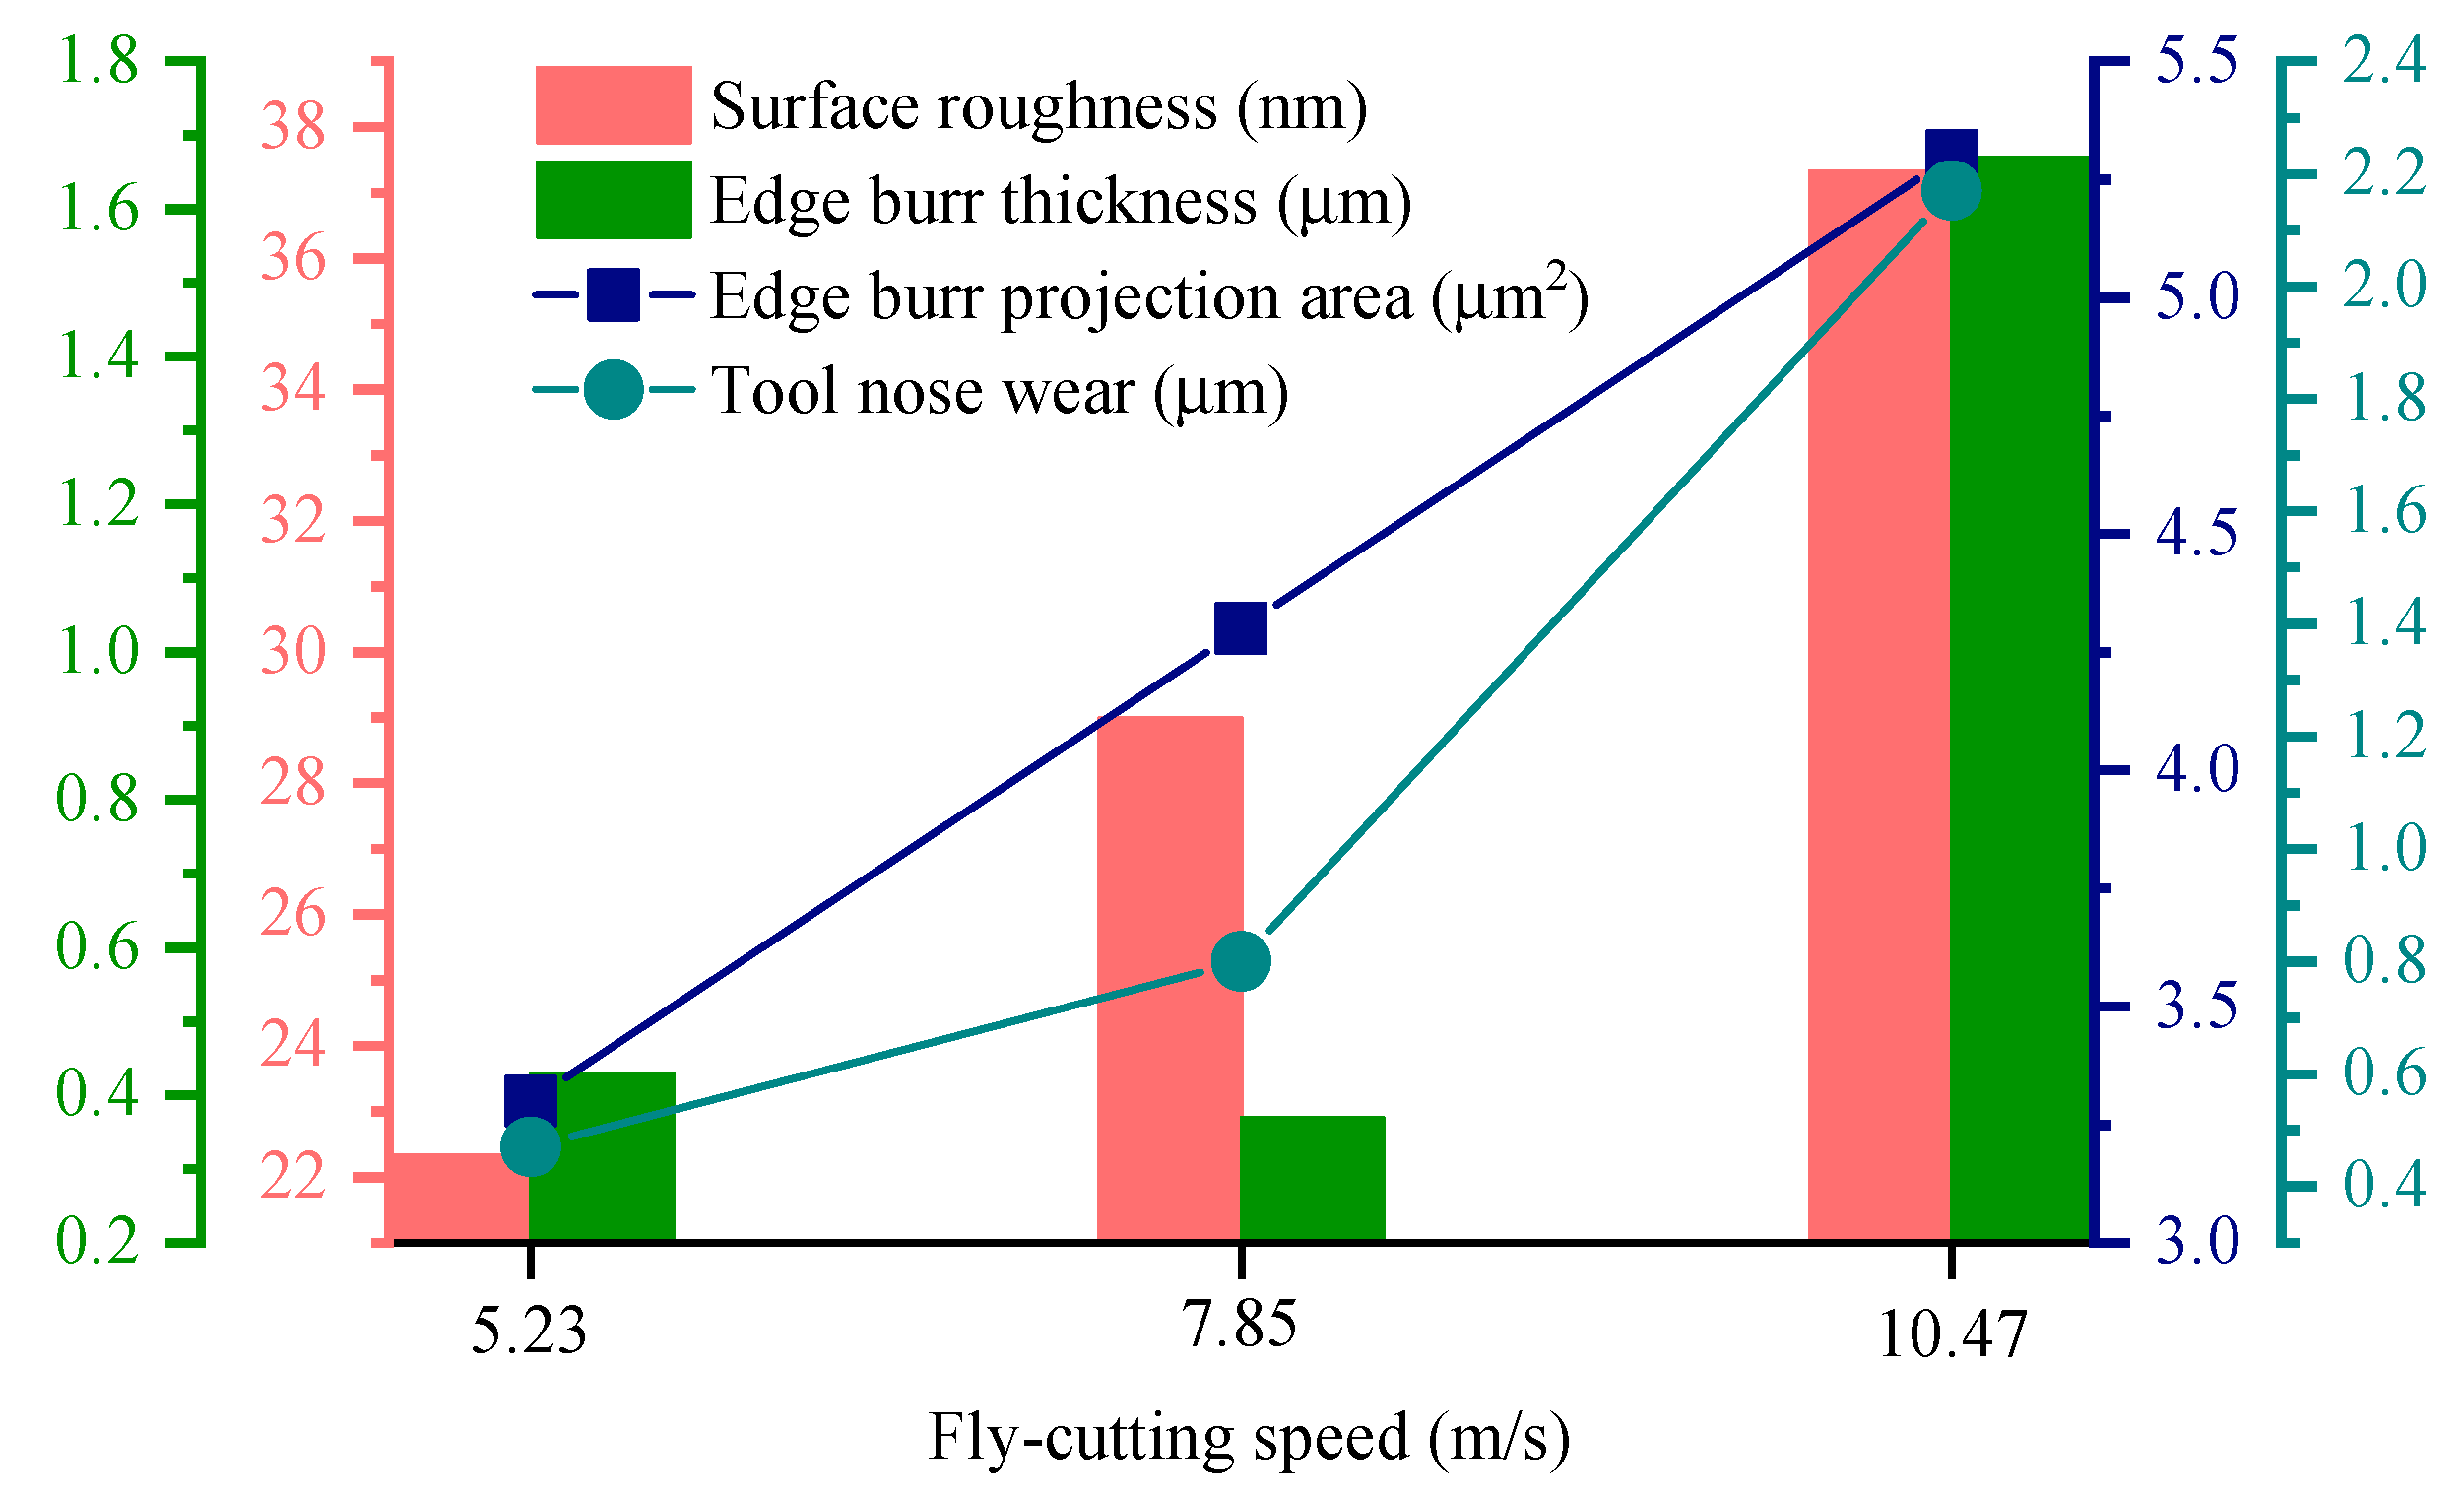
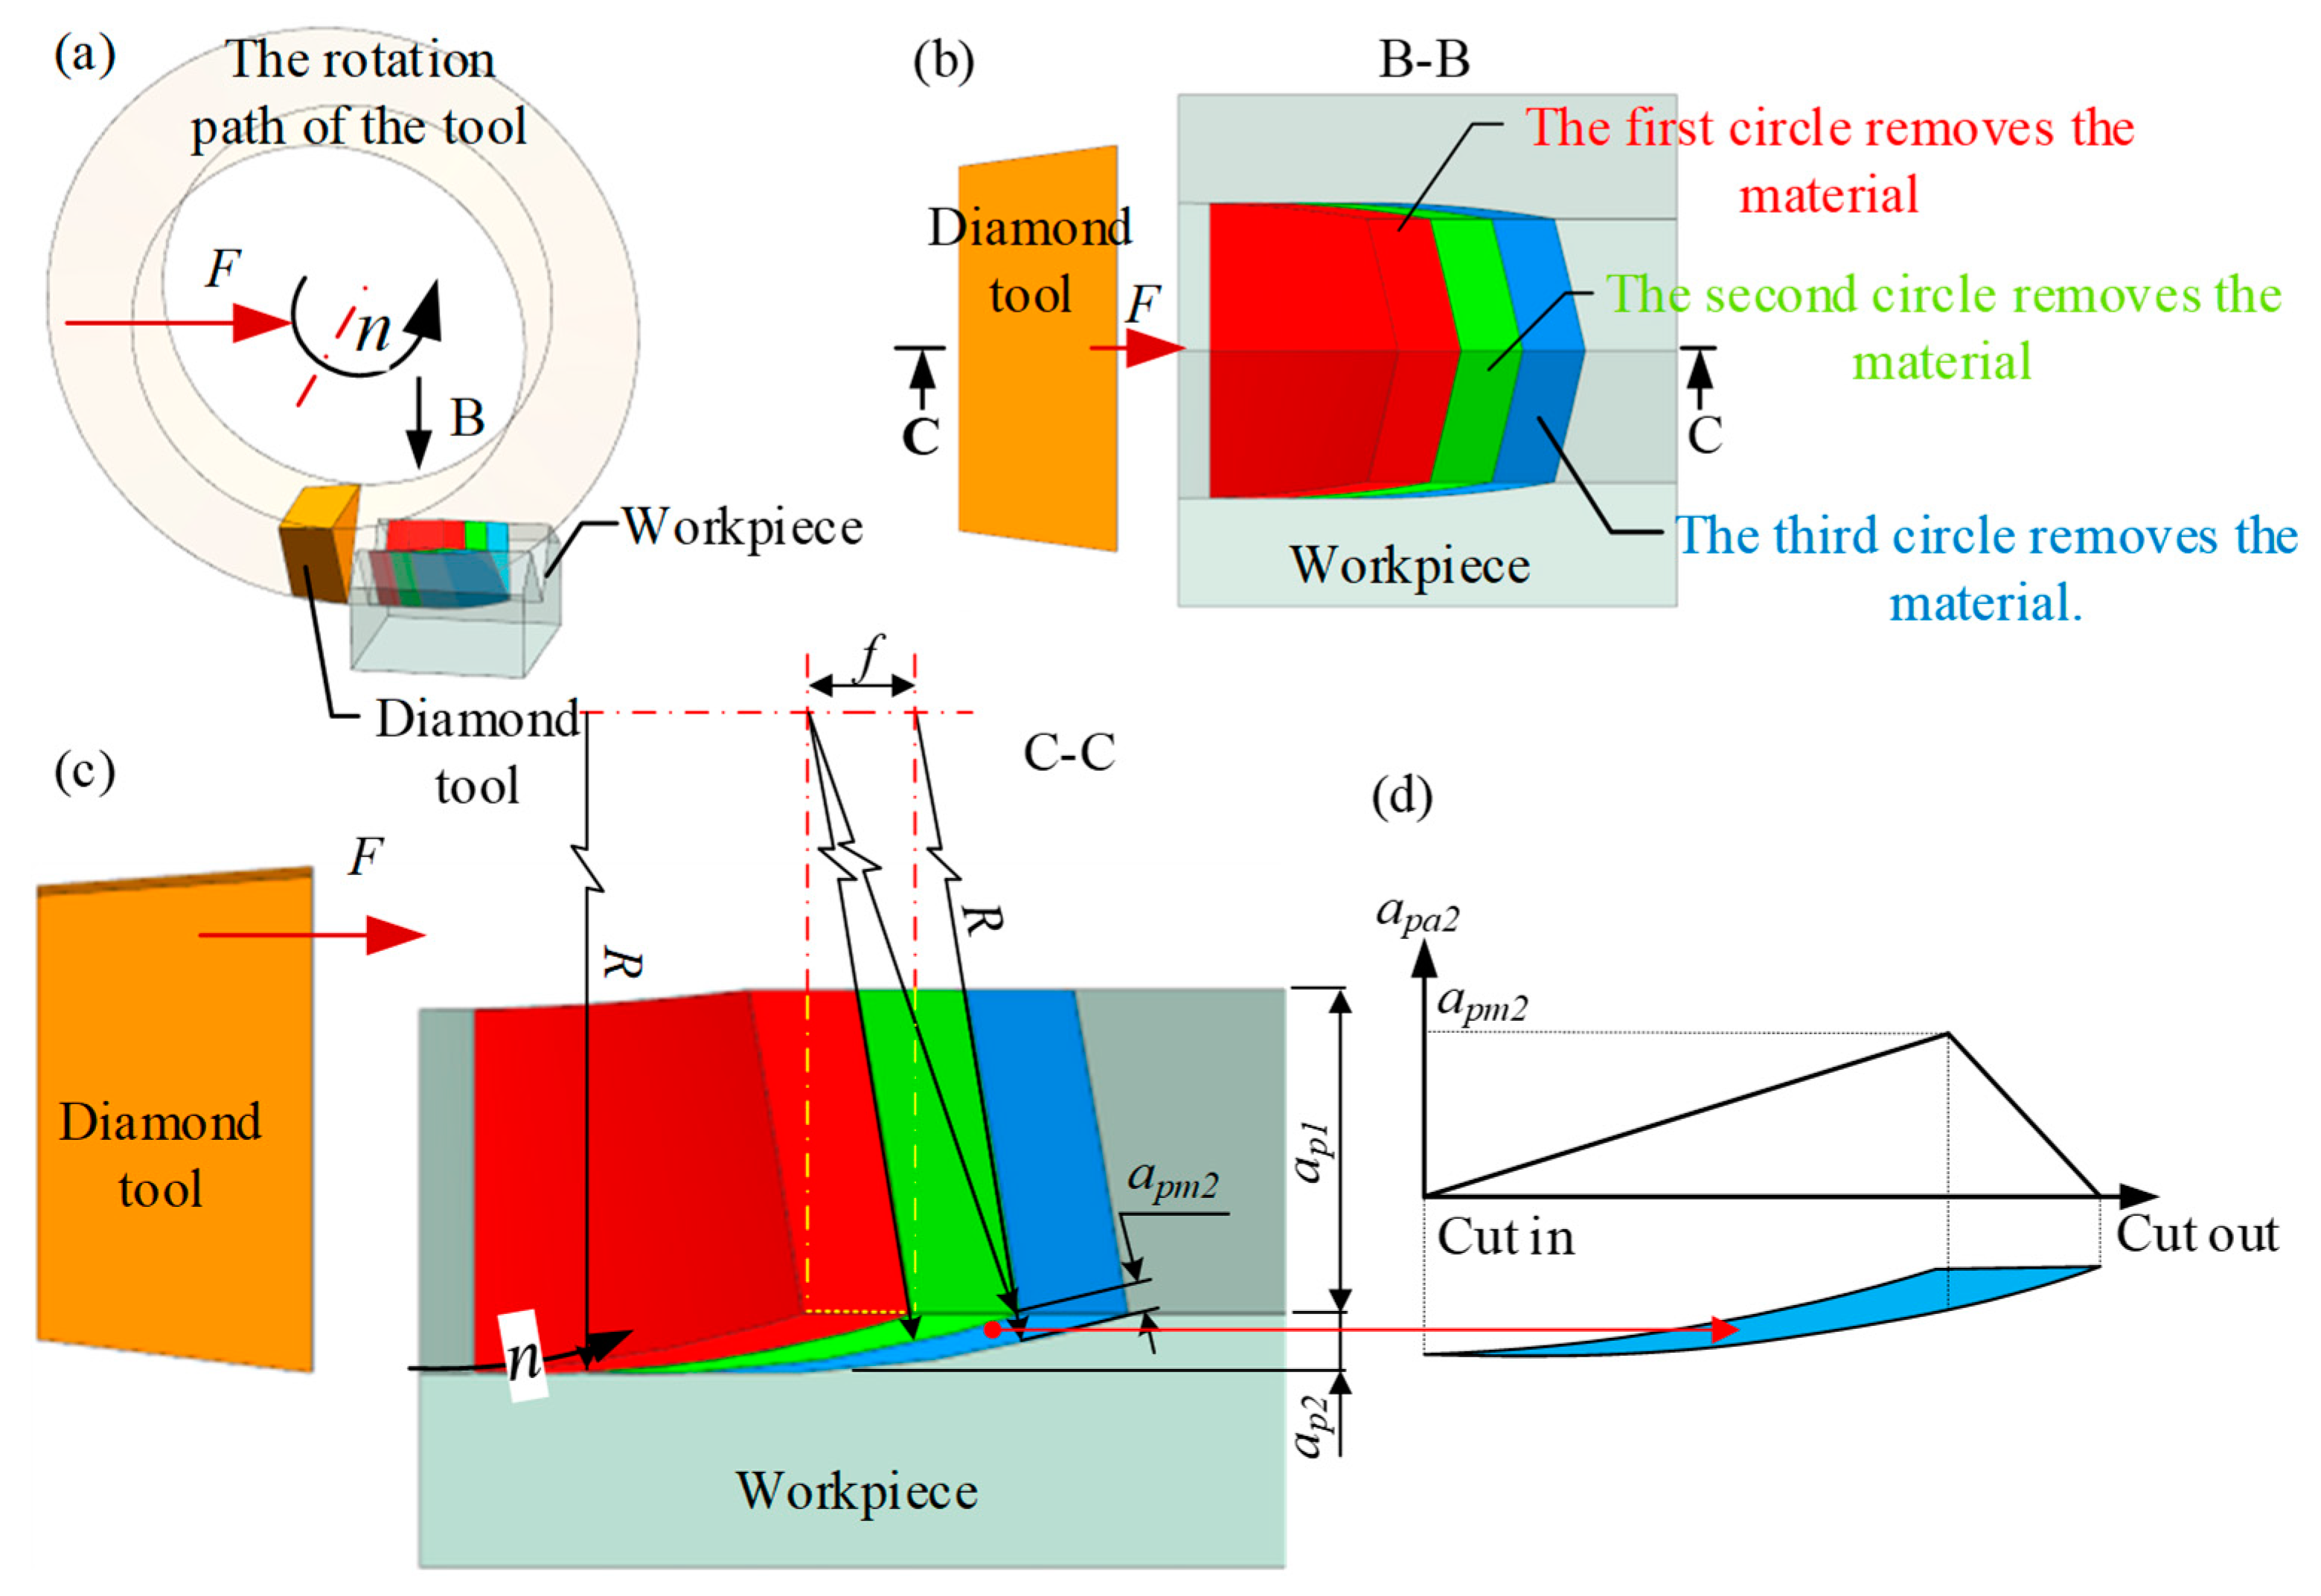
4.1. Fly-Cutting Speed
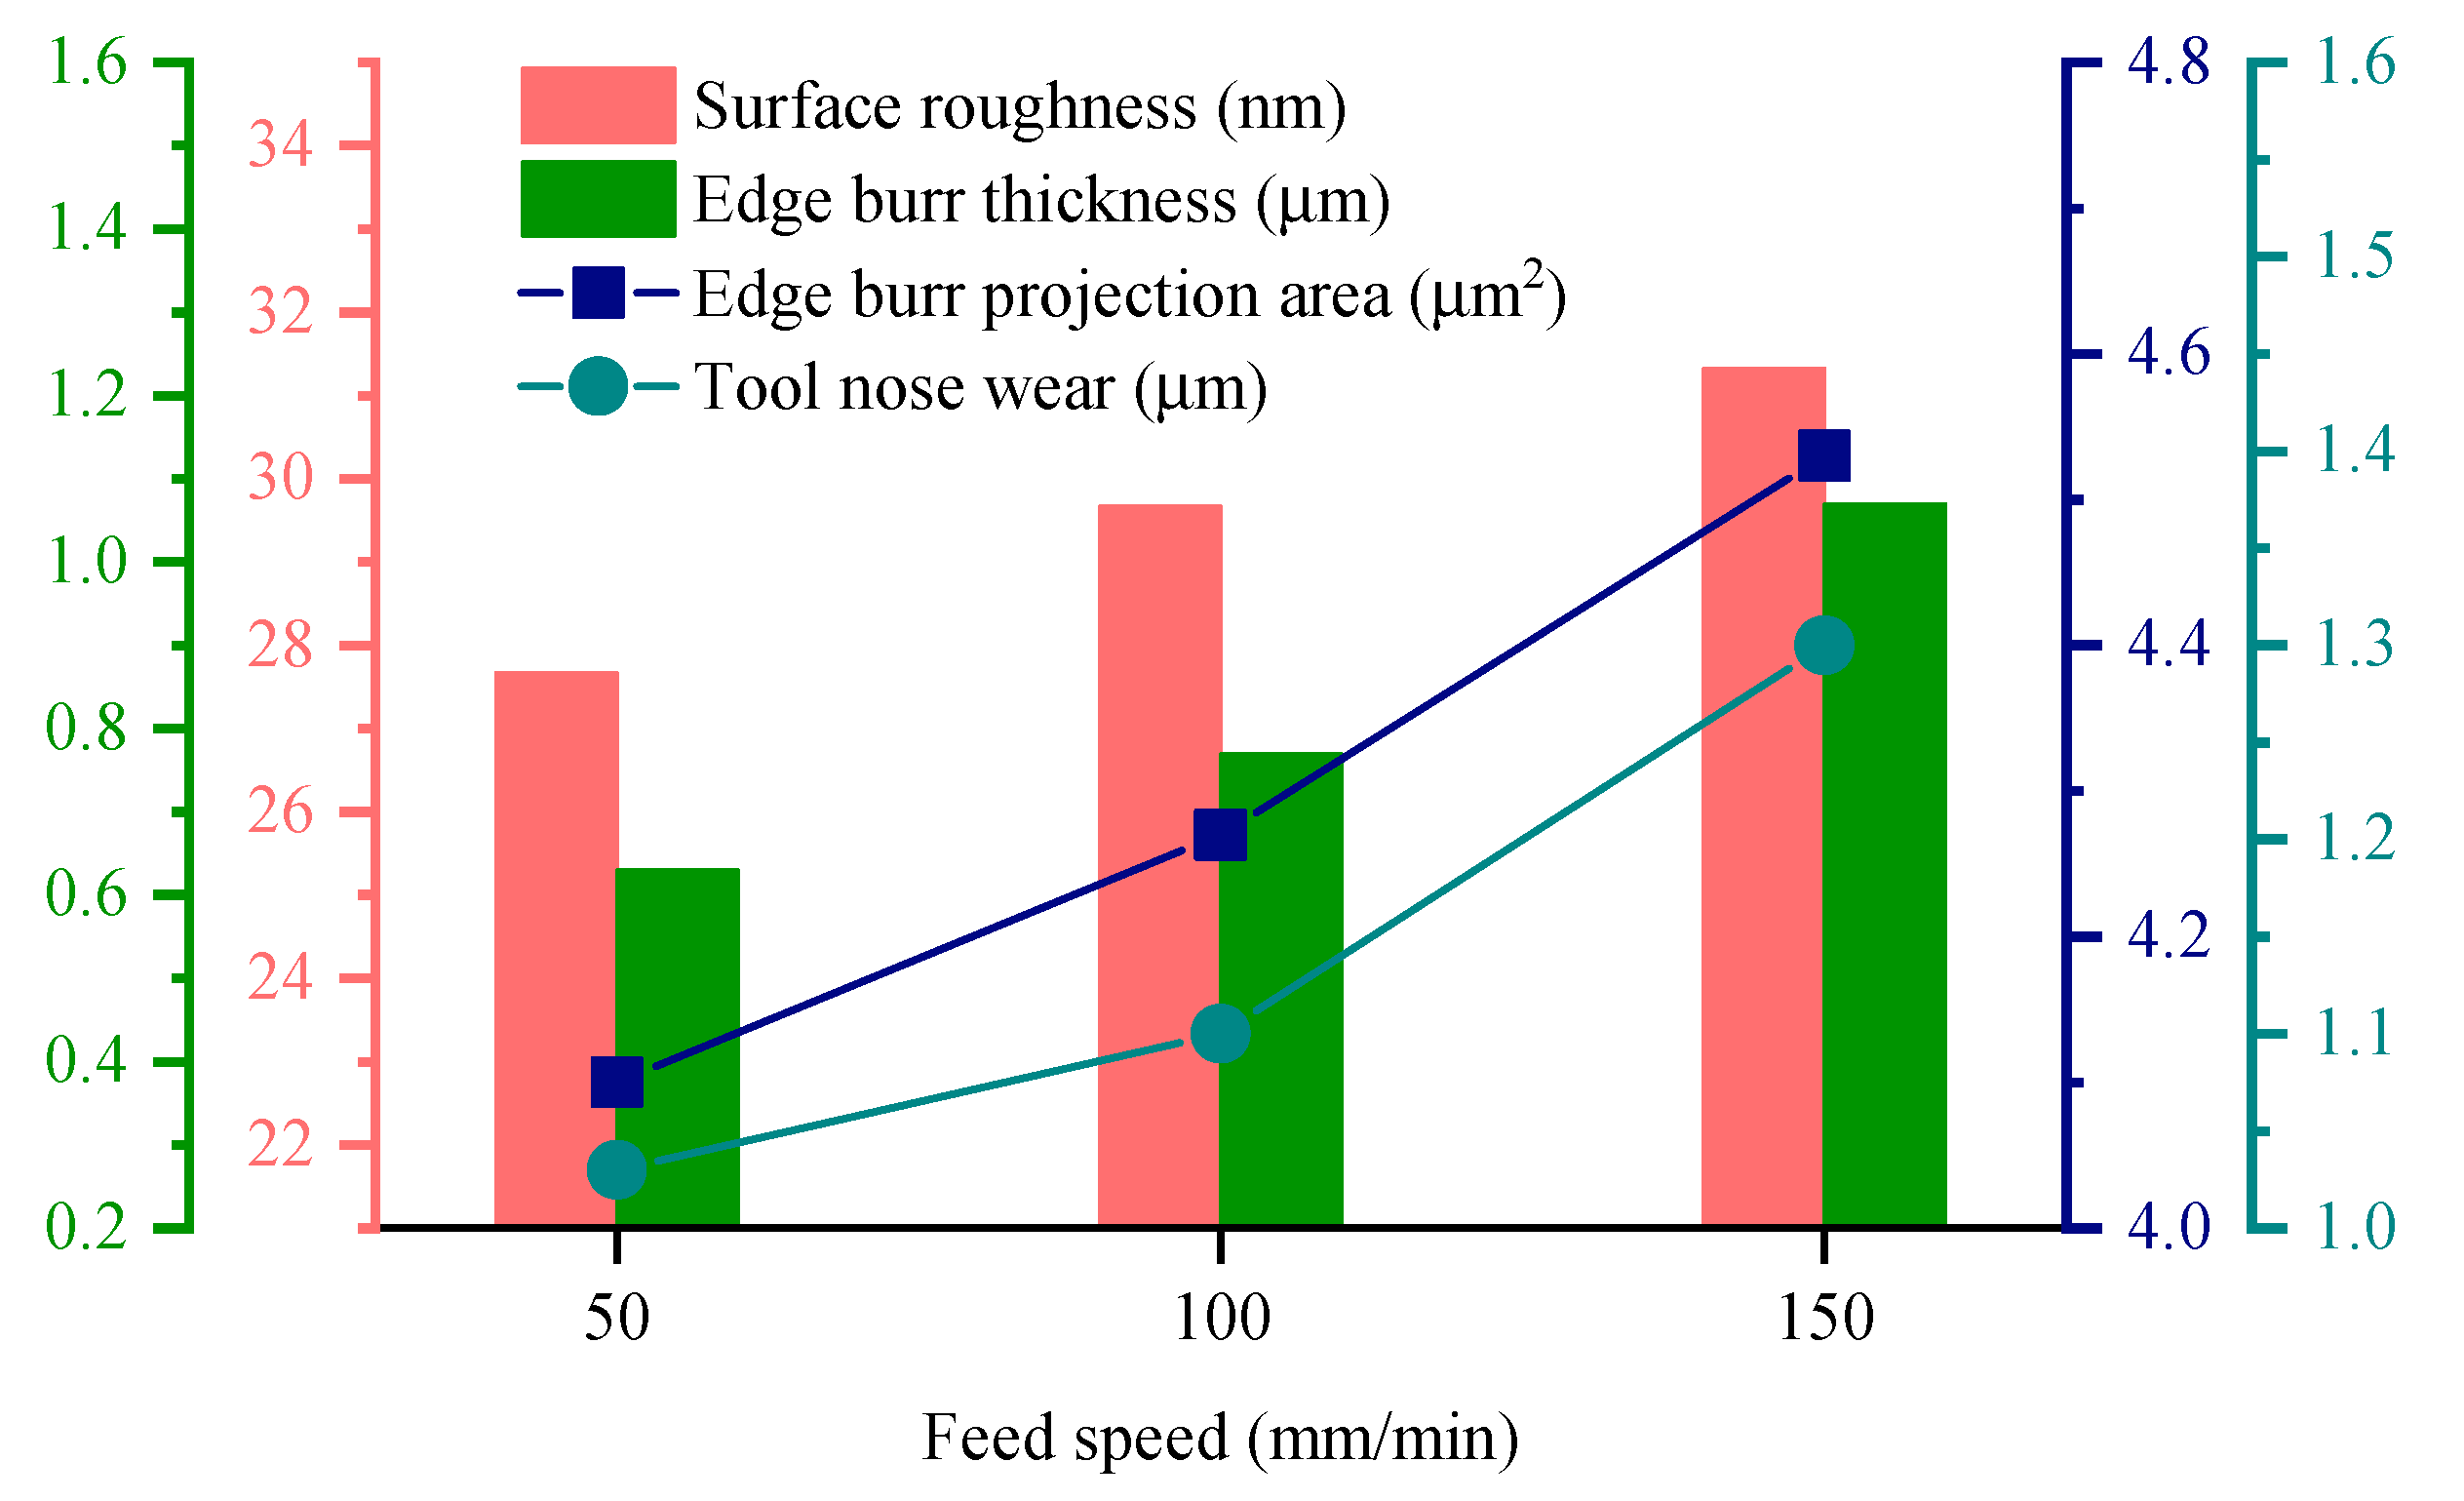
4.2. Feed Speed
4.3. Cutting Depth
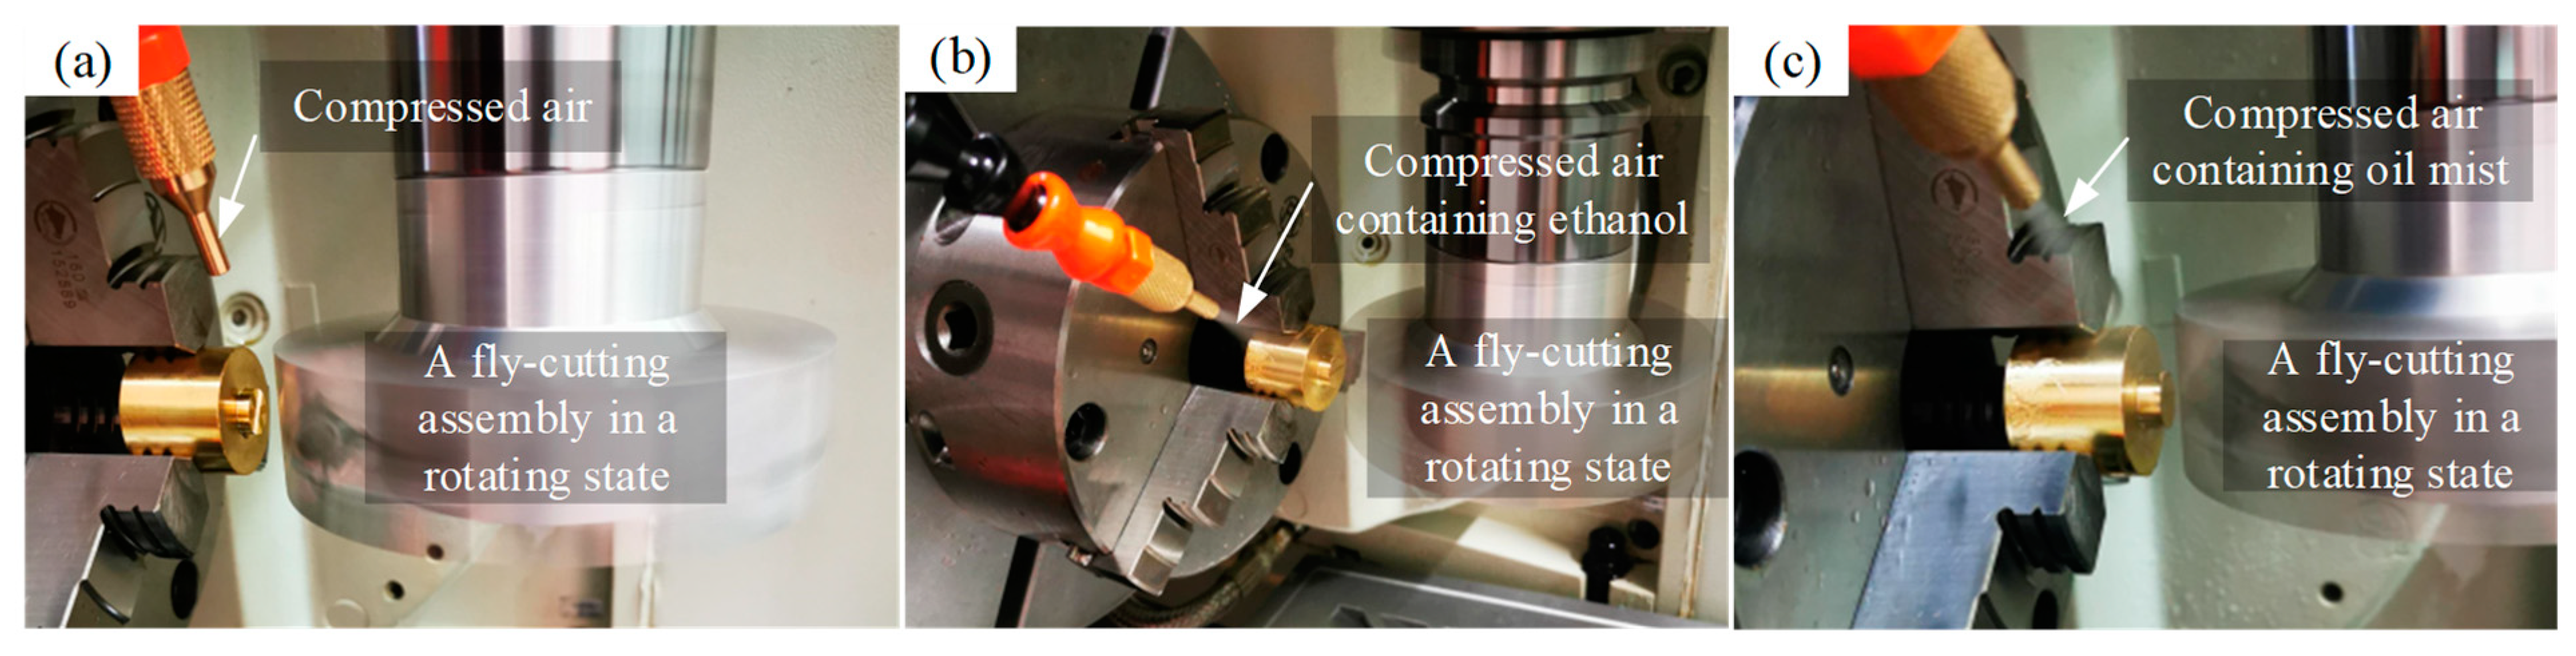
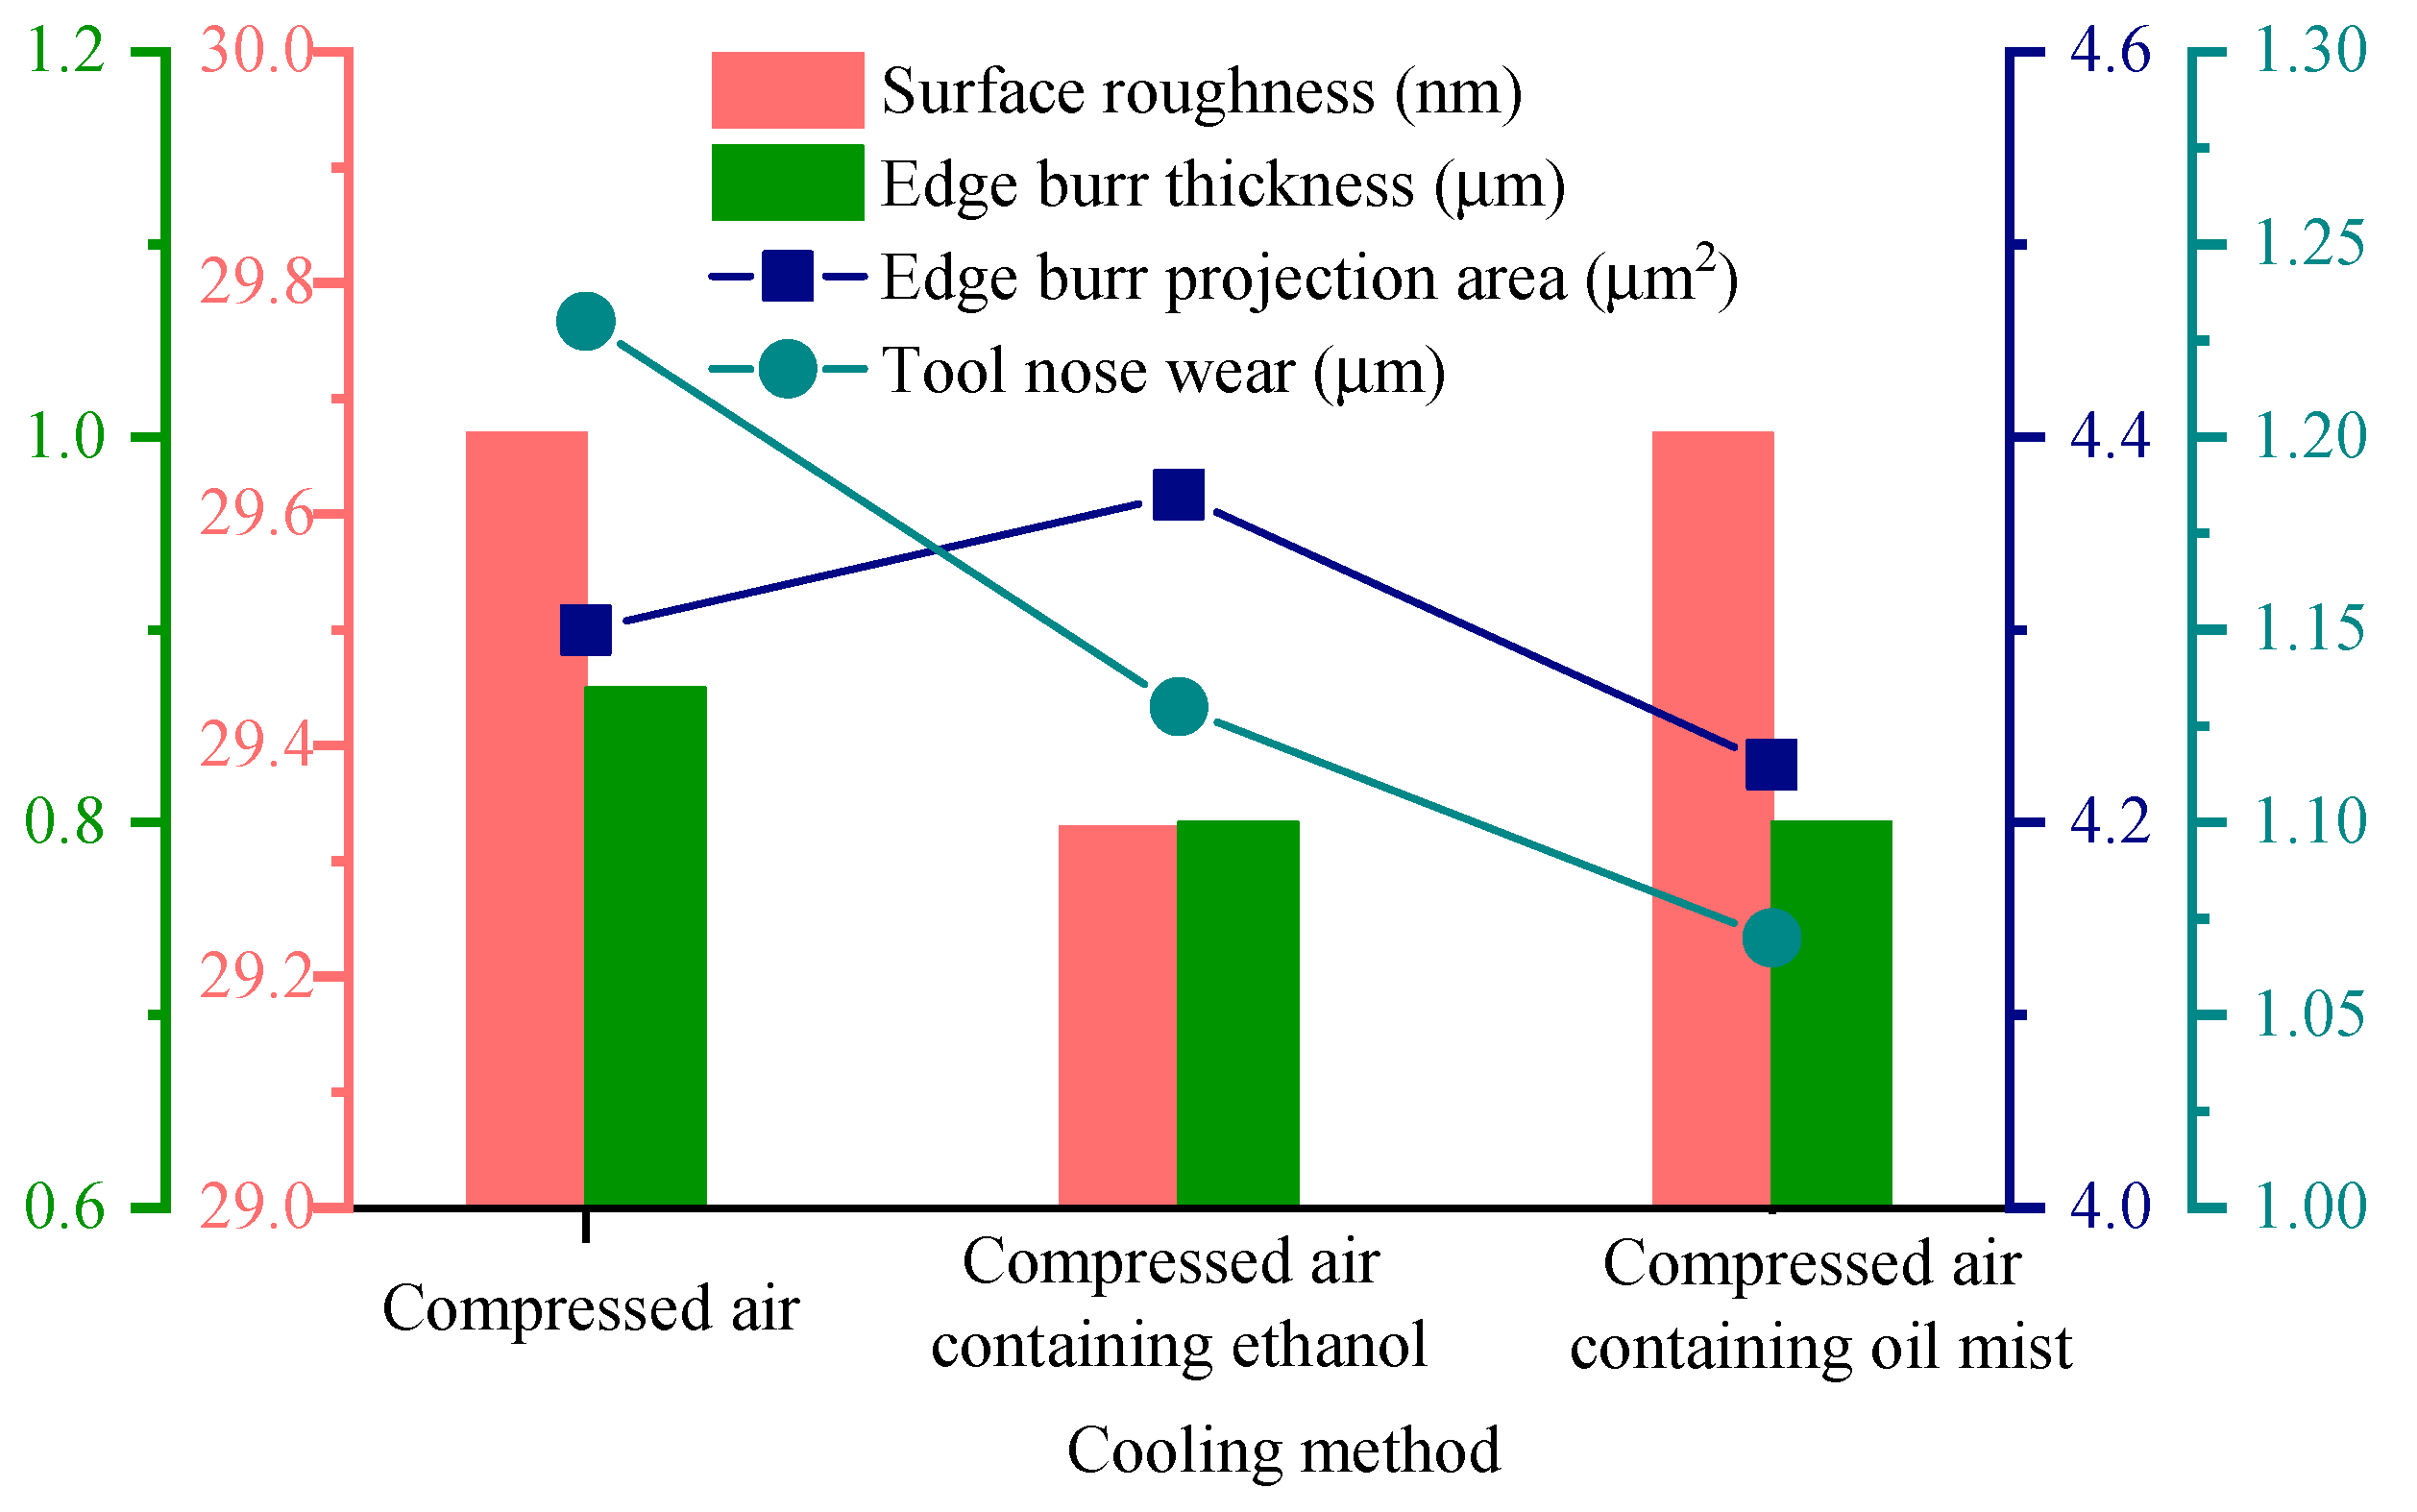
4.4. Cooling Method
5. Conclusions
- The four influencing factors of orthogonal experiments were the fly-cutting speed, feed speed, cutting depth, and the cooling method. Among them, the cooling method adopted the MQL to prevent impurities in the circulating working fluid from contaminating the surface of the MTPA. The four evaluation indexes of orthogonal experiments were surface roughness, edge burr thickness, edge burr projection area, and tool nose wear. Among them, edge burr thickness and edge burr projection area were used to characterize the curly edge burr.
- The primary and secondary factors affecting the surface roughness, the projected area of the exit edge burr, and the exit edge burr thickness were the same, ranked in descending order as the fly-cutting speed, feed speed, cutting depth, and cooling method. In contrast, the factors affecting the amount of tool nose wear were ranked as fly-cutting speed, feed speed, cooling method, and cutting depth.
- The projected area of the edge burr was minimized under the following optimal conditions: a fly-cutting speed of 5.23 m/s, a feed speed of 50 mm/min, a finishing cutting depth of 15 μm, and using compressed air containing oil mist for cooling. The optimal conditions for minimizing the thickness of the edge burr were as follows: a fly-cutting speed of 7.85 m/s, a feed speed of 50 mm/min, a finishing cutting depth of 15 μm, and using compressed air with oil mist for cooling.
- The plasticities of different metal materials varied, and the residual amount of edge burrs produced by cutting MPTAs was also different. Cutting force and cutting heat affect MPTAs. Therefore, the influence of different metal materials, cutting forces, and cutting heat on MPTAs is the focus of subsequent research. The optimized fly-cutting process can only minimize the thickness of the edge burrs; it cannot remove them altogether. To completely remove the edge burr, it is necessary to develop a new technology, which will be the subject of future research.
Author Contributions
Funding
Institutional Review Board Statement
Informed Consent Statement
Data Availability Statement
Conflicts of Interest
References
- Yang, J.; Yang, J.; Fu, Y.; Wu, J.; Ouyang, M.; Dong, L.; Kou, S. Design and manufacturing of mid-infrared ultra-wide-angle antireflective composite micro-nano structure film. Opt. Mater. 2024, 149, 115137. [Google Scholar] [CrossRef]
- Li, X.; Petrescu, F.I.T.; Danzeng, Q.; Zhu, H.; Li, Y.; Shi, G. A bioinspired ag nanoparticle/ppy nanobowl/tio2 micropyramid sers substrate. Nanomaterials 2022, 12, 4104. [Google Scholar] [CrossRef] [PubMed]
- Lee, H.; Yi, A.; Choi, J.; Ko, D.; Jung Kim, H. Texturing of polydimethylsiloxane surface for anti-reflective films with super-hydrophobicity in solar cell application. Appl. Surf. Sci. 2022, 584, 152625. [Google Scholar] [CrossRef]
- Kim, J.; Kim, B.; Kang, R.; Lee, M.; Lee, B.; Kim, S. High-efficiency upright solar panels with antireflective microprism-imprinted sheets. Cell Rep. Phys. Sci. 2024, 5, 101906. [Google Scholar] [CrossRef]
- Peng, Y.; Huang, H.; Xie, H. Rapid fabrication of antireflective pyramid structure on polystyrene film used as protective layer of solar cell. Sol. Energy Mater. Sol. Cells 2017, 171, 98–105. [Google Scholar] [CrossRef]
- Jiang, J.; Luo, T.; Zhang, G.; Dai, Y. Novel tool offset fly cutting straight-groove-type micro structure arrays. J. Mater. Process. Technol. 2021, 288, 116900. [Google Scholar] [CrossRef]
- Ma, Y.; Zhang, G.; Cao, S.; Huo, Z.; Han, J.; Ma, S.; Huang, Z. A review of advances in fabrication methods and assistive technologies of micro-structured surfaces. Processes 2023, 11, 1337. [Google Scholar] [CrossRef]
- Kurniawan, R.; Ali, S.; Park, K.M.; Li, C.P.; Ko, T.J. Development of a three-dimensional ultrasonic elliptical vibration transducer (3d-uevt) based on sandwiched piezoelectric actuator for micro-grooving. Int. J. Precis. Eng. Manuf. 2019, 20, 1229–1240. [Google Scholar] [CrossRef]
- Obikawa, T.; Hayashi, M. Ultrasonic-assisted incremental microforming of thin shell pyramids of metallic foil. Micromachines 2017, 8, 142. [Google Scholar] [CrossRef]
- Kurniawan, R.; Ko, T.J.; Kumaran, S.T.; Ahmed, F. 3-dof ultrasonic elliptical vibration tool holder based on coupled resonance modes for manufacturing micro-groove. Precis. Eng. 2021, 67, 212–231. [Google Scholar] [CrossRef]
- Hu, M.; Xie, J.; Li, W.; Niu, Y. Theoretical and experimental study on hot-embossing of glass-microprism array without online cooling process. Micromachines 2020, 11, 984. [Google Scholar] [CrossRef] [PubMed]
- Xia, S.; Yin, Z.; Zhang, J.; Meng, S.; Guo, Y.; Huang, C. Diamond shifting cutting of hexagonal cube corner retroreflectors. Precis. Eng. 2023, 79, 119–125. [Google Scholar] [CrossRef]
- Li, H.; Xu, Z.; Pi, J.; Zhou, F. Precision cutting of the molds of an optical functional texture film with a triangular pyramid texture. Micromachines 2020, 11, 248. [Google Scholar] [CrossRef]
- Zhang, S.J.; To, S.; Zhu, Z.W.; Zhang, G.Q. A review of fly cutting applied to surface generation in ultra-precision machining. Int. J. Mach. Tools Manuf. 2016, 103, 13–27. [Google Scholar] [CrossRef]
- Dong, X.; Zhou, T.; Pang, S.; Liang, Z.; Ruan, B.; Zhu, Z.; Wang, X. Mechanism of burr accumulation and fracture pit formation in ultraprecision microgroove fly cutting of crystalline nickel phosphorus. J. Micromech. Microeng. 2018, 28, 125008. [Google Scholar] [CrossRef]
- Huang, Y.; Li, S.; Zhang, J.; Yang, C.; Liu, W. Research on shape error of microstructure array fabricated by fly cutting. Optik 2021, 241, 167031. [Google Scholar] [CrossRef]
- Huang, Y.; Li, S. Fabrication of micropyramid structure by fly-cutting. Opt. Eng. 2019, 58, 1. [Google Scholar] [CrossRef]
- Jin, S.Y.; Pramanik, A.; Basak, A.K.; Prakash, C.; Shankar, S.; Debnath, S. Burr formation and its treatments—A review. Int. J. Adv. Manuf. Technol. 2020, 107, 2189–2210. [Google Scholar] [CrossRef]
- Fu, Y.; Zhu, X.; Wang, J.; Gong, T.; Sun, S.; Li, J.; Ye, L.; Li, X. Investigation of impact load and erosion behaviors on ti-ta alloy surface through the synergistic effect of ultrasonic cavitation and micro-abrasive particles. J. Mater. Res. Technol. 2023, 26, 3893–3904. [Google Scholar] [CrossRef]
- Kumar, A.S.; Deb, S.; Paul, S. Ultrasonic-assisted abrasive micro-deburring of micromachined metallic alloys. J. Manuf. Process. 2021, 66, 595–607. [Google Scholar] [CrossRef]
- Qiao, Z.; Qu, D.; Wang, H.; Wu, D.; Wang, B. Experimental investigation of the influence of chip interference on burr height in machining micro v-grooves on electroplated copper roll die. Proc. Inst. Mech. Eng. Part B J. Eng. Manuf. 2018, 232, 1491–1497. [Google Scholar] [CrossRef]
- Lu, J.; Chen, J.; Fang, Q.; Liu, F.; Jin, T. Theoretical analysis and finite element simulation of poisson burr in cutting ductile metals. Simul. Model. Pract. Theory 2016, 66, 260–272. [Google Scholar] [CrossRef]
- Medeossi, F.; Sorgato, M.; Bruschi, S.; Savio, E. Novel method for burrs quantitative evaluation in micro-milling. Precis. Eng. 2018, 54, 379–387. [Google Scholar] [CrossRef]
- Sharan, R.V.; Onwubolu, G.C. Measurement of end-milling burr using image processing techniques. Proc. Inst. Mech. Eng. Part B J. Eng. Manuf. 2011, 225, 448–452. [Google Scholar] [CrossRef]
- Li, H.; Xu, Z.; Ji, Z.; Pi, J. Quantitative characterization of poisson burrs on the v-shaped texture based on the volume method. J. Mater. Res. Technol. 2020, 9, 16280–16288. [Google Scholar] [CrossRef]
- Póka, G.; Balázs, B.Z. Effect of the chip thickness and the exit angle on the burr formation and break-out of the workpiece edge in the case of milling. J. Manuf. Process. 2024, 111, 45–63. [Google Scholar] [CrossRef]
- Zannoun, H.; Schoop, J. Analysis of burr formation in finish machining of nickel-based superalloy with worn tools using micro-scale in-situ techniques. Int. J. Mach. Tools Manuf. 2023, 189, 104030. [Google Scholar] [CrossRef]
- Gao, J.; Xu, Z.; Lei, Y.; Huang, S. Fly-cutting processing of micro-triangular pyramid arrays and synchronous micro-scrap removal. Micromachines 2024, 15, 655. [Google Scholar] [CrossRef]
- He, T.; Liu, N.; Xia, H.; Wu, L.; Zhang, Y.; Li, D.; Chen, Y. Progress and trend of minimum quantity lubrication (mql): A comprehensive review. J. Clean. Prod. 2023, 386, 135809. [Google Scholar] [CrossRef]
- Korkmaz, M.E.; Gupta, M.K.; Çelik, E.; Ross, N.S.; Günay, M. A sustainable cooling/lubrication method focusing on energy consumption and other machining characteristics in high-speed turning of aluminum alloy. Sustain. Mater. Technol. 2024, 40, e919. [Google Scholar] [CrossRef]
- Ross, N.S.; Srinivasan, N.; Amutha, P.; Gupta, M.K.; Korkmaz, M.E. Thermo-physical, tribological and machining characteristics of hastelloy c276 under sustainable cooling/lubrication conditions. J. Manuf. Process. 2022, 80, 397–413. [Google Scholar] [CrossRef]
- ASTM B36/B36M; Standard Specification for Brass Plate, Sheet, Strip, and Rolled Bar. ASTM: West Conshohocken, PA, USA, 2023.
- ISO 1832: 2017; Indexable inserts for cutting tools—Designation. ISO: Vernier, Geneva, Switzerland, 2017.
- Brinksmeier, E.; Preuss, W.; Riemer, O.; Rentsch, R. Cutting forces, tool wear and surface finish in high speed diamond machining. Precis. Eng. 2017, 49, 293–304. [Google Scholar] [CrossRef]


| Factors | Levels | ||
|---|---|---|---|
| 1 | 2 | 3 | |
| Fly-cutting speed v | 5.23 m/s | 7.85 m/s | 10.47 m/s |
| Feed speed F | 50 mm/min | 100 mm/min | 150 mm/min |
| Finishing cutting depth ap2 | 5 μm | 10 μm | 15 μm |
| Cooling method | Compressed air | Compressed air containing ethanol | Compressed air containing oil mist |
| Test | Four Factors | Four Indices | ||||||
|---|---|---|---|---|---|---|---|---|
| Fly-Cutting Speed v (m/s) | Feed Speed F (mm/min) | Finishing Cutting Depth ap2 (μm) | Cooling Method | Surface Roughness Sa (nm) | Edge Burr Thickness D (μm) | Edge Burr Projection Area S (μm2) | Tool Nose Wear N (μm) | |
| 1 | 1 (5.23) | 1 (50) | 1 (5) | 1 (Compressed air) | 21 | 0.3 | 3.2 | 0.5 |
| 2 | 1 | 2 (100) | 2 (10) | 2 (Compressed air containing ethanol) | 22 | 0.4 | 3.3 | 0.4 |
| 3 | 1 | 3 (150) | 3 (15) | 3 (Compressed air containing oil mist) | 24 | 0.6 | 3.4 | 0.5 |
| 4 | 2 (7.85) | 1 | 2 | 3 | 27 | 0.2 | 4 | 0.6 |
| 5 | 2 | 2 | 3 | 1 | 29 | 0.3 | 4.2 | 0.8 |
| 6 | 2 | 3 | 1 | 2 | 31 | 0.6 | 4.7 | 1 |
| 7 | 3 (10.47) | 1 | 3 | 2 | 35 | 1.4 | 5.1 | 2 |
| 8 | 3 | 2 | 1 | 3 | 38 | 1.6 | 5.3 | 2.1 |
| 9 | 3 | 3 | 2 | 1 | 39 | 2 | 5.5 | 2.4 |
| Text Index | Factor | ||||
|---|---|---|---|---|---|
| Fly-Cutting Speed | Feed Speed | Finishing Cutting Depth | Cooling Method | ||
| Surface roughness Sa (nm) | 22.33 | 27.67 | 30.00 | 29.67 | |
| 29.00 | 29.67 | 29.33 | 29.33 | ||
| 37.33 | 31.33 | 29.33 | 29.67 | ||
| R | 15.00 | 3.67 | 0.67 | 0.33 | |
| Edge burr thickness D (μm) | 0.43 | 0.63 | 0.83 | 0.87 | |
| 0.37 | 0.77 | 0.87 | 0.80 | ||
| 1.67 | 1.07 | 0.77 | 0.80 | ||
| R | 1.30 | 0.43 | 0.10 | 0.07 | |
| Edge burr projection area S (μm2) | 3.30 | 4.10 | 4.40 | 4.30 | |
| 4.30 | 4.27 | 4.27 | 4.37 | ||
| 5.30 | 4.53 | 4.23 | 4.23 | ||
| R | 2.00 | 0.43 | 0.17 | 0.13 | |
| Tool nose wear N (μm) | 0.47 | 1.03 | 1.20 | 1.23 | |
| 0.80 | 1.10 | 1.13 | 1.13 | ||
| 2.17 | 1.30 | 1.10 | 1.07 | ||
| R | 1.70 | 0.27 | 0.10 | 0.17 | |
| Test Index | Influencing Factors (Primary→Secondary) | Optimal Program | |||
|---|---|---|---|---|---|
| Fly-Cutting Speed v (m/s) | Feed Speed F (mm/min) | Cutting Depth ap2 (μm) | Cooling Method | ||
| Surface roughness Sa (nm) | v→F→ap→Cooling method | 5.23 | 50 | 15 | Compressed air containing ethanol |
| Edge burr thickness D (μm) | v→F→ap→Cooling method | 7.85 | 50 | 15 | Compressed air containing oil mist |
| Edge burr projection area S (μm2) | v→F→ap→Cooling method | 5.23 | 50 | 15 | Compressed air containing ethanol/oil mist |
| Tool nose wear N (μm) | v→F→Cooling method→ap | 5.23 | 50 | 15 | Compressed air containing oil mist |
Disclaimer/Publisher’s Note: The statements, opinions and data contained in all publications are solely those of the individual author(s) and contributor(s) and not of MDPI and/or the editor(s). MDPI and/or the editor(s) disclaim responsibility for any injury to people or property resulting from any ideas, methods, instructions or products referred to in the content. |
© 2024 by the authors. Licensee MDPI, Basel, Switzerland. This article is an open access article distributed under the terms and conditions of the Creative Commons Attribution (CC BY) license (https://creativecommons.org/licenses/by/4.0/).
Share and Cite
Gao, J.; Lei, Y.; Xu, Z. Research on Micro-Triangular Pyramid Array-Based Fly-Cutting Technology Using the Orthogonal Test Method. Coatings 2024, 14, 806. https://doi.org/10.3390/coatings14070806
Gao J, Lei Y, Xu Z. Research on Micro-Triangular Pyramid Array-Based Fly-Cutting Technology Using the Orthogonal Test Method. Coatings. 2024; 14(7):806. https://doi.org/10.3390/coatings14070806
Chicago/Turabian StyleGao, Jiashun, Yu Lei, and Zhilong Xu. 2024. "Research on Micro-Triangular Pyramid Array-Based Fly-Cutting Technology Using the Orthogonal Test Method" Coatings 14, no. 7: 806. https://doi.org/10.3390/coatings14070806
APA StyleGao, J., Lei, Y., & Xu, Z. (2024). Research on Micro-Triangular Pyramid Array-Based Fly-Cutting Technology Using the Orthogonal Test Method. Coatings, 14(7), 806. https://doi.org/10.3390/coatings14070806