Article

Hierarchical Porous Activated Carbon Derived from Pleurotus Eryngii and the Influence of Pore Structural Parameters on Capacitance Performance

1
School of Integrated Circuit and Communication, Suzhou Vocational Institute of Industrial Technology, Suzhou 215104, China
2
Department of Electrical and Electronic Engineering, School of Advanced Technology, Xi’an Jiaotong-Liverpool University, Suzhou 215123, China
3
School of Robotics, Entrepreneur College, Xi’an Jiaotong-Liverpool University, Suzhou 215123, China
4
Department of Chemistry, School of Science, Xi’an Jiaotong-Liverpool University, Suzhou 215123, China
5
School of Electronic and Information Engineering, Xi’an Jiaotong University, Xi’an 710049, China
*
Author to whom correspondence should be addressed.
Deceased Author.
Coatings 2024, 14(7), 840; https://doi.org/10.3390/coatings14070840
Submission received: 30 May 2024 / Revised: 19 June 2024 / Accepted: 2 July 2024 / Published: 4 July 2024
(This article belongs to the Special Issue Functional Coatings of Porous Materials)

Abstract

:
Hierarchical porous activated carbon derived from pleurotus eryngii was prepared by a one-step activation method. It was found that the specific surface area of the obtained sample increased with the increase in activation temperature (700–900 °C). The sample activated at 900 °C has a specific surface area of 2002.2 m2 g−1 and the highest specific capacitance (319 F g−1), which is mainly attributed to the high utilization rate of specific surface area brought by the hierarchical porous structure. The assembled PEK-900//PEK-900 capacitor measured a specific capacity of 258 F g−1 at a current density of 0.5 A g−1. After 10,000 cycles of charging and discharging, the specific capacitance increased by 10%. Based on the correlation analysis of experimental data between the specific capacitance and pore structural parameters, Lasso dimensionality reduction and binary linear regression were used to reveal the relationship between the two. The residual sum of squares obtained by this method decreased by 38.4% compared to the univariate linear regression, providing a simple and reliable theoretical method for predicting the capacitance performance of biomass carbon materials.

1. Introduction

In recent years, biomass materials have received great attention and recognition from researchers due to their unique characteristics of universality, richness, renewability, and being pollution-free [1,2,3,4]. More and more biomass materials have already been demonstrated as appropriate carbon precursors to prepare electrode materials for supercapacitors applications [5,6,7]. For instance, Tian et al. [8] successfully synthesized ordered flute-shaped microporous carbon materials using cotton straw as carbon source. Tan et al. [9] prepared porous carbon materials via soaking bagasse in different concentrations of NaOH to change its composition. Su et al. [10] used willow catkins as carbon precursors and obtained hierarchical porous carbon materials through Ni(NO3)2·6H2O etching and KOH activation, which retained the original tubular structure of willow catkins.
After years of research, various methods have been developed to prepare biomass carbon materials, such as activation method [8,10,11], template method [12,13,14], chemical vapor deposition [15,16], microwave radiation [17,18], spray pyrolysis [19,20], etc. Among them, activation method is the simplest, although it often requires a large number of activators. However, other methods are more complex and expensive, and some may even cause serious environmental pollution.
Compared with KOH and H3PO4, KHCO3 is not only a mild activator, but also has excellent activation effects [21,22]. In our previous research [23], this has also been confirmed through comparative experiments. Compared to thermal reaction without activators, the specific surface area of paddy-derived carbon materials activated by KHCO3 has significantly increased by 1425 m2 g−1, and its specific capacitance has also dramatically improved by over 200 F g−1. This is mainly attributed to the activation mechanism of KHCO3, which could be divided into two processes. Firstly, the CO2 and water vapor released by the thermal decomposition of KHCO3 could form three-dimensional interconnected honeycomb-shaped large pores in carbon materials. Moreover, other decomposition products further create mesopores and micropores at higher activation temperatures, ultimately forming hierarchical porous carbon materials.
As is known to all, the specific capacitance of carbon materials depends on various factors, such as specific surface area (SSA), pore size distribution (PSD), and conductivity, with the SSA being the most important. However, the relationship between specific capacitance and SSA is complex. Zhang et al. [24] and Hu et al. [25] obtained a linear relationship between the two through the analysis of experimental data. Niu et al. [26] found that the change in specific capacitance is consistent with the trend of the proportion of micropores in the SSA.
In this work, a one-step activation of pleurotus eryngii has been used to prepare hierarchical porous carbon materials by adjusting the activation temperature (700–900 °C). To study the relationship between the specific capacitance and pore structural parameters, Lasso dimensionality reduction and binary linear regression were used to reveal the relationship between the two, providing a simple and reliable theoretical method for predicting the capacitance performance of biomass carbon materials.

2. Materials and Methods

2.1. Material Synthesis

The cleaned pleurotus eryngii was cut into 1 cm3 small cubes and mixed with KHCO3 powder in a mass ratio of 1:3. Subsequently, an appropriate amount of deionized water was added into the mixture and stirred evenly. After being dried at 80 °C in a vacuum drying oven, the mixture was placed in a high-speed ball mill for 15–30 min to form a powder, and then activated for 3 h in a tube furnace with nitrogen protection. When naturally cooled to room temperature, the activated sample was washed with sufficient dilute hydrochloric acid until acidic and filtered with excess deionized water until neutral. Finally, the product was dried in a vacuum drying oven at 80 °C. In order to study the effect of activation temperature, the activation temperatures were set to 700, 750, 800, 850 and 900 °C, and the corresponding products were named PEK-t, where t represents temperature. It should be noted that in our previous research [27], PEK-900 was used to study the impact of KHCO3 activation on various representative biomass materials with typical morphology and composition.

2.2. Material Characterization

The morphologies of the samples were captured using a Hitachi SU8010 scanning electron microscopy (SEM) system (Hitachi, Ltd., Tokyo, Japan). To analyze the X-ray diffraction (XRD) patterns, a Bruker D8 ADVANCE diffractometer (Bruker Corporation, Karlsruhe, Germany) was utilized with Cu Kα radiation. The X-ray photoelectron spectroscopy (XPS) analysis was conducted on a ESCALAB 250Xi system (Thermo Fisher Scientific, Waltham, MA, USA). Additionally, the SSA and PSD were evaluated with a Micromeritics ASAP 2460 instrument (Micromeritics Instruments Corporation, Norcross, GA, USA).

2.3. Electrochemical Testing

The production process of the working electrode was as follows: Firstly, mix the carbon material, carbon black and polyvinylidene fluoride in a ratio of 8:1:1 by mass. Then use a dropper to drop the appropriate N-methyl-2-pyrrolidone solvent into the mixture and stir thoroughly for 6 h. Subsequently, use a brush to evenly coat the mixed slurry onto the nickel foam and thoroughly dry it under vacuum at 80 °C for 24 h. After compression with the tablet press, the electrode was ready for testing. The approximate mass loading of the active material per single electrode was 3 mg cm−2.
All the electrochemical tests were performed using a Metrohm Autolab PGSTAT302N electrochemical workstation (Metrohm China Ltd., Hong Kong, China). In the three-electrode system, 6 M KOH aqueous was used as the electrolyte, while a platinum plate and a Hg/HgO electrode were served as counter and reference electrode. In the two-electrode system, the supercapacitor was assembled from two PEK-900 electrodes with 6 M KOH aqueous as the electrolyte. For cyclic voltammetry (CV) testing, the scanning rate was set to 5–100 mV s−1, which comprehensively reflected the electrochemical behavior of electrode materials under different conditions. For galvanostatic charge/discharge (GCD) testing, the current density range was 1–20 A g−1, which helped to evaluate the charge discharge performance and rate performance of electrode materials. In electrochemical impedance spectroscopy (EIS) testing, a sine wave signal with an amplitude of 5 mV was applied to the tested electrode, covering a wide frequency range from 0.01 Hz to 100 kHz to obtain the impedance information of the electrode at different frequencies. During the cycle life test (CLT), the supercapacitor underwent 10,000 charge and discharge cycles at a current density of 4 A g−1.
The calculation formula for the specific capacitance is as follows:
C g = k × I × t / ( m × V )
where k takes 1 in the three-electrode system and 2 in the two-electrode system, m is the mass of the active material on each electrode, I,  t  and  V , respectively, represent the discharge current, time, and voltage drop.

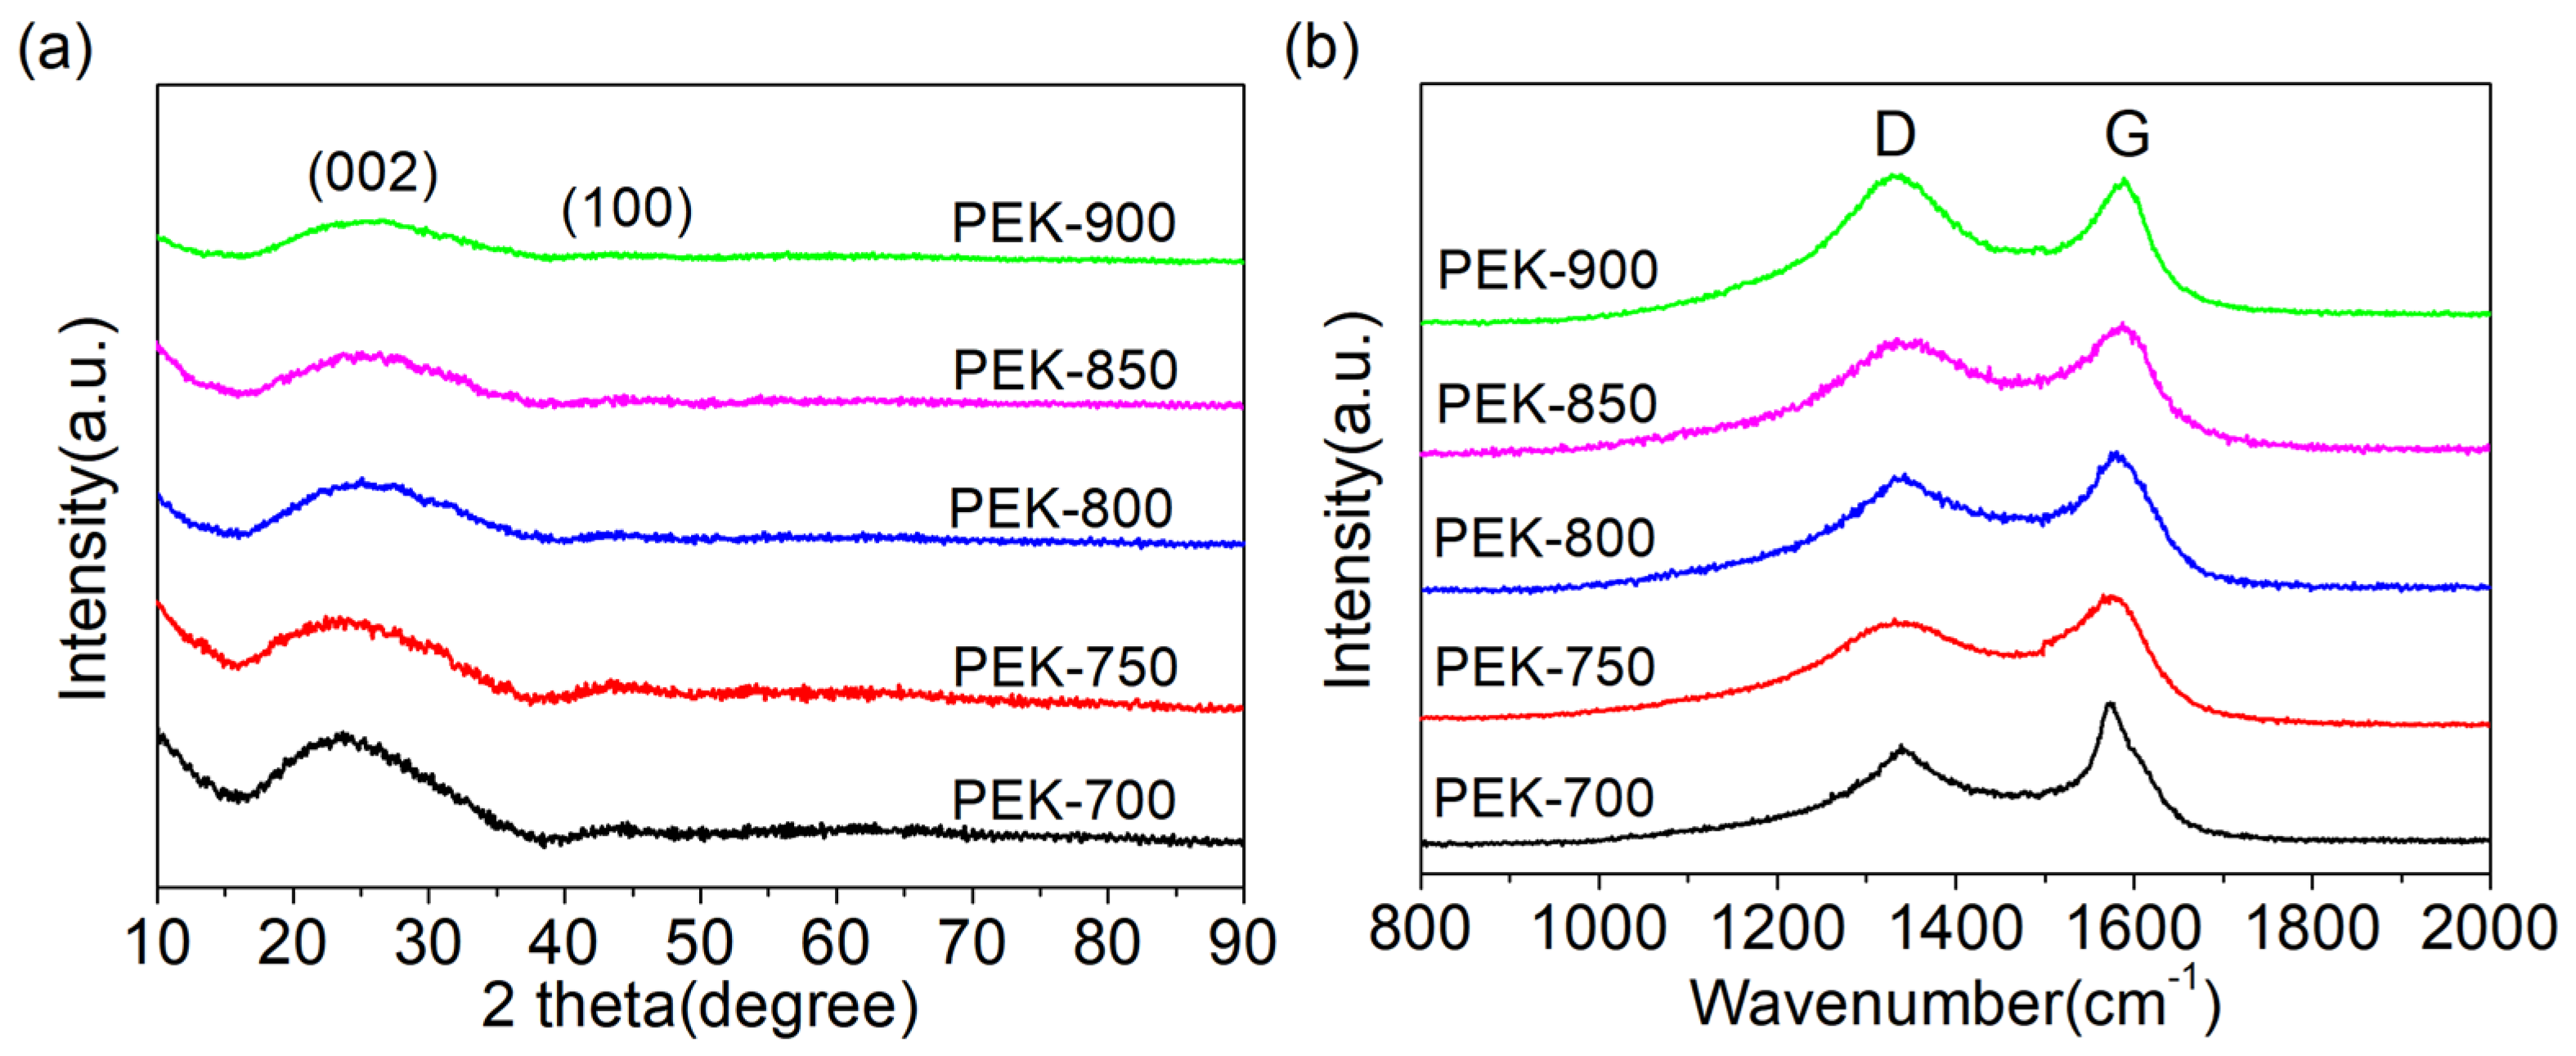
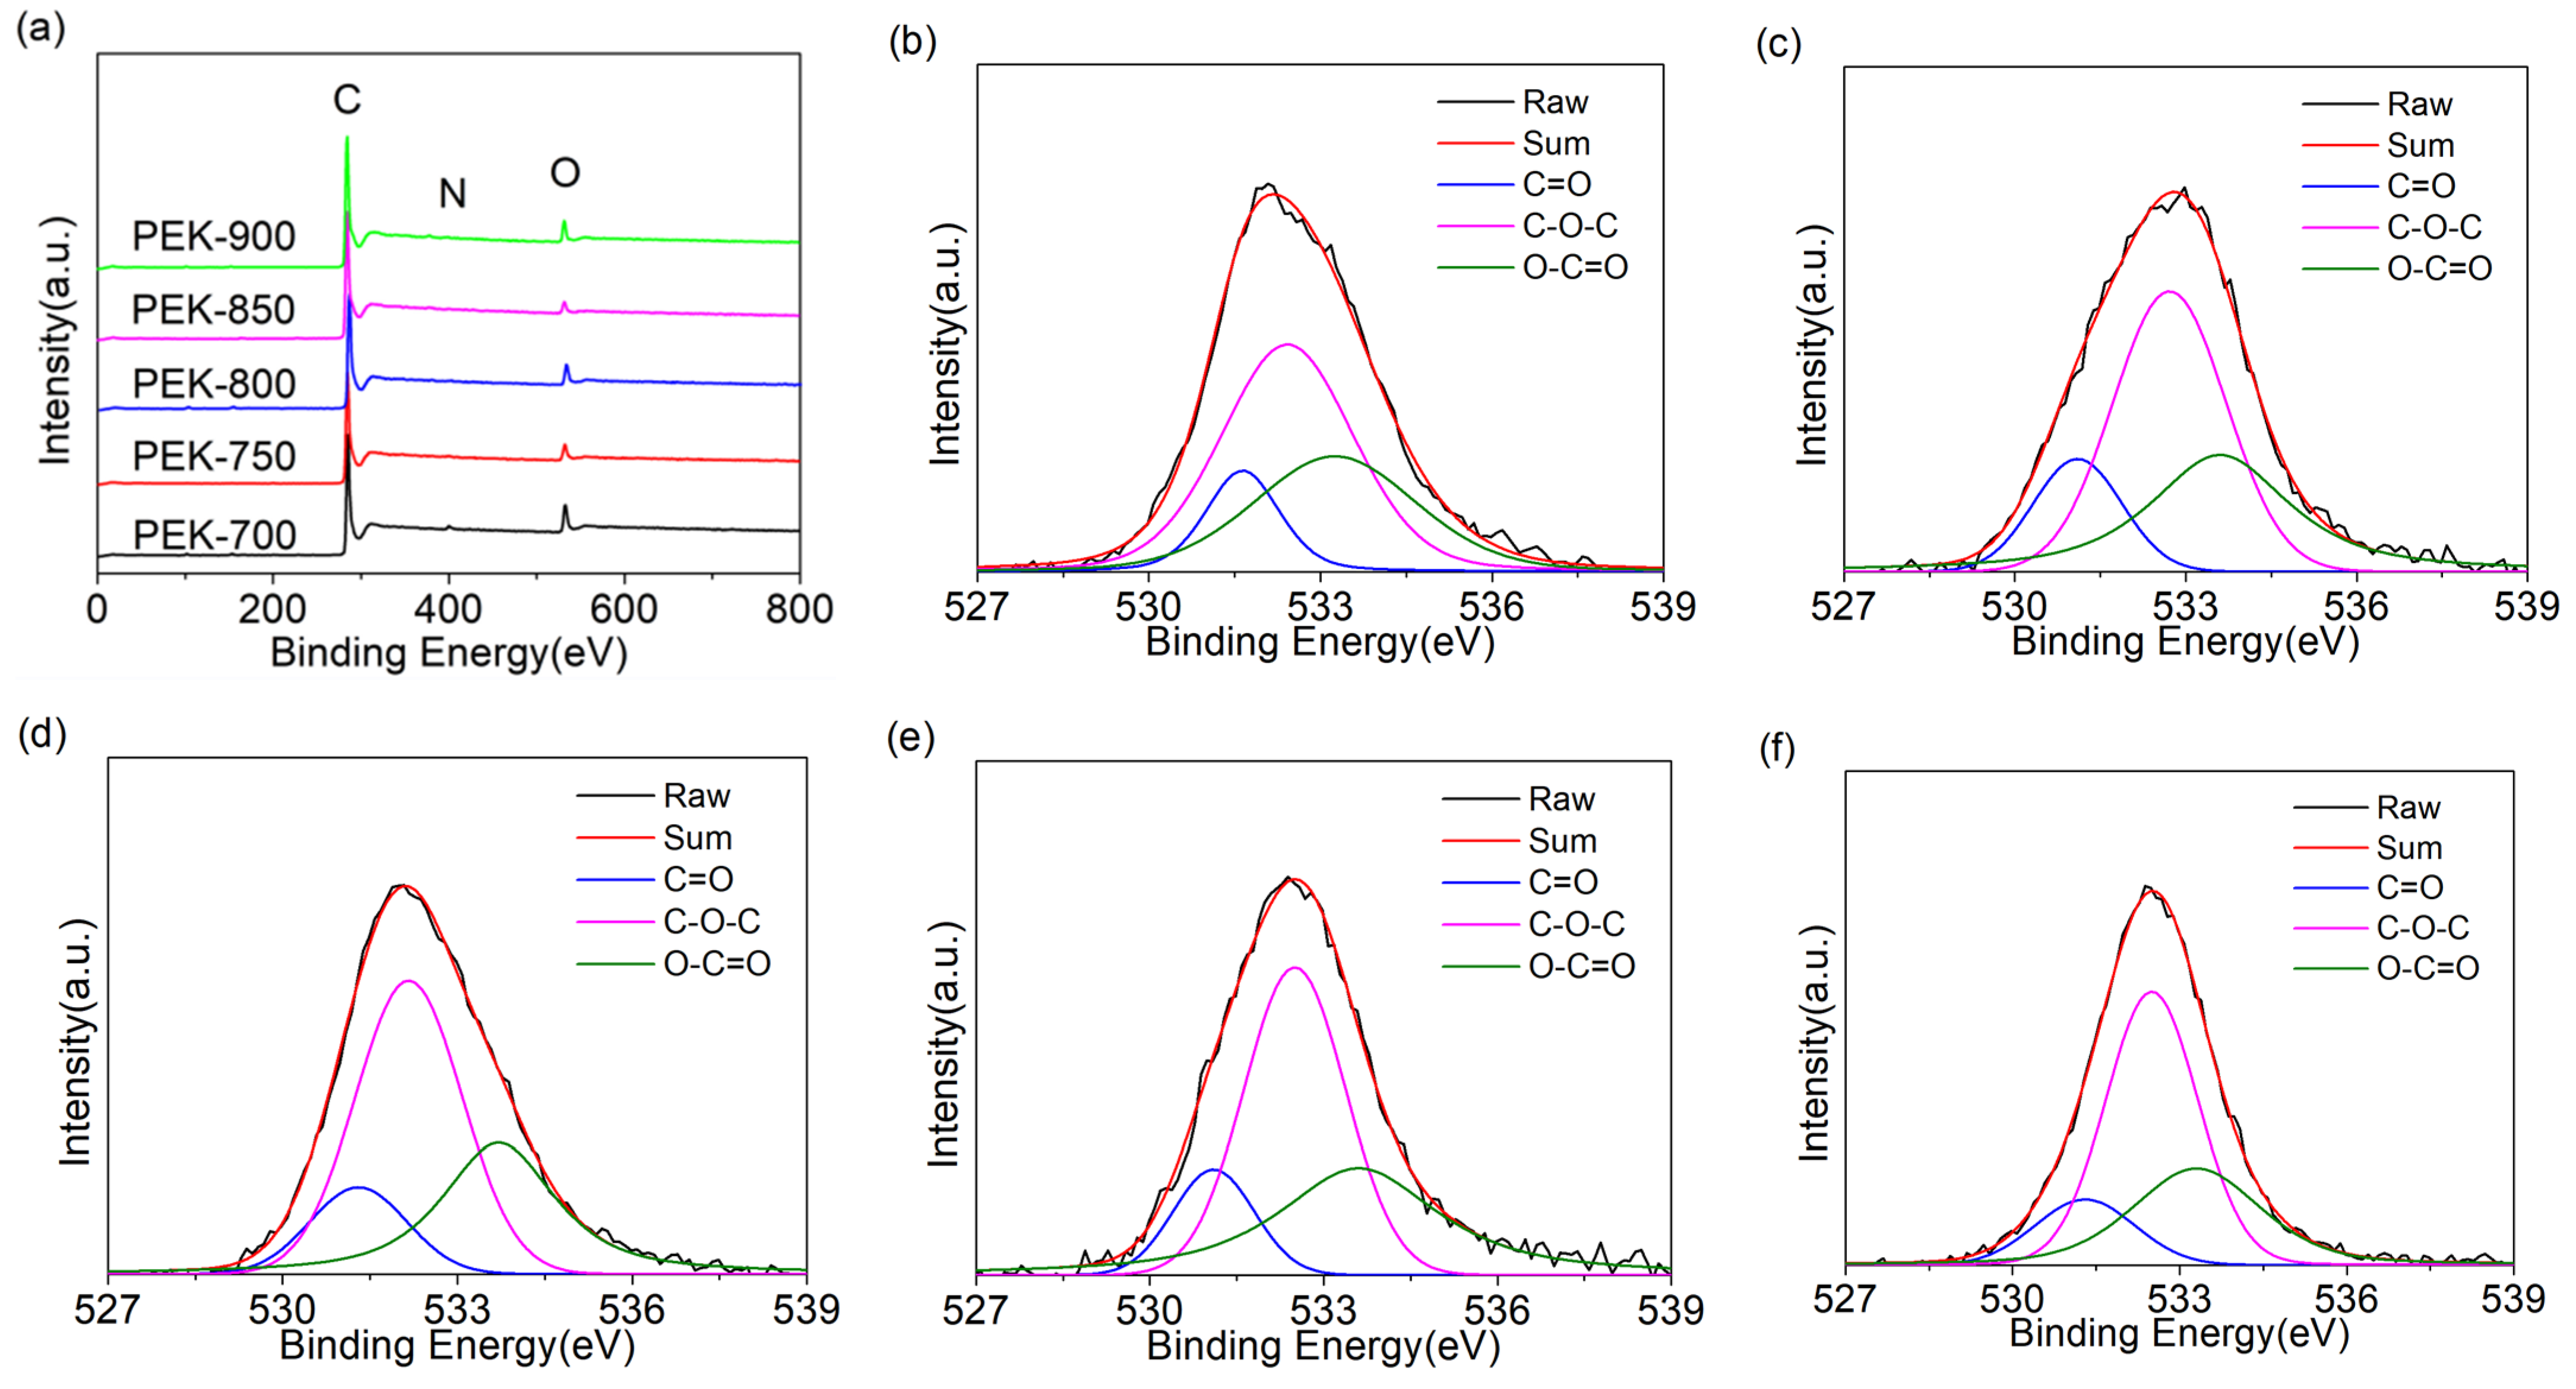
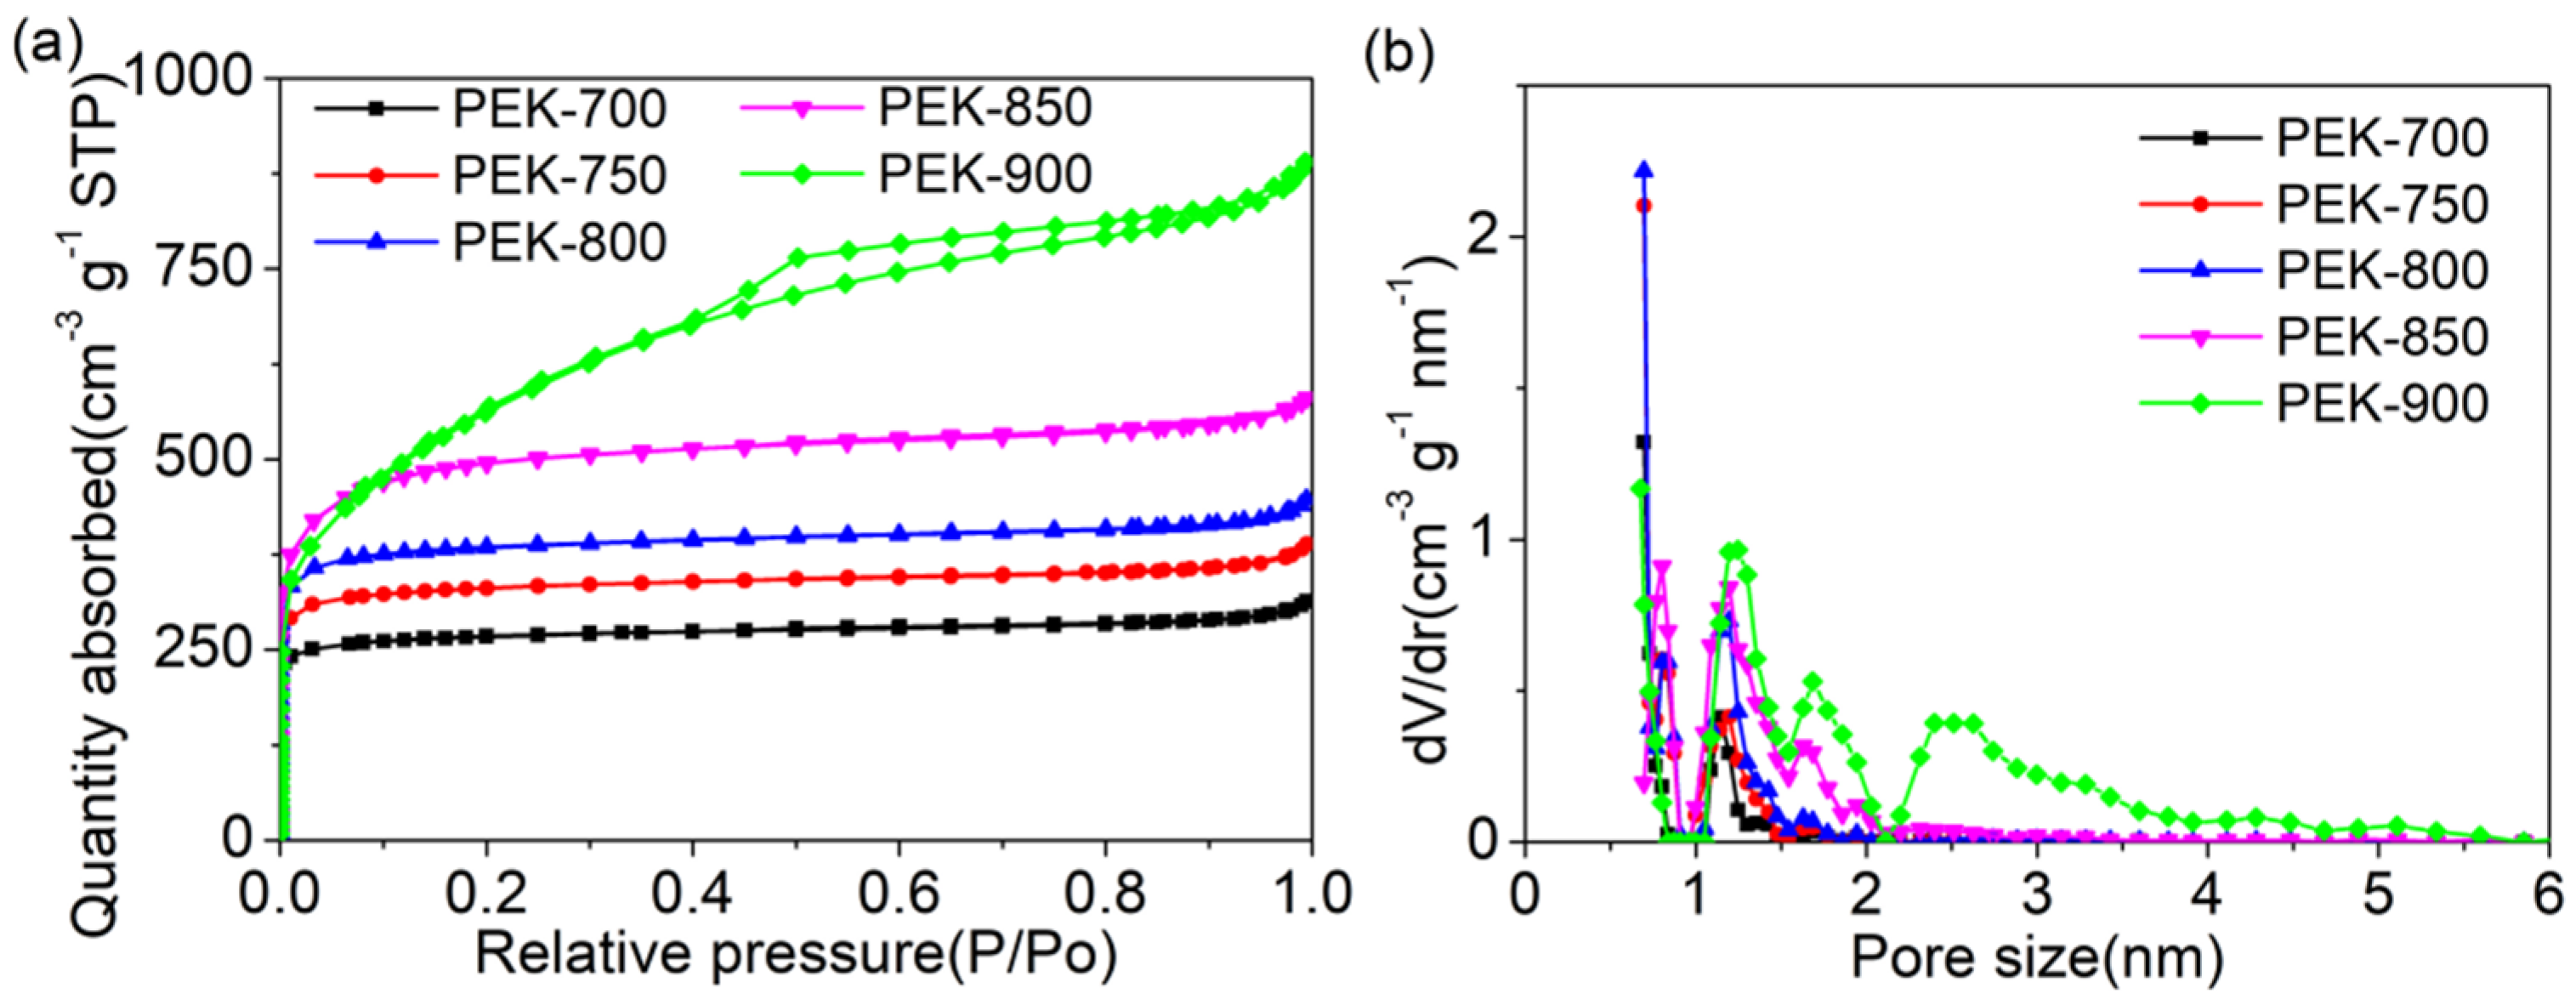
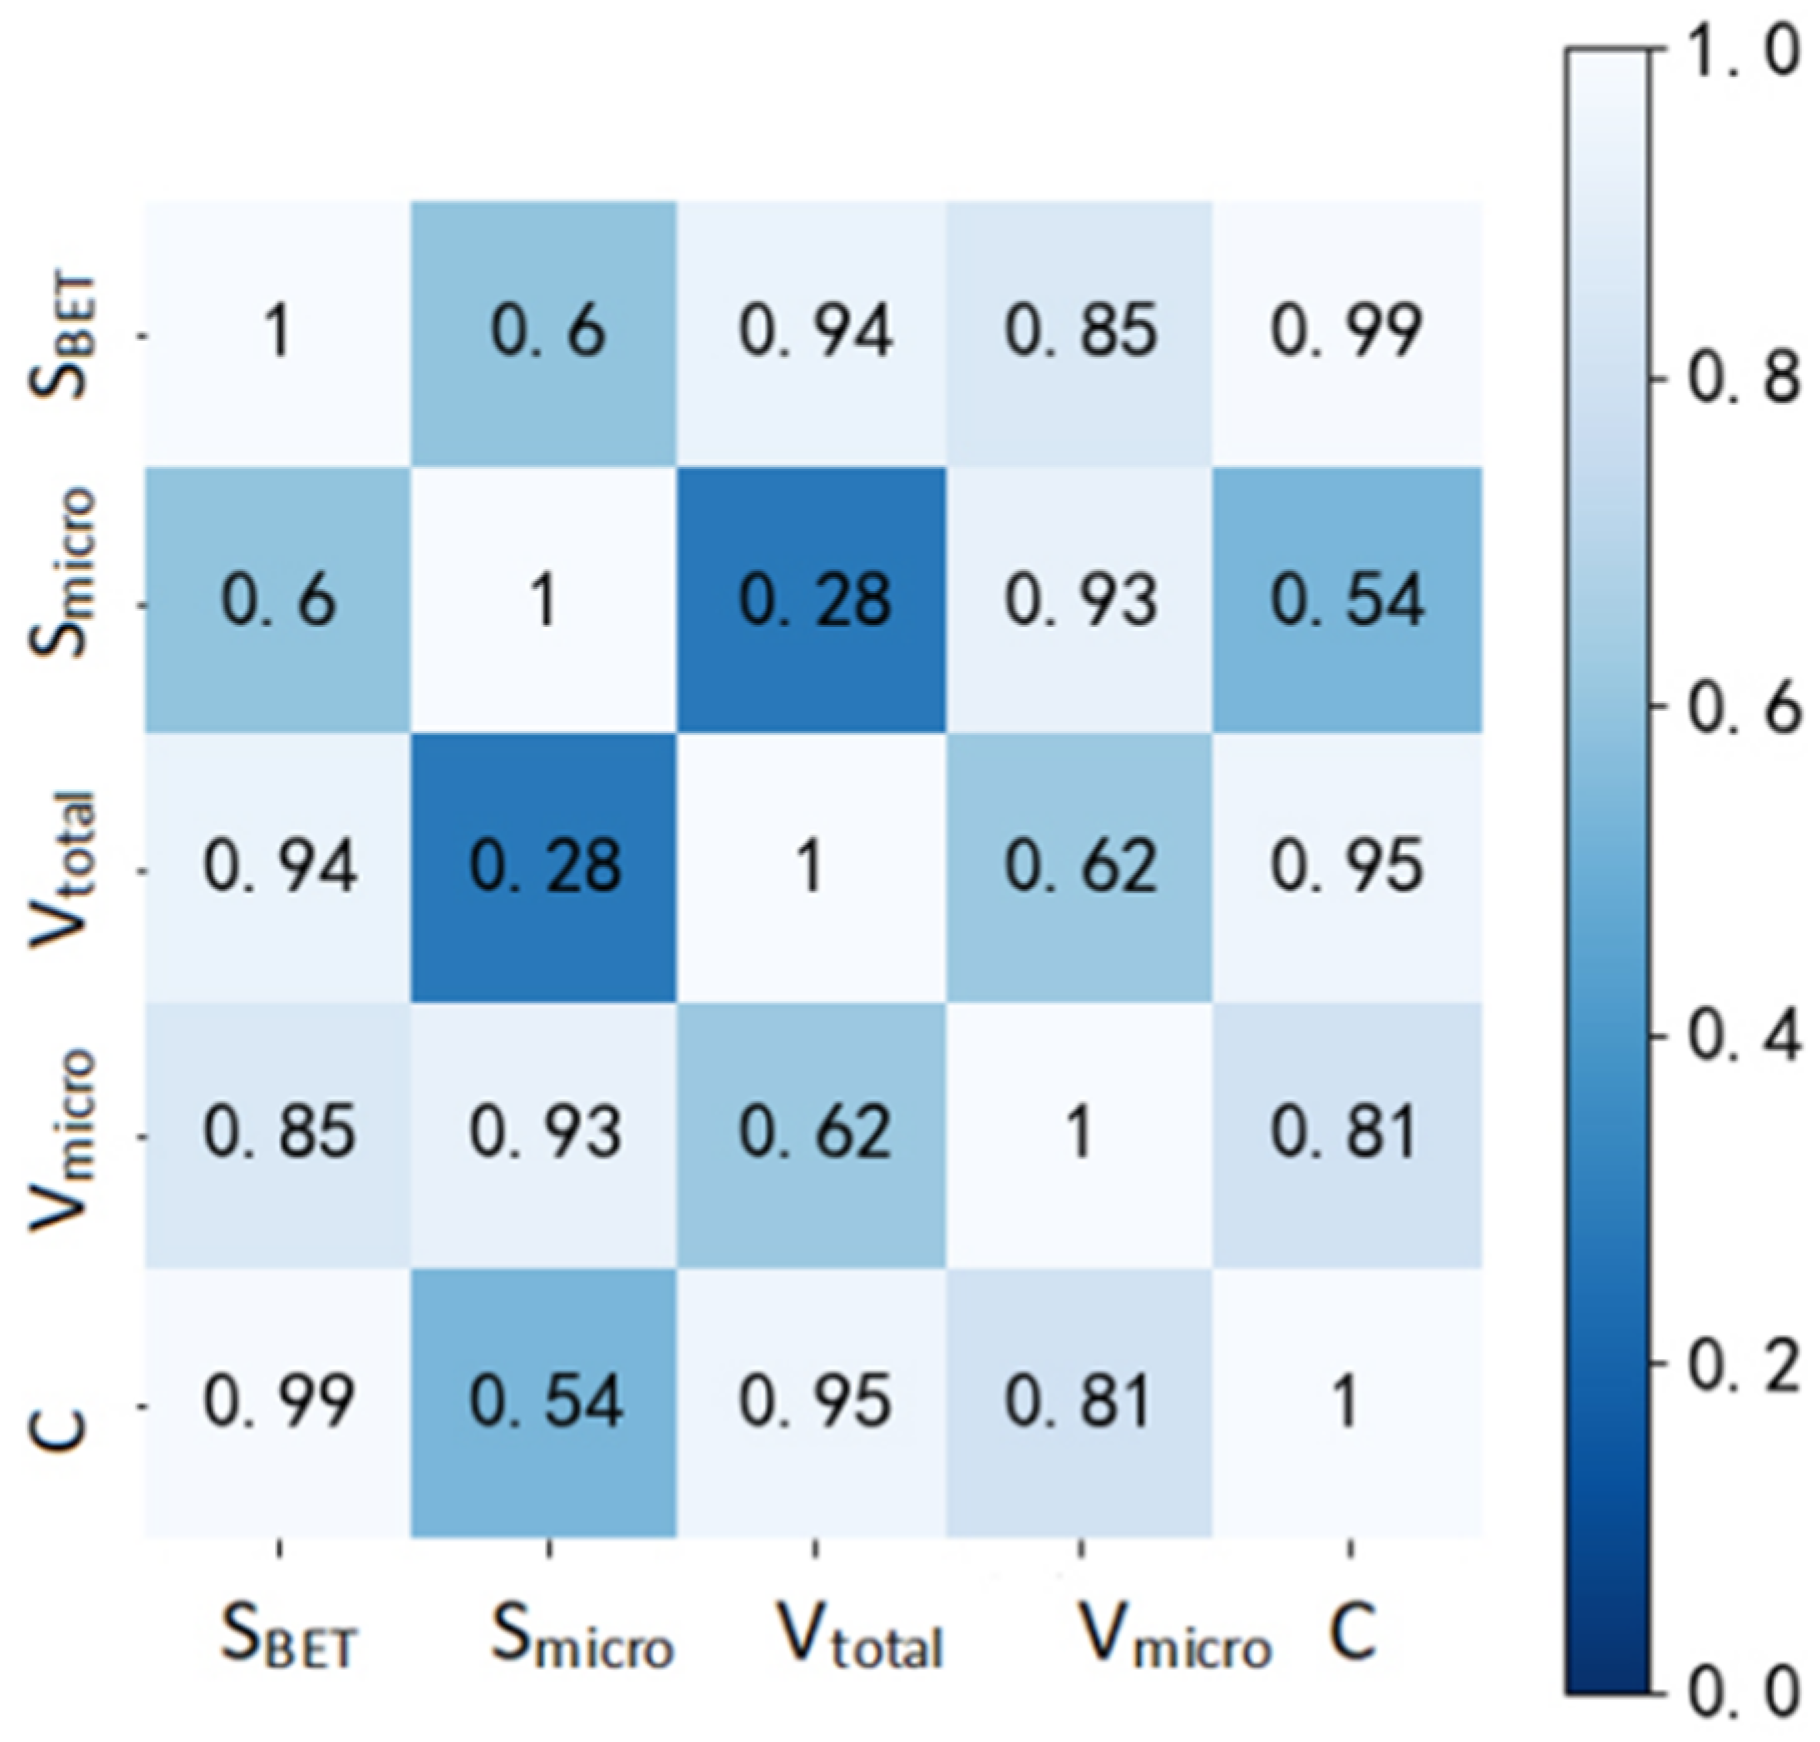
3. Results and Discussion

Figure 1 shows the SEM images of samples at different magnifications. It can be observed that these five samples have similar morphology with macropores above 500 nm formed on the surface, presenting a three-dimensional honeycomb porous structure. These macropores were mainly attributed to the volatile substances in Pleurotus eryngii and CO2, water vapor released by the thermal decomposition of KHCO3. Moreover, the surface of samples became rougher as the activation temperature increased (Figure 1b,d,f,h,j), due to the further activation of KHCO3 at higher temperatures.
The XRD diagram of all samples are displayed in Figure 2a. The two broad diffraction peaks appearing near 25° and 43° correspond to the (002) and (100) crystal planes of graphite, indicating that all samples have amorphous structures [28,29]. Figure 2b shows the Raman spectra of all samples. The two distinct absorption peaks correspond to the D-band and G-band. After peak fitting processing, the relative intensity ratio of D-band to G-band (ID/IG) of PEK-700, PEK-750, PEK-800, PEK-850, and PEK-900 are obtained, which are used to measure the degree of graphitization and defect in carbon materials [22]. Specifically, the ID/IG values of these samples are 2.16, 2.45, 2.56, 2.64, and 3.04, respectively. From the Figure 2, it can be seen that as the activation temperature increases from 700 °C to 900 °C, the intensity of the XRD diffraction peaks gradually decreases, and the value of ID/IG ratio increases, which indicate that the degree of graphitization gradually decreases. This is mainly because the high temperature enhances the activation effect of KHCO3, leading to more pores and defects.
In order to analyze the effect of activation temperature on the surface chemical properties and element content, XPS analysis was conducted on five samples [30,31]. The elemental contents of samples are shown in Table 1. It can be observed that all samples mainly contain carbon and oxygen, as well as a small amount of nitrogen element. In addition, the nitrogen content shows a decreasing trend with the increase of activation temperature. This is because nitrogen-containing functional groups are more easily removed as the temperature increases during the activation process. The full spectrum is shown in Figure 3a, where the two distinct peaks located near 284 eV and 533 eV correspond to C 1s and O 1s, respectively [32]. What is more, a weak peak of N 1s also appeared near 399 eV in the spectrum of PEK-700 [33] (the nitrogen content in other samples is too few to be detected). In order to deeply analyze the binding state of atoms in the samples, the high-resolution O 1s spectra are presented in Figure 3b–f. The O 1s spectra could be well-fitted with three peaks, corresponding to C=O, C-O-C, and O-C=O groups [34,35]. The relative contents of different types of oxygen functional groups are also listed in Table 1. From the table, it can be seen that as the activation temperature increased, the proportions of three groups only fluctuated slightly. It is worth mentioning that in aqueous electrolytes, the C=O group is the main contributor to pseudocapacitance [36]. Moreover, these functional groups not only provide pseudocapacitance, but also improve the hydrophilicity of carbon materials, reduce the contact resistance between carbon materials and electrolytes, thereby improving the conductivity of the materials [37].
To investigate the effect of activation temperature on the pore structure of carbon materials, nitrogen adsorption and desorption tests were applied on all samples. According to Figure 4a, the isotherms of PEK-700, PEK-750, PEK-800, PEK-850 increase sharply in the low-pressure region, while they have almost horizontal plateaus at high-pressure region. Moreover, the higher the activation temperature, the greater the adsorption, implying that the number of micropores increases with elevated temperature [38]. In contrast, the isotherm of PEK-900 shows a typical type IV isotherm with a clear hysteresis loop, implying the existence of abundant micropores and mesopores [39]. Thus, it can be seen that the activation temperature is a key factor affecting the specific surface area and pore size distribution of carbon materials. As shown in Table 2, when the activation temperature increases from 700 °C to 850 °C, the specific surface area of carbon materials increases from 1049.1 m2 g−1 to 1852.0 m2 g−1, while the specific surface area of micropores ranges from 1008.1 to 1759.5 m2 g−1. Combined with pore size distribution (Figure 4b), it can be inferred that more micropores were generated within this temperature range. When the activation temperature further increases to 900 °C, the specific surface area reaches a maximum value of 2002.2 m2 g−1, and the mesopores at 2–6 nm were significantly increased (Figure 4b); however, the specific surface area of micropores reduces from 1759.5 m2 g−1 to 1227.7 m2 g−1. The results indicated that the activation effect of KHCO3 is the strongest at 900 °C, which can effectively promote the increase in pore size.
In order to further find out the effect of activation temperature on the specific surface area of carbon materials, Figure 5 shows the least squares fitting of the relationship between the specific surface area and activation temperature. From this, it can be inferred that the specific surface area of carbon materials is related to the activation energy of the activation reaction, and its relationship can be expressed by Equation (2):
S B E T = S 0 exp E a k T
where SBET is the specific surface area of carbon materials, S0 is the thermodynamic factor, Ea is the activation energy of reaction, k is the Boltzmann’s constant, and T is the thermodynamic temperature.
By calculating the logarithms on both sides of Equation (2), Equation (3) could be obtained as follows:
ln S B E T = ln S 0 E a k T
Substituting the slope of the fitted curve (Figure 5) into Equation (3), it can be calculated that the activation energy is 31.77 kJ mol−1 for the activation reaction. The results showed that the higher the temperature, the higher the energy obtained, and the more intense the activation reaction of KHCO3, resulting in a larger specific surface area. Furthermore, this result has certain guiding significance for formulating experimental plans, and the specific surface area can be inferred from the fitted curve at different activation temperatures.
The CV curves obtained from the three-electrode test is shown in the Figure 6a. All samples exhibit the typical properties of double layer capacitance, as well as some minor distortions indicative of the pseudo capacitance provided by functional groups on the surface of carbon materials. Notably, PEK-900 shows the maximum current response, indicating its ideal double layer capacitance characteristics and maximum specific capacitance. Figure 6b shows the GCD curves of all samples at a current density of 1 A g−1. These five curves all show the shape of an isosceles triangle slightly deviating from the linear symmetry, indicating that there is a small amount of pseudo capacitance in the electrode materials, which is consistent with the results of CV curves. The specific capacitance of PEK-900 is up to 319 F g−1, higher than the 160 F g−1 of PEK-700, 204 F g−1 of PEK-750, 238 F g−1 of PEK-800 and 279 F g−1 of PEK-850. The variation trend of specific capacitance of each sample under different current densities are shown in Figure 6c. Compared to other samples, PEK-900 not only exhibits the maximum specific capacitance, but also maintains 225 F g−1 even when the current density increases to 20 A g−1, with a capacitance retention rate of 70.5%. From the above discussion, it comes down to the fact that the most excellent capacitive characteristics of PEK-900 should mainly ascribe to its 3D hierarchical porous structure which could quickly transfer electrolyte ions into the micropores inside the material, improving the utilization rate of the micropores and enhancing overall capacitance.
In order to further investigate the ion transport process of all samples in electrolyte, EIS testing was conducted, and the results are shown in Figure 6d. In the low-frequency region, the impedance curves are almost orthogonal to the real axis, exhibiting perfect capacitance characteristics. In the high-frequency region, the smallest arc radius of PEK-900 indicates the lowest charge transfer resistance, implying good charge–discharge ability and rate performance.
As is well known, there is a complex relationship between specific capacity and pore structure parameters, which has attracted many scholars to conduct in-depth research. Zhang et al. [24] and Hu et al. [25] obtained a linear relationship between capacitance and specific surface area. In addition, Niu et al. [26] found that the change in specific capacitance is consistent with the trend of the proportion of micropores in the specific surface area. In order to more accurately reveal their relationship, based on the correlation analysis of experimental data, Lasso regression was used to reduce the dimensionality of pore structure parameters, and a binary linear regression model was used to fit the relationship.
Figure 7 is a thermal diagram that employs a color scheme to represent the density or intensity of data, effectively highlighting the correlation between specific capacitance and pore structural parameters. In this figure, the strength of the correlation is indicated by the lightness of the blue color, where a lighter shade signifies a stronger correlation. It can be observed that specific capacitance is positive correlated with SBET, Smicro, Vtotal, and Vmicro. According to the degree of correlation, the order is SBET > Vtotal > Vmicro > Smicro. Meanwhile, the thermal diagram also shows obvious collinearity among the pore structural parameters. For example, the correlation coefficient between SBET and Vtotal is 0.94, indicating the existence of redundancy. The same conclusion can also be drawn from the correlation matrix (Table 3). Therefore, further screening of these parameters is required using Lasso regression.
After Lasso regression, the coefficients of pore structural parameters were obtained as shown in Table 4. The coefficients of Vtotal and Vmicro decrease to 0, leaving coefficients of 0.164 and −0.019 for SBET and Smicro, respectively. Therefore, SBET and Smicro were used as variables for binary linear regression.
Based on the above analysis, the relationship between specific capacitance and pore structural parameters fitted by a binary linear regression model can be expressed as
C = 13.304 + 0.164 S B E T 0.019 S m i c r o
For comparison, a univariate linear regression fitting was performed using SBET as a variable. The fitting results showed that the residual sum of squares (RSS) obtained by the binary linear regression model (124.06) decreased by 38.4% compared to the RSS obtained by the univariate linear regression model (201.30). Figure 8 shows the relationship between the specific capacity and specific surface obtained from the univariate linear regression and binary linear regression (Smicro = 500, 1000 and 1500 m2 g−1). It can be seen that Smicro is an important factor affecting the specific capacitance in addition to SBET. The use of binary linear regression can more accurately reflect the relationship between pore structural parameters and specific capacitance, providing a simple and reliable theoretical method for predicting the capacitance performance of biomass carbon materials.
In order to further evaluate the practical commercial application prospects of PEK-900, two electrode tests were conducted using PEK-900 as positive and negative electrodes, and 6 M KOH as electrolyte to assemble capacitors. Figure 9a shows the CV curves of the supercapacitor operated in different voltage ranges at a scanning rate of 50 mV s−1. When the voltage increases from 1.2 to 1.3 V, the current significantly increases and the rectangle undergoes severe deformation. Therefore, 0–1.2 V is used as the operating voltage window for the PEK-900//PEK-900 supercapacitor.
Figure 9b shows the CV curves of the supercapacitor at a scanning rate of 5–100 mV s−1. All curves exhibit a nearly rectangular shape, especially without significant deformation at 100 mV s−1, indicating that the supercapacitor has fast I–V response characteristics and fast charging and discharging capabilities. The GCD curve of the capacitor at a current density of 0.5–20 A g−1 is shown in Figure 9c, and all curves exhibit good symmetry. The specific capacity and its variation trend are shown in Figure 9d. At current densities of 0.5, 1, 2, 5, 10, and 20 A g−1, the specific capacities are 258, 229, 218, 205, 192, and 174 F g−1, respectively, exhibiting good rate performance (67.4%).
Cycle life test (CLT) was applied to study the long-term cycling stability of the supercapacitor. As shown in Figure 9e, after 10,000 cycles charging and discharging at a current density of 4 A g−1, the specific capacitance of the supercapacitor increased by 10%. From the illustrations in Figure 9e, it can be seen that there was a significant improvement in charge and discharge time in the first 2500 cycles, while the charge and discharge curves basically overlapped in the 2500, 5000, and 10,000 cycles. It is not difficult to speculate that the first 2500 cycles of charge and discharge improve the wettability of the electrode material, making it easier for electrolyte ions to penetrate deeper into the electrode material, thus forming more double layer capacitors. In the subsequent cycles, it tends to stabilize, demonstrating excellent cycle stability.

4. Conclusions

In summary, hierarchical porous activated carbon derived from pleurotus eryngii was prepared by a one-step activation method. By adjusting the activation temperature (700–900 °C), it was found that the specific surface area of the obtained sample increased with the increase of activation temperature. Among them, the sample activated at 900 °C has a specific surface area of 2002.2 m2 g−1 and the highest specific capacitance (319 F g−1), which is mainly attributed to the high utilization rate of specific surface area brought by the hierarchical porous structure. The assembled PEK-900//PEK-900 capacitor measured a specific capacity of 258 F g−1 at a current density of 0.5 A g−1. After 10,000 cycles of charging and discharging, the specific capacitance increased by 10%. Based on the correlation analysis of experimental data between the specific capacitance and pore structure parameters, Lasso dimensionality reduction and binary linear regression were used to reveal the relationship between the two. The residual sum of squares obtained by this method decreased by 38.4% compared to the univariate linear regression, providing a simple and reliable theoretical method for predicting the capacitance performance of biomass carbon materials.

Author Contributions

Conceptualization, Y.Y.; data curation, Y.S.; formal analysis, Y.Y.; investigation, Y.S.; methodology, Y.Y.; project administration, L.Y. and C.Z.; supervision, L.Y. and C.Z.; validation, C.L.; writing—original draft, Y.Y.; writing—review and editing, Y.Y. All authors have read and agreed to the published version of the manuscript.

Funding

This work was supported by the Starting Research Fund from the Suzhou Vocational Institute of Industrial Technology (2023kyqd001), the Suzhou Science and Technology Development Planning Programme (SYC2022101), the BAOSHENG (Suzhou) industrial cooperative fund (RDS10120220070), and the XJTLU Research Development Funding (RDF-21-01-040).

Institutional Review Board Statement

Not applicable.

Informed Consent Statement

Not applicable.

Data Availability Statement

The data presented in this study are not available due to privacy.

Conflicts of Interest

The authors declare no conflicts of interest.

References

  1. Ai, J.; Yang, S.; Sun, Y.; Liu, M.; Zhang, L.; Zhao, D.; Wang, J.; Yang, C.; Wang, X.; Cao, B. Corncob cellulose-derived hierarchical porous carbon for high performance supercapacitors. J. Power Sources 2021, 484, 229221. [Google Scholar] [CrossRef]
  2. Tai, C.-W.; Lu, Y.-T.; Yi, T.-Y.; Liu, Y.-C.; Chen, Y.-S.; Hu, C.-C. A Comprehensive Study on the Interactive Effects of Carbon Crystallinity and Electrochemical Activation for KOH-Modified Soft Carbons and Their High-Voltage Supercapacitor Application. J. Electrochem. Soc. 2023, 170, 040526. [Google Scholar] [CrossRef]
  3. Yu, J.; Wang, X.; Peng, J.; Jia, X.; Li, L.; Chuan, X. Porous Activity of Biomass-Activated Carbon Enhanced by Nitrogen-Dopant Towards High-Performance Lithium Ion Hybrid Battery-Supercapacitor. J. Electrochem. Soc. 2021, 168, 120537. [Google Scholar] [CrossRef]
  4. Zhao, C.; Ding, Y.; Huang, Y.; Li, N.; Hu, Y.; Zhao, C. Soybean root-derived N, O co-doped hierarchical porous carbon for supercapacitors. Appl. Surf. Sci. 2021, 555, 149726. [Google Scholar] [CrossRef]
  5. Liu, J.; Min, S.; Wang, F.; Zhang, Z. High-Performance Aqueous Supercapacitors Based on Biomass-Derived Multiheteroatom Self-Doped Porous Carbon Membranes. Energy Technol. 2020, 8, 2000391. [Google Scholar] [CrossRef]
  6. Ebrahimi, M.; Hosseini-Monfared, H.; Javanbakht, M.; Mahdi, F. Biomass-derived nanostructured carbon materials for high-performance supercapacitor electrodes. Biomass Convers. Biorefinery 2023. [Google Scholar] [CrossRef]
  7. Singh, A.; Ojha, A.K. Orange peel derived activated carbon for supercapacitor electrode material. J. Mater. Sci. Mater. Electron. 2023, 34, 1003. [Google Scholar] [CrossRef]
  8. Tian, X.; Ma, H.; Li, Z.; Yan, S.; Ma, L.; Yu, F.; Wang, G.; Guo, X.; Ma, Y.; Wong, C. Flute type micropores activated carbon from cotton stalk for high performance supercapacitors. J. Power Sources 2017, 359, 88–96. [Google Scholar] [CrossRef]
  9. Tan, Z.; Yang, J.; Liang, Y.; Zheng, M.; Hu, H.; Dong, H.; Liu, Y.; Xiao, Y. The changing structure by component: Biomass-based porous carbon for high-performance supercapacitors. J. Colloid Interface Sci. 2021, 585, 778–786. [Google Scholar] [CrossRef]
  10. Su, X.-L.; Cheng, M.-Y.; Fu, L.; Yang, J.-H.; Zheng, X.-C.; Guan, X.-X. Superior supercapacitive performance of hollow activated carbon nanomesh with hierarchical structure derived from poplar catkins. J. Power Sources 2017, 362, 27–38. [Google Scholar] [CrossRef]
  11. Shang, M.; Zhang, J.; Liu, X.; Liu, Y.; Guo, S.; Yu, S.; Filatov, S.; Yi, X. N, S self-doped hollow-sphere porous carbon derived from puffball spores for high performance supercapacitors. Appl. Surf. Sci. 2021, 542, 148697. [Google Scholar] [CrossRef]
  12. Cuong, D.V.; Wu, P.-C.; Liu, N.-L.; Hou, C.-H. Hierarchical porous carbon derived from activated biochar as an eco-friendly electrode for the electrosorption of inorganic ions. Sep. Purif. Technol. 2020, 242, 116813. [Google Scholar] [CrossRef]
  13. Pourjavadi, A.; Abdolmaleki, H.; Doroudian, M.; Hosseini, S.H. Novel synthesis route for preparation of porous nitrogen-doped carbons from lignocellulosic wastes for high performance supercapacitors. J. Alloys Compd. 2020, 827, 154116. [Google Scholar] [CrossRef]
  14. Yao, L.; Yang, G.; Han, P.; Tang, Z.; Yang, J. Three-dimensional beehive-like hierarchical porous polyacrylonitrile-based carbons as a high performance supercapacitor electrodes. J. Power Sources 2016, 315, 209–217. [Google Scholar] [CrossRef]
  15. Gong, J.; Liu, J.; Chen, X.; Jiang, Z.; Wen, X.; Mijowska, E.; Tang, T. Converting real-world mixed waste plastics into porous carbon nanosheets with excellent performance in the adsorption of an organic dye from wastewater. J. Mater. Chem. A 2015, 3, 341–351. [Google Scholar] [CrossRef]
  16. Gong, J.; Michalkiewicz, B.; Chen, X.; Mijowska, E.; Liu, J.; Jiang, Z.; Wen, X.; Tang, T. Sustainable Conversion of Mixed Plastics into Porous Carbon Nanosheets with High Performances in Uptake of Carbon Dioxide and Storage of Hydrogen. ACS Sustain. Chem. Eng. 2014, 2, 2837–2844. [Google Scholar] [CrossRef]
  17. Liang, J.; Qu, T.; Kun, X.; Zhang, Y.; Chen, S.; Cao, Y.-C.; Xie, M.; Guo, X. Microwave assisted synthesis of camellia oleifera shell-derived porous carbon with rich oxygen functionalities and superior supercapacitor performance. Appl. Surf. Sci. 2018, 436, 934–940. [Google Scholar] [CrossRef]
  18. Luo, L.; Zhou, Y.; Yan, W.; Wu, X.; Wang, S.; Zhao, W. Two-step synthesis of B and N co-doped porous carbon composites by microwave-assisted hydrothermal and pyrolysis process for supercapacitor application. Electrochim. Acta 2020, 360, 137010. [Google Scholar] [CrossRef]
  19. Guo, M.; Guo, J.; Tong, F.; Jia, D.; Jia, W.; Wu, J.; Wang, L.; Sun, Z. Hierarchical porous carbon spheres constructed from coal as electrode materials for high performance supercapacitors. RSC Adv. 2017, 7, 45363–45368. [Google Scholar] [CrossRef]
  20. Song, Y.; Li, W.; Xu, Z.; Ma, C.; Liu, Y.; Xu, M.; Wu, X.; Liu, S. Hierarchical porous carbon spheres derived from larch sawdust via spray pyrolysis and soft-templating method for supercapacitors. SN Appl. Sci. 2018, 1, 122. [Google Scholar] [CrossRef]
  21. Wang, H.; Yang, L.; Liu, G.; Li, M. Tobacco-Stem-Derived Nitrogen-Enriched Hierarchical Porous Carbon for High-Energy Supercapacitor. ChemistrySelect 2021, 6, 532–537. [Google Scholar] [CrossRef]
  22. Hong, P.; Liu, X.; Zhang, X.; Peng, S.; Wang, Z.; Yang, Y.; Zhao, R.; Wang, Y. Hierarchically porous carbon derived from the activation of waste chestnut shells by potassium bicarbonate (KHCO3) for high-performance supercapacitor electrode. Int. J. Energy Res. 2019, 44, 988–999. [Google Scholar] [CrossRef]
  23. Yuan, Y.; Sun, Y.; Feng, Z.; Li, X.; Yi, R.; Sun, W.; Zhao, C.; Yang, L. Nitrogen-Doped Hierarchical Porous Activated Carbon Derived from Paddy for High-Performance Supercapacitors. Materials 2021, 14, 318. [Google Scholar] [CrossRef]
  24. Zhang, L.; Yang, X.; Zhang, F.; Long, G.; Zhang, T.; Leng, K.; Zhang, Y.; Huang, Y.; Ma, Y.; Zhang, M.; et al. Controlling the effective surface area and pore size distribution of sp2 carbon materials and their impact on the capacitance performance of these materials. J. Am. Chem. Soc. 2013, 135, 5921–5929. [Google Scholar] [CrossRef] [PubMed]
  25. Hu, B.; Kong, L.-B.; Kang, L.; Yan, K.; Zhang, T.; Li, K.; Luo, Y.-C. Synthesis of a hierarchical nanoporous carbon material with controllable pore size and effective surface area for high-performance electrochemical capacitors. RSC Adv. 2017, 7, 14516–14527. [Google Scholar] [CrossRef]
  26. Niu, L.; Shen, C.; Yan, L.; Zhang, J.; Lin, Y.; Gong, Y.; Li, C.; Sun, C.Q.; Xu, S. Waste bones derived nitrogen-doped carbon with high micropore ratio towards supercapacitor applications. J. Colloid Interface Sci. 2019, 547, 92–101. [Google Scholar] [CrossRef] [PubMed]
  27. Yuan, Y.; Sun, Y.; Liu, C.; Yang, L.; Zhao, C. Influence of KHCO3 Activation on Characteristics of Biomass-Derived Carbons for Supercapacitor. Coatings 2023, 13, 1236. [Google Scholar] [CrossRef]
  28. Wang, B.; Zhang, X.; Zhou, J.; Wang, X.; Xu, J.; Tan, F. Nitrogen-doped lignin-derived electrode materials for supercapacitors were prepared using the domain-limited effect. Int. J. Biol. Macromol. 2024, 265 Pt 2, 130796. [Google Scholar] [CrossRef] [PubMed]
  29. Zhai, Z.; Wang, S.; Xu, Y.; Zhang, L.; Wang, X.; Yu, H.; Ren, B. Starch-based carbon aerogels prepared by an innovative KOH activation method for supercapacitors. Int. J. Biol. Macromol. 2024, 257 Pt 1, 128587. [Google Scholar] [CrossRef]
  30. Guo, C.; Tao, C.; Yu, F.; Zhao, Z.; Wang, Z.; Deng, N.; Huang, X. Ball-milled layer double hydroxide as persulfate activator for efficient degradation of organic: Alkaline sites-triggered non-radical mechanism. J. Hazard. Mater. 2024, 461, 132219. [Google Scholar] [CrossRef]
  31. Kang, L.; Liu, S.; Zhang, Q.; Zou, J.; Ai, J.; Qiao, D.; Zhong, W.; Liu, Y.; Jun, S.C.; Yamauchi, Y.; et al. Hierarchical Spatial Confinement Unlocking the Storage Limit of MoS2 for Flexible High-Energy Supercapacitors. ACS Nano 2024, 18, 2149–2161. [Google Scholar] [CrossRef] [PubMed]
  32. Feng, W.; He, P.; Ding, S.; Zhang, G.; He, M.; Dong, F.; Wen, J.; Du, L.; Liu, M. Oxygen-doped activated carbons derived from three kinds of biomass: Preparation, characterization and performance as electrode materials for supercapacitors. RSC Adv. 2016, 6, 5949–5956. [Google Scholar] [CrossRef]
  33. Zhao, Y.; Chen, P.; Tao, S.; Zu, X.; Li, S.; Qiao, L. Nitrogen/oxygen co-doped carbon nanofoam derived from bamboo fungi for high-performance supercapacitors. J. Power Sources 2020, 479, 228835. [Google Scholar] [CrossRef]
  34. Sun, Z.; Masa, J.; Weide, P.; Fairclough, S.M.; Robertson, A.W.; Ebbinghaus, P.; Warner, J.H.; Tsang, S.C.E.; Muhler, M.; Schuhmann, W. High-quality functionalized few-layer graphene: Facile fabrication and doping with nitrogen as a metal-free catalyst for the oxygen reduction reaction. J. Mater. Chem. A 2015, 3, 15444–15450. [Google Scholar] [CrossRef]
  35. Tao, H.; Yan, C.; Robertson, A.W.; Gao, Y.; Ding, J.; Zhang, Y.; Ma, T.; Sun, Z. N-Doping of graphene oxide at low temperature for the oxygen reduction reaction. Chem. Commun. 2017, 53, 873–876. [Google Scholar] [CrossRef]
  36. Fang, Y.; Luo, B.; Jia, Y.; Li, X.; Wang, B.; Song, Q.; Kang, F.; Zhi, L. Renewing Functionalized Graphene as Electrodes for High-Performance Supercapacitors. Adv. Mater. 2012, 24, 6348–6355. [Google Scholar] [CrossRef] [PubMed]
  37. Zhao, Z.; Wang, Y.; Li, M.; Yang, R. High performance N-doped porous activated carbon based on chicken feather for supercapacitors and CO2 capture. RSC Adv. 2015, 5, 34803–34811. [Google Scholar] [CrossRef]
  38. Fechler, N.; Fellinger, T.P.; Antonietti, M. “Salt templating”: A simple and sustainable pathway toward highly porous functional carbons from ionic liquids. Adv. Mater. 2013, 25, 75–79. [Google Scholar] [CrossRef]
  39. Wu, J.; Ma, Z.; Wang, G.; Chen, T. Biomass Porous Carbon Derived from Celery Leaves with High Capacitance for Supercapacitor. ChemistrySelect 2023, 8, e202204616. [Google Scholar] [CrossRef]
Figure 1. SEM images magnified by 20 K: (a) PEK-700, (c) PEK-750, (e) PEK-800, (g) PEK-850, (i) PEK-900, and 100 K magnification of (b) PEK-700, (d) PEK-750, (f) PEK-800, (h) PEK-850, (j) PEK-900.
Coatings 14 00840 g001
Figure 2. (a) XRD patterns, and (b) Raman spectrums of PEK-700, PEK-750, PEK-800, PEK-850 and PEK-900.
Coatings 14 00840 g002
Figure 3. (a) Full XPS spectra of all samples, and O 1s spectra of (b) PEK-700, (c) PEK-750, (d) PEK-800, (e) PEK-850, and (f) PEK-900.
Coatings 14 00840 g003
Figure 4. (a) Nitrogen absorption–desorption isotherms, (b) the pore size distribution curves of all samples.
Coatings 14 00840 g004
Figure 5. The least squares fitting of the relationship between the specific surface area and activation temperature.
Coatings 14 00840 g005
Figure 6. The electrochemical properties in a three-electrode system: (a) the CV curves at 50 mV s−1; (b) the GCD curves at 1 A g−1; (c) the specific capacitances from 1~20 A g−1; (d) the Nyquist plots of all samples.
Coatings 14 00840 g006aCoatings 14 00840 g006b
Figure 7. The thermal diagram of correlation.
Coatings 14 00840 g007
Figure 8. The relationship between the specific capacitance and specific surface obtained from binary linear regression model (Smicro = 500, 1000 and 1500 m2 g−1) versus univariate linear regression.
Coatings 14 00840 g008
Figure 9. Electrochemical performance of PEK-900//PEK-900 supercapacitors: (a) CV curve of 1–1.4 V; (b) CV curves with different scanning rate; (c) GCD curves; (d) trend chart of specific capacity change; (e) CLT curves, illustrated as GCD curves for cycles 1, 2500, 5000, and 10,000.
Coatings 14 00840 g009
Table 1. Surface element composition and relative contents of functional group in O 1s from XPS spectra of PEK samples.
SamplesC (Atom%)O (Atom%)N (Atom%)C=O (%)C-O-C (%)O-C=O (%)
PEK-70089.278.692.0413.8152.7233.47
PEK-75092.895.711.415.7449.8334.43
PEK-80091.876.871.2614.1452.4933.37
PEK-85095.133.940.9313.5249.2837.20
PEK-90093.015.91.0914.0354.9531.02
Table 2. The pore structural parameters of all samples prepared at different activation temperatures.
SamplesSBET (m2 g−1)Smicro (m2 g−1)Vtotal (cm3 g−1)Vmicro (cm3 g−1)
PEK-7001049.11008.10.48530.4001
PEK-7501270.71229.00.60060.5024
PEK-8001502.41440.90.69200.5751
PEK-8501852.01759.50.89810.7426
PEK-9002002.21227.71.29630.6036
Table 3. Pearson correlation coefficient matrix.
SBETSmicroVtotalVmicroC
SBET1.000.600.940.850.99
Smicro0.601.000.280.930.54
Vtotal0.940.281.000.620.95
Vmicro0.850.930.621.000.81
C0.990.540.950.811.00
Table 4. Coefficients of pore structural parameters.
ParametersSBETSmicroVtotalVmicro
Coefficients0.164−0.01900
Disclaimer/Publisher’s Note: The statements, opinions and data contained in all publications are solely those of the individual author(s) and contributor(s) and not of MDPI and/or the editor(s). MDPI and/or the editor(s) disclaim responsibility for any injury to people or property resulting from any ideas, methods, instructions or products referred to in the content.

