Article

Fatigue Damage in Asphalt Pavement Based on Axle Load Spectrum and Seasonal Temperature

1
Shandong Hi-Speed Group Co., Ltd., Jinan 250098, China
2
Shandong Transportation Institute, Jinan 250102, China
3
Shandong Hi-Speed Information Group Co., Ltd., Jinan 250102, China
*
Author to whom correspondence should be addressed.
Coatings 2024, 14(7), 882; https://doi.org/10.3390/coatings14070882
Submission received: 12 June 2024 / Revised: 8 July 2024 / Accepted: 10 July 2024 / Published: 15 July 2024
(This article belongs to the Section Environmental Aspects in Colloid and Interface Science)

Abstract

:
In asphalt pavement structure design, traffic axle loads and pavement layer temperatures are crucial factors affecting fatigue damage calculations. To investigate the differences in fatigue damage calculations caused by different characterizations of traffic axle loads and temperature, fatigue damage calculations were conducted under equivalent standard axle loads (ESALs), axle load spectra (ALS), constant temperatures, and seasonal temperature variations using the field data from an expressway in Shandong Province, China under seven calculation plans. The results indicated: (1) the annual traffic composition is dominated by vehicle Type 9, with a proportion of about 43% in all the vehicle types, and its load level is also high, with a proportion about of 80% in the heavy load interval at all axle types; (2) The ESALs method underestimates the actual fatigue damage incurred in asphalt pavement by 6.04 times, with an accumulated damage of 2.34 × 10⁻⁹ (ESALs), 1.69 × 10⁻⁸ (ALS), respectively; (3) The fatigue damage results from a single month with consistent temperature showed similar trends, with an accumulated damage of 1.50 × 10⁻⁵, 9.07 × 10⁻⁵, respectively; (4) The cumulative fatigue damage calculated using the ALS method across the four seasons, respectively, is 6.51, 5.88, 6.42, and 4.60 times that of the fatigue damage calculated using the ESALs method. Although the ratio of fatigue damage between the two characterizations of traffic axle loads remains consistent, which is 6.04, the fatigue damage calculation that accounts for temperature variations can reveal seasonal trends in fatigue damage development. Based on the axle load spectra and considering temperature variations, fatigue damage calculation will be more closely related to the actual service state of asphalt pavement. These research findings provide insights for estimating asphalt pavement fatigue damage to some extent.

1. Introduction

Fatigue life refers to the time or number of cycles that a material or structure withstands cyclic loads from an intact state until failure [1,2]. Among the factors contributing to the reduction in the asphalt pavement fatigue life, traffic axle loads play a significant role [3]. Although the wheel load duration on a specific location of asphalt pavement is brief, as vehicles pass over it, the cumulative exposure time during the pavement’s service life is substantial. Consequently, the coupling effect of cyclic variations in pavement structure temperature and different vehicle loads further reduces pavement fatigue life [4]. The tires at both ends of a vehicle axle transmit the load to the ground, and the weight borne by each axle or axle group is termed the axle load [5]. Different vehicle types, tonnages, and cargo placement locations result in varying levels of axle loads [6].
Hveem et al. have highlighted the direct relationship between traffic volume, pavement deformation, and asphalt pavement fatigue failure [7]. The French large-scale ring road test involved conducting accelerated loading tests, studying the permanent deformation of the road surface under each axle load interval, and proposing the regression formula [8]. In the AASHTO 2002 design method for the asphalt pavement structure used in the United States, damage is considered one of the primary control indicators [9]. Marín et al. applied predictive axle load spectra and the Miner rule to analyze asphalt pavement fatigue damage, revealing that thick asphalt layers in semi-rigid base pavement structures exhibit significantly better fatigue performance than ordinary semi-rigid base pavement structures [10]. Prowell conducted research using small beam fatigue tests and fatigue design mechanisms for pavement structures to estimate asphalt pavement fatigue life [11]. Researcher Ni Fujian from China Southeast University analyzed high-grade asphalt pavement under various axle loads using finite element models, and found that the differences in asphalt layer structure (mixture type, layer position, surface layer thickness), structural layer temperature, and vehicle action time have a significant impact on the axle load conversion index [12]. Bai Bing employed fatigue fracture methods, axle load conversion techniques, and finite element analysis to analyze stress and fatigue life in asphalt pavement, predicting the cumulative equivalent axle load cycles and assessing the impact of traffic load on pavement service life [13].
Several studies have focused on researching the fatigue behavior of asphalt pavement, developing fatigue life equations using indicators such as the damage factor, which is composed of tensile stress and compressive stress amplitudes, and the tension strain at the bottom of the asphalt layer [14,15]. Other research has focused on deriving conversion coefficients for equivalent axle loads [16]. Wang Baoliang studied the fatigue behavior of asphalt pavement under axle load and proposed a method to obtain the expression of the stress field formula for asphalt pavement under this condition. After studying its characteristics, he pointed out that the damage factor is a stress amplitude composed of tensile stress and compressive stress, which can reflect the fatigue condition of the pavement, and evaluated the fatigue life of asphalt pavement based on the fatigue factor [14]. Based on the theory of cumulative fatigue damage, Xu Jianping et al. used the tensile strain at the bottom of the asphalt fatigue layer as the control index, considered the temperature of different structural layers of the pavement and different axle load levels, and established an asphalt pavement fatigue attenuation prediction model [15]. Chen Shaoxing et al. derived the axle load conversion formula based on the fatigue equivalent conversion principle and determined the conversion index in the formula through indoor experiments and pavement mechanics calculation results [16]. Zhang Naiji et al. calculated the fatigue life of asphalt pavement under different temperature ranges and axle load levels based on the principle of cumulative fatigue damage, and compared and analyzed the influence of three types of interlayer connection states on fatigue life [17].
Recent studies in China recommend using measured axle load spectra for equivalent load conversion or directly using them in structural design calculations [18,19]. Xie Sen et al. found that certain vehicle models on a highway in Jiangsu Province China significantly exceeded the recommended values in the “Highway Asphalt Pavement Design Specification” (JTG D50-2017) [18,19]. By combining measured axle load data, a fatigue equivalent load conversion index model was established. In another research study related to axle load parameters using measured axle load spectra data from highways in Shandong Province, the results indicated that the conversion coefficients for equivalent axle loads were generally lower than the recommended values in the same specification [20]. Zhao Yao et al. found that the accuracy of the cumulative equivalent axle load conversion method in the 17th edition of the standard is insufficient when the vehicle is severely overloaded, by comparing the measured data of the axle load spectrum [21]. Lin Ji conducted statistical analysis on the dynamic weighing and other data of the 22 sections of highways in Fujian and found that the recommended proportion of TTC1 to TTC5 vehicle types in the specifications was significantly different from the vehicle types on highways in Fujian Province. The proportion of fully loaded vehicles on highways in Fujian Province was significantly lower than the recommended proportion in the specifications. Based on various indicators, axle load conversion was conducted, and it was found that the recommended values in the specifications may be too high [22].
In summary, there is currently no consistent conclusion regarding the characterization of traffic axle loads in the calculation of asphalt pavement fatigue damage in China. In the current specifications for pavement structural design, although the handling of traffic data refers to the American Mechanistic-Empirical Pavement Design Guide (MEPDG), which employs vehicle types and axle load spectra to characterize traffic loads, the final fatigue life analysis still relies on the cumulative application of equivalent standard axle loads [23,24]. Additionally, the current specifications use the structural layer modulus at 20 °C for fatigue damage calculations during the whole design period [18]. The temperature variations resulting from different climates in various regions are primarily differentiated using temperature adjustment coefficients. The selection of temperature differs considerably from the actual temperature cycles experienced by pavement structures.
To evaluate the impact of different characterizations of traffic axle load and temperature variations on asphalt pavement fatigue damage, this paper conducted fatigue damage calculations and comparative analyses for asphalt pavement structures under conditions involving equivalent standard axle loads, axle load spectra, single temperatures, and seasonal temperature variations to provide a reference basis for evaluating asphalt pavement fatigue damage.

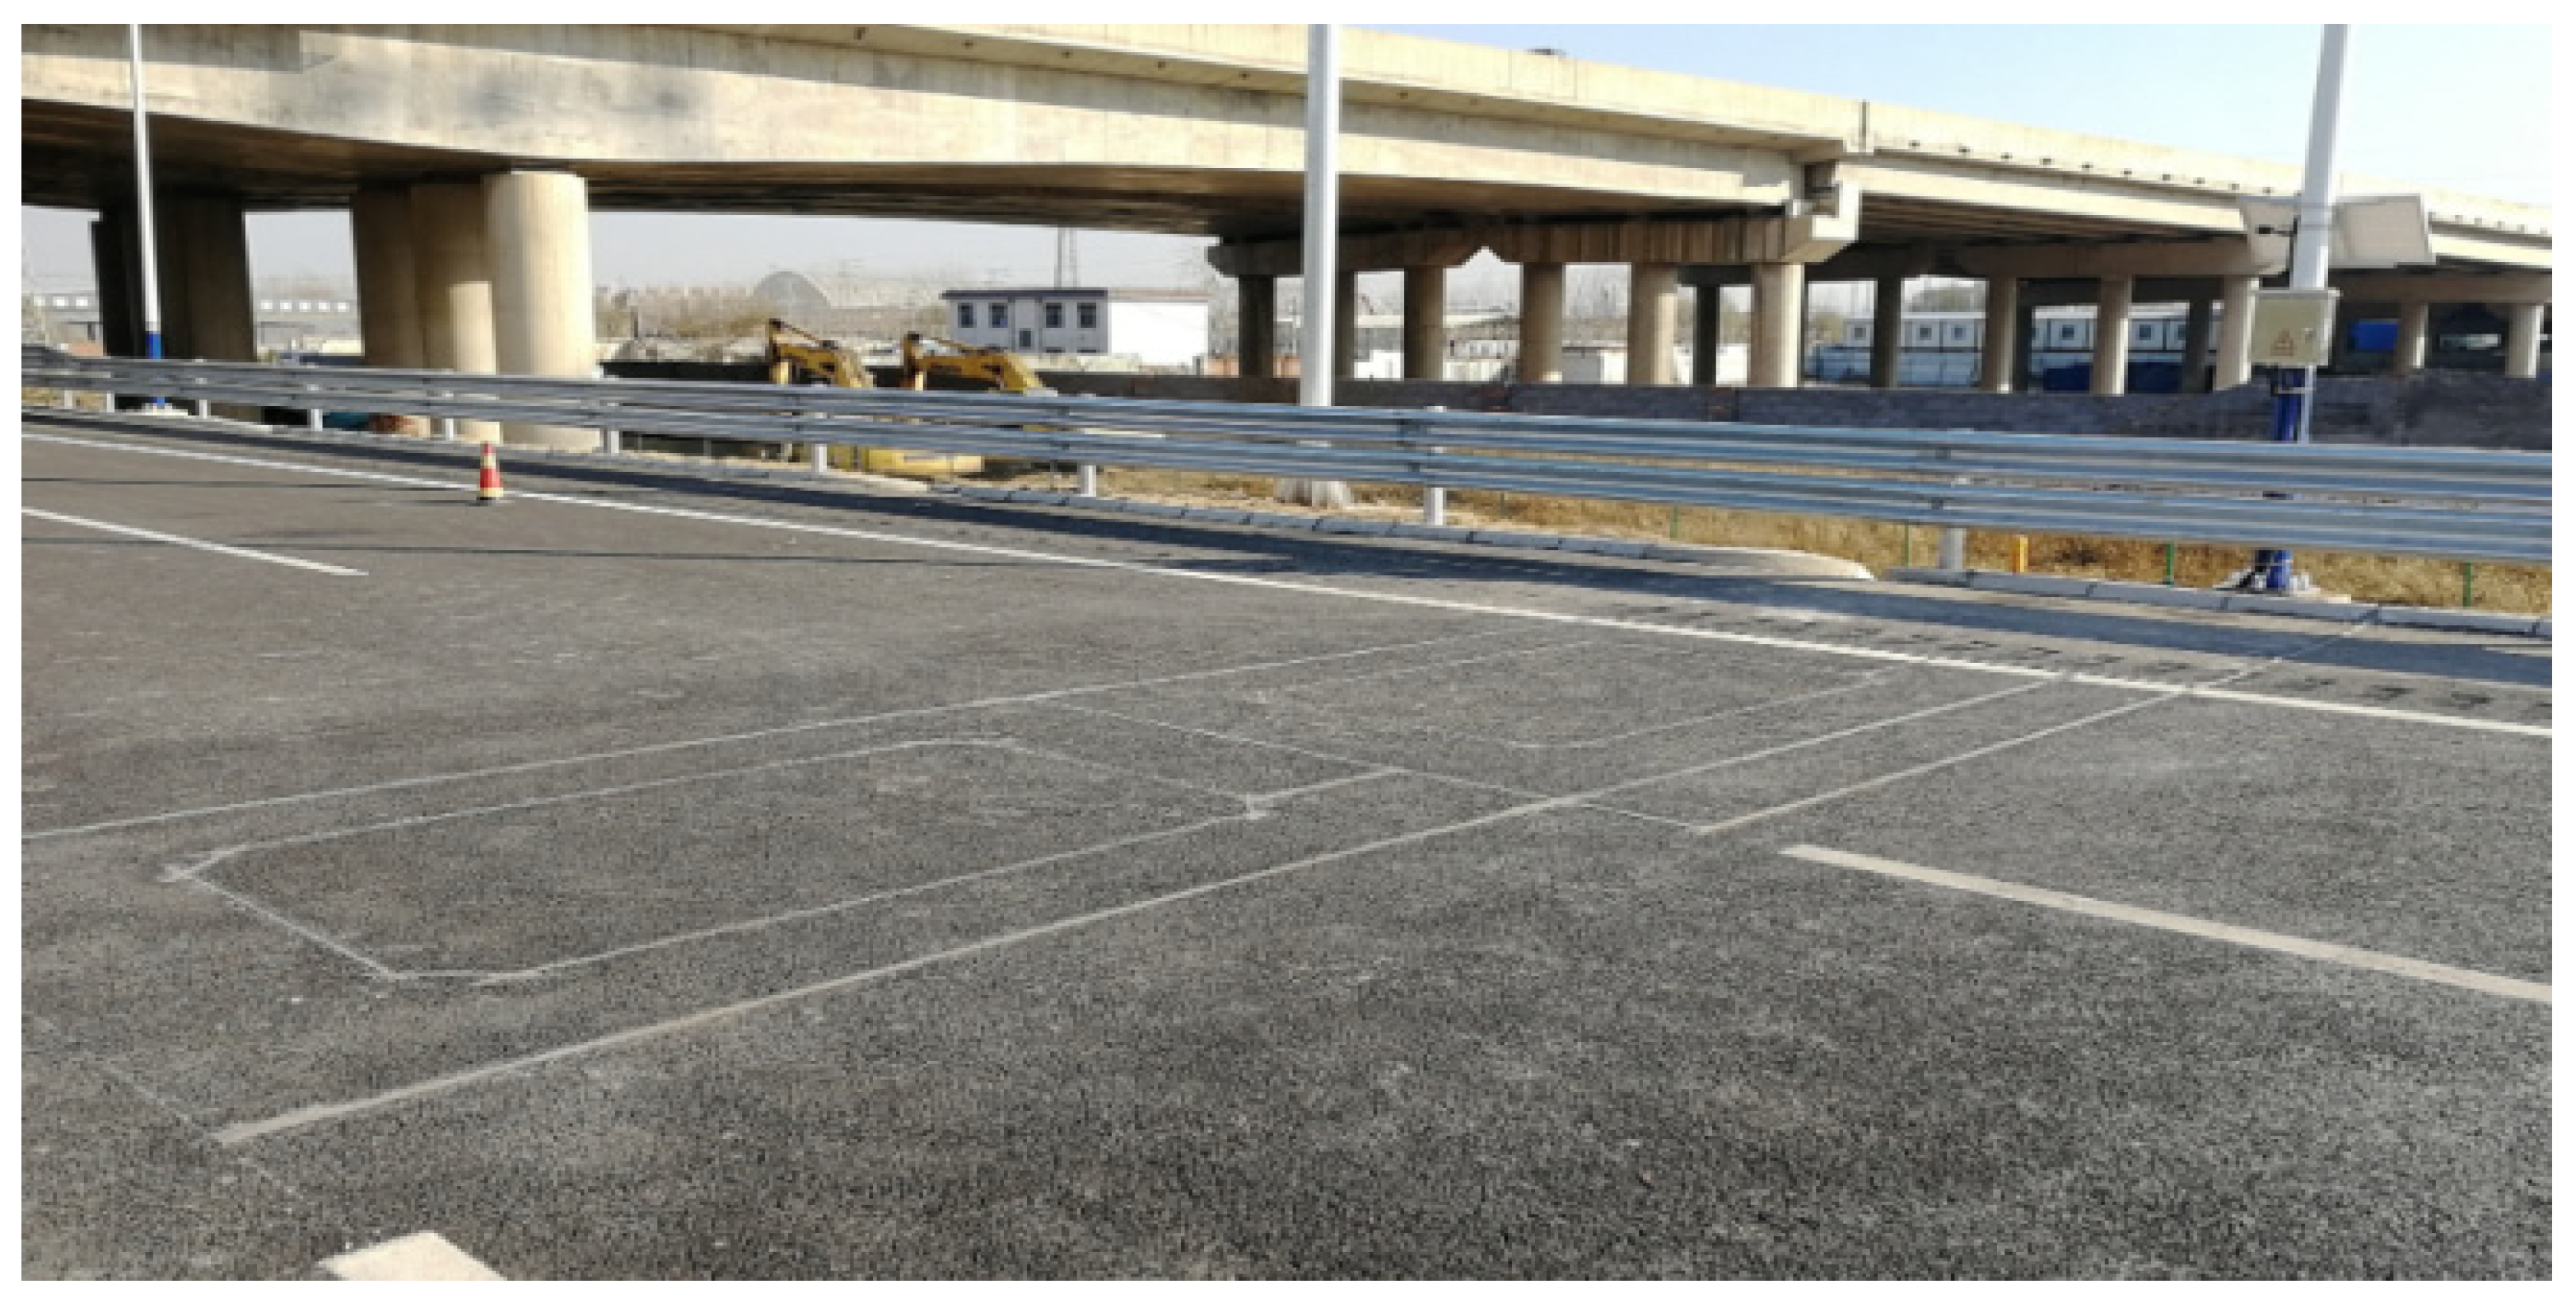
2. Test Section and Monitoring System

The test section is located at Qingdao, Shandong Province, and is a segment of the Qingdao to Linyi Expressway. The structure is a multilayer pavement system with four asphalt layers, cement-stabilized gravel stones and a cement-stabilized subgrade. The asphalt layer consists of 40 mm SMA-13 (Stone Mastic Asphalt), 60 mm AC-20 (Asphalt Concrete), and 80 mm AC-25 and 160 mm LSPM-30 (Large Stone Porous Mixture), as depicted in Figure 1. A weigh-in-motion (WIM) system and temperature monitoring system are installed within the pavement, as illustrated in Figure 2 and Figure 3, allowing for the acquisition of traffic axle load information and temperature data from various pavement structural layers. Figure 3 showed a temperature profile of an asphalt pavement structure of different depths in three days, and the temperature value at a specific chosen moment., The material performance parameters for each pavement layer are presented in Table 1, according to the project information. To calculate the dynamic modulus under varying seasonal temperatures, the measured temperature from the monitoring system and the master curve of the dynamic modulus of asphalt mixtures in different structural layers were used. The frequency of 10 Hz was chosen, which was equivalent to a speed of 70 kM/h [25]. The average calculated dynamic modulus is presented in Table 2.

3. Calculation Methods for Fatigue Damage

To assess the impact of different characterizations of traffic axle load and temperature on asphalt pavement structural fatigue damage, the fatigue damages for the test section were calculated under various combinations of characterizations of axle load and temperature conditions. It is noted that the seasonal temperature comes from the average measured values for each structural layer during the respective season. The calculation plan is summarized in Table 2.
In this paper, the fatigue model from the “Highway Asphalt Pavement Design Specification” (JTG D50-2017) [18] was chosen, and the fatigue damage is accumulated based on Miner’s rule. The fatigue damage calculation methods based on axle load spectra and equivalent standard axle loads are described in the subsequent sections. When calculating fatigue damage under different seasonal temperatures, the corresponding seasonal modulus values in Table 1 are used.

3.1. Method Based on the Axle Load Spectra (ALS)

Step 1: Traffic information, including traffic volumes of vehicles, vehicle type distribution coefficients, and axle load, was obtained from the weigh-in-motion system. Following the requirements in Appendix A of the current specification [18], the percentages of different axle types (single axle, single axle dual wheels, tandem, and tridem) for each vehicle category were calculated within different axle load ranges, which are called axle load spectra, as presented in Equation (1). Subsequently, using Equations (2) and (3), the final axle load spectra for the different axle types across various axle load ranges were computed.
A L D F m i j = N D m i j N A m i
J A L D F i j = m N A P T m i × A L D F m i j × V T D C j m N A P T m i × A L D F m i j × V T D C × 100 %
N A P T m i = N A m i N T m
where
A L D F m i j —the axle load distribution coefficient of the i-axis type in the j-Category axle load-interval of the m-vehicle type;
N D m i j —the number of i-axis types in the j-Category axle load range of m-vehicle type;
N A m i —the number of i-axis types in m-vehicle type;
J A L D F i j —the axle load distribution coefficient of the i-axis type in the j-Category axle load interval of all vehicle type;
V T D C —the distribution coefficient of vehicle type;
N A P T m i —the average number of axles for i axle type in m-vehicle type;
N A m i —the total number of i-type axle types in m-vehicle type;
N T m —the total number of vehicles in m-vehicle type.
Step 2: Calculate the damage using the current specification’s asphalt mixture fatigue model, as presented in Equations (4)–(6) [18].
D c = i ( j N A i j N f i j )
N f i j = 6.32 × 10 15.96 0.29 β k a k b k T 1 1 1 ε a i j 3.97 ( 1 E a ) 1.58 ( V F A ) 2.72
k b = 1 + 0.3 E a 0.43 ( V F A ) 0.85 e 0.024 h a 5.41 1 + e 0.024 h a 5.41 3.33
where
D c —the fatigue damage within a certain calculation period;
N f i j —the fatigue life of the pavement structure at ε a i j strain level;
N A i j —the total number of i-axle type in the j-Category axle load-interval that pass through the cross-section during the calculation period; β is the reliability index;
k a —the adjustment coefficient for seasonal frozen soil areas;
E a —the dynamic modulus of asphalt mixture;
k b —the fatigue loading mode coefficient;
k T 1 —the temperature adjustment coefficient;
VFA—the saturation degree of asphalt;
h a —the thickness of the asphalt mixture layer (mm);
ε a i j —the tensile strain at the bottom of the asphalt layer generated by the passing of i-axle type in the j-level axle load interval, obtained using the DKDLEA online program (a program developed by Shandong Transportation Institute based on elastic multilayer theory).
The median value of the load-interval is used for the mechanical response calculation. The calculation location is selected based on the requirements of the current China specification.

3.2. Method Based on the Equivalent Standard Axle Loads (ESALs)

Step 1: Following the provisions in Appendix A of the current China specification, which is based on the fourth power law [18], axle load conversion for field traffic axle loads was carried out to obtain the cumulative equivalent axle load numbers Nel within a certain calculation period. The equivalent standard axle load is a uniform load of 100 kN applied by dual wheels.
Step 2: calculate fatigue damage using the asphalt mixture fatigue model from the current China specifications, followed by Equations (7) and (8).
D c = N e l N f
N f = 6.32 × 10 15.96 0.29 β k a k b k T 1 1 1 ε a 3.97 ( 1 E a ) 1.58 ( V F A ) 2.72
where
D c —the fatigue damage within a certain calculation period;
N f —the fatigue life of the pavement structure at ε a strain level;
Nel—the cumulative number of equivalent axle load during this calculation period;
ε a —the tensile strain at the bottom of the asphalt layer generated when a standard equivalent axle passes through.

4. Results and Discussion

4.1. Axle Load Characterizations

The traffic data for the entire year of 2022 have been analyzed to reduce the impact of short-term data fluctuations. The total traffic volume for single-lane vehicles, Type 2 to Type 11, during 2022 was 299,519. Further data processing yielded the distribution coefficients for vehicle types and axle load spectra for different axle types within each axle load category.
Load intervals were 2.5 kN, 4.5 kN, 9.0 kN, and 13.5 kN for the four axle types, respectively. The results are shown in Table 3 and Figure 4.
As shown in Table 3, among the vehicles of Type 2 to Type 11, Vehicle Type 3 has the largest proportion, accounting for approximately 43%. Vehicle Type 9 constitutes around 37% of the total. Given that Vehicle Type 9 corresponds to large trucks with significant load-bearing capacity and a substantial distribution count, this vehicle type was expected to exert a considerable impact on the fatigue behavior of this highway.

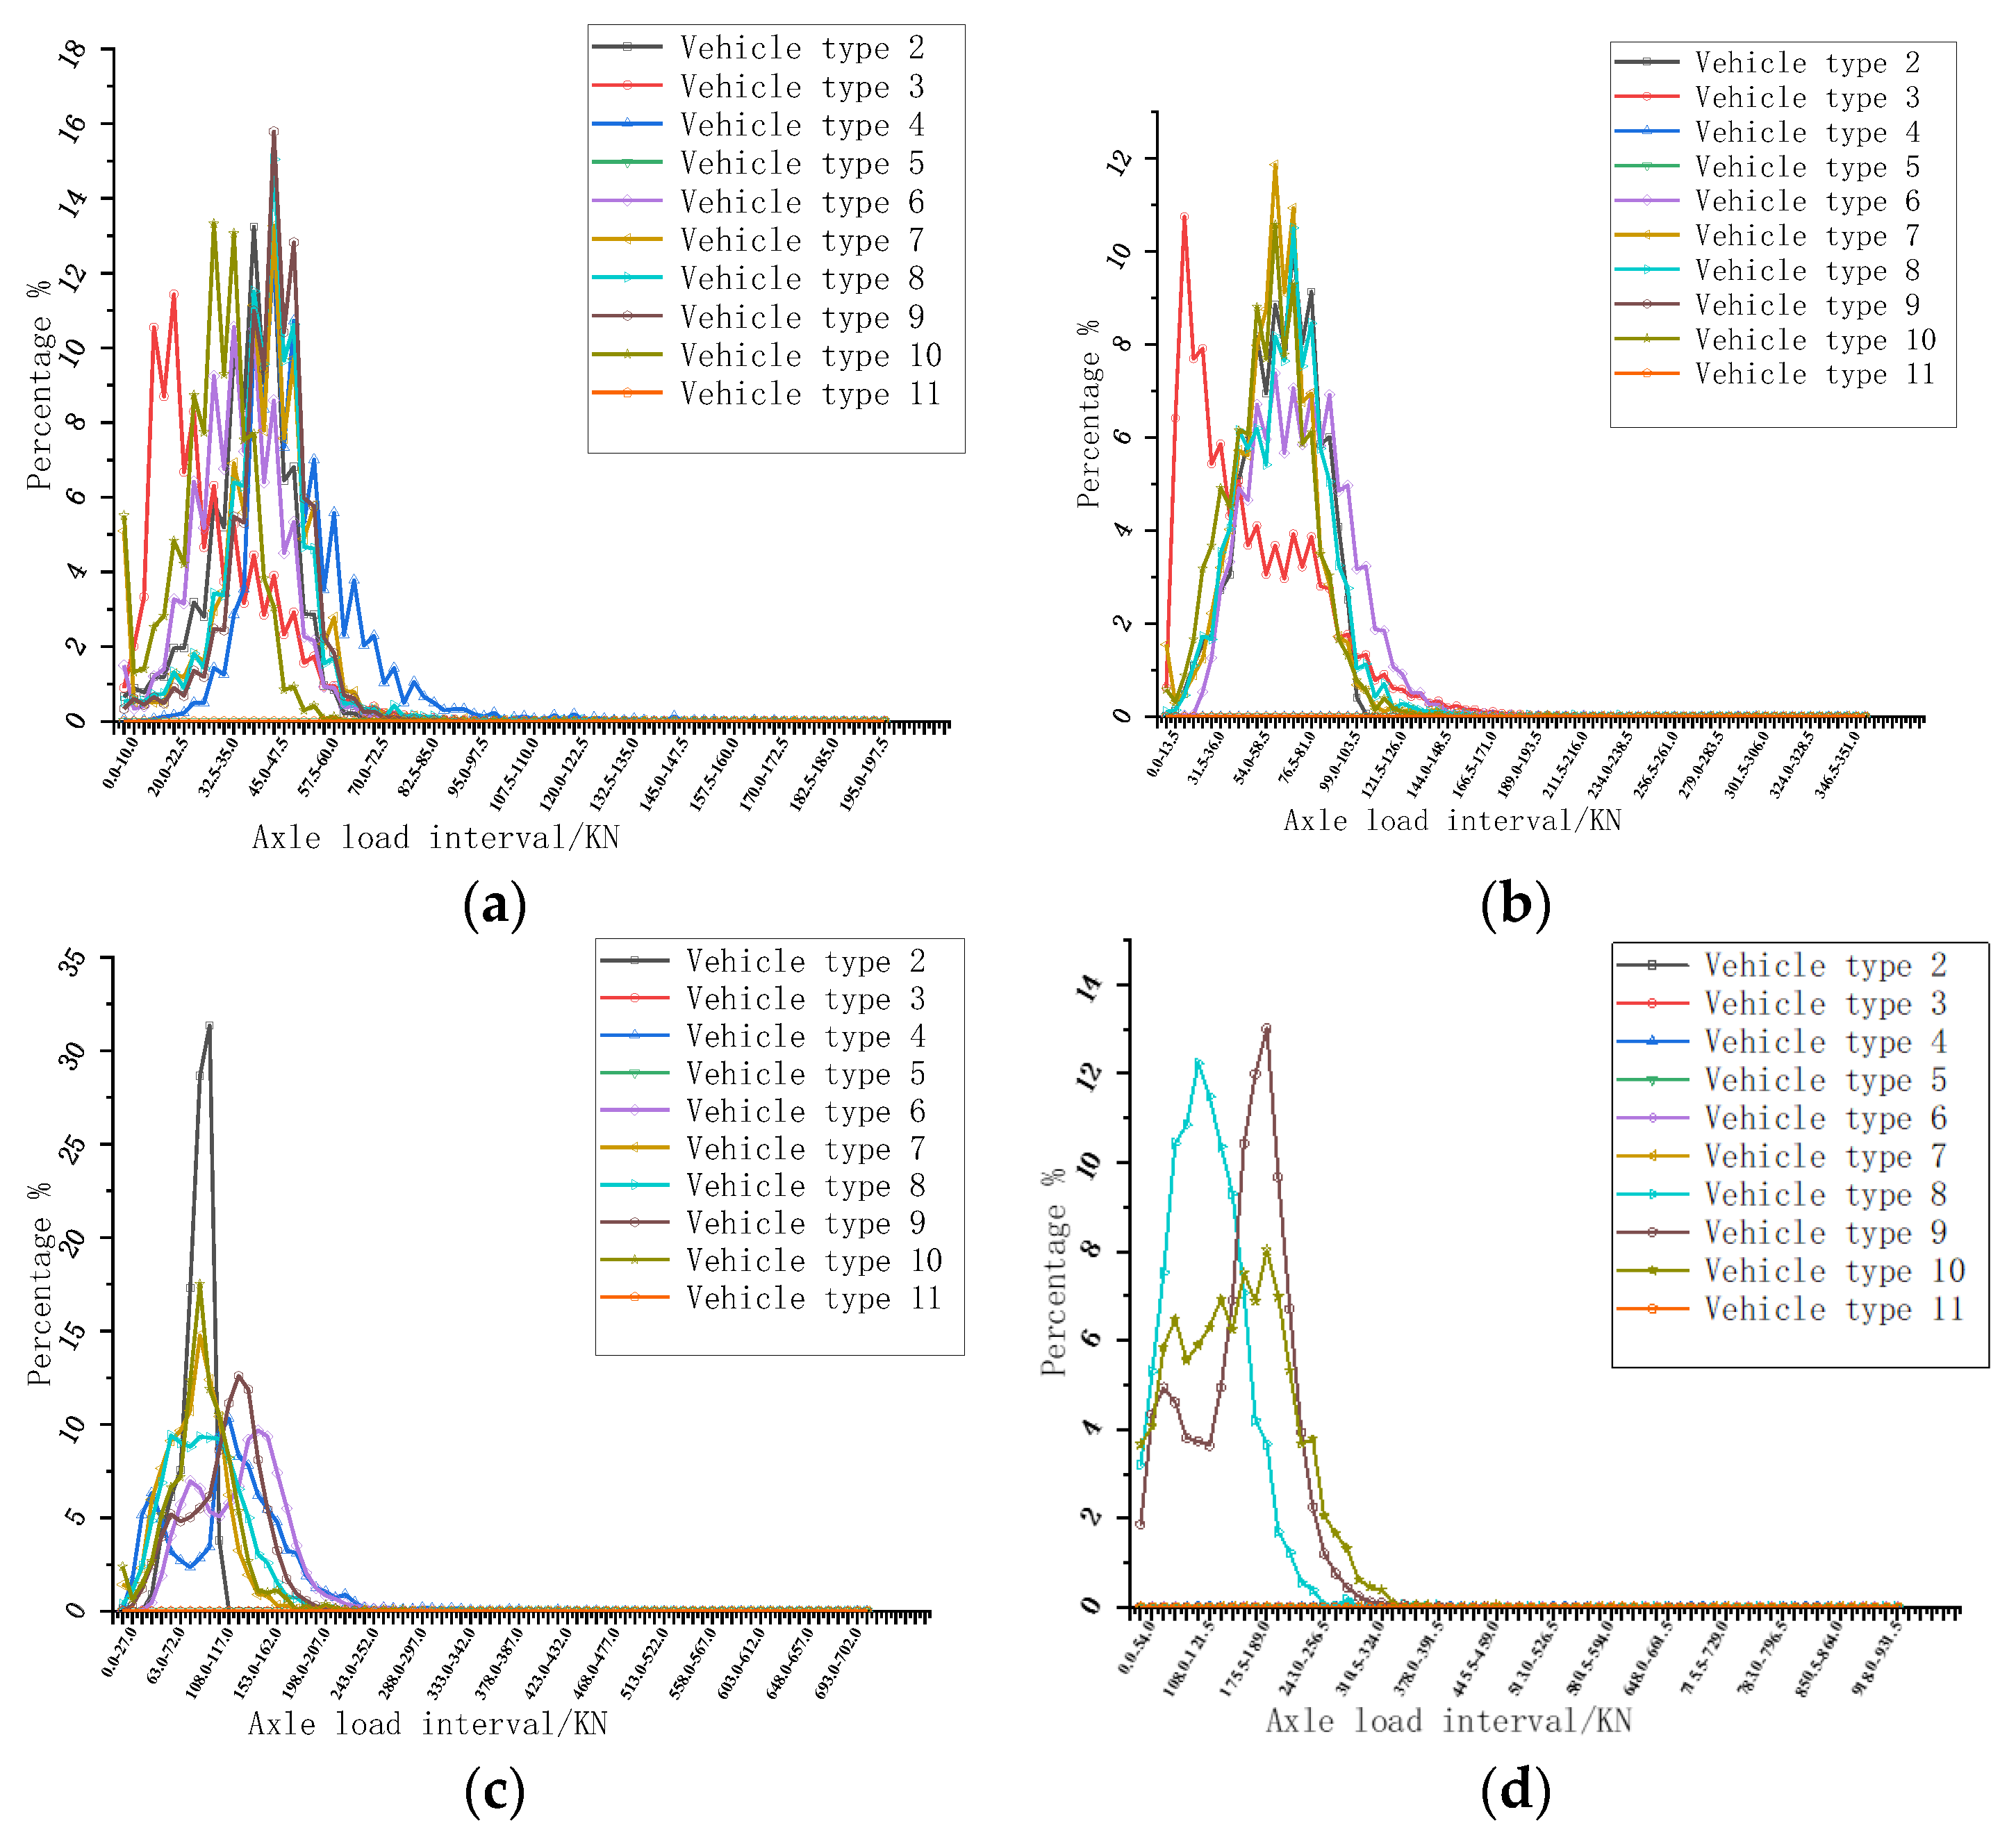
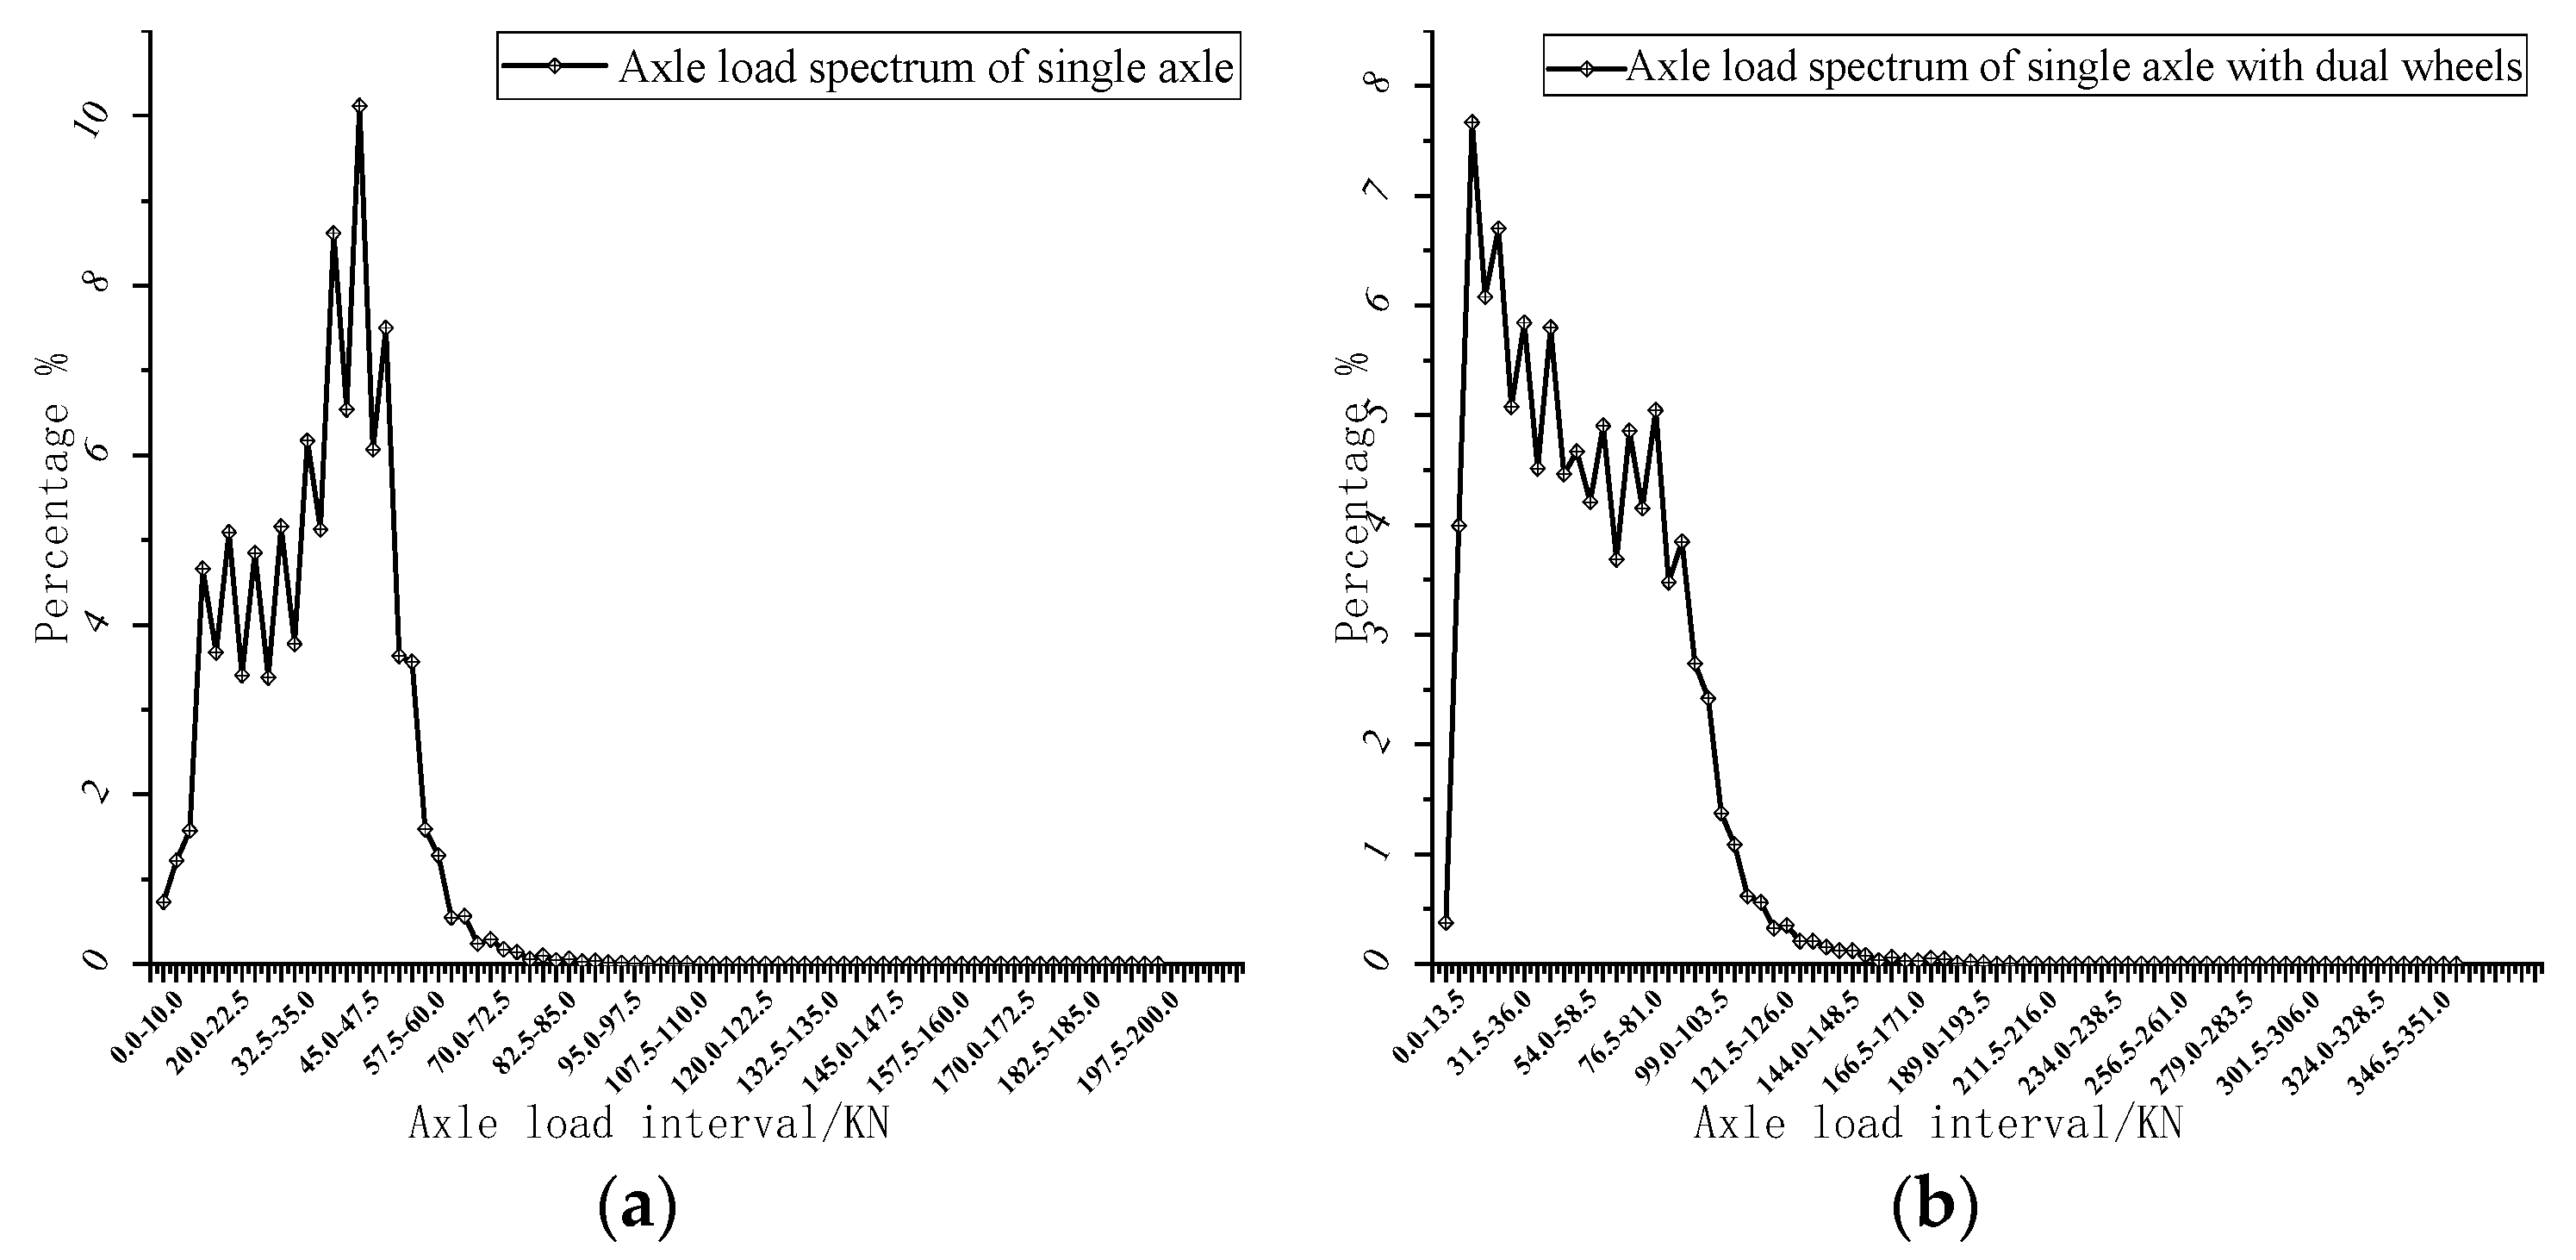
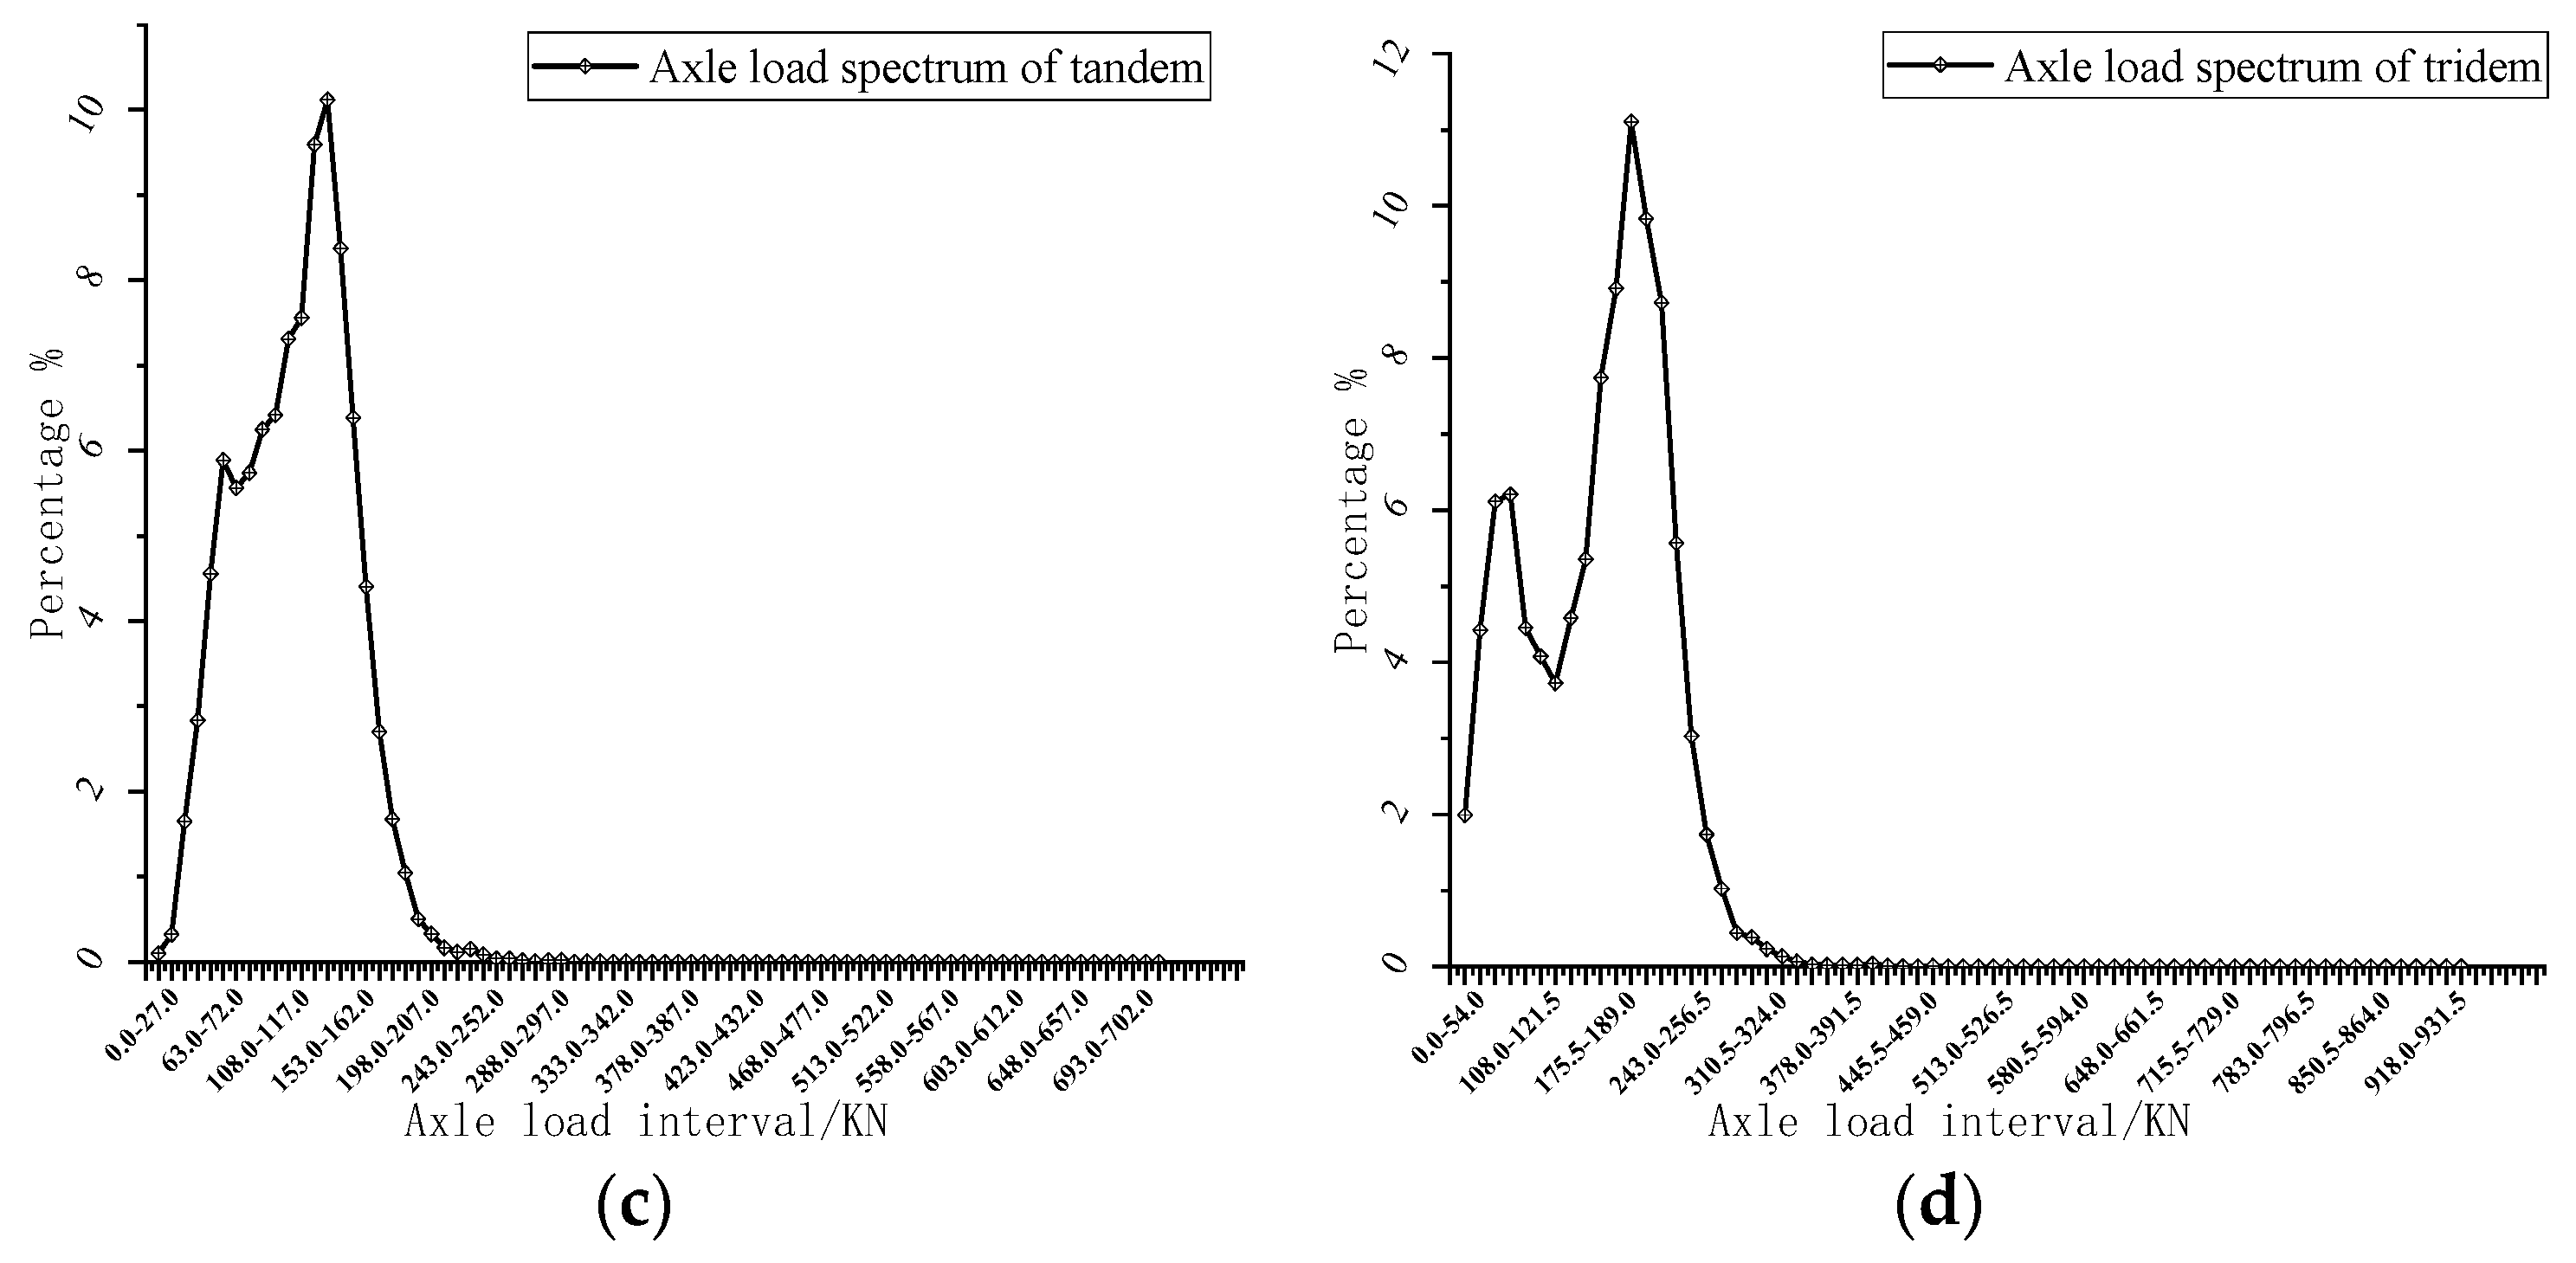
4.1.1. Axle Load Spectra

According to the axle load spectrum shown in Figure 4, Vehicle Type 3 exhibits a 65.62% distribution of single axle loads within the 15–37.5 kN range. Type 9 vehicles predominantly concentrate their single axle loads within the 35–57.5 kN range, accounting for 81.99%. For Vehicle Type 3, with dual wheels on a single axle, the load distribution spans the 13.5–67.5 kN range, constituting 67.92% of the total. Type 9 vehicles with tandem primarily distribute their loads within the 54–162 kN range, representing 88.51% of the total. Similarly, Type 9 vehicles with tridem concentrate their loads within the 54–229.5 kN range, accounting for 88.73% of the total.
To visually observe the distribution of axle loads for all axle types and calculate fatigue damage based on axle load spectra, a combined axle load spectrum is established according to Equation (1). As shown in Figure 5, for the year 2022, for single axle loads, 87.72% of these loads are concentrated within the 15–55 kN range. The highest number of single axle loads falls within the 45–47.5 kN range, accounting for 10.11%. For the single axle with dual wheels, 77.64% of these loads are predominantly distributed in the 18–85.5 kN range. The highest concentration of single axle with dual wheel loads occurs in the 18–22 kN range, constituting 7.67% of the total. For the tandem loads, 88.15% of them exhibit load concentrations within the 54–171 kN range. The highest number of tandem loads falls within the 135–144 kN range, representing 10.12% of the total. For the tridem loads, 86.38% of them are centered around the 67.5–243 kN range. The most significant concentration of triple axles occurs in the 202.5–216 kN range, accounting for 11.11% of the total.
Comparing Figure 4 and Figure 5 reveals that the combined axle load spectrum, which retains only four axle types, provides a more intuitive reflection of traffic load information. From Figure 4, Type 9 vehicles, composed of one single axle, one tandem and one tridem, constituted a significant proportion of all vehicles and exhibit heavier axle loads. Consequently, the traffic data of Type 9 vehicles were used to perform fatigue damage calculations in the following study.

4.1.2. Equivalent Standard Axle Loads

According to the calculation plan, it is necessary to compute the numbers of equivalent standard axle loads for a single vehicle, a single month, and the entire year. Based on the analysis results from the previous section, a single vehicle corresponds to one Type 9 vehicle. In May 2022, the pavement structure temperature for various layers was approximately 20 °C, which aligns with the temperature used for fatigue life calculations in the current specification. Consequently, the traffic data in May were selected, and May was used as the calculation period for a single month. Following the axle load conversion method specified in the “Highway Asphalt Pavement Design Specification” (JTG D50-2017) [18], equivalent standard axle loads were computed and are presented in Table 4.

4.2. Fatigue Damage Analysis

4.2.1. Fatigue Damage for a Single Vehicle

According to the previously described fatigue damage calculation method in Section 2, fatigue damage for a single vehicle with different traffic characterizations were computed, which were calculation plan 1, 2 and 3. As presented in Table 5, the strain, fatigue life, and fatigue damage for three axle types calculated based on measured axle loads and the axle load spectrum are essentially consistent. If the values obtained from the measured axle load calculation are considered as the real responses, the errors between the calculated values of the strain, fatigue life, and fatigue damage based on ASL method and the measured axle load fall within the range of −2%~3%, −8%~13%, and −10%~10%, respectively. The total fatigue damage calculated using three different traffic characterizations is as follows: 1.54 × 10⁻⁸, 1.69 × 10⁻⁸, 2.34 × 10⁻⁹. This implies that the ESALs method underestimates the fatigue damage by approximately 6.05 times. Since the ALS method directly uses axle loads for different axle types without the need for transformation to standard axle loads to calculate fatigue damage, it can better ensure calculation accuracy.

4.2.2. Fatigue Damage for a Single Month with Consistent Temperature

According to the previously described fatigue damage calculation method in Section 2, fatigue damage for a single month with consistent temperature, which were calculation plans 4 and 5, were computed and are presented in Figure 6 and Table 6.
As shown in Figure 6, the fatigue damage calculation method based on the ALS method provided more detailed information about different axle types and load levels, while the ESALs method only provided the accumulation of the fatigue damage at the end of the design period, which is presented in Table 6. As the axle load increases, the fatigue damage for a single axle also increases. For the single axle (Figure 6a), most of the cumulative fatigue damage occurred within the axle load range of 40 kN to 62.5 kN during May. The maximum cumulative fatigue damage occurred in the 50 kN to 52.5 kN axle load range, reaching 2.10 × 10⁻⁷. For the single axle with dual wheels (Figure 6b), cumulative fatigue damage primarily occurred within the axle load range of 63 kN to 139.5 kN. The maximum cumulative fatigue damage occurred in the 99 kN to 103.5 kN axle load range, amounting to 2.17 × 10⁻⁷. For the tandem (Figure 6c), most of the cumulative fatigue damage occurred within the axle load range of 99 kN to 207 kN. The maximum cumulative fatigue damage occurred in the 144 kN to 153 kN axle load range, reaching 3.09 × 10⁻⁶. For the tridem (Figure 6d), cumulative fatigue damage predominantly occurs within the axle load range of 135 kN to 337.5 kN. The maximum cumulative fatigue damage occurs in the 216 kN to 229.5 kN axle load range, amounting to 9.47 × 10⁻⁶.
Based on the ALS method and the ESALs method, the cumulative fatigue damage for the given month is 9.07 × 10⁻⁵ and 1.50 × 10⁻⁵, respectively, as presented in Table 6. This result indicated that the ESALs method underestimated the fatigue damage by approximately 6.05 times, which was consistent with the results of a single vehicle. This finding was consistent with other current studies to some extent [26,27]. Since the fatigue damage calculation based on the ALS method employed the mid-value of each interval as the calculated axle load, the maximum errors between the calculated axle load values for these three axle types and the actual axle loads are 1.25 kN, 2.25 kN, 4.5 kN, and 6.75 kN. These small discrepancies between the calculated and actual axle loads contribute to the lower error in fatigue damage estimation compared to cumulative equivalent axle loads. Another study’s results from the Texas A&M University also confirmed the necessity of load spectra analysis [28].

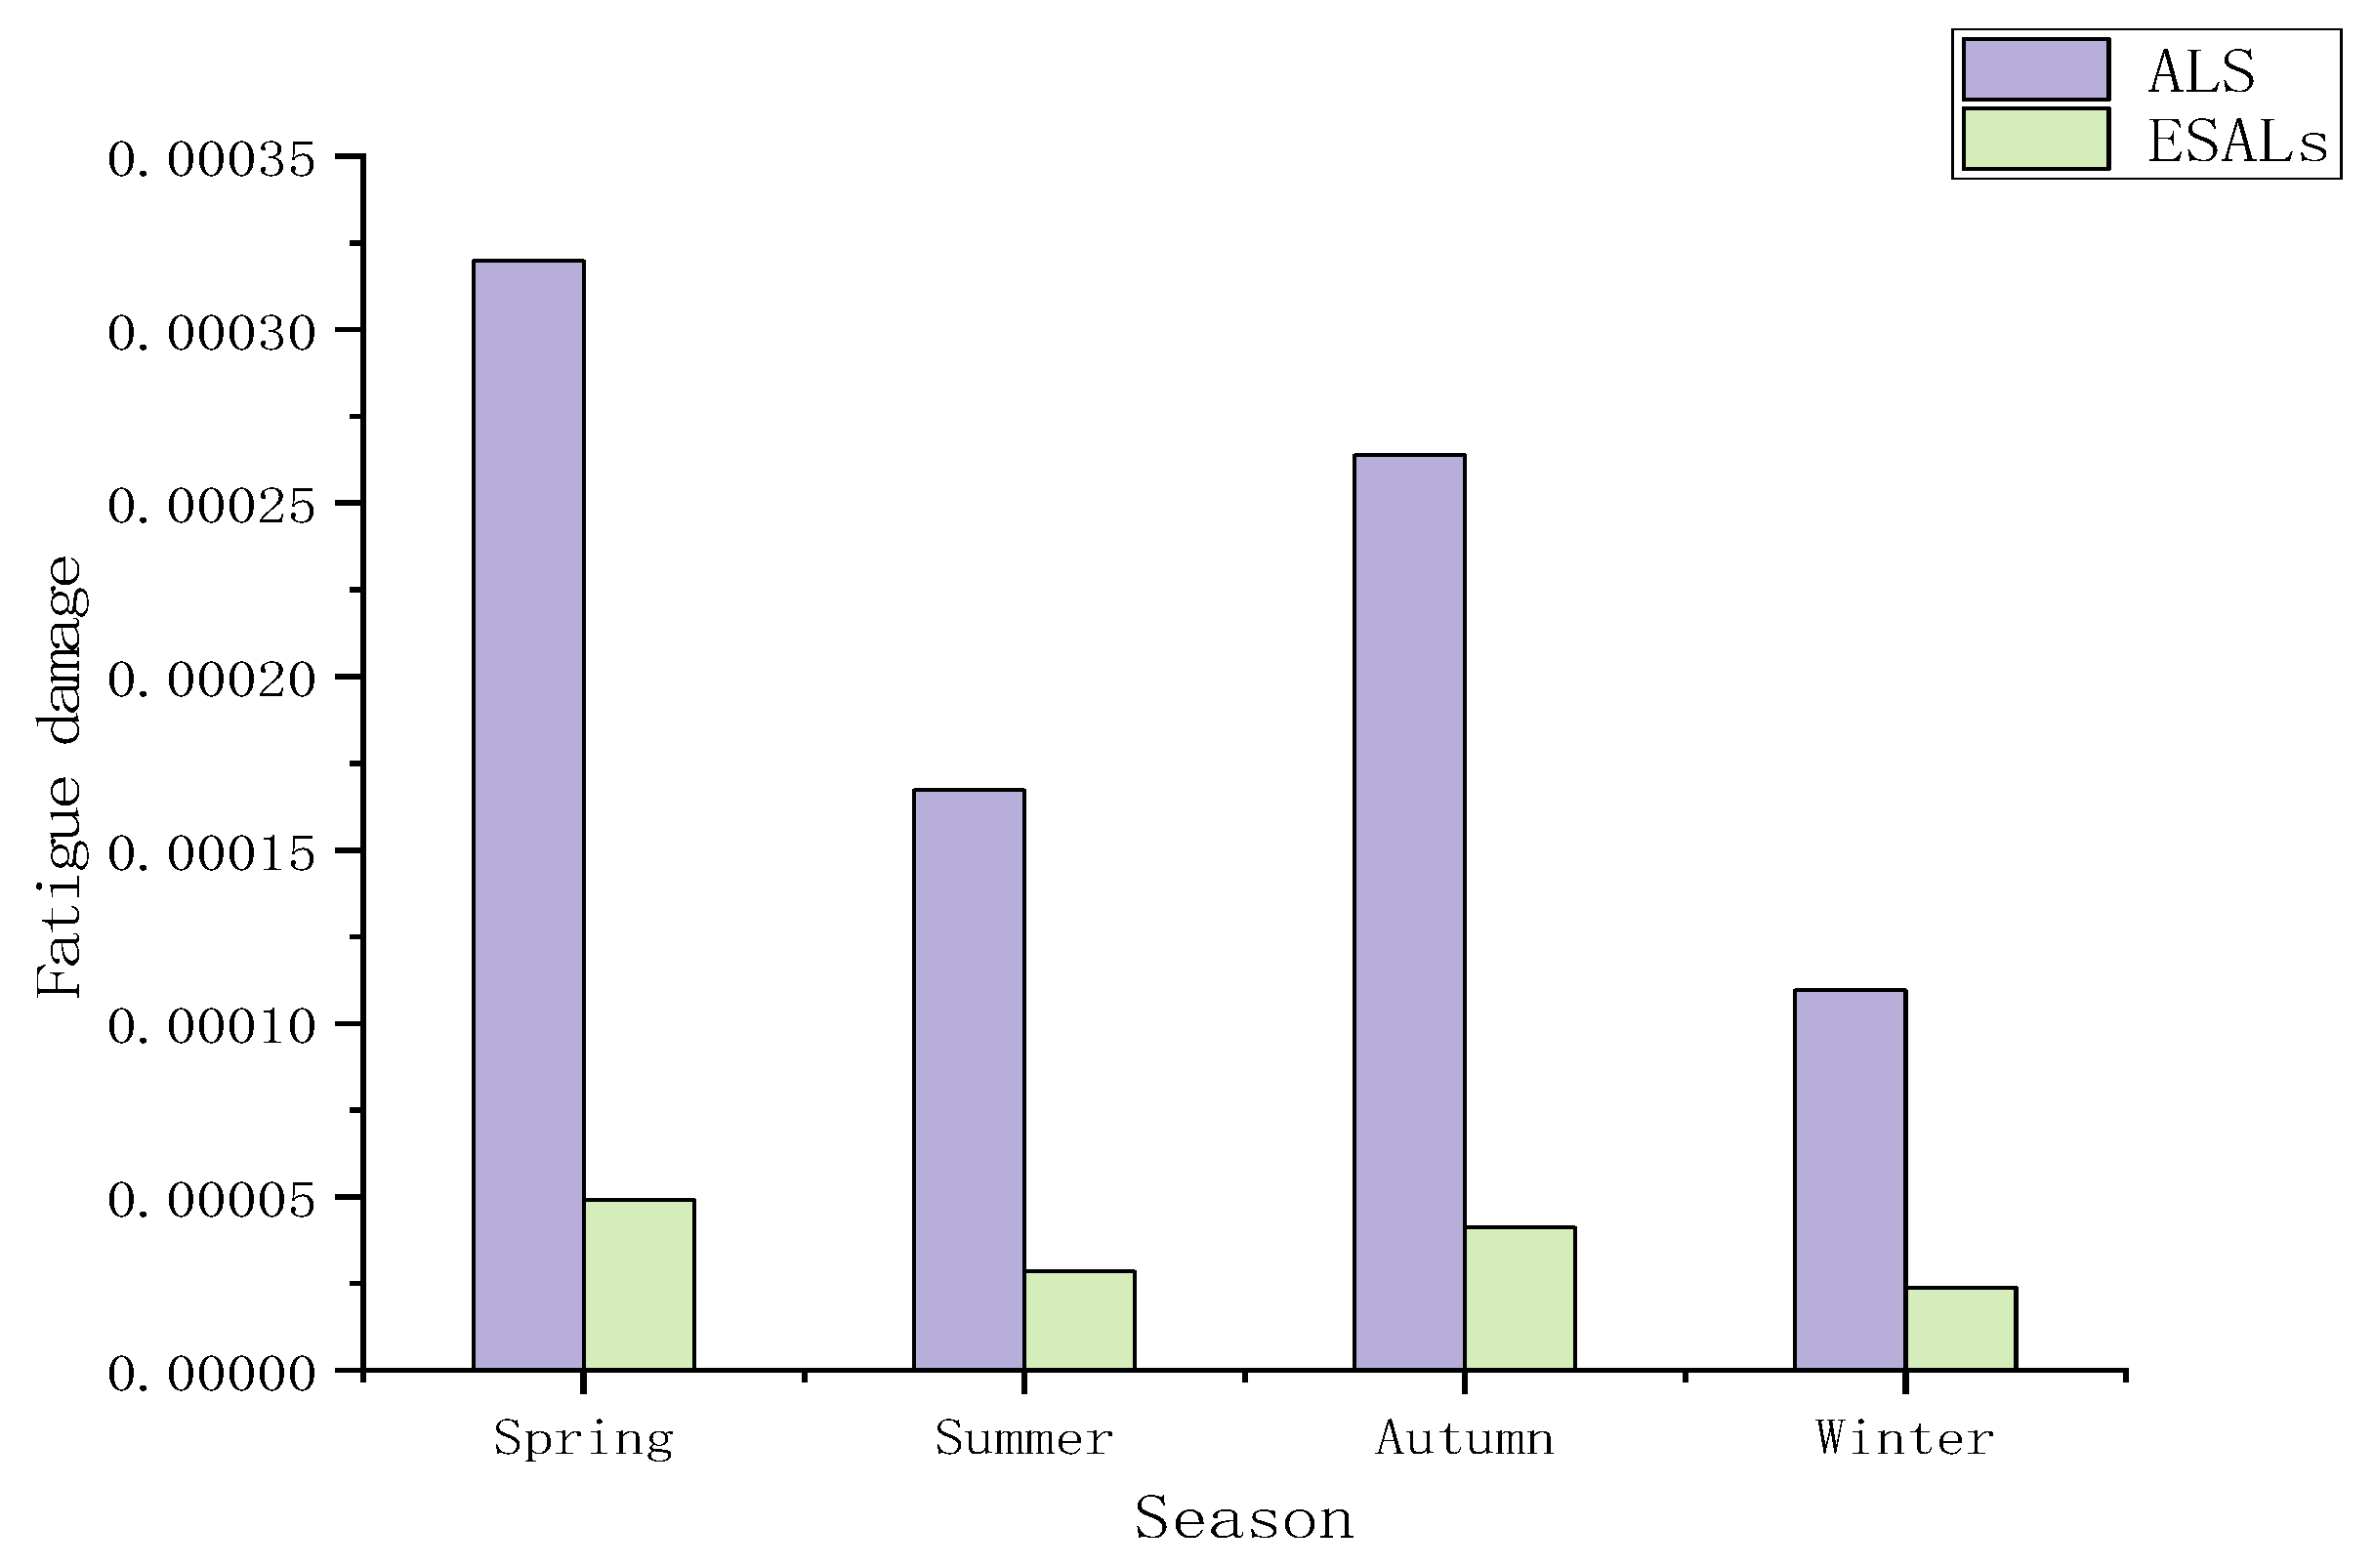
4.2.3. Fatigue Damage for One Year with Seasonal Average Temperature

In China’s specifications, the dynamic compressive modulus at 20 °C, 10 Hz was selected to calculate fatigue damage which significantly differs from the field service state of pavement structures. To investigate the differences between using the constant temperature and seasonal average temperature, fatigue damage was computed under calculations plans 6 and 7; Figure 7 and Figure 8 represent the results.
As described in Section 4.2.2, the fatigue damage calculation based on the ALS method allowed for the assessment of fatigue damage under varying axle types and load levels, as illustrated in Figure 7. The cumulative fatigue damage for single axle loads in 2022 primarily occurs within the axle load range of 35 kN to 72.5 kN across all four seasons. The maximum cumulative fatigue damage occurs in the 50 kN to 52.5 kN axle load range, reaching 6.89 × 10⁻⁷. For single axle with dual wheels (Figure 7b), cumulative fatigue damage predominantly occurs within the 45 kN to 150-axle load range during spring, autumn, and winter. However, during summer, a bimodal distribution of cumulative fatigue damage is observed, with axle load ranges of 58.5 kN to 126 kN and 148 kN to 196.5 kN. Tandem loads (Figure 7c) exhibit cumulative fatigue damage mainly within the 90 kN to 225 kN axle load range during spring, summer, and autumn. Tandem axle cumulative fatigue damage during winter is significantly lower than in other seasons. This behavior is attributed to the reduced traffic volume and increased modulus. Finally, for tridem loads (Figure 7d), cumulative fatigue damage primarily occurs within the 175 kN to 297 kN axle load range. The maximum cumulative fatigue damage occurs in the 216 kN to 229.5 kN axle load range, amounting to 3.20 × 10⁻⁵.
When summing up the fatigue damage generated by different axle types and load levels throughout a season, it can be seen that the tridem loads contributed the most to the year’s fatigue damage.
Usually, an increase in the modulus of asphalt mixtures correlates with a reduction in the temperature of asphalt pavement structural layers. Consequently, a decrease in tensile strain occurs at the base of the asphalt layer, resulting in a reduction in fatigue damage. Figure 9 illustrates this phenomenon, demonstrating a notable decrease in fatigue damage during winter compared to other seasons, irrespective of whether the analysis is conducted using the ALS method or the ESALs method.
More importantly, the difference in fatigue damage based on the ESALs method across the four seasons is only due to changes in traffic volume, while the difference in fatigue damage based on the ALS method reflected both traffic volume and temperature variations. As depicted in Figure 9, while rising summer temperatures theoretically correlate with increased fatigue damage, the actual data do not align with this expected trend. This inconsistency could be attributed to the decreased traffic volume and lighter axle loads experienced during summer, which would offer more specific information for the pavement structure design. Another study also pointed that fatigue life varies considerably under different temperature conditions [29].
The cumulative fatigue damage calculated using the ALS method across the four seasons, respectively, is 6.51, 5.88, 6.42, and 4.60 times that of the fatigue damage calculated using the ESALs method. The annual cumulative fatigue damage is 8.60 × 10⁻⁴ and 1.42 × 10⁻⁴, with the former being approximately 6.04 times that of the latter, which was consistent with the results of a single vehicle and single month.

5. Conclusions

Based on the measured data from the weigh-in-motion system and temperature monitoring system installed on the expressway in Shandong province, pavement structure fatigue damage analysis was conducted under different axle load characterizations and seasonal average temperatures. The following conclusions were drawn:
(1)
The axle load spectrum provides a more intuitive reflection of traffic load information. In 2022, the main vehicle types on this expressway were Type 3 and Type 9, and no Type 5 or Type 11 vehicles were observed. The main axle load ranges for single axle, single axle with dual wheels, tandem, and tridem are, respectively, 35–52.5 kN, 18–67.5 kN, 54–162 kN, and 54–243 kN.
(2)
In the fatigue damage calculations for a single vehicle, a single month, and one year, the results consistently indicate that the ESALs method underestimates pavement fatigue damage compared to the ALS method by approximately 6.05 times. The ALS method directly computed fatigue damage using the axle load spectrum and subsequently accumulated the data, without the need for conversion to equivalent standard axle load. This characteristic renders the fatigue damage data calculated from the ALS method more reliable and precise.
(3)
By employing the ALS method to calculate fatigue damage while simultaneously considering seasonal temperature variations, more detailed information which is consistent with actual pavement service conditions can be obtained. This will be helpful to improve pavement structure design decisions.
(4)
Due to the limited availability of data, more pavement structure and material types and different fatigue models will be necessary to verify the differences in the fatigue damage results obtained between the two methods in the future.

Author Contributions

W.Z. and W.H. proposed methodologies. W.Z., W.H. and W.J. have completed the calculation of strain and fatigue damage. T.C. and S.W. completed the writing and translation of the paper. S.W., F.Y. and J.W. completed the data analysis. All authors have read and agreed to the published version of the manuscript.

Funding

This research was supported by the Taishan Scholars Program, grant number tstp20231240.

Institutional Review Board Statement

Not applicable.

Informed Consent Statement

Not applicable.

Data Availability Statement

Data are contained within the article.

Conflicts of Interest

Wenwu Zhang and Shanshan Wang were employed by the company Shandong Hi-Speed Group Co., Ltd. Wenqing Jiang was employed by the company Shandong Hi-Speed Information Group Co., Ltd. The remaining authors declare that the research was conducted in the absence of any commercial or financial relationships that could be construed as a potential conflict of interest.

References

  1. Lv, W. Principles and Methods of Asphalt Mixture Design. Master’s Thesis, Tongji University Press, Shanghai, China, 2001. [Google Scholar]
  2. Wu, Y.; Cheng, Y.; Zeng, D.; Xu, Y. Study on fatigue life of semi-flexible pavement materials. Zhongwai Highw. 2021, 41, 313–318. [Google Scholar]
  3. Zhang, N.; Wu, G. Mechanical Response Analysis of Interlayer Adhesion of Asphalt Pavement Considering Temperature Influence. Highway 2020, 65, 6. [Google Scholar]
  4. Bao, C. Mechanical Response Analysis of Semi-Rigid Base Asphalt Pavement Under Heavy Load. Master’s Thesis, Chongqing Jiaotong University, Chongqing, China, 2019. [Google Scholar]
  5. Guo, N.; Zhao, Y.; Yu, Y. Fatigue life calculation of polyester fiber asphalt concrete pavement. J. Shenyang Jianzhu Univ. Nat. Sci. Ed. 2005, 21, 4. [Google Scholar]
  6. Yin, X.; Huang, H.; Zhang, J.; Can, Z. Statistical analysis of vehicle axle load on a certain highway and its impact on bridge deck. Chin. Sci. Technol. Pap. 2015, 4. [Google Scholar]
  7. Hveem, F.N. Pavement Deflections and Fatigue Failures. Highw. Res. Board Bull. 1955, 43–87. [Google Scholar]
  8. Zaghloul, S.; White, T.D. Load Equivalency Factors for Asphalt Pavements (With Discussion). J. Assoc. Asph. Paving Technol. 1994, 63, 481–510. [Google Scholar]
  9. Hallin, J.; Hein, D.; Popik, M. Input Requirements for The AASHTO 2002 Guide for New and Rehabilitated Pavement Structures. In Proceedings of the Transportation: From Vision to Reality Conference & Exhibition of the Transportation Association of Canada, Ottawa, ON, Canada, 15–18 September 2002. [Google Scholar]
  10. Ma, L.; Ge, Z.; Hu, X.; Huang, M. Analysis of fatigue damage of asphalt pavement based on predicted axle load spectrum. Sci. Technol. Eng. 2011, 11, 4506–4508. [Google Scholar]
  11. Prowell, B.D. Estimate of fatigue shift factors between laboratory tests and field performance. Transp. Res. Rec. 2010, 2181, 117–124. [Google Scholar] [CrossRef]
  12. Li, Q.; Ni, F.; Li, G. Axle load conversion method for asphalt pavement based on equivalent rutting. J. Transp. Eng. Inf. 2013, 11, 63–70. [Google Scholar]
  13. Bai, B. Research on Axle Load Analysis and Fatigue Life Prediction of Asphalt Pavement on Highways. Ph.D. Thesis, Changsha University of Technology, Changsha, China, 2017. [Google Scholar]
  14. Wang, B. Research on Fatigue Behavior of Asphalt Pavement under Vehicle Load. Ph.D. Thesis, Chang’an University, Chang’an, China, 2008. [Google Scholar]
  15. Chen, S.; Yu, J.; Ren, W.; Liu, Y.; Zhang, X. Research on axle load conversion of flexible base asphalt pavement based on fatigue equivalence. J. Wuhan Univ. Technol. (Transp. Sci. Eng. Ed.) 2010, 34, 762–764+768. [Google Scholar]
  16. Xu, J.P.; Zhao, Y.; Liang, N.X.; Qin, M. Prediction of service life of high modulus asphalt pavement based on fatigue cumulative damage. J. Chang. Univ. (Nat. Sci. Ed.) 2018, 38, 26–33. [Google Scholar] [CrossRef]
  17. Zhang, N. Study on Fatigue Life of Asphalt Pavement under the Combined Effects of Vehicle and Temperature. Ph.D. Thesis, Chongqing Jiaotong University, Chongqing, China, 2021. [Google Scholar] [CrossRef]
  18. JTG D50-2017; Specifications for Design of Highway Asphalt Pavement. China Communications Press Co., Ltd.: Beijing, China, 2017.
  19. Xie, S. Research on Refinement of Asphalt Pavement Axle Load Conversion Coefficient Based on Tested Axle Load Spectra. Master’s. Thesis, Xiangtan University, Xiangtan, China, 2018. [Google Scholar]
  20. Gao, X.; Fan, J.; Shen, Q.; Chen, F.; Zhu, Y. Optimization of asphalt pavement axle load parameters and structural life prediction based on measured axle load spectra. Highway 2022, 67, 1–8. [Google Scholar]
  21. Zhao, Y.; Zhang, Z.; Zhu, Y. Road axle load spectrum analysis using old vehicle types under new regulations. J. Chongqing Jiaotong Univ. (Nat. Sci. Ed.) 2021, 40, 106–113. [Google Scholar]
  22. Lin, J.; Fan, J.; Ma, T.; Zhu, Y. Optimization of Traffic Load Parameters on Freeways in Fujian Province Based on Axle Load Spectra. Highway 2022, 67, 1–8. [Google Scholar]
  23. Qiang, L.I.; Xiao, D.X.; Wang, K.C.P.; Hall, K.D.; Qiu, Y. Mechanistic-empirical pavement design guide (MEPDG): A bird’s-eye view. J. Mod. Transp. 2011, 19, 114–133. [Google Scholar] [CrossRef]
  24. Ma, S.; Sun, T. Analysis of typical heavy-duty traffic axle load spectrum parameters and design axle load on highways. Highway 2014, 59, 6. [Google Scholar]
  25. Bodin, D.; Chupin, O.; Denneman, E. Effect of Temperature and Traffic Speed on the Asphalt Moduli for Fatigue Cracking and Pavement Structural Design Considerations. In Proceedings of the RILEM International Conference on Mechanisms of Cracking and Debonding in Pavements, Nantes, France, 7–9 June 2016. [Google Scholar]
  26. Haider, S.W.; Musunuru, G. Differences in Predicted Flexible Pavement Performance Using the AASHTOWare Pavement-ME—ESALs versus Axle Load Spectra. In Proceedings of the International Airfield and Highway Pavements Conference 2019, Chicago, IL, USA, 21–24 July 2019. [Google Scholar]
  27. Dinegdae, Y.H.; Birgisson, B. Effect of Heavy Traffic Loading on Predicted Pavement Fatigue Life. In Proceedings of the RILEM International Conference on Mechanisms of Cracking and Debonding in Pavements, Nantes, France, 7–9 June 2016. [Google Scholar]
  28. Hu, S.; Zhou, F.; Scullion, T. Load Spectra–Incorporated Fatigue Cracking Model Implementation and Case Study. Transp. Res. Rec. J. Transp. Res. Board 2017, 2640, 1–10. [Google Scholar] [CrossRef]
  29. Wei, L.; Kayser, S.; Wellner, F. Impact of Surface Temperature on Fatigue Damage in Asphalt Pavement. J. Highw. Transp. Res. Dev. 2013, 7, 1–6. [Google Scholar] [CrossRef]
Figure 1. Test section pavement structure.
Coatings 14 00882 g001
Figure 2. Layout of the high-speed weigh-in-motion system.
Coatings 14 00882 g002
Figure 3. Temperature visualization system for pavement structure layer.
Coatings 14 00882 g003
Figure 4. Axial load spectrum: (a) axle load spectrum of single axle; (b) axle load spectrum of single axle with dual wheels; (c) axle load spectrum of tandem; (d) axle load spectrum of tridem.
Coatings 14 00882 g004
Figure 5. Joint axial load spectrum: (a) axle load spectrum of single axle; (b) axle load spectrum of single axle with dual wheels; (c) axle load spectrum of tandem; (d) axle load spectrum of tridem.
Coatings 14 00882 g005aCoatings 14 00882 g005b
Figure 6. Accumulated fatigue damage at a single temperature: (a) axle load spectrum of single axle; (b) joint axle load spectrum of single axle with dual wheels; (c) joint axle load spectra of tandem; (d) joint axle load spectra of tridem.
Coatings 14 00882 g006
Figure 7. Accumulated fatigue damage at different seasonal temperatures: (a) fatigue damage of single axle in four seasons; (b) fatigue damage of single axle with dual wheels in four seasons; (c) fatigue damage of tandem in four seasons; (d) fatigue damage of tridem in four seasons.
Coatings 14 00882 g007
Figure 8. Fatigue damage of different axis types in different seasons.
Coatings 14 00882 g008
Figure 9. Fatigue damage of different calculation methods in different seasons.
Coatings 14 00882 g009
Table 1. Average temperature and modulus of different structural layers.
Structure LayerThickness
(mm)
Spring Temperature (°C)Modulus (Mpa)
SpringSummerAutumnWinterSpringSummerAutumnWinter
SMA-13402539.5253.568033497680325,178
AC-20602438.5253.572734312703326,413
AC-25802235.525380515221731129,234
LSPM-301602032.524.53.593664689805217,779
Cement-stabilized gravel180203324.53.520,18820,18820,18820,188
Graded crushed stone1202034243.5397397397397
Cement-stabilized soil200----219219219219
Subgrade-----67676767
Table 2. Fatigue damage calculation parameters.
TemperatureAxle Load
Characterization
Calculation Period
Calculation plan 120 °CTrue axle weightSingle vehicle
Calculation plan 220 °CEquivalent axle loadSingle vehicle
Calculation plan 320 °CAxle load spectraSingle vehicle
Calculation plan 420 °CEquivalent axle loadSingle month
Calculation plan 520 °CAxle load spectraSingle month
Calculation plan 620 °CEquivalent axle loadOne year
Calculation plan 7Seasonal average temperatureAxle load spectraOne year
Table 3. Distribution coefficients of vehicle type.
Vehicle TypeType 2Type 3Type 4Type 5Type 6Type 7Type 8Type 9Type 10Type 11
Percentage (%)5.3742.641.08010.381.591.7436.191.020
Table 4. Equivalent standard axle loads for different calculation periods.
Single Type 9 VehicleMayOne Year
Vehicle TypeConversion
Factor
Equivalent Standard Axle LoadConversion
Factor
Equivalent Standard Axle LoadConversion
Factor
Equivalent Standard Axle Load
Type 2000.42505983770.46159167856
Type 3000.41312644190.67111989,735
Type 4000.6088451141.6349055419
Type 5000000
Type 6001.35211255171.42810545,554
Type7000.7182972770.7269373720
Type8000.804037860.6879843935
Type 911.000.98279115,7680.919555102,725
Type 10001.1837366620.9659513120
Type 11-1-000
Total 1 27,920 262,064
Table 5. Axle load strain, fatigue life, and fatigue damage of nine types of vehicles.
Measured Axle LoadASLESALs
Axis TypeType 1 Type 5 Type 7 Type 1 Type 5Type 7 Equivalent Standard Axle Load
Axle load (kN)5012018048.75121.5182.25100
Strain   ( μ ε )10.7620.5928.2510.4521.0928.9218.79
Fatigue life 3.91 × 1092.98 × 1088.48 × 1074.40 × 1092.71 × 1087.73 × 1074.28 × 108
Fatigue damage2.55 × 10−103.36 × 10−91.18 × 10−82.27 × 10−103.70 × 10−91.29 × 10−82.34 × 10⁻⁹
Accumulated fatigue damage1.54 × 10−81.69 × 10−82.34 × 10−9
Table 6. Fatigue damage in May.
Fatigue DamageALS MethodESALs Method
Axis TypeSingle AxleSingle Axle Dual WheelsTandemTridemEquivalent Axis
Fatigue damage with four axle types1.50 × 10−62.72 × 10−72.46 × 10−56.19 × 10−51.50 × 10−5
Accumulated fatigue damage9.07 × 10−51.50 × 10⁻⁵
Disclaimer/Publisher’s Note: The statements, opinions and data contained in all publications are solely those of the individual author(s) and contributor(s) and not of MDPI and/or the editor(s). MDPI and/or the editor(s) disclaim responsibility for any injury to people or property resulting from any ideas, methods, instructions or products referred to in the content.

