Article

Bamboo-like MnO2/TiO2 Nanotube Arrays with Enhanced Photocatalytic Degradation

School of Physics Science and Technology, Lingnan Normal University, Zhanjiang 524048, China
*
Author to whom correspondence should be addressed.
Coatings 2024, 14(7), 894; https://doi.org/10.3390/coatings14070894
Submission received: 24 May 2024 / Revised: 10 July 2024 / Accepted: 16 July 2024 / Published: 17 July 2024
(This article belongs to the Collection Advanced Surface Coating of Nanoparticles)

Abstract

:
In this paper, the photocatalytic degradation of methyl orange solution by MnO2/TiO2 nanotube arrays (NTAs) with different structure was studied. Initially, bamboo-like TiO2 NTAs with folded tube walls were synthesized using the anodic oxidation method. Subsequently, MnO2 nanowires/TiO2 NTAs and MnO2 nanoparticles/TiO2 NTAs were prepared via high-temperature and low-temperature hydrothermal methods, respectively. Photocurrent-time transient tests revealed that MnO2 nanoparticles/TiO2 NTAs produced by the low-temperature hydrothermal method exhibited a relatively good photocurrent response. All the deposited MnO2/TiO2 bamboo-like nanotube nanocomposites were tested for photocatalytic decomposition under different pH and light conditions. The results showed that MnO2 could adsorb and degrade methyl orange in the absence of light and acidity, and the degradation degree was proportional to the concentrations of Mn. MnO2 was stimulated to produce photogenic electrons, which migrated to the surface of the TiO2 and extended the life of photogenic charge carriers.

1. Introduction

The increasing contradiction between severe environmental pollution and the increasing demand for clean water supply has prompted the development of effective and sustainable water treatment technologies [1,2]. Photocatalysis, taking advantage of sunlight to degrade pollutants, has become a promising and advanced oxidation technology for wastewater treatment [3,4]. Methyl orange (MO) is an acidic anionic mono-azo dye that is widely and extensively used in textiles, laboratory studies, and other commercial items. Its usage can lead to adverse effects in humans such as increased heart rate, vomiting, shock, etc. Therefore, it is imperative to develop robust and efficient photocatalytic systems focusing primarily on semiconductors and nanomaterials based on metal oxides. However, conventional TiO2 photocatalysts with a wide band gap of 3.2 eV can only absorb 5% of the UV of sunlight, leaving the visible and near-infrared regions underutilized [5,6]. The development of photocatalysts with good chemical stability, non-toxic and high efficiency has a very good application prospect [7,8]. For this purpose, a large number of organic or inorganic dyes [9], precious metals [10], and narrow-band gap semiconductors [11] were coupled with TiO2 to improve the photocatalytic efficiency. Among them, the composite material synthesized by narrow-band gap oxide can effectively improve the photocatalytic activity of TiO2 by promoting the absorption of visible light and inhibiting the combination of photocarriers [12].
MnO2 is widely recognized for its applications in capacitors [13] and as a catalyst [14]. Contrary to earlier limited reports, recent advances have shown that MnO2, when coupled with TiO2, can actually enhance photocatalytic activity under certain conditions. This enhancement is attributed to the formation of p-n junctions or heterojunctions, which can facilitate charge separation and reduce recombination [15]. MnO2 with a narrow band gap of 0.26 to 2.7 eV can be used as a deep-level impurity to promote photoelectron–hole pair recombination [16,17,18]. The UV–visible spectra indicated the excellent whole region adsorption properties of MnO2/TiO2 [18]. MnO2@TiO2 nanotubes have been prepared and band gap width of the composite materials can be adjusted by MnO2 loadings [19]. Li et al. presented enhanced oxygen evolution reaction activity due to synergistic effect between MnO2 and TiO2 [20]. Furthermore, it was found that MnO2/TiO2 photoelectrodes can also enhanced the generation of hydroxyl radicals, which played a central role in the packaged electronic circuit system [21]. TiO2/MnO2 also showed significant activity in photocatalytic degradation of acidic organic solutions in visible light [18,22].
As mentioned above, some studies believed that MnO2-modified TiO2 can improve the catalytic activity, as well as make the band gap of the catalyst redshift and improve the visible light utilization efficiency. However, some studies believed that MnO2, as a deep-level impurity, can promote the photoelectron–hole pair recombination. Therefore, it was necessary to conduct a detailed study on the performance and mechanism of MnO2/TiO2 under different conditions. To the best of our knowledge, bamboo-like MnO2/TiO2 nanotube arrays as a heterostructured photocatalyst for sunlight-driven photodegradation has not been explored yet. In this experiment, MnO2/TiO2 NTAs nanocomposites were modified on the surface of nanobamboo structure arrays by high-temperature and low-temperature hydrothermal after standing methods. Moreover, a heterogeneous junction was formed on the contact interface of agglomeration between TiO2 and MnO2.

2. Experiment Details

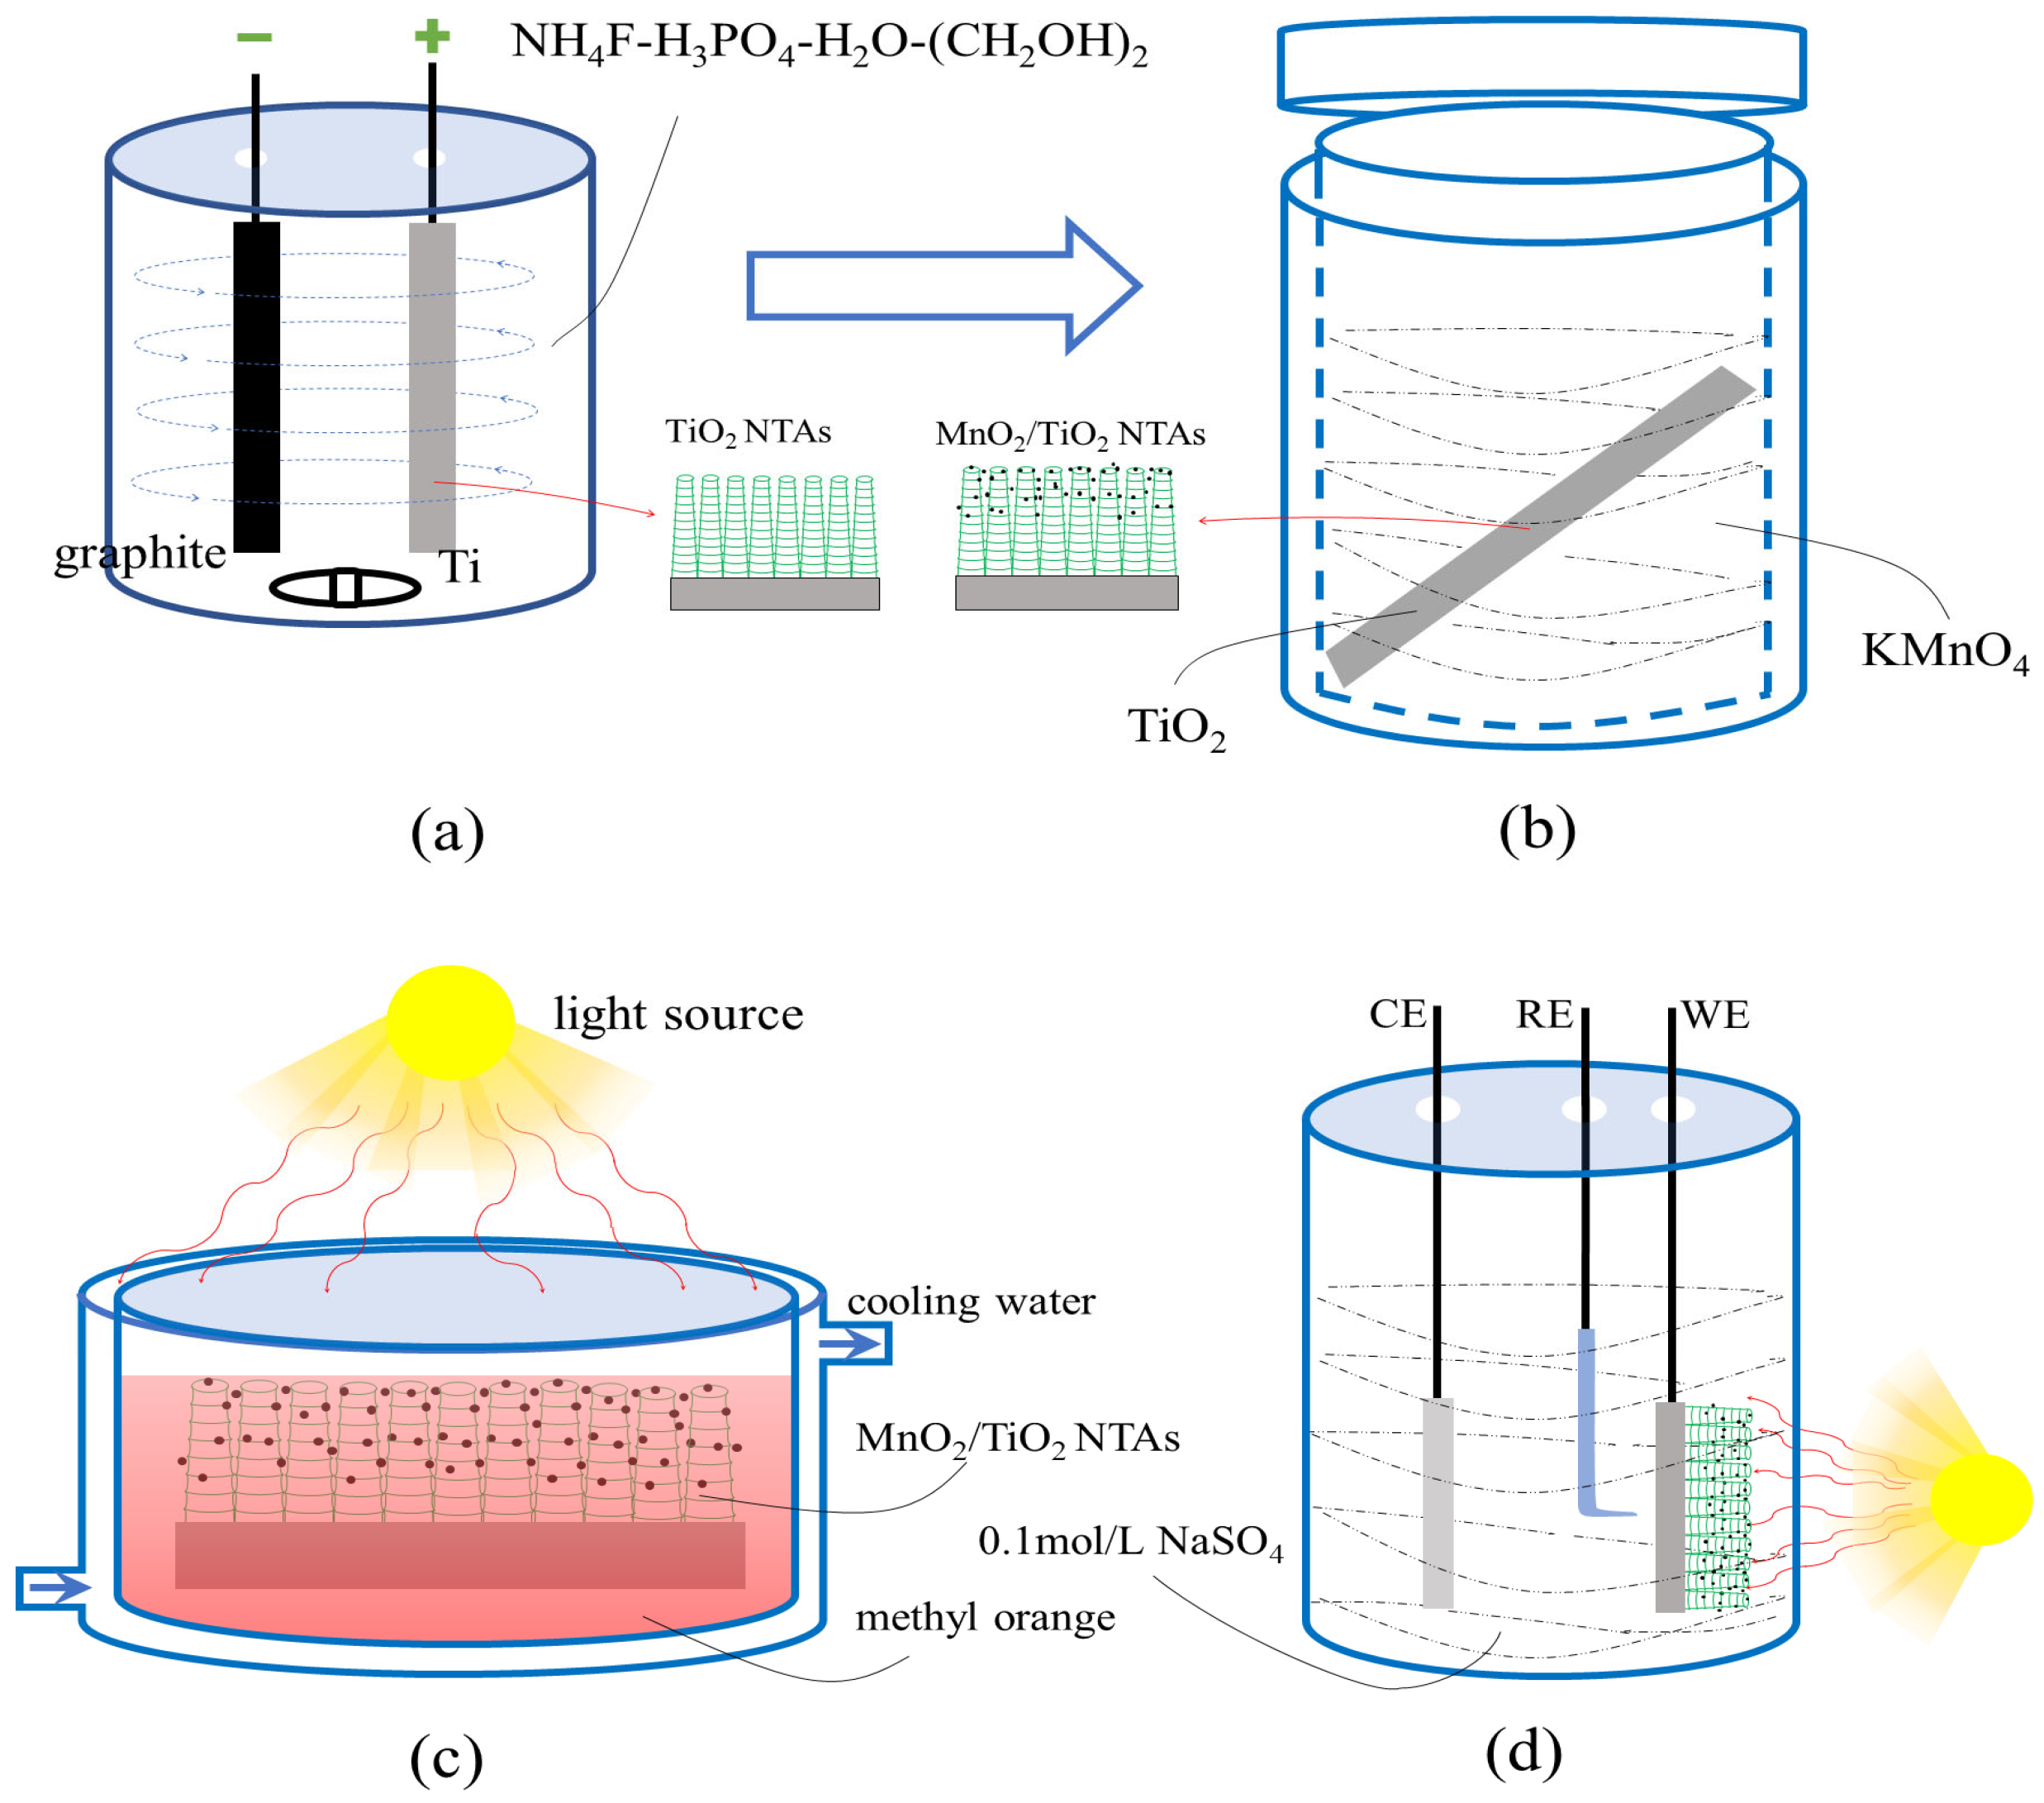
2.1. Preparation of Bamboo-like TiO2 NTAs

Titanium sheets (99.99% purity, 0.25 mm thickness) were cut into 1.5 × 1.5 cm2 pieces for the growth of titanium dioxide nanotubes by anodic oxidation (Figure 1a). The titanium sheet was polished to a bright surface using several types of sandpaper. Then, agent A305, ethanol (C2H5OH, ≥99%) and deionized water were used in turn for 10 min of ultrasonic cleaning and dried. Nanobamboo-structured TiO2 arrays were prepared by anodic oxidation using NH4F-H3PO4-H2O-(CH2OH)2 electrolytic liquid system. Titanium sheets were used as the anode and graphite sheets as the cathode. The electrodes were spaced 2 cm apart, the electrolyte was stirred uniformly, and a constant voltage of 60 V was applied for a deposition time of 3 h.

2.2. Preparation of MnO2/TiO2 NTAs

For MnO2 nanowire/TiO2 nanoarrays grown by high-temperature hydrothermal method (MT-HM) as shown in Figure 1b, KMnO4 solutions (purity ≥ 99.0%) with concentrations of 0.005, 0.010 and 0.015 mol/L were first prepared. Then, weigh 0.05 g of Polyvinylpyrrolidone (purity ≥ 99.0%) and mix it evenly to obtain solution A. Place the prepared bamboo-like TiO2 NTAs into a PTFE liner, pour in Solution A, and heat at 650 °C for 4 h in a muffle furnace. Afterwards, rinse the samples with deionized water, dry them, and anneal at 700 °C.
For MnO2 nanoparticles/TiO2 nanoarrays prepared by low-temperature hydrothermal after standing method (MT-LM), prepare KMnO4 solutions with concentrations of 0.005, 0.010, and 0.015 mol/L. The prepared bamboo-like TiO2 NTAs were immersed in KMnO4 solution at a certain concentration. After a period of time, add a small amount of concentrated sulfuric acid (purity ≥ 99.0%) to continue to stand, and then move to a water bath at a certain temperature. Heat preservation temperature was kept at 65 °C, 75 °C, and 85 °C for 30 min. After being taken out, the samples were cleaned with deionized water, then dried and annealed.

2.3. Characterization and Activity Analysis

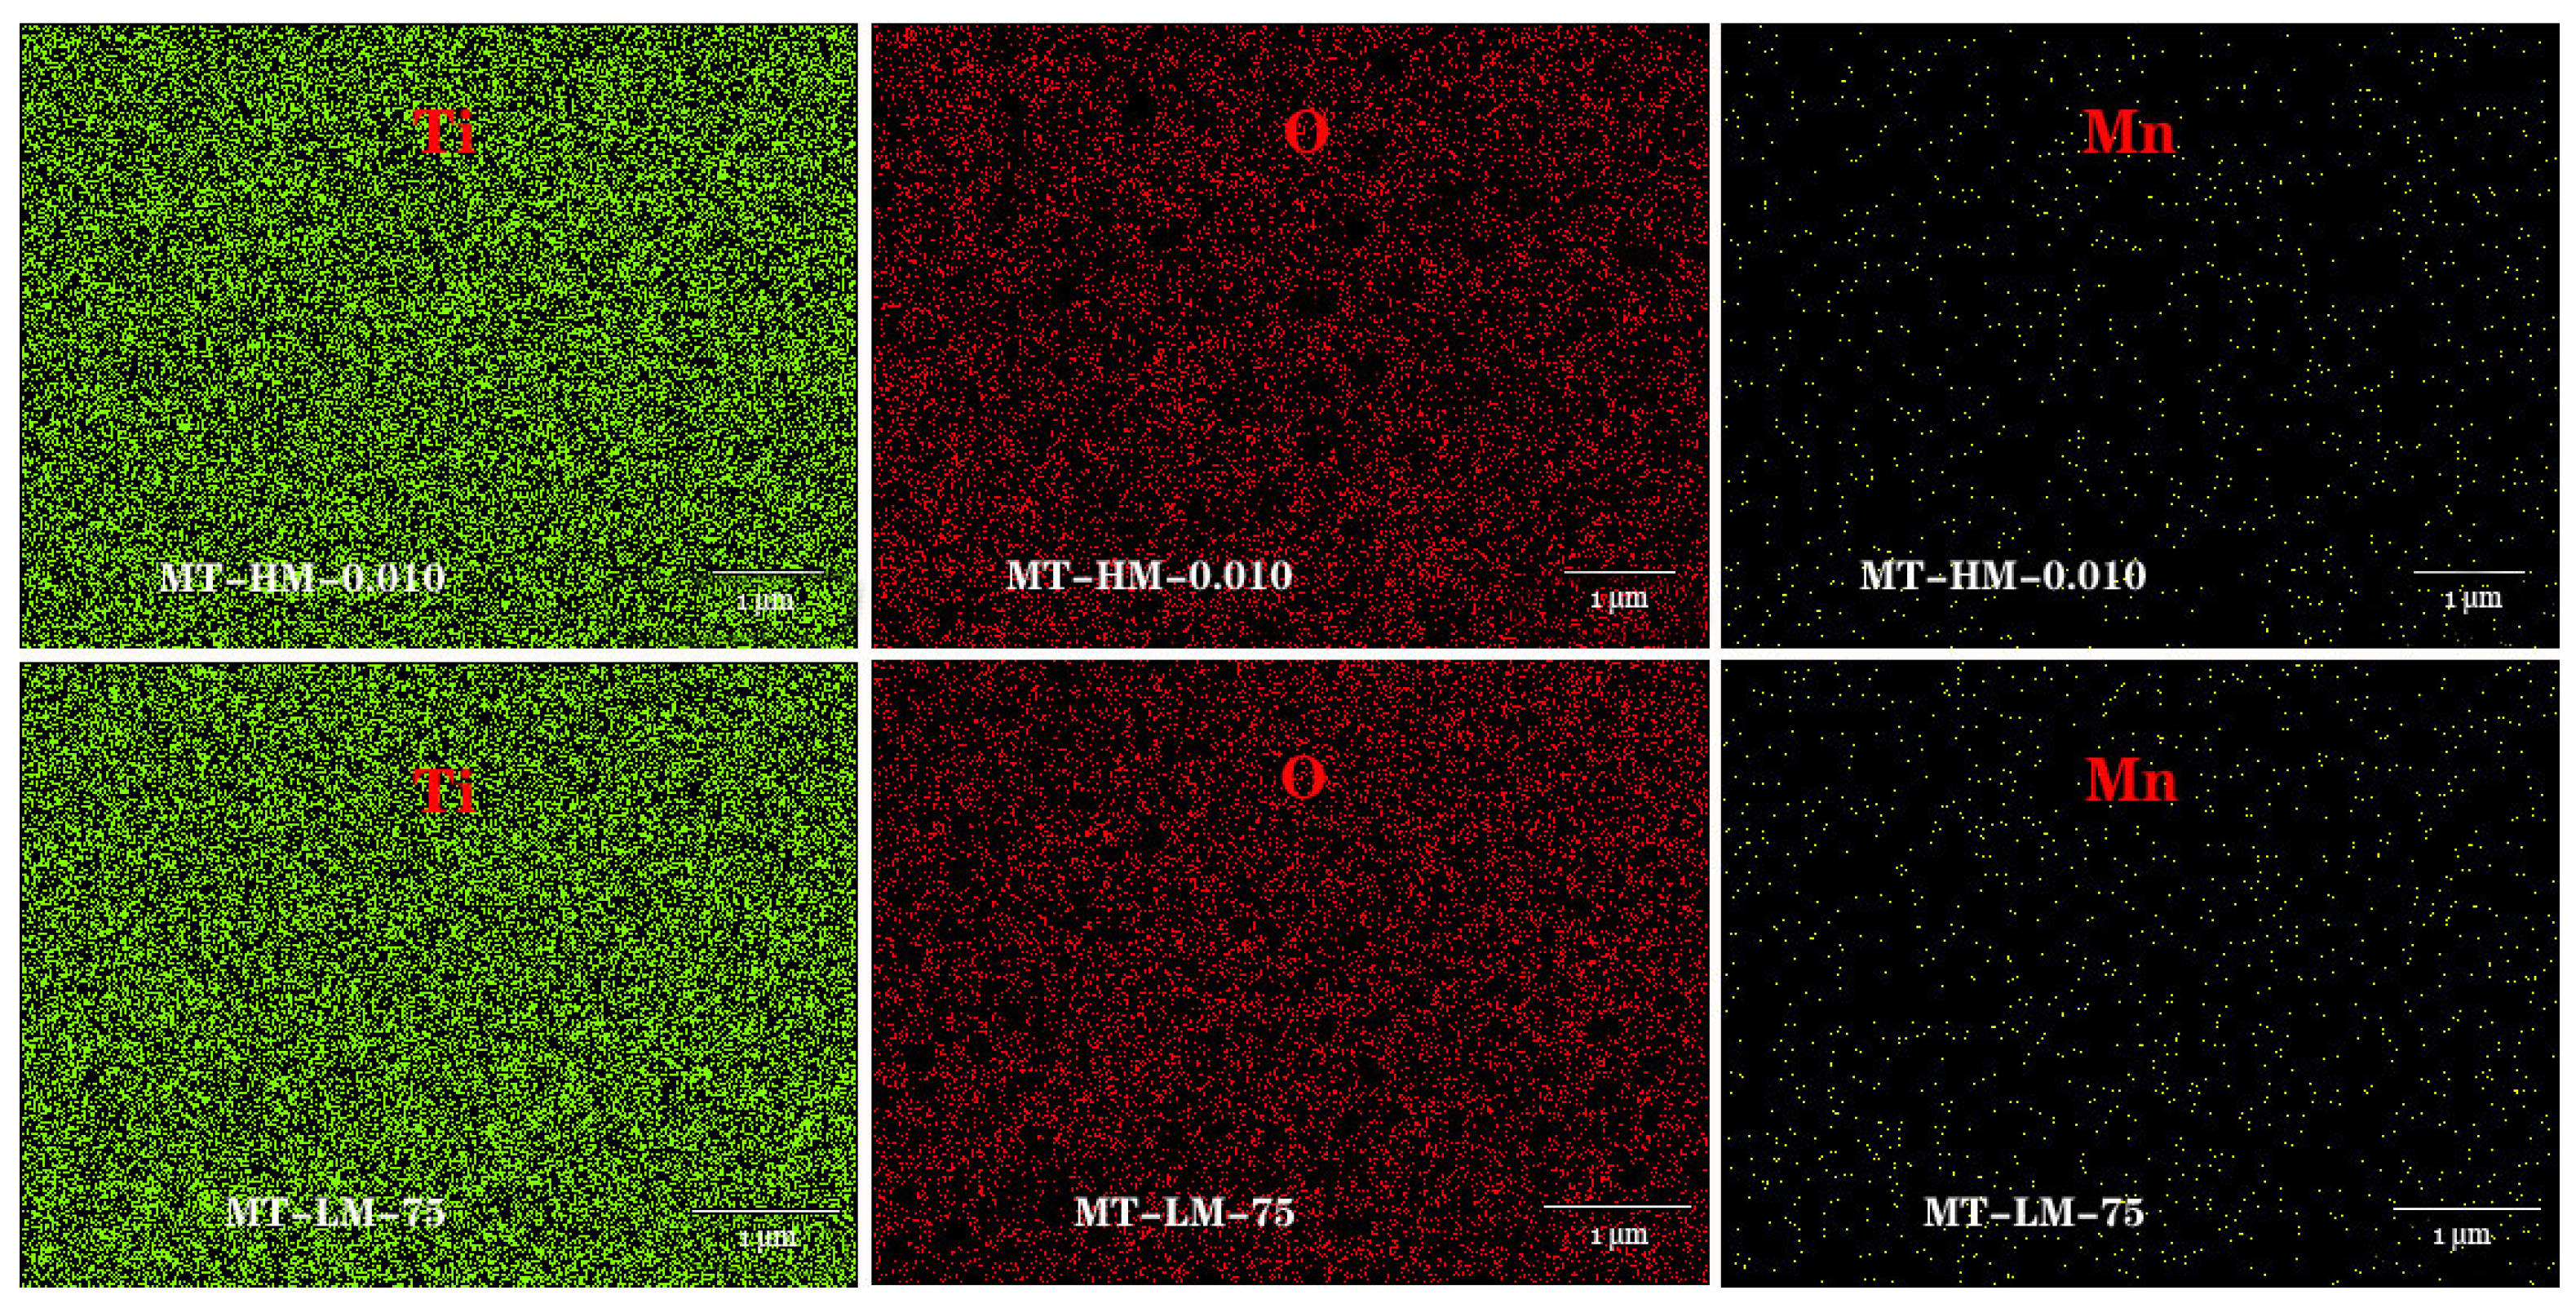
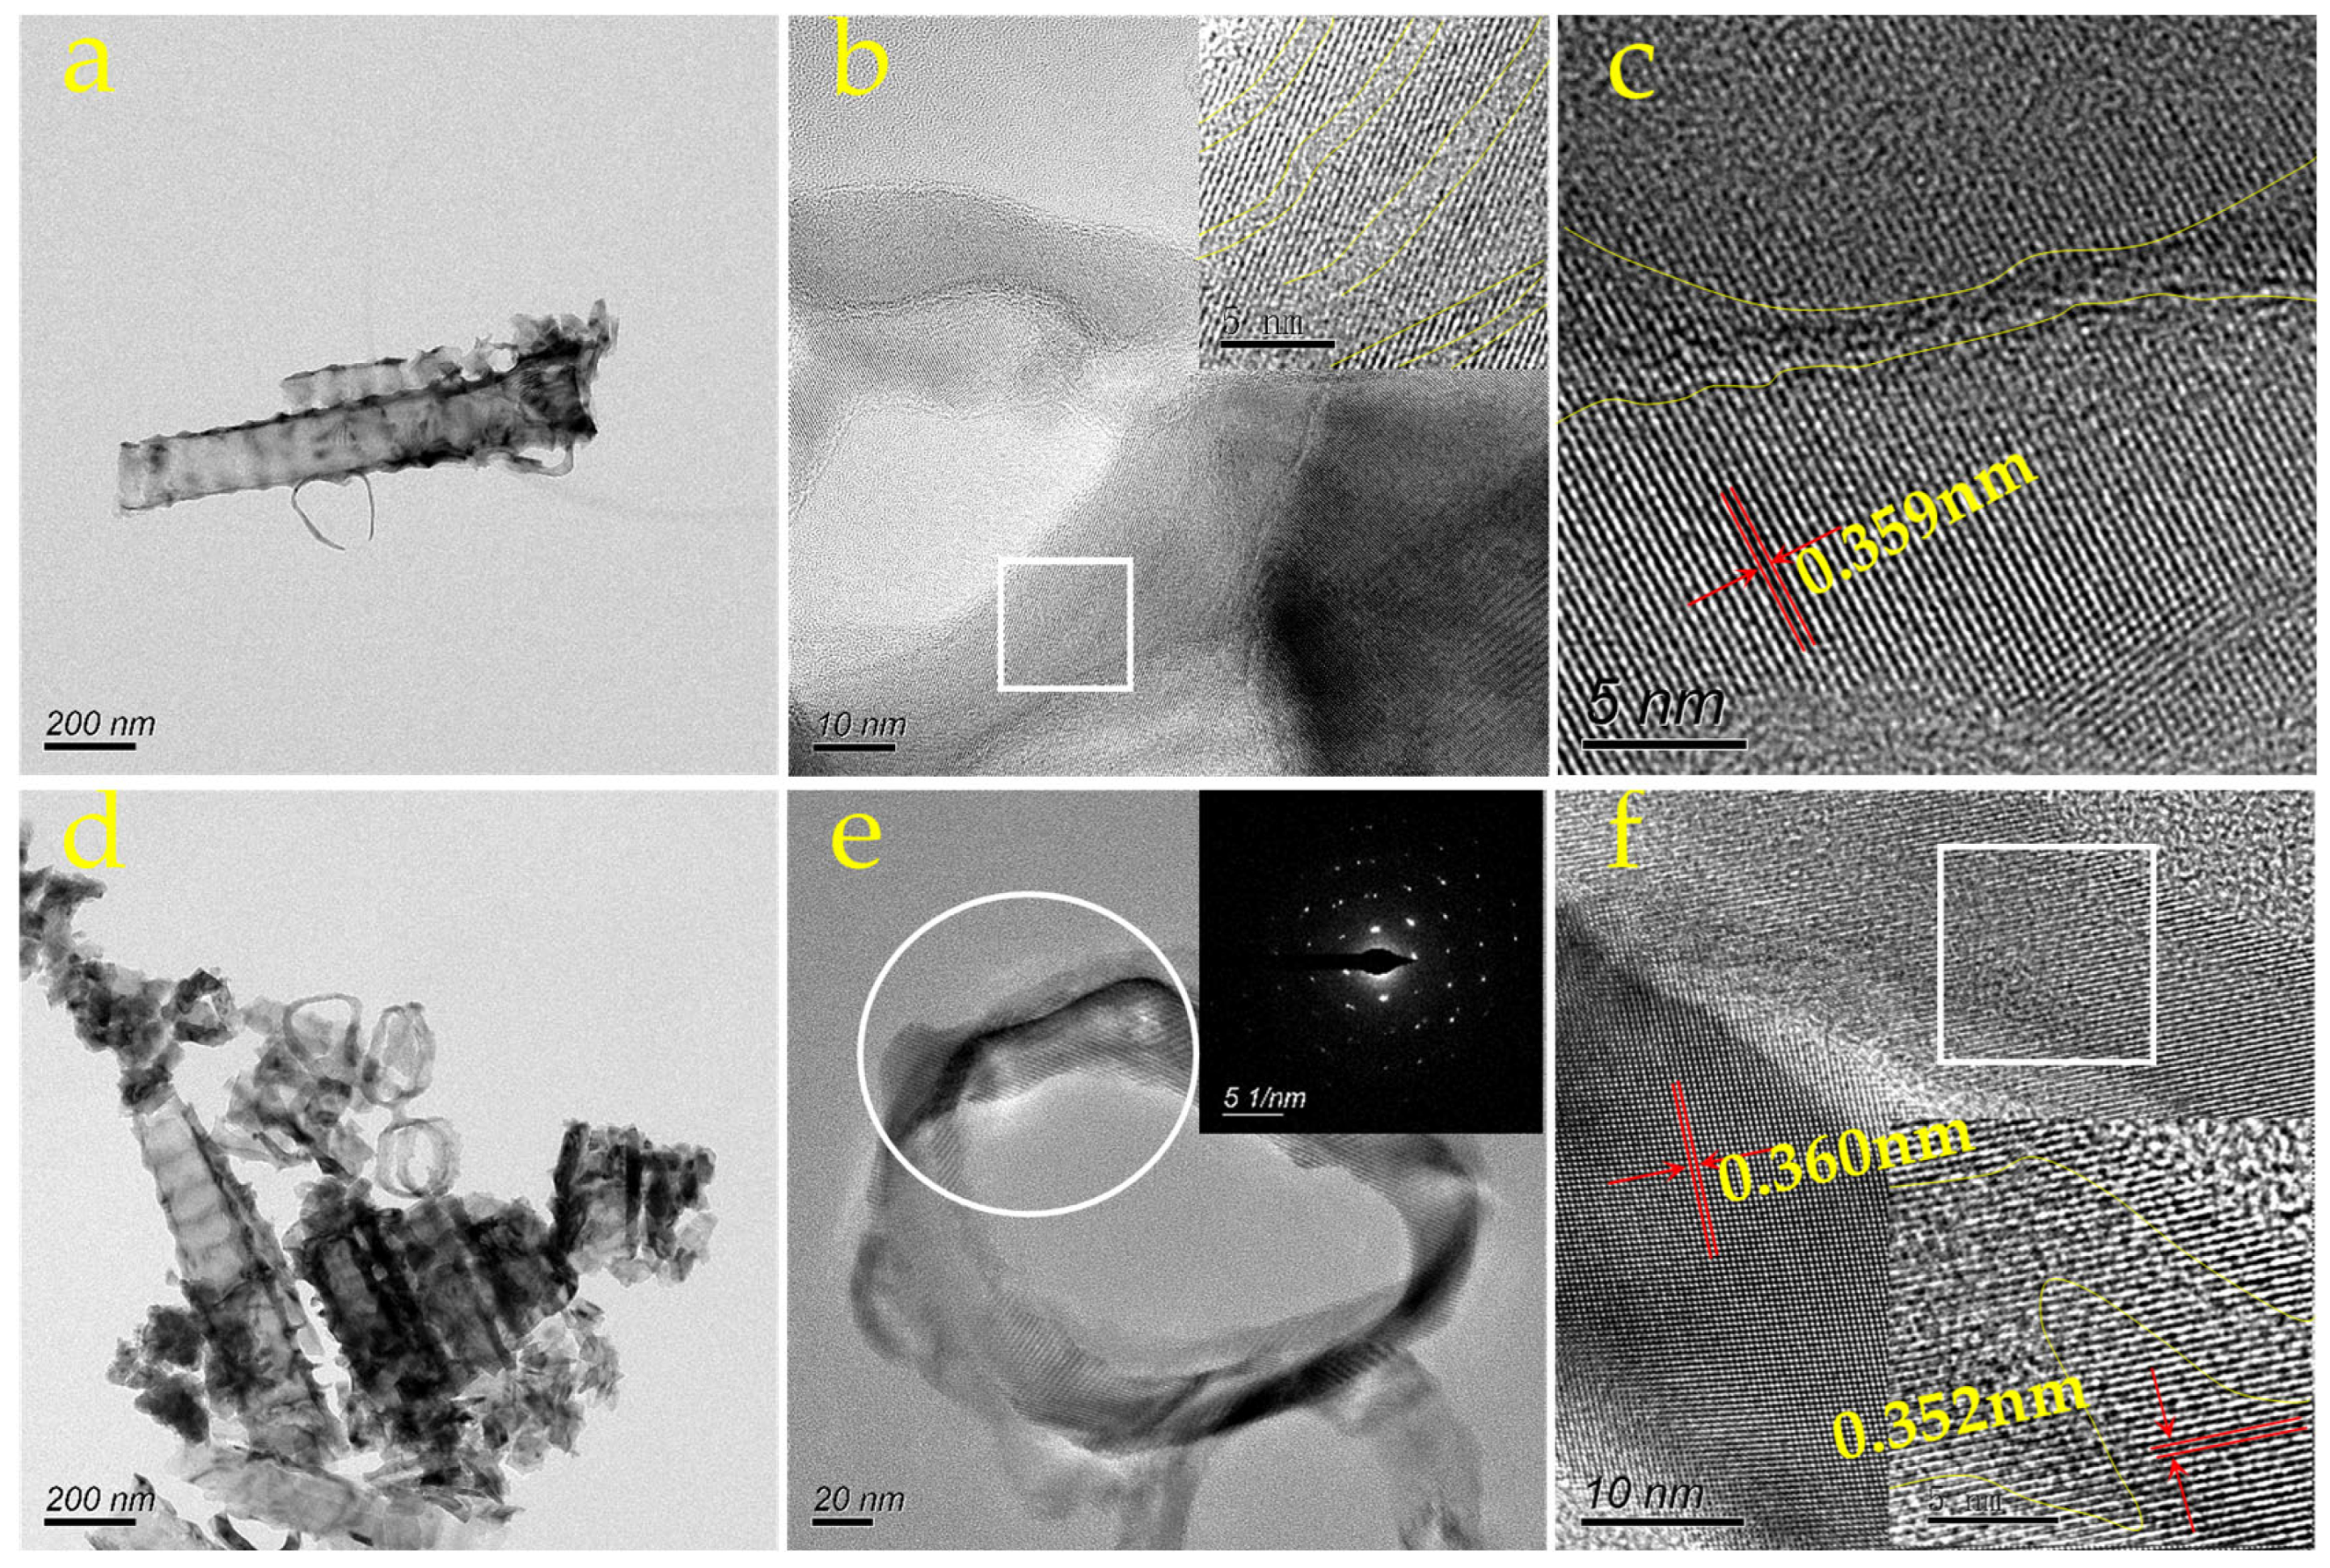
2.3.1. Characterization

Scanning electron microscope (SEM, XL-30, Philips, Eindhoven, The Netherlands) was used to observe the morphological characteristics of the samples with test voltage of 30 kV. Energy spectrum analyzer (EDS, Philips, Eindhoven, The Netherlands) was used to analyze the elemental concentrations of the samples. The phase structure of the sample was analyzed by X’Pert PRO (PANalytica, The Netherlands) X-ray diffractometer with test voltage of 40 kV. The microstructure of the samples was observed by FEI Tecnai G2 F20 (Thermo Fisher Scientific, Waltham, MA, USA) field emission transmission electron microscope (TEM, acceleration voltage: 200 kV). Samples for TEM imaging are prepared by dropping the dilWute colloidal suspension onto a carbon-covered copper grid. Evaluate the product’s light absorption properties using the UV756-CRT UV-Vis-NIR spectrophotometer.

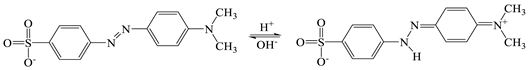
2.3.2. Photocatalytic Testing

Ultraviolet integrated electronic lamp (220 V, 25 W) was used to provide UV light source, while CEL HXF300, (Beijing China Education Au-light Co., Ltd., Beijing, China) xenon lamp (14 V, 20 A) was used to provide simulated solar light source. Photocatalytic degradation of organic dyes was carried out on a self-built platform of photocatalytic unit. The platform of the photocatalytic device was mainly composed of a light source, a low-temperature coolant circulation device, a two-way magnetic stirrer, and a double-layer jacket reactor (Figure 1c). The photocatalytic activity of the samples was evaluated by degrading MO dye under xenon lamp source and the actual irradiation intensity was measured to be 0.4 kW/m2. The curves of absorbance value before degradation was measured and the maximum absorbance value before degradation was denoted as A0. The maximum absorbance value after degradation was denoted as At. The evaluation of photocatalytic activity was reflected by the concentration change in methyl orange solution, namely the relationship between Ct/C0 and time. It was assumed that the absorbance of methyl orange was linearly related to its concentration [23], and Ct/C0 was expressed as Formula (1):
Ct/C0= At/A0
The efficiency of photocatalytic degradation of the organic dye solution was expressed as Formula (2) [24]:
η(%) = 100% × (1 − Ct/C0) = 100% × (1 − At/A0)

2.3.3. Photocurrent Response Test

The electro-chemical timing current method was used to characterize the photoelectric response activity. The electrochemical measurement was carried out under the traditional three-electrode system, with the auxiliary electrode being Pt electrode, saturated calomel SCE electrode being reference electrode, and MnO2/TiO2 NTAs as the working electrode. The Na2SO4 solution with concentrations of 0.5 mol/L was used as the electrolyte. During testing, a bias voltage of 0.1 V was applied to the working electrode, and simulated sunlight was provided by a CEL-HXF300 xenon lamp (14 V, 20 A). Before illumination, the photocatalytic activity was measured in the dark for 30 min to reach adsorption equilibrium.

3. Results and Discussion

3.1. Characterization Results

The EDS element content test was carried out on the composite materials prepared by the two methods and the results are shown in Table 1. Figure 2 shows the content changes in elements in different MnO2/TiO2 NTAs samples. The content of Mn in MnO2 nanowire/TiO2 nanoarrays (MT-HM) increased with the increasing of KMnO4 concentration. The elements of Ti first decreased and then stabilized, while the elements of O first increased and then stabilized. The Mn content in MnO2 nanoparticle/TiO2 array (MT-LM) increased with the increase in temperature. This increase in MnO2 deposition on the TiO2 nanotubes is due to the increased solubility of MnO2 in the KMnO4 solution as the temperature rises. It was worth noting that the concentration of Mn, Ti and O for MnO2 nanowire/TiO2 nanoarrays (MT-HM) prepared with KMnO4 concentrations of 0.010 mol/L was similar to that of MnO2 nanoparticle/TiO2 array (MT-LM) at the heating temperature of 75 °C. Figure 3 shows the counting points of EDS of MT-HM-0.010 and MT-LM-75, which indicated that the distribution of Mn element in TiO2 NTAs was relatively uniform.
The morphology of TiO2 NTAs and MnO2/TiO2 NTAs was observed by SEM and shown in Figure 4. Figure 4a–c show the undoped TiO2 NTAs, which was 1.5 μm in length, 100 nm in diameter, and 30 nm in thickness of the tube and was shaped like a bamboo node. It was reported that the water content in the organic solvent was the factor for the appearance of the folds [25]. Figure 4d,e show the surface and squint images of MnO2 nanoparticle/TiO2 nanoarrays (MT-LM), which indicated that MnO2 was wrapped around the nozzle and its vicinity in the form of small agglomerates or amorphous particles. In combination with the attenuation and migration of the XRD pattern shown in Figure 5, it can be concluded that heterogeneous junctions are formed at the contact interface in small agglomerates [15]. Figure 4f shows the morphology of the remaining particles after hydrothermal heating, and the aggregation morphology of nanoparticles can be clearly seen. Figure 4g,h show the surface and squint of MnO2 nanowire/TiO2 nanoarrays (MT-HM). KMnO4 was decomposed by hydrothermal heating to form MnO2, and a small part reacted with TiO2 in and near the nozzle to form a small agglomeration and heterogeneous junction. As shown in Figure 4i, MnO2 nanowires with small wire diameter were attached to the surface, while the rest were left in the residue. MnO2 nanowires were induced by most of the added surfactant polyethylene vrolidone [16].
The XRD patterns of TiO2 NTAs, MT-HM and MT-LM are shown in Figure 5. The diffraction peaks with 2θ values of 25.3°, 37.9°, 48.0°, 54.0°, 55.1°, and 62.8° can be attributed to (101), (004), (200), (105), (211), and (204) crystal orientation of TiO2 with anatase structure (PDF#21-1272). Diffraction peaks with other 2θ values in Figure 5 corresponded to Ti base, and there was no diffraction peak related to Mn. The reason may be that MnO2 content was too little to be detected or that MnO2 was a mixture of amorphous and micro-crystalline [26,27]. However, the samples prepared by the same method had different diffraction intensities. For the samples of MT-HM-0.005, 0.010, and 0.015, the diffraction of MT-HM-0.005 was the weakest, MT-HM-0.015 was slightly weaker, and MT-HM-0.010 was the strongest. Among the samples of MT-LM-65, 75, and 85, the diffraction of MT-LM-65 was the weakest, MT-LM-85 was slightly weaker, and MT-LM-75 was the strongest. MnO2 with a small agglomeration or amorphous shape was mainly supported on the surface of TiO2, which would influence the crystallization state of anatase TiO2.
The micro-structural image of MnO2 nanowires/TiO2 NTAs labeled as MT-HM-0.015 is shown in Figure 6a–c, and its shape was similar to that of TiO2 NTAs shown in Figure 4a. In Figure 6b, the stratified distribution of crystalline and amorphous can be clearly seen. In Figure 6c, the lower half was clearly demarcated from the upper half, and the crystallization of the upper half was significantly poorer than that of the lower half, and amorphous phase appeared. The crystal plane spacing of the lower half of Figure 6c was measured to be 0.359 nm, which was identical to the crystal plane spacing data of TiO2 determined by XRD. The microstructure of MnO2 nanoparticles/TiO2 NTAs labeled as MT-LM-85 is shown in Figure 6d–f. The diffraction spots shown in Figure 6e were identical to that of TiO2 with anatase structure. In Figure 6f, crystalline and amorphous sections of TiO2 and MnO2 can be clearly seen in the enlarged view. At the same time, amorphous and poor crystalline sections also appeared in the area surrounded by yellow lines, which explained the weakening of the diffraction peaks of MT-HM-0.015 and MT-LM-85 in Figure 6.

3.2. Photocatalytic Activity

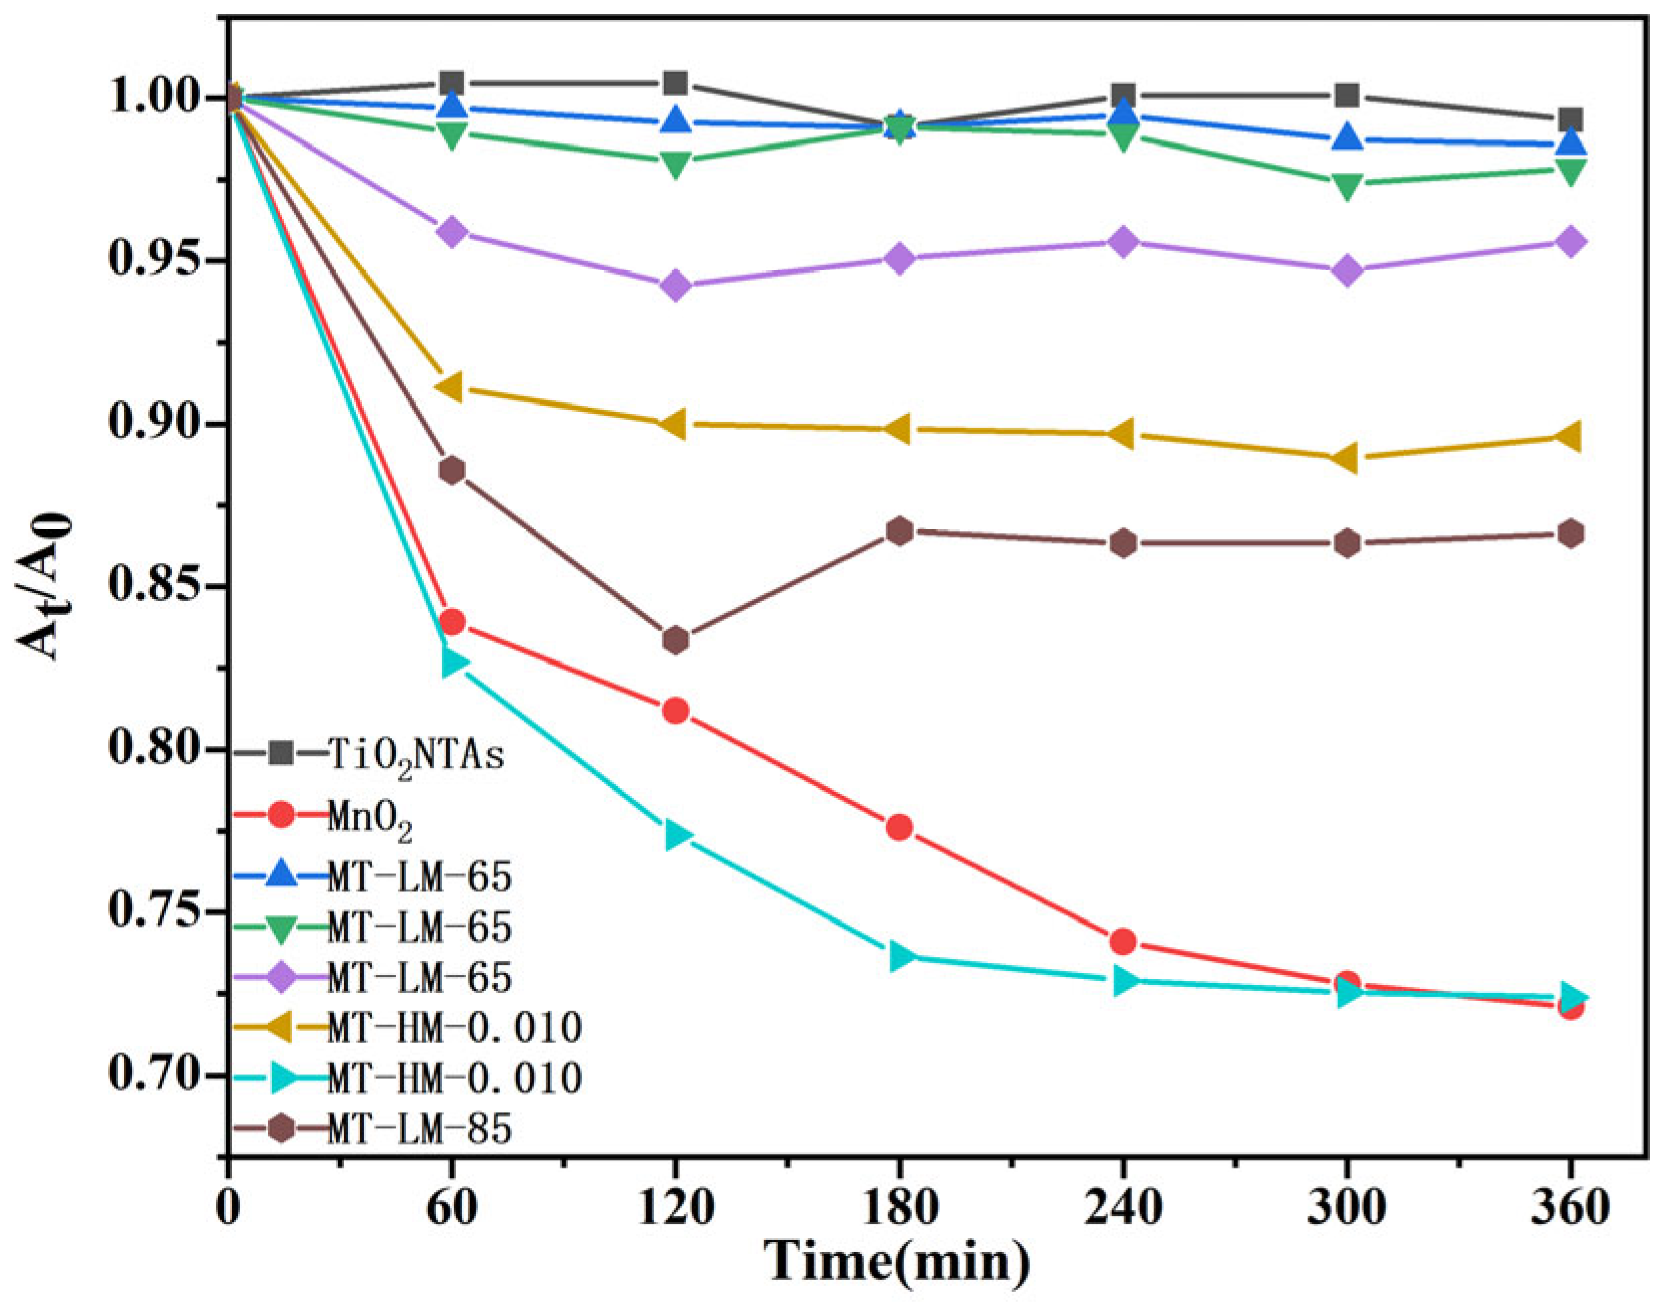
3.2.1. Adsorption and Degradation in the Absence of Light

When assessing the adsorption and degradation activity of MnO2/TiO2 nanotube arrays (NTAs), we initially examined their interaction with methyl orange solution under no-light conditions, as depicted in Figure 7. In acidic environments, MnO2 engages in redox reactions with methyl orange adsorbed on the surface, effectively catalyzing its degradation [28]. The experimental data reveal that the degradation efficiency of methyl orange within the MT-HM and MT-LM series is directly proportional to the Mn content and significantly surpasses that of TiO2 NTAs without MnO2 doping. Additionally, the degradation activity of MnO2 showed a decreasing trend during the test, dropping from an initial value of 0.84 to 0.72. This further confirms that although MnO2’s activity gradually decreases under no-light conditions, its degradation effect remains significant.

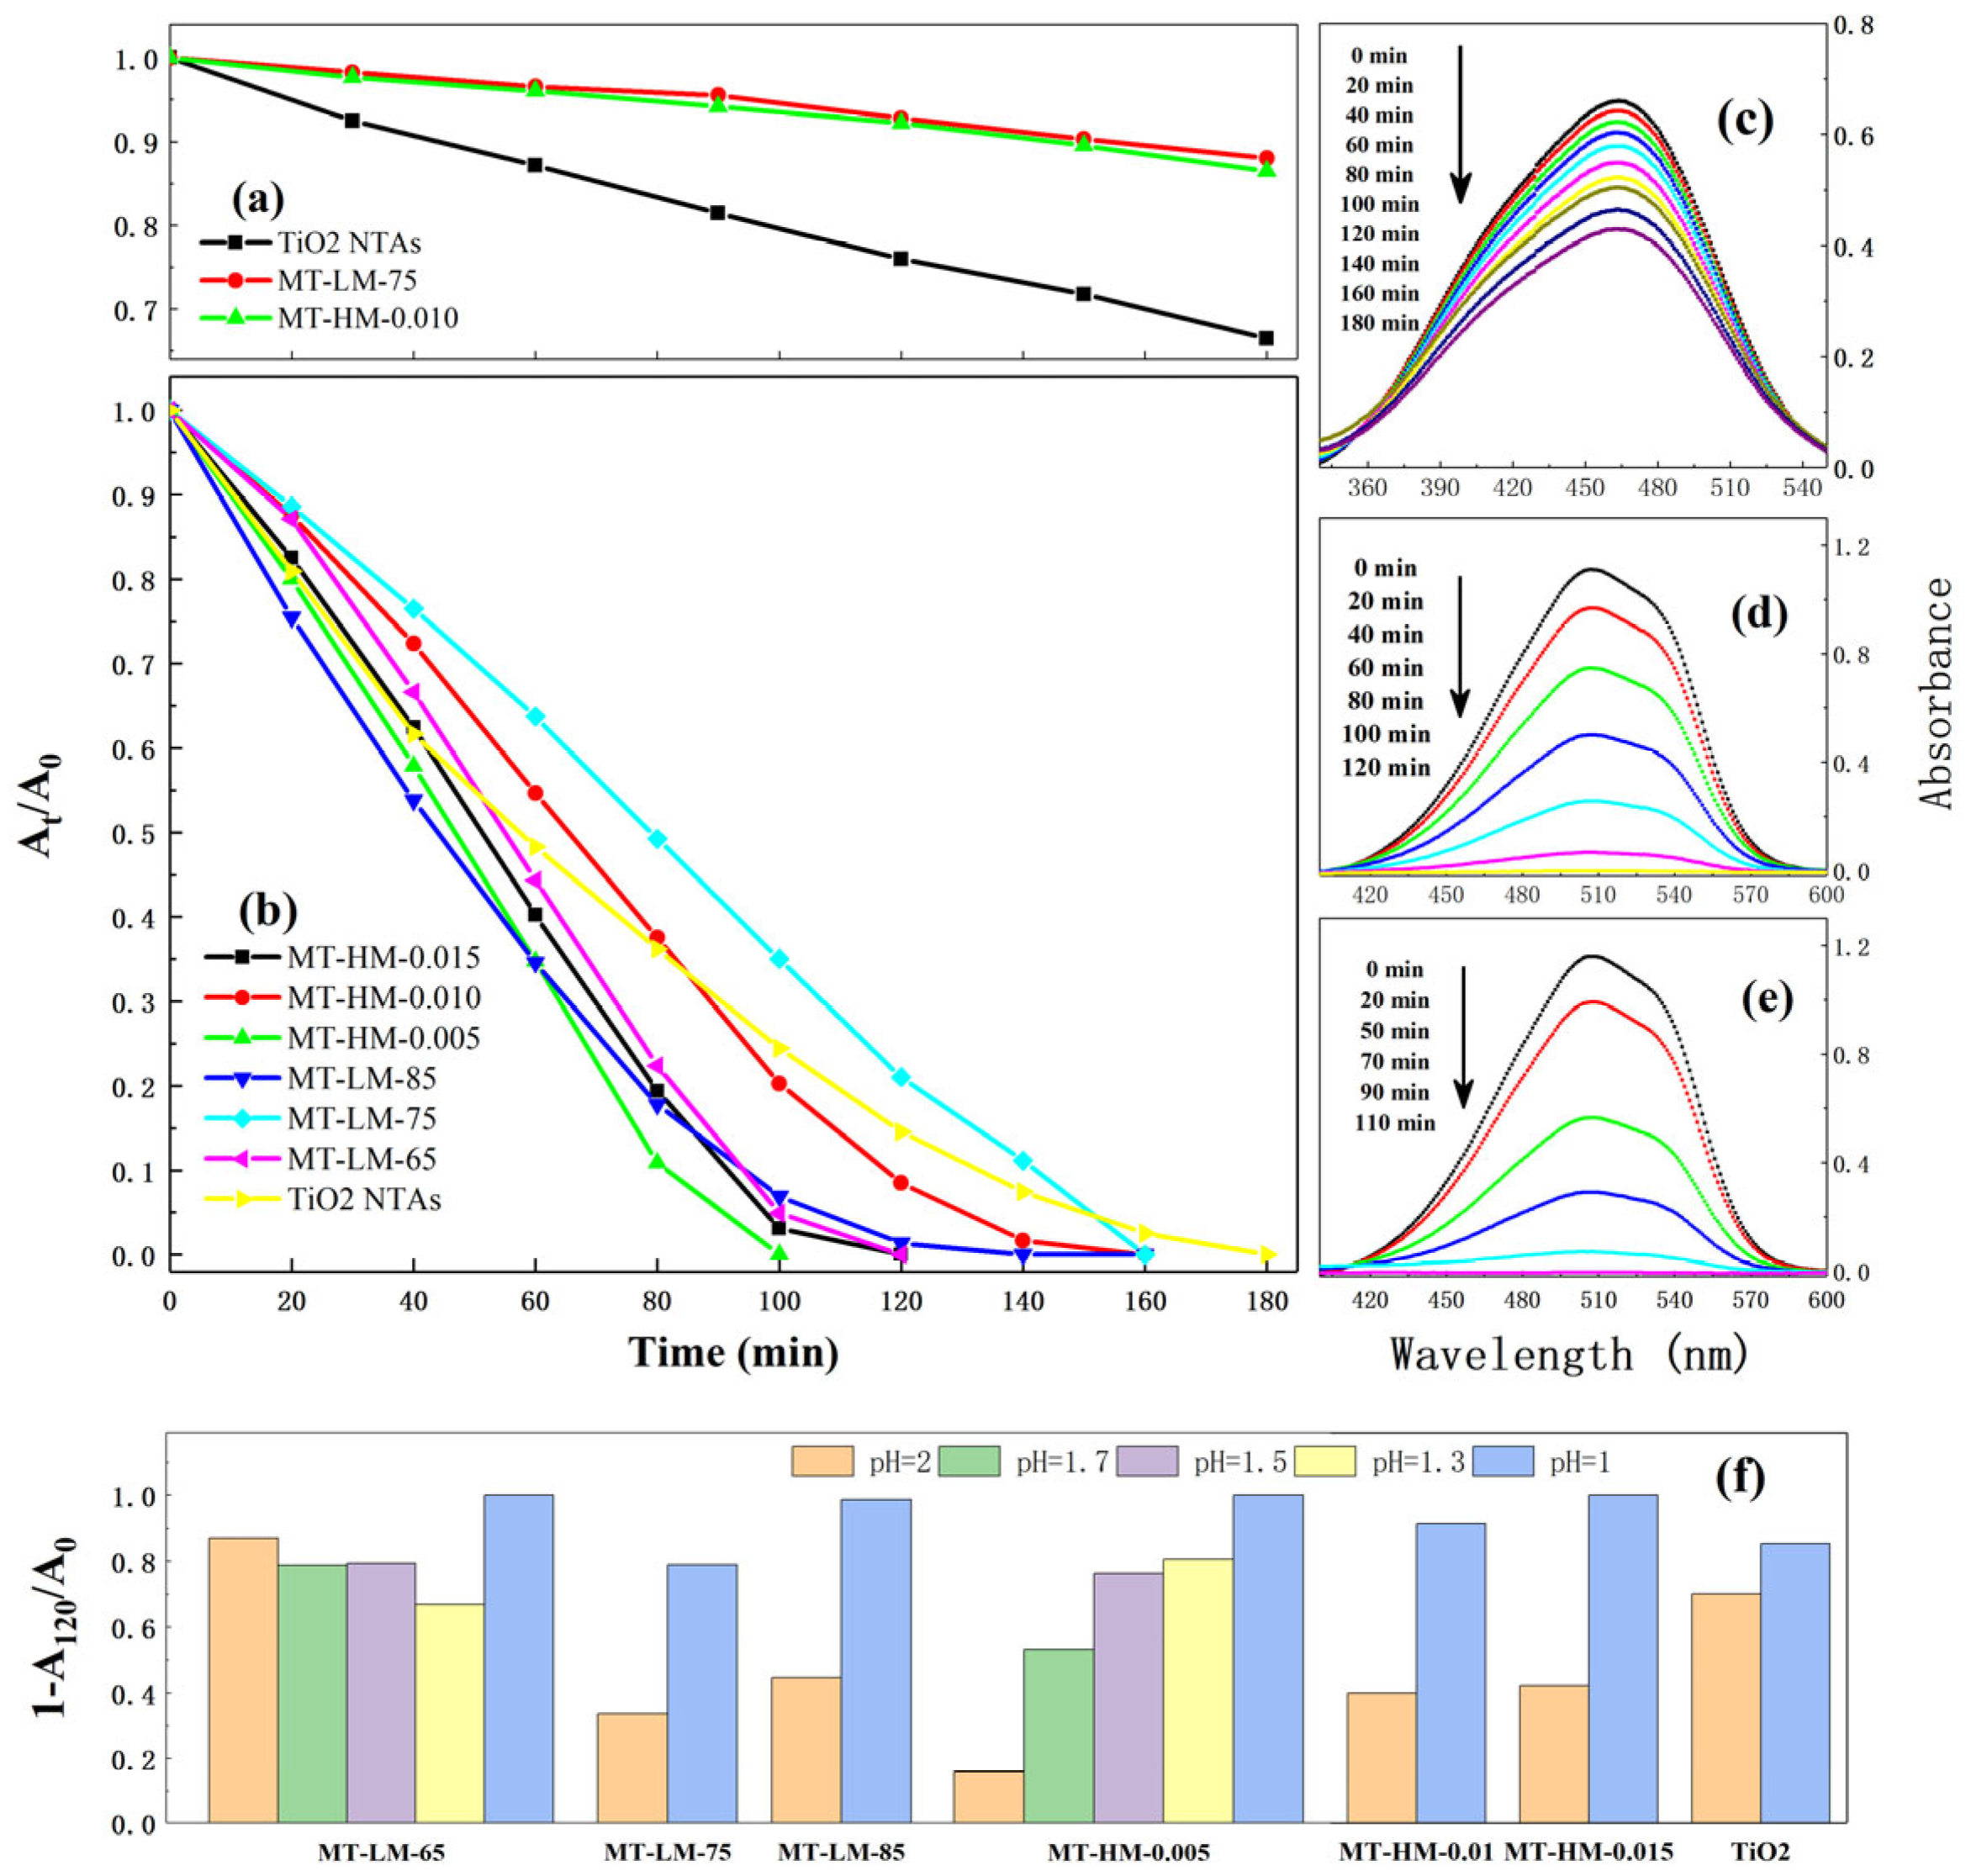
3.2.2. Photocatalytic Activity under UV Light

The photocatalytic activity of TiO2 NTAs, MT-HM-0.010 and MT-HM-75 were tested in methyl orange solution at pH = 7 and is shown in Figure 8. The activity sequence of samples after degradation of 180 min was as follows: TiO2 NTAs> MT-HM-0.010 > MT-HM-75. According to Formula (2), the efficiency of TiO2 NTAs after annealing at 180 min was 35%, while the degradation rates of MT-HM-0.010 and MT-HM-75 were far lower than that of TiO2 NTAs. The band gap width of MnO2 was between the band gap of anatase TiO2, and acted as the deep-level impurity of TiO2 [29].
The activity diagram of degradation of methyl orange solution with pH = 1 is shown in Figure 8b, and the activity of MT was greater than that of TiO2 NTAs. Since acidic pH can generate reactive oxygen species which could influence the performance of the reaction. Photocatalytic performance under catalyst-free conditions at pH 1 was performed and is shown in Figure S1. It can be seen in Figure S1 that only 11.8% of the MO can be degraded after 3 h irradiation without any catalysts. The activity sequence degraded for 180 min was as follows: MT-HM-0.005 > MT-LM-65 > MT-HM-0.015 > MT-LM-85 > MT-HM-0.010 > MT-LM-75> TiO2 NTAs. According to Formula (2), the degradation efficiency of all samples can reach 100% within 180 min at pH = 1. There was no significant difference in the efficiency of the whole degradation process between MT-HM-0.015, MT-HM-0.005, MT-LM-85 and MT-LM-65, which was consistent with the XRD results. It can be considered that the crystallinity of MT series affected the activity of materials in methyl orange solution with pH = 1 under UV light. In Figure 8c–e, it can be observed that the wavelength of the highest absorbance in the absorption spectrum was not shifted, which proved that methyl orange degradation of the sample did not generate other organic matters. In Figure 8c, the maximum absorption wavelength was 464 nm, while in Figure 8d,e, the maximum absorption wavelength was 508 nm. The methyl orange was an amino-azo dye at a high pH, while it existed in a quinone structure at a low pH [30].
Figure 8f shows the efficiency of each sample after degradation in methyl orange solution at pH = 1~2 for 120 min. As the pH values decreased from 2 to 1, the efficiency of all samples increased. The degradation efficiency of MT-HM-0.005 increased with the decrease in pH. However, the degradation efficiency of MT-HM-65 decreased first and then increased with the decrease in pH. At the same time, the degradation efficiency of MT-HM-65 samples was the highest at pH = 1. The stability and recyclability of the MT-HM-0.005 catalyst was evaluated for five cycles. After each cycle, the catalyst was recovered through centrifugation from degraded solution. The recovered catalyst was thoroughly washed with ethanol and deionized water alternatively, and then subjected again to subsequent photocatalytic degradation. The photocatalytic efficiency of the catalyst was found statistically significant, even after five cycles, which indicates the stability of MnO2/TiO2 nanocomposites.

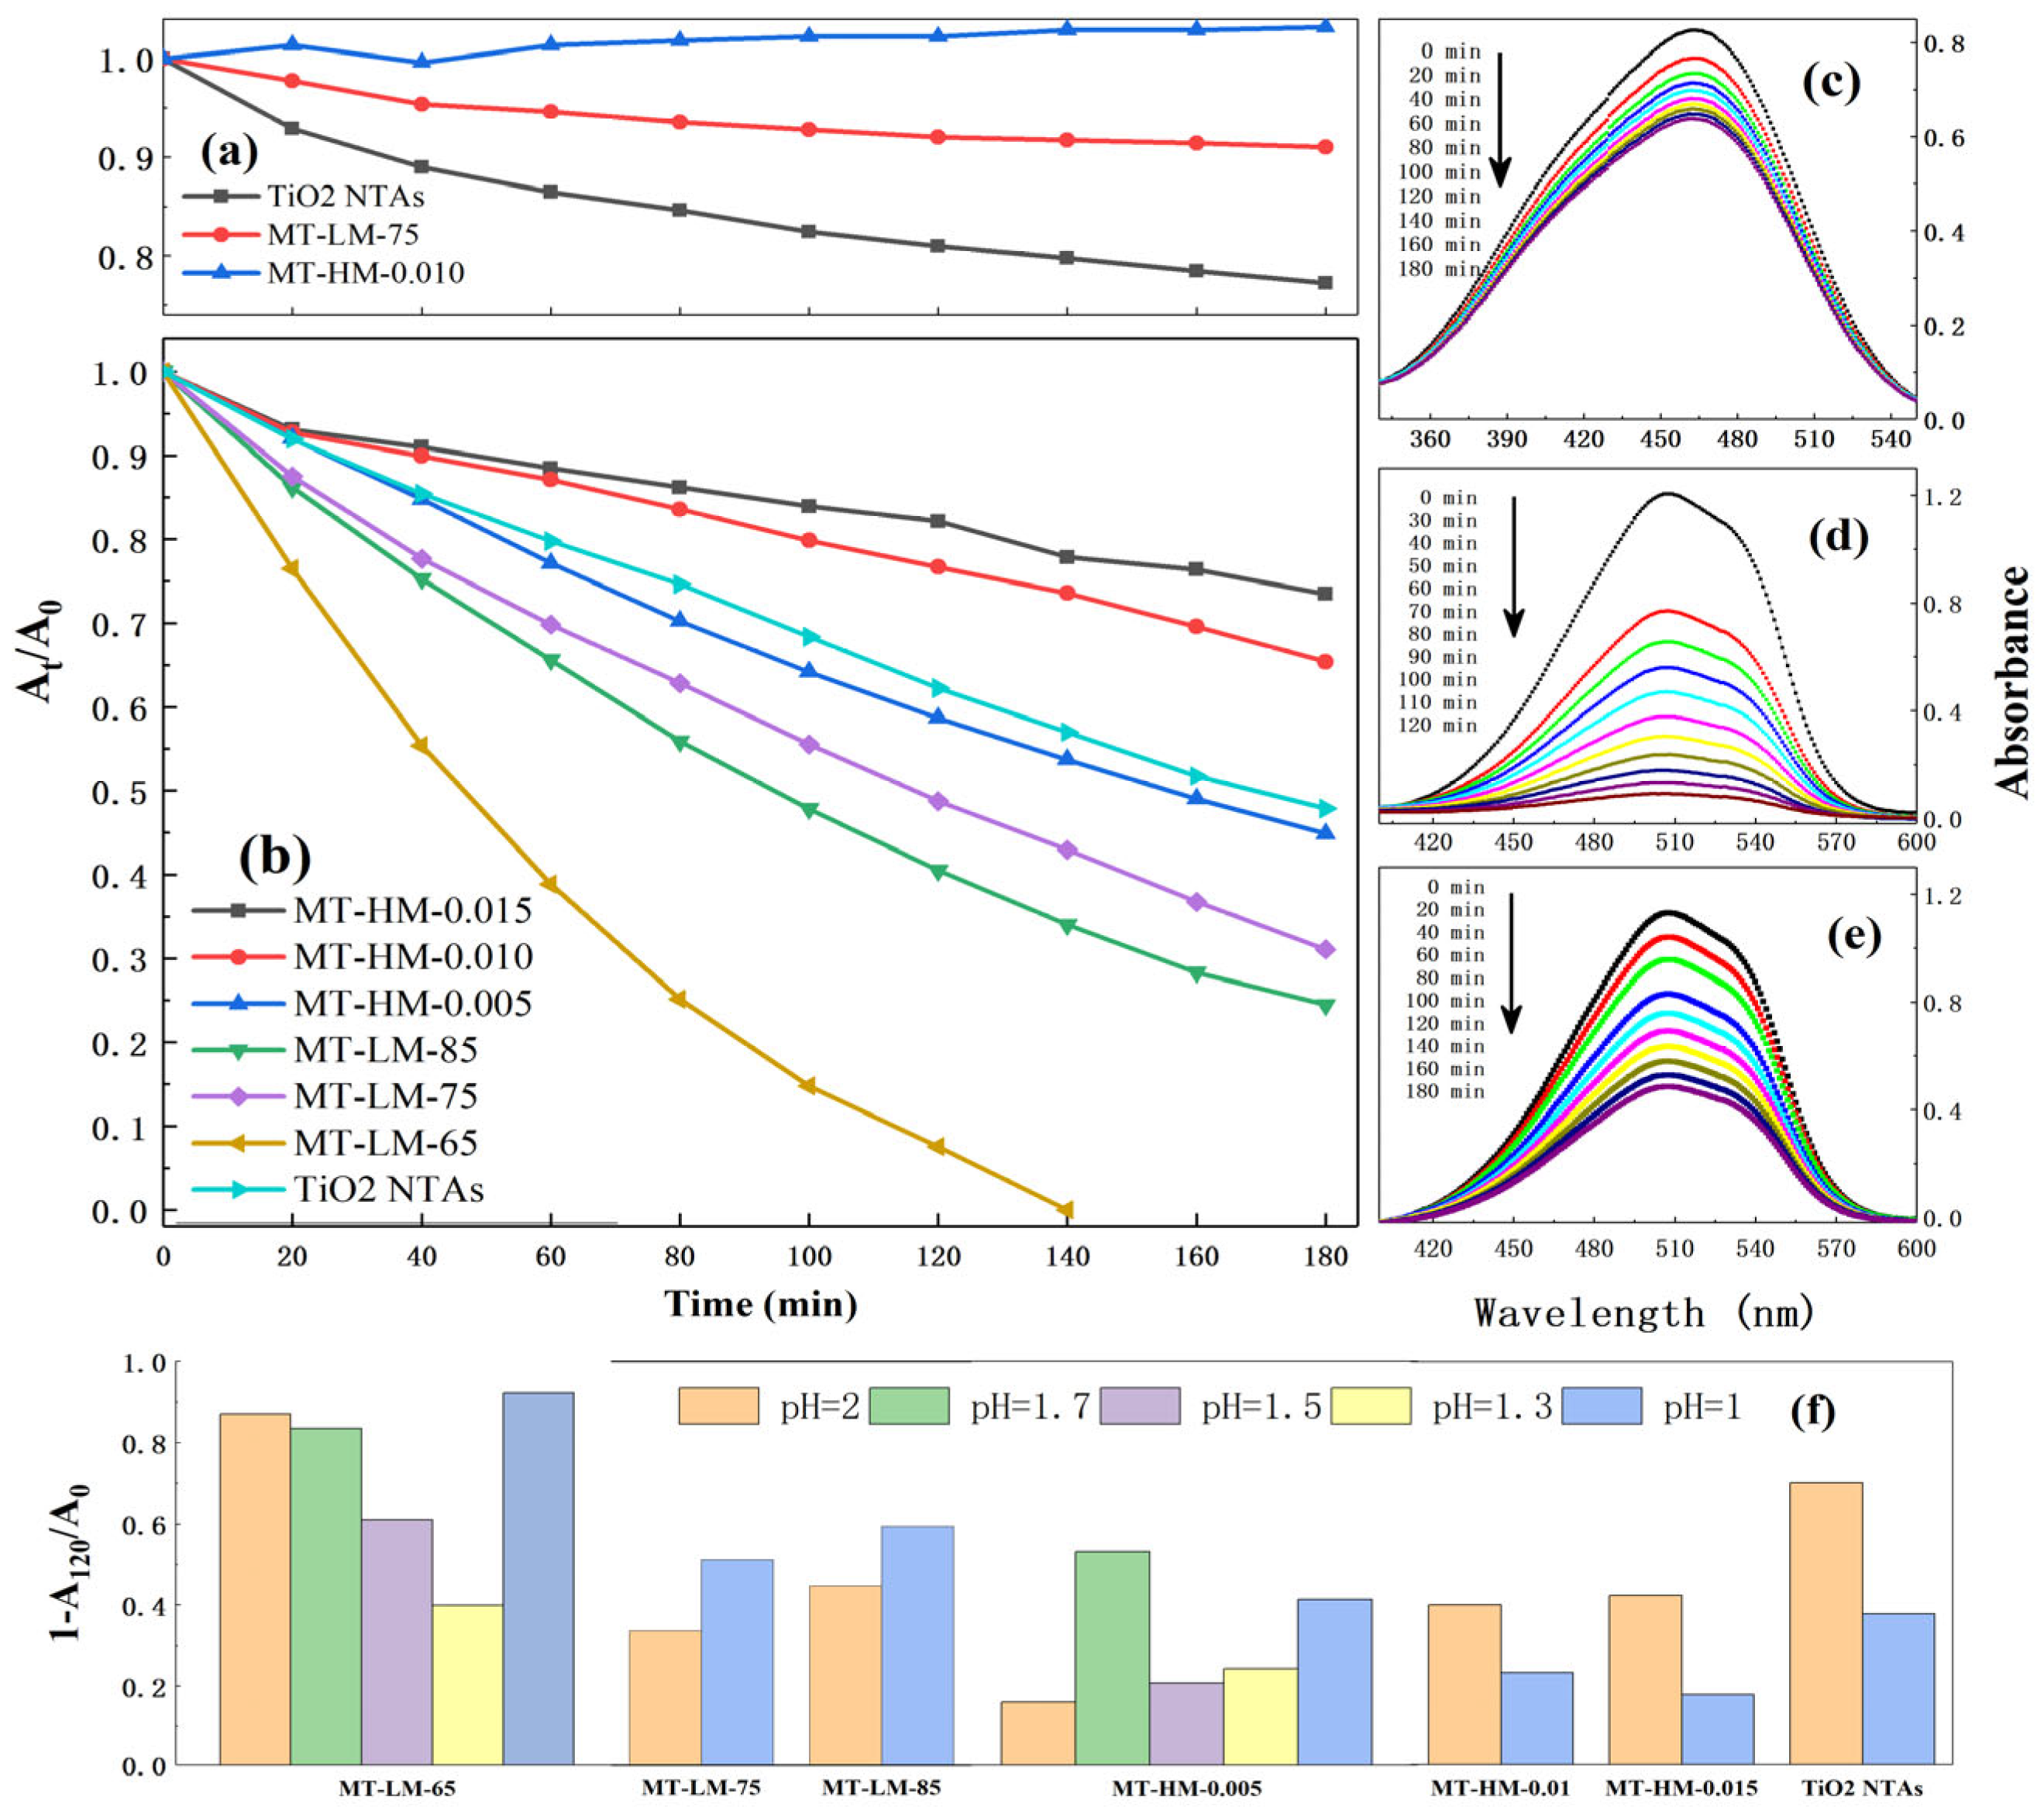
3.2.3. Photocatalytic Activity under Simulated Sunlight

TiO2 NTAs, MT-HM-0.010 and MT-LM-75 were tested for photocatalytic activity under simulated sunlight in methyl orange solution at pH = 7. As shown in Figure 9a, the activity sequence at 180 min can be obtained as follows: TiO2 NTAs > MT-LM-75 > MT-HM-0.010. According to Formula (2), the degradation efficiency of TiO2 NTAs was 25% at 180 min, which was higher than that of MT-HM-0.010 and MT-LM-75. In the solution with pH = 1, the activity of MT-HM series was lower than that of TiO2 NTAs as a whole, which showed that the MT-HM series with better activity had lower Mn content. However, for MT-LM series, the overall activity was higher than that of TiO2 NTAs, which showed that the lower the Mn content of MT-LM series, the better the activity. As also shown in Figure 9c–e, the wavelength of the highest absorbance did not shift, which indicated that methyl orange was degraded without generation of other organic matters. In addition, methyl orange was an amino-azo dye at a high pH, while methyl orange was quinone structure at a low pH [30]. The efficiency in methyl orange solution with pH value of 1–2 for 120 min is shown in Figure 9f. The degradation efficiency of MT-HM-0.005 and MT-LM-65 showed different change trends at different pH values, and the degradation efficiency of MT-HM-65 first decreased and then increased with the decrease in pH value. Meanwhile, among all the samples, MT-HM-65 had the maximum degradation efficiency at pH = 1, which showed the same trend under ultraviolet light. MT-HM-0.005 had the maximum degradation efficiency at pH = 1.7.

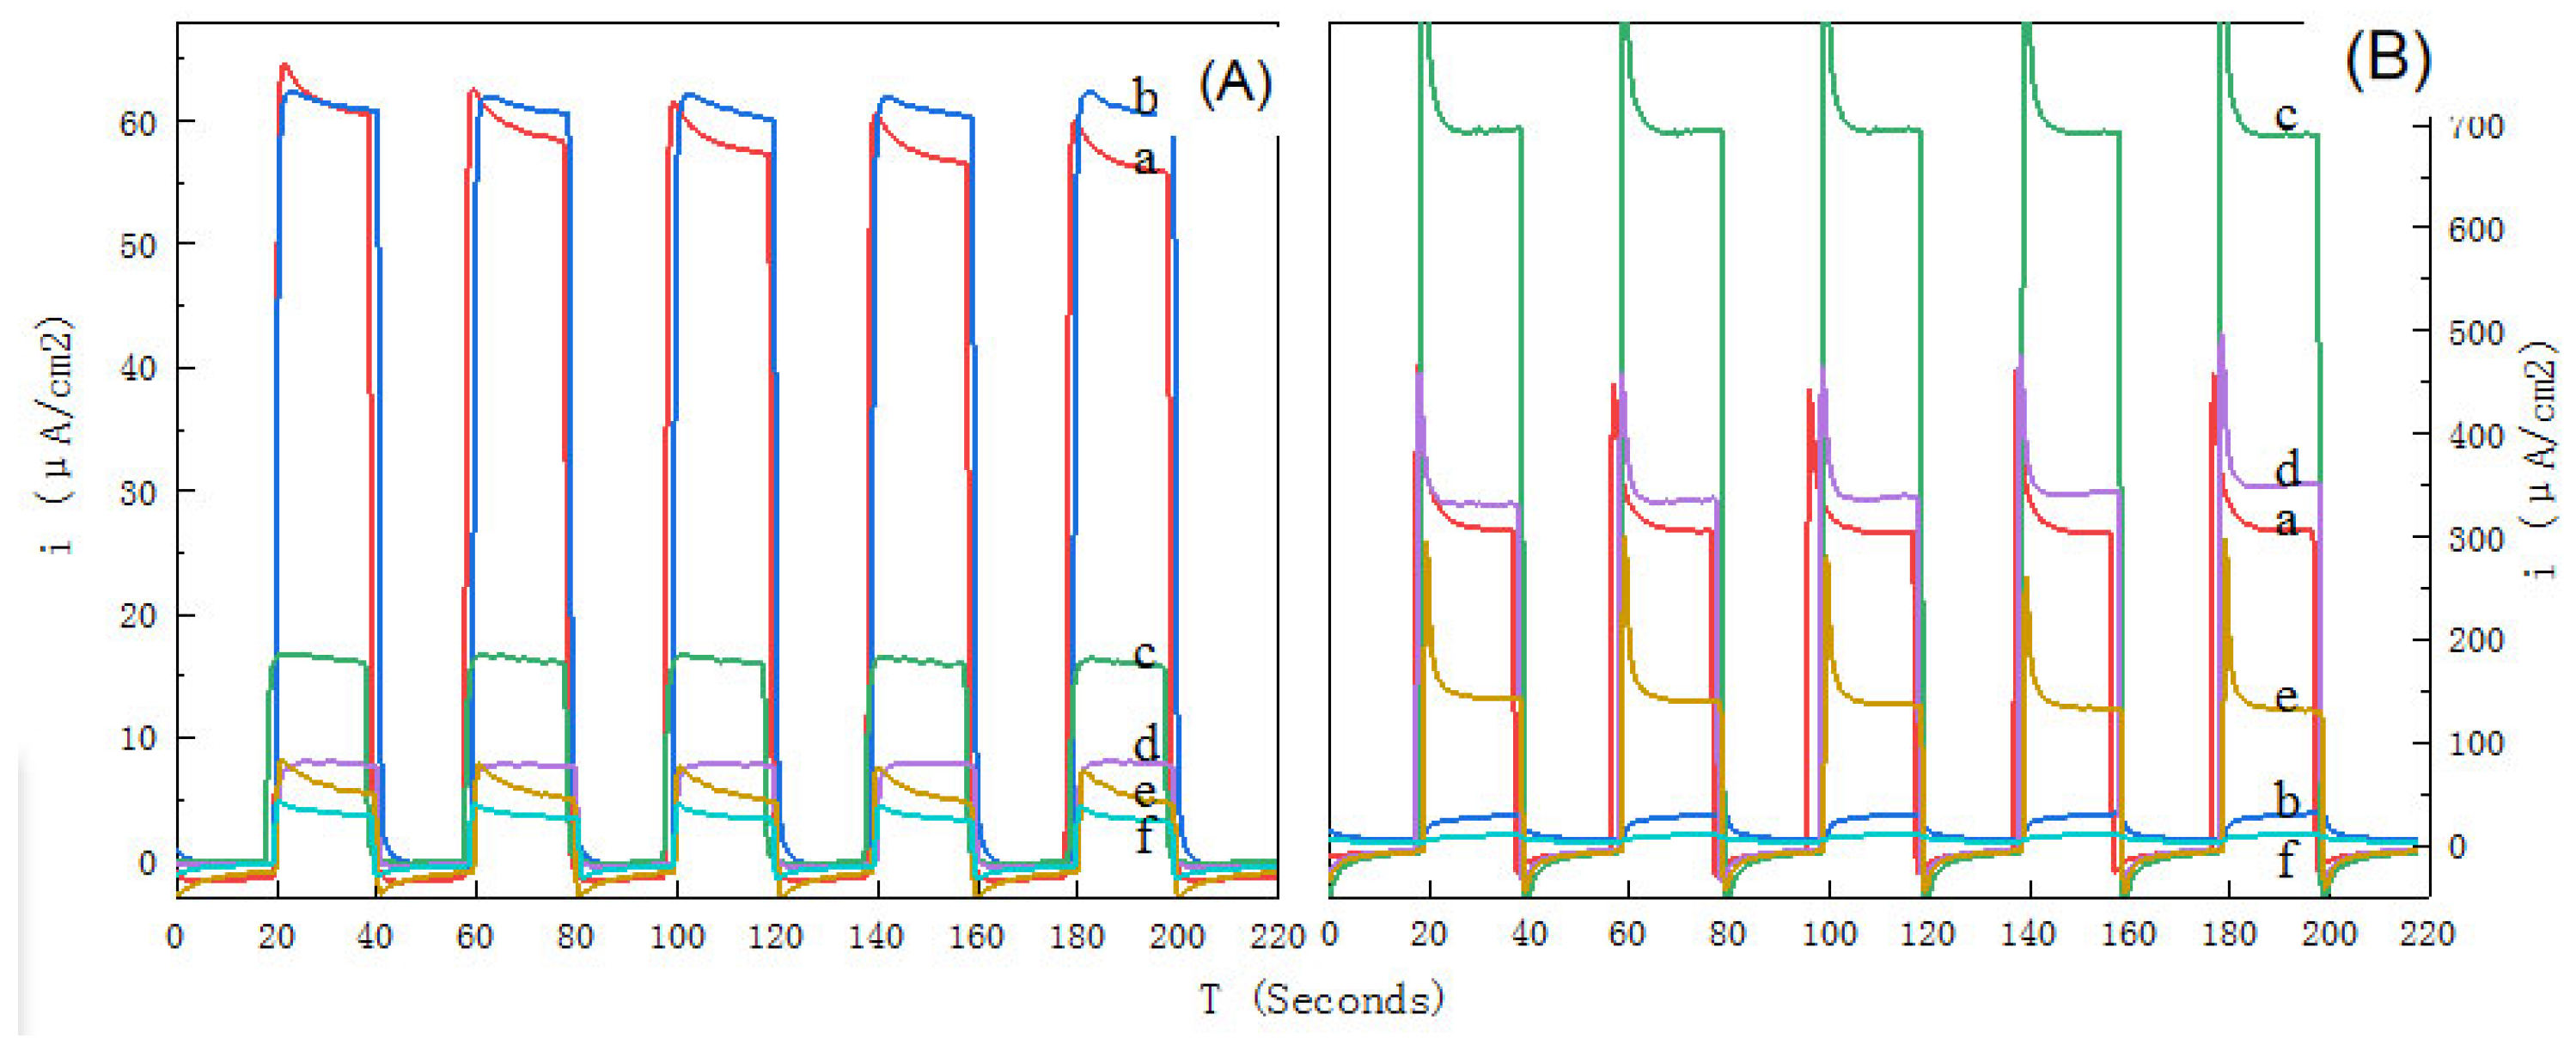
3.2.4. Photocurrent Response Capability

Figure 10A shows that the photocurrent response and the photocurrent density of MT-LM-75 was the strongest under the irradiation of ultraviolet lamp, followed by MT-LM-65 > MT-LM85 > MT-HM-0.005 > MT-HM-0.010 > MT-HM-0.015. Figure 10B shows that under the irradiation of simulated sunlight, MT-LM-85 had the maximum photocurrent density, followed by MT-HM-0.005 > MT-LM-65 > MT-HM-0.010n> MT-LM-75 > MT-HM-0.015. The photocurrent response of MT-LM series was better than that of MT-HM under ultraviolet lamp irradiation and simulating sunlight. The difference was related to the contact state of TiO2 and MnO2 in the nanocomposites. Compared with MnO2 nanowires, MnO2 nanoparticles were distributed more uniformly on the surface of TiO2 NTAs, which was beneficial for efficient photogenic carriers transport. In MT-HM series, the increase of MnO2 concentration led to the decrease in photocurrent density. When the content of MnO2 in the material was relatively low, the recombination effect of MnO2 on photo-generated electron–hole pair was rarely observed. At this time, the current path of the material was unhindered, so it can have a distinct photocurrent response. However, when the content of MnO2 increased, the recombination effect of MnO2 on photoelectron–hole pair was obvious, and the photocurrent response was decreased.

3.3. Discussion

In aqueous solutions with low pH, the surface of unmodified TiO2 undergoes protonation. The surface potential is higher than the internal potential, which promotes the migration of photogenerated electrons to the surface, thereby extending the recombination time between electrons and holes. Methyl orange is an amino-azo dye that predominantly exists in the more readily oxidizable quinone form at low pH values. The following figure presents the equation for protonation and photocatalytic degradation reactions, depicting the chemical changes involved in the discoloration mechanism of methyl orange in aqueous solution [30]:
Coatings 14 00894 i001
The equation above describes the protonation of the TiO2 surface, which facilitates the migration and recombination of photogenerated electron–hole pairs, leading to the oxidative degradation of methyl orange from its amino-azo form to the more readily degradable quinone form under acidic conditions.
Generally speaking, quinone structure and azo structure existed in organic compounds, and methyl orange molecules with quinone structure were easier to be oxidized and decomposed [31]. Therefore, TiO2-photocatalyzed methyl orange degradation had a good effect in an aqueous solution with low pH value. The bottom of the conduction band and the top of valence band of MnO2 were in the band gap of TiO2. In terms of energy migration, photogenerated electrons and photogenerated holes in TiO2 migrated, respectively, to the conduction band and valence band of MnO2, becoming the recombination center of photogenerated electrons and holes. At the same time, the transition of photogenerated electrons in TiO2 to the conduction band of MnO2 and the transition recombination process of electrons and holes in MnO2 were both without light radiation, which resulted in the severe inhibition of photocatalytic activity of nanocomposites.
The possible excitation mechanism of TiO2/MnO2 under light in a solution with low pH values is shown in Figure 11. When the aqueous solution had a low pH value, the surface of TiO2 and MnO2 was protonated, and its surface potential was higher than the internal, which led to four processes. First, the photogenerated electrons of TiO2 moved to the surface of the material, which was similar to the photogenerated electrons generated by unmodified TiO2. Then, the surface protonation of MnO2 was conducive to the formation of adsorbed methyl orange molecular coordination complex. The surface potential of the material was higher than that of the interior, which was equivalent to the establishment of an electric field. At last, photogenic carriers generated by TiO2 migrated to MnO2, and the protonization of the surface of MnO2 led to the inhibition or reduction in the internal electron and hole recombination. MnO2 was stimulated to produce photogenic electrons, which migrated to the surface of the TiO2 and extended the life of photogenic charge carriers [21].

4. Conclusions

In this experiment, MnO2/TiO2 NTAs nanocomposites were modified on the surface of nanobamboo structure arrays by high-temperature and low-temperature hydrothermal after standing methods. In the absence of light, the degradation of MT-HM and MT-LM series to methyl oranges with pH = 1 was proportional to the content of Mn. The degradation efficiency of all samples can reach 100% within 180 min at pH = 1 under UV light. The photocatalytic efficiency of the catalyst was found to be statistically significant, even after five cycles, which indicates the stability of MnO2/TiO2 nanocomposites. Under the irradiation of simulated sunlight, MT-LM-85 had the maximum photocurrent density, while under the irradiation of UV lamp, MT-LM-75 had the strongest photocurrent response. The influences of MnO2 content, contact state of TiO2 and MnO2, and environmental acidity on the photocatalytic performance of MnO2/TiO2 NTAs were studied. The mechanism of photocatalysis in acidic solution can be simplified as photoelectric catalysis; the protonization of the surface of MnO2 led to the inhibition or reduction in the internal electron and hole recombination.

Supplementary Materials

The following supporting information can be downloaded at: https://www.mdpi.com/article/10.3390/coatings14070894/s1, Figure S1. Photocatalytic performance under catalyst-free conditions at pH = 1.

Author Contributions

Formal analysis, F.L.; Investigation, F.L., Y.X., Y.Y. and C.Z.; Data curation, Y.Y. All authors have read and agreed to the published version of the manuscript.

Funding

This work was supported by the Innovation team project of Lingnan Normal University (LT2203), Science and Technology Project of Zhanjiang (2019A03009, 2022A01001, 2023A21510) and Natural Science Foundation of Guangdong Province (2022A1515011137, 2023A1515011796, 2023A1515012923).

Institutional Review Board Statement

Not applicable.

Informed Consent Statement

Not applicable.

Data Availability Statement

Data is contained within the article and Supplementary Materials.

Conflicts of Interest

The authors declare no conflict of interest.

References

  1. Xue, Y.L.; Huang, J.; Lau, C.H.; Cao, B.; Li, P. Tailoring the molecular structure of crosslinked polymers for pervaporation desalination. Nat. Commun. 2020, 11, 1461. [Google Scholar] [CrossRef]
  2. Du Chanois, R.M.; Cooper, N.J.; Lee, B.; Patel, S.K.; Mazurowski, L.; Graedel, T.E.; Elimelech, M. Prospects of metal recovery from wastewater and brine. Nat. Water 2023, 1, 37–46. [Google Scholar] [CrossRef]
  3. Meng, C.; Ding, B.; Zhang, S.; Cui, L.; Ostrikov, K.K.; Huang, Z.; Yang, B.; Kim, J.-H. Angstrom-confined catalytic water purification within Co-TiOx laminar membrane nanochannels. Nat. Commun. 2022, 13, 4010. [Google Scholar] [CrossRef]
  4. Gholami, M.; Shirzad-Siboni, M.; Farzadkia, M.; Yang, J.K. Synthesis, characterization, and application of ZnO/TiO2, nanocomposite for photocatalysis of a herbicide. Desalination Water Treat. 2015, 57, 13632–13644. [Google Scholar] [CrossRef]
  5. Schneider, J.; Matsuoka, M.; Takeuchi, M.; Zhang, J.; Horiuchi, Y.; Anpo, M.; Bahnemann, D.W. Understanding TiO2 photocatalysis: Mechanisms and materials. Chem. Rev. 2014, 114, 9919–9986. [Google Scholar] [CrossRef]
  6. Nakata, K.; Fujishima, A. TiO2 photocatalysis:design and applications. J. Photochem. Photobiol. C Photochem. Rev. 2012, 13, 169–189. [Google Scholar] [CrossRef]
  7. Sato, S.; White, J.M. Photodecomposition of water over Pt/TiO2 catalysts. Chem. Phys. Lett. 1980, 72, 83–86. [Google Scholar] [CrossRef]
  8. Ohtani, B.; Osaki, H.; Nishimoto, S.; Kagiya, T. A novel photocatalytic process of amine N-alkylation by platinized semiconductor particles suspended in alcohols. J. Am. Chem. Soc. 1986, 108, 308–310. [Google Scholar] [CrossRef]
  9. Chatterjee, D.; Mahata, A. Demineralization of organic pollutants on the dye modified TiO2 semiconductor particulate system using visible light. Appl. Catal. B Environ. 2001, 33, 119–125. [Google Scholar] [CrossRef]
  10. Diak, M.; Grabowska, E.; Zaleska, A. Synthesis, characterization and photocatalytic activity of noble metal-modified TiO2 nanosheets with exposed {001} facets. Appl. Surf. Sci. 2015, 347, 275–285. [Google Scholar] [CrossRef]
  11. Bu, Y.; Chen, Z.; Li, W.; Yu, J. High-Efficiency Photoelectrochemical Properties by a Highly Crystalline CdS-Sensitized ZnO Nanorod Array. ACS Appl. Mater. Interfaces 2013, 5, 5097–5104. [Google Scholar] [CrossRef] [PubMed]
  12. Dong, H.; Zeng, G.; Tang, L.; Fan, C.; Zhang, C.; He, X.; He, Y. An overview on limitations of TiO2-based particles for photocatalytic degradation of organic pollutants and the corresponding countermeasure. Water Res. 2015, 79, 128–146. [Google Scholar] [CrossRef]
  13. Toupin, M.; Brousse, T.; Bélanger, D. Charge Storage Mechanism of MnO2 Electrode Used in Aqueous Electrochemical Capacitor. Chem. Mater. 2004, 16, 3184–3190. [Google Scholar] [CrossRef]
  14. Izgorodin, A.; Hocking, R.; Winther-Jensen, O.; Hilder, M.; Winther-Jensen, B.; MacFarlane, D.R. Phosphorylated manganese oxide electrodeposited from ionic liquid as a stable, high efficiency water oxidation catalyst. Catal. Today 2013, 200, 36–40. [Google Scholar] [CrossRef]
  15. Li, S.; Ma, Z.; Wang, L.; Liu, J. Influence of MnO2 on the photocatalytic activity of P-25 TiO2 in the degradation of methyl orange. Sci. China 2008, 51, 179–185. [Google Scholar] [CrossRef]
  16. Ghaemi, M.; Khosravi-Fard, L.; Neshati, J. Improved performance of rechargeable alkaline batteries via surfactant-mediated electrosynthesis of MnO2. J. Power Sources 2004, 141, 340–350. [Google Scholar] [CrossRef]
  17. Sakai, N.; Ebina, Y.; Takada, K.; Sasaki, T. Photocurrent generation from semiconducting manganese oxide nanosheets in response to visible light. J. Phys. Chem. B 2005, 109, 9651–9655. [Google Scholar] [CrossRef]
  18. Xu, X.; Zhou, X.; Li, X.; Yang, F.; Jin, B.; Xu, T.; Li, G.; Li, M. Electrodeposition synthesis of MnO2/TiO2 nanotube arrays nanocomposites and their visible light photocatalytic activity. Mater. Res. Bull. 2014, 59, 32–36. [Google Scholar] [CrossRef]
  19. Li, X.; Zhang, M.; Zhang, Y.; Yu, C.; Qi, W.; Cui, J.; Wang, Y.; Qin, Y.; Liu, J.; Shu, X.; et al. Controlled synthesis of MnO2@TiO2 hybrid nanotube arrays with enhanced oxygen evolution reaction performance. Int. J. Hydrogen Energy 2018, 43, 14369–14378. [Google Scholar] [CrossRef]
  20. Li, N.; Xia, W.Y.; Wang, J.; Liu, Z.L.; Li, Q.Y.; Chen, S.Z.; Xu, C.W.; Lu, X.H. Manganese oxide supported on hydrogenated TiO2 nanowire array catalysts for the electrochemical oxygen evolution reaction in water electrolysis. J. Mater. Chem. A 2015, 3, 21308–21313. [Google Scholar] [CrossRef]
  21. Ma, Q.; Wang, H.; Zhang, H.; Cheng, X.; Xie, M.; Cheng, Q. Fabrication of MnO2/TiO2 nano-tube arrays photoelectrode and its enhanced visible light photoelectrocatalytic performance and mechanism. Sep. Purif. Technol. 2017, 189, 193–203. [Google Scholar] [CrossRef]
  22. Nevárez-Martínez, M.C.; Kobylański, M.P.; Mazierski, P.; Wółkiewicz, J.; Trykowski, G.; Malankowska, A.; Kozak, M.; Espinoza-Montero, P.J.; Zaleska-Medynska, A. Self-Organized TiO2-MnO2 Nanotube Arrays for Efficient Photocatalytic Degradation of Toluene. Molecules 2017, 22, 564. [Google Scholar] [CrossRef] [PubMed]
  23. Wang, J.; Li, X.; Li, X.; Zhu, J.; Li, H. Mesoporous yolk-shell SnS2-TiO2 visible photocatalysts with enhanced activity and durability in Cr(VI) reduction. Nanoscale 2013, 5, 1876–1881. [Google Scholar] [CrossRef] [PubMed]
  24. González, M.G.; Chaparro, A.M.; Salvador, P. Photoelectrochemical study of the TiO2 Cr system. Observation of strong (001) rutile photoetching in the presence of Cr(VI). J. Photochem. Photobiol. Chem. 1993, 73, 221–231. [Google Scholar] [CrossRef]
  25. Raja, K.S.; Gandhi, T.; Misra, M. Effect of water content of ethylene glycol as electrolyte for synthesis of ordered titania nanotubes. Electrochem. Commun. 2007, 9, 1069–1076. [Google Scholar] [CrossRef]
  26. Di, J.; Fu, X.; Zheng, H.; Jia, Y. H-TiO2/C/MnO2 nanocomposite materials for high-performance supercapacitors. J. Nanoparticle Res. 2015, 17, 255. [Google Scholar] [CrossRef]
  27. Zhou, H.; Zhang, Y. Enhanced electrochemical performance of manganese dioxide spheres deposited on a titanium dioxide nanotube arrays substrate. J. Power Sources 2014, 272, 866–879. [Google Scholar] [CrossRef]
  28. Hao, X.; Zhao, J.; Zhao, Y.; Ma, D.; Lu, Y.; Guo, J.; Zeng, Q. Mild aqueous synthesis of urchin-like MnOx hollow nanostructures and their properties for RhB degradation. Chem. Eng. J. 2013, 229, 134–143. [Google Scholar] [CrossRef]
  29. Ronca, E.; Marotta, G.; Pastore, M.; De Angelis, F. Effect of Sensitizer Structure and TiO2 Protonation on Charge Generation in Dye-Sensitized Solar Cells. J. Phys. Chem. C 2014, 87, 405–418. [Google Scholar] [CrossRef]
  30. Motomizu, S.; Oshima, M.; Hosoi, Y. Spectrophotometric determination of cationic and anionic surfactants with anionic dyes in the presence of nonionic surfactants, part I: A general aspect. Microchim. Acta 1992, 106, 57–66. [Google Scholar] [CrossRef]
  31. Konstantinou, I.K.; Albanis, T.A. TiO2-assisted photocatalytic degradation of azo dyes in aqueous solution: Kinetic and mechanistic investigations: A review. Appl. Catal. B Environ. 2004, 49, 1–14. [Google Scholar] [CrossRef]
Figure 1. The schematic diagram is process of this experiments. Growth of TiO2 NTAs (a), growth of MnO2/TiO2 NTAs (b), photocatalytic activity test (c), and photocurrent response test (d).
Coatings 14 00894 g001
Figure 2. Element content of MnO2/TiO2 NTAs prepared under different conditions.
Coatings 14 00894 g002
Figure 3. EDS counting points of MT-HM-0.010 and MT-LM-75.
Coatings 14 00894 g003
Figure 4. SEM images of TiO2 NTAs and MnO2/TiO2 NTAs. (ac) Undoped TiO2 NTAs, scale bar: 100 nm; (d,e) MnO2 nanoparticles on TiO2 nanotube arrays (MT-LM), surface and side views, scale bar: 100 nm; (f) aggregated residual particles post-hydrothermal treatment, scale bar: 1 µm; (g,h) MnO2 nanowires on TiO2 nanotube arrays (MT-HM), surface and side views, scale bar: 1 µm and 100 nm; (i) MnO2 nanowires and residuals adhered to the surface, scale bar: 1 µm.
Coatings 14 00894 g004
Figure 5. XRD patterns of TiO2 NTAs and MnO2/TiO2 NTAs.
Coatings 14 00894 g005
Figure 6. TEM (a,d,e) and HR-TEM (b,c,f) images of MnO2/TiO2 NTAs labeled as MT-HM-0.015 (ac) and MT-LM-85 (df).
Coatings 14 00894 g006
Figure 7. Adsorption of samples in a 10 mg/L methyl orange solution at pH = 1.
Coatings 14 00894 g007
Figure 8. Photocatalytic activity of a 10 mg/L methyl orange solution under UV Light: (a) photocatalytic activity at pH = 7; (b) photocatalytic activity at pH = 1; (c) absorption spectrum of TiO2 NTAs during the degradation of a methyl orange solution at pH = 7; (d) absorption spectrum of MT-LM-65 during the degradation of a methyl orange solution at pH = 1; (e) absorption spectrum of MT-HM-0.005 during the degradation of a methyl orange solution at pH = 1; (f) degradation efficiency of samples at different pH conditions over 120 min.
Coatings 14 00894 g008
Figure 9. Photocatalytic activity of a 10 mg/L methyl orange solution under simulated sunlight: (a) photocatalytic activity in a solution at pH = 7; (b) photocatalytic activity in a solution at pH = 1; (c) absorption spectrum of TiO2 NTAs during the degradation of a methyl orange solution at pH = 7; (d) absorption spectrum of MT-LM-65 during the degradation of a methyl orange solution at pH = 1; (e) absorption spectrum of MT-HM-0.005 during the degradation of a methyl orange solution at pH = 1; (f) degradation efficiency of samples at different pH conditions over 120 min.
Coatings 14 00894 g009
Figure 10. Photocurrent responses of 10 mg/L methyl orange solution under UV lamp (a) and simulated sunlight (b) conditions: (a) photocurrent response of the MT-LM-65 sample under UV lamp and simulated sunlight; (b) photocurrent response of the MT-LM-75 sample under UV lamp and simulated sunlight (data magnified 10 times); (c) photocurrent response of the MT-LM-85 sample under UV lamp and simulated sunlight; (d) photocurrent response of the MT-HM-0.005 sample under UV lamp and simulated sunlight; (e) photocurrent response of the MT-HM-0.010 sample under UV lamp and simulated sunlight; (f) photocurrent response of the MT-HM-0.015 sample under UV lamp and simulated sunlight (data magnified 10 times).
Coatings 14 00894 g010
Figure 11. Excitation mechanism of TiO2/MnO2 under low pH solution.
Coatings 14 00894 g011
Table 1. The element content of MnO2/TiO2 NTAs prepared under different conditions.
ElementMn (at%)Ti (at%)O (at%)
TiO2 NTAs047.6452.36
MnO2/TiO2 NTAs-HM0.005 mol/L0.5649.6949.75
0.010 mol/L0.7742.3256.91
0.015 mol/L1.3441.9856.68
MnO2/TiO2 NTAs-LM65 °C0.5241.9357.55
75 °C0.7342.9356.35
85 °C0.9340.458.67
Disclaimer/Publisher’s Note: The statements, opinions and data contained in all publications are solely those of the individual author(s) and contributor(s) and not of MDPI and/or the editor(s). MDPI and/or the editor(s) disclaim responsibility for any injury to people or property resulting from any ideas, methods, instructions or products referred to in the content.

