
Nanoindentation Study on the Local Evaluation of Hydrogen-Induced Hardening Performance of Ferrite and Austenite in 2205 Duplex Stainless Steel: Experiment and Finite Element Modeling


Abstract
1. Introduction
2. Methodology
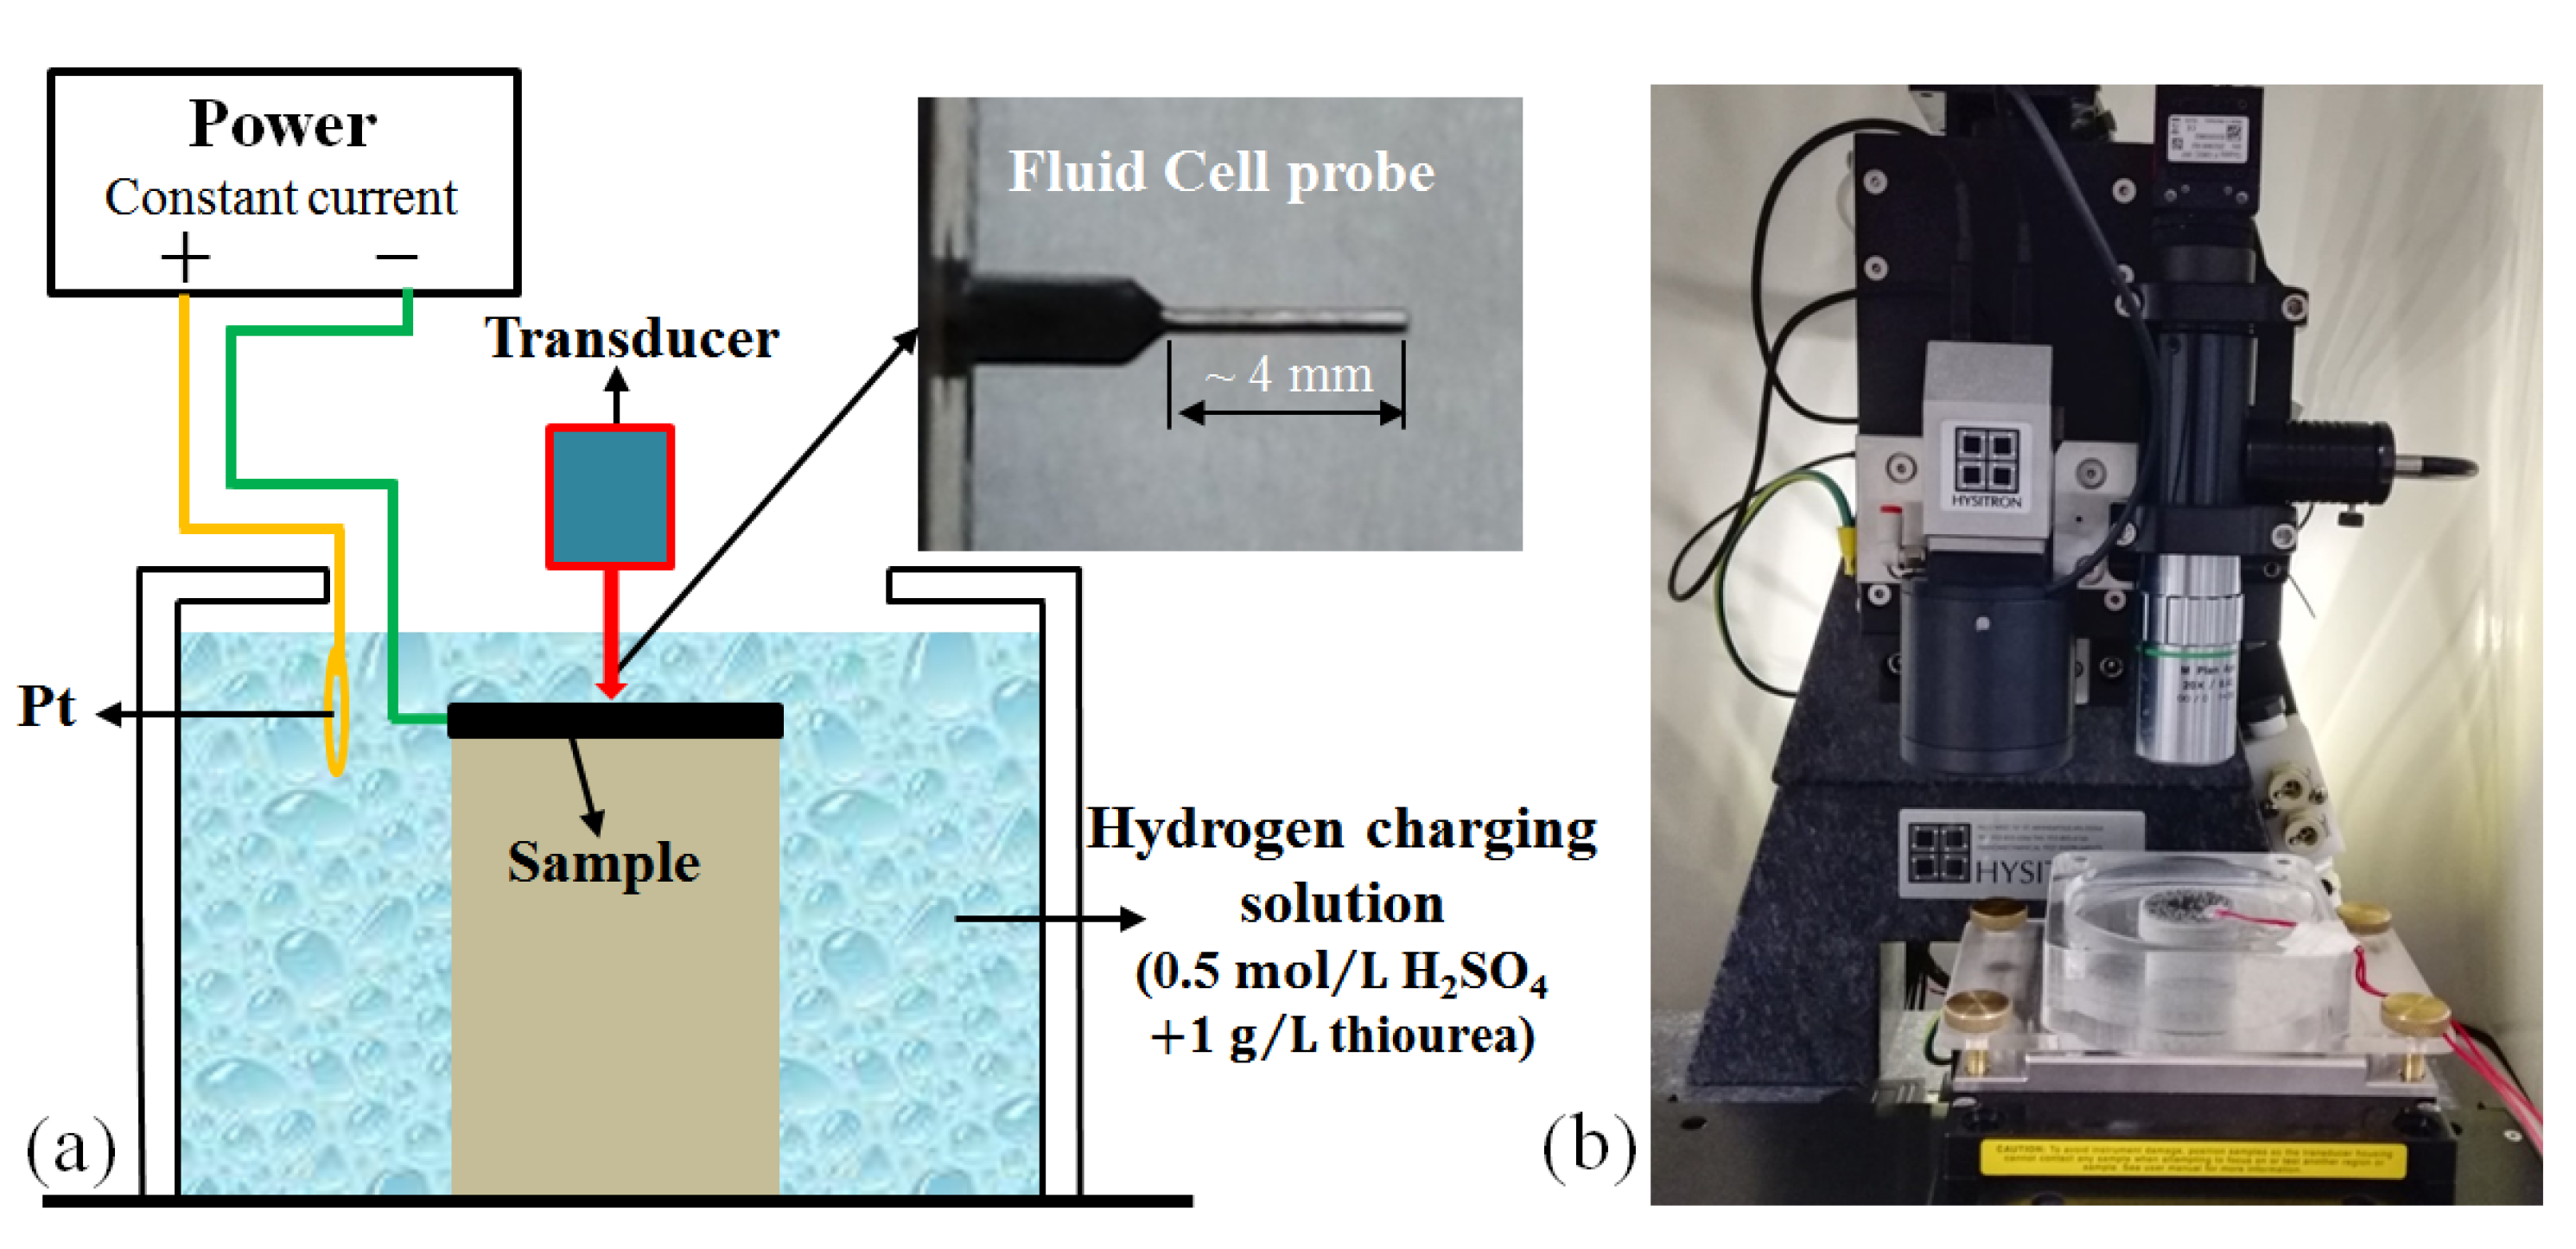
2.1. Experiment
2.2. Finite Element Model
3. Results and Discussion
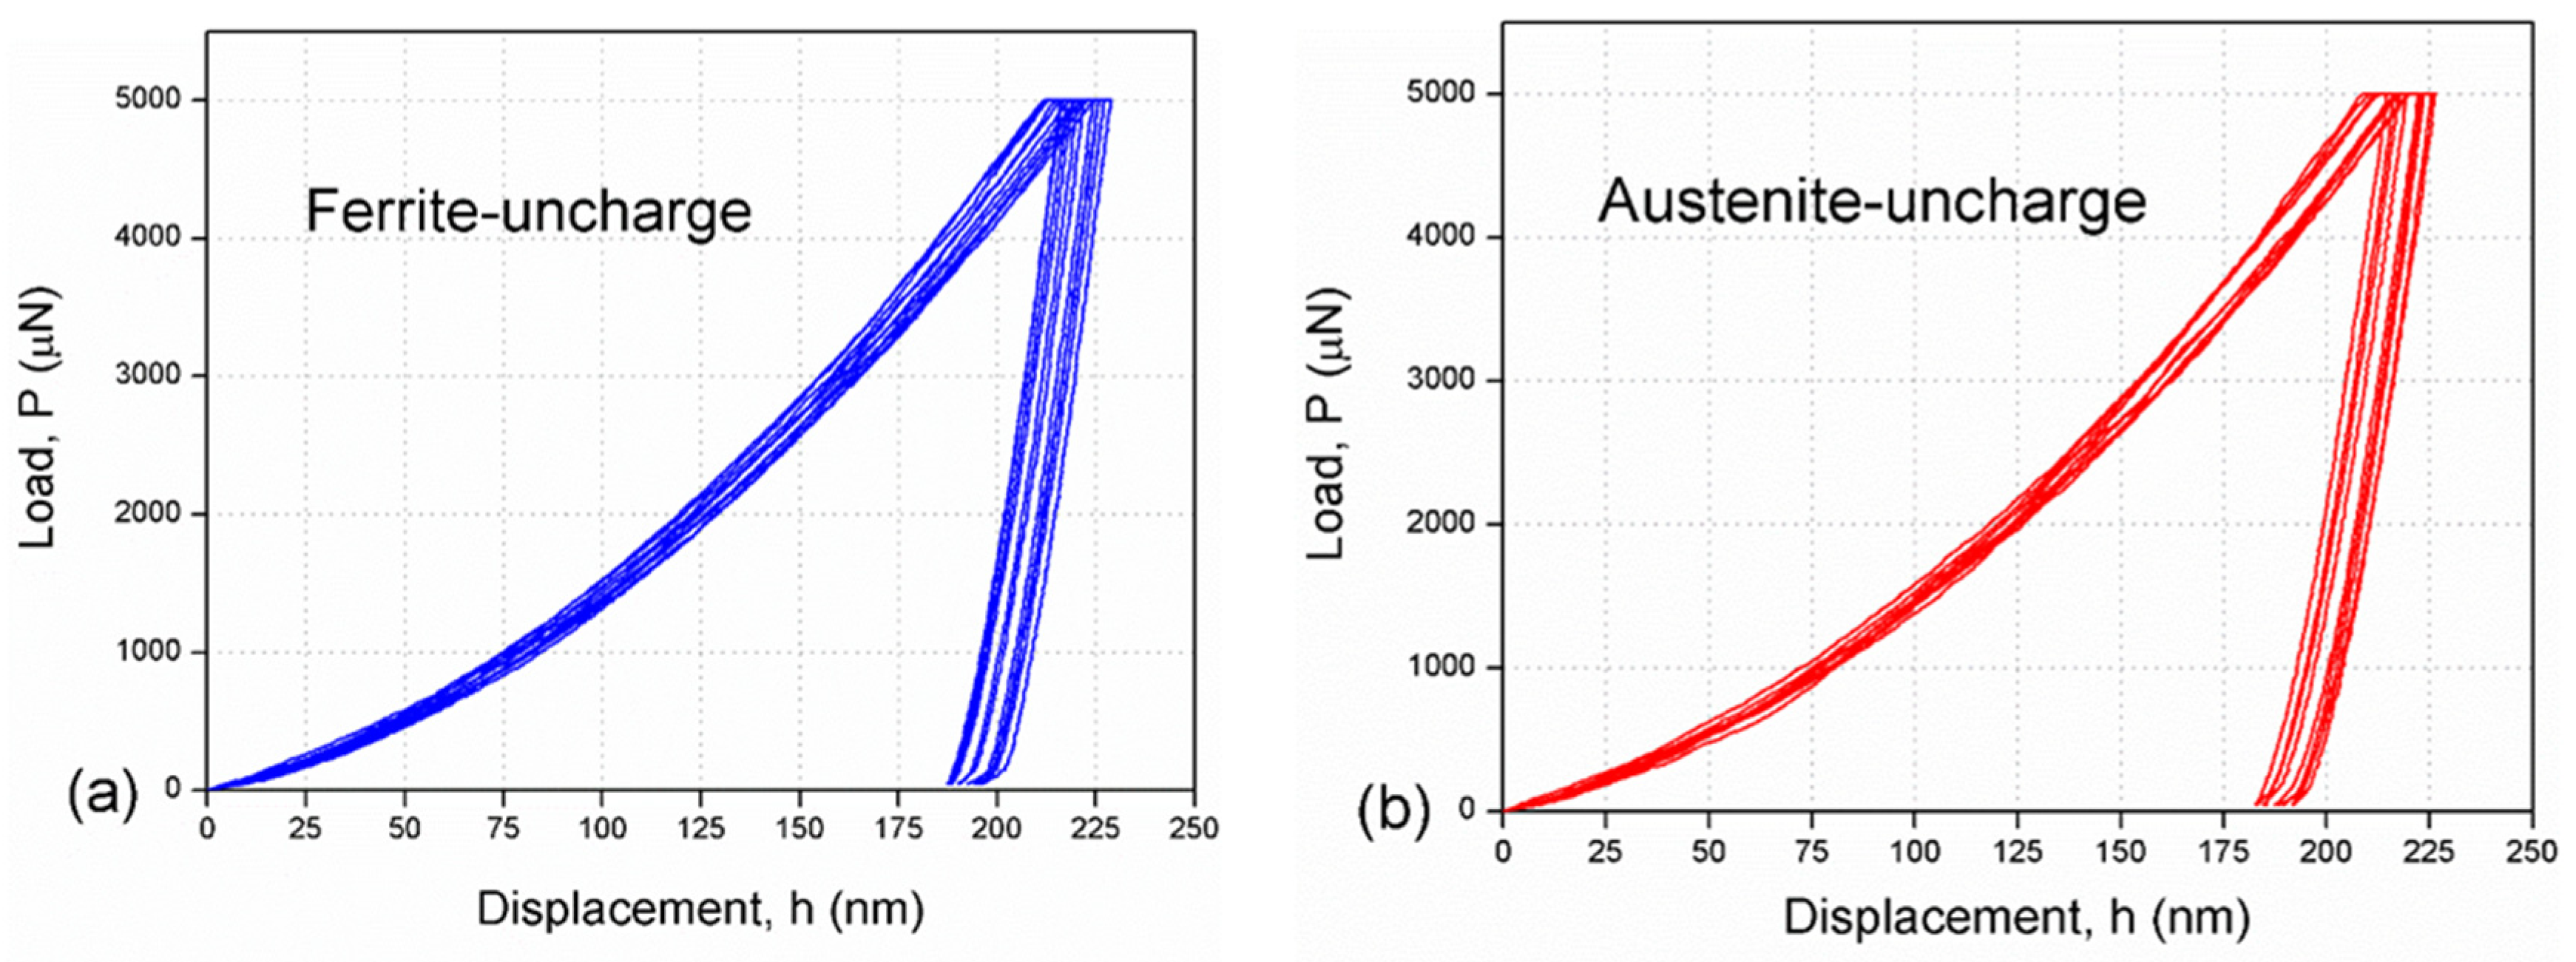
3.1. Hydrogen Free
3.2. Hydrogen Charged
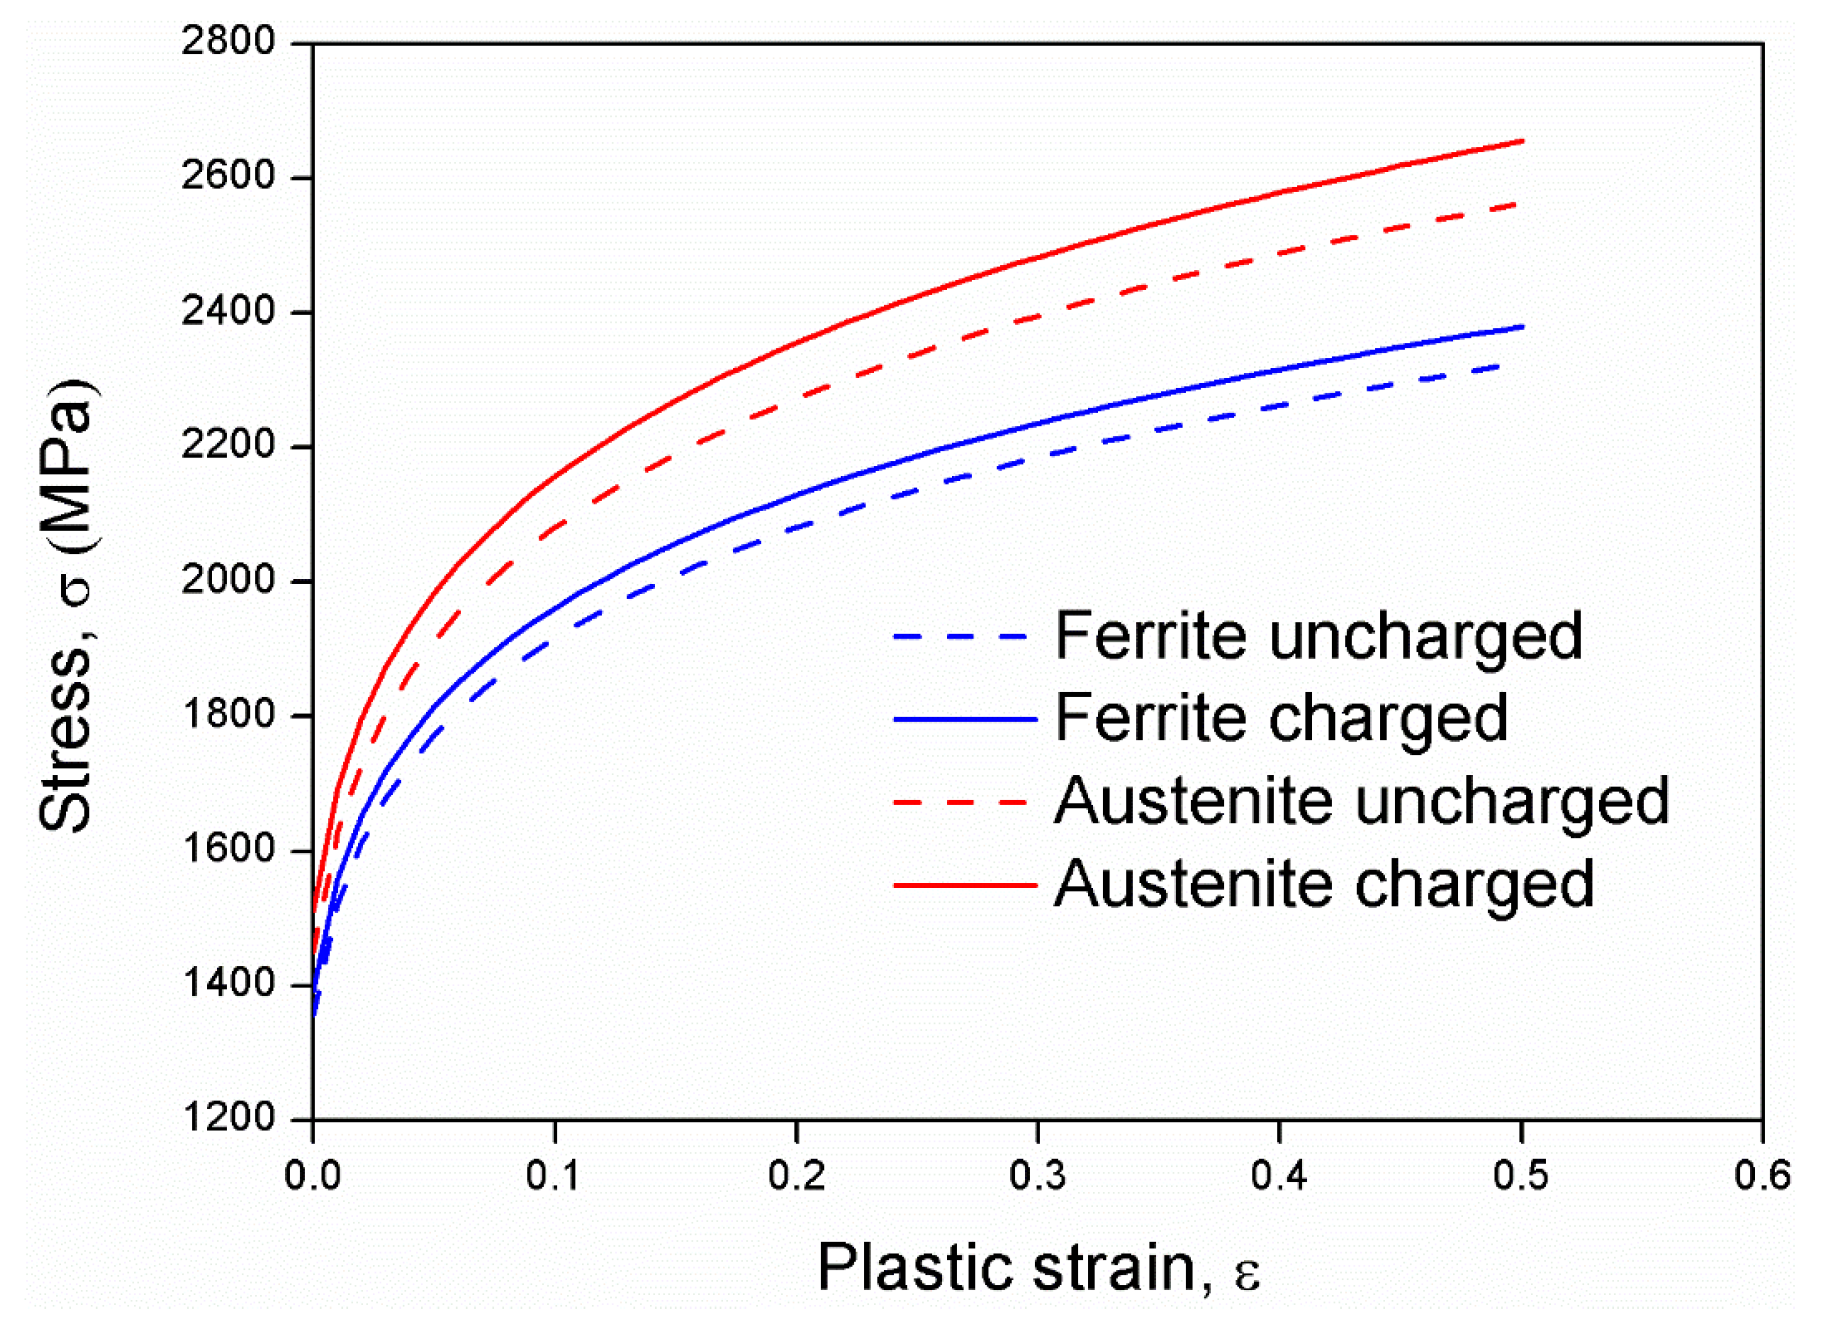
3.3. Dislocation-Based Yield Strength Determination Model
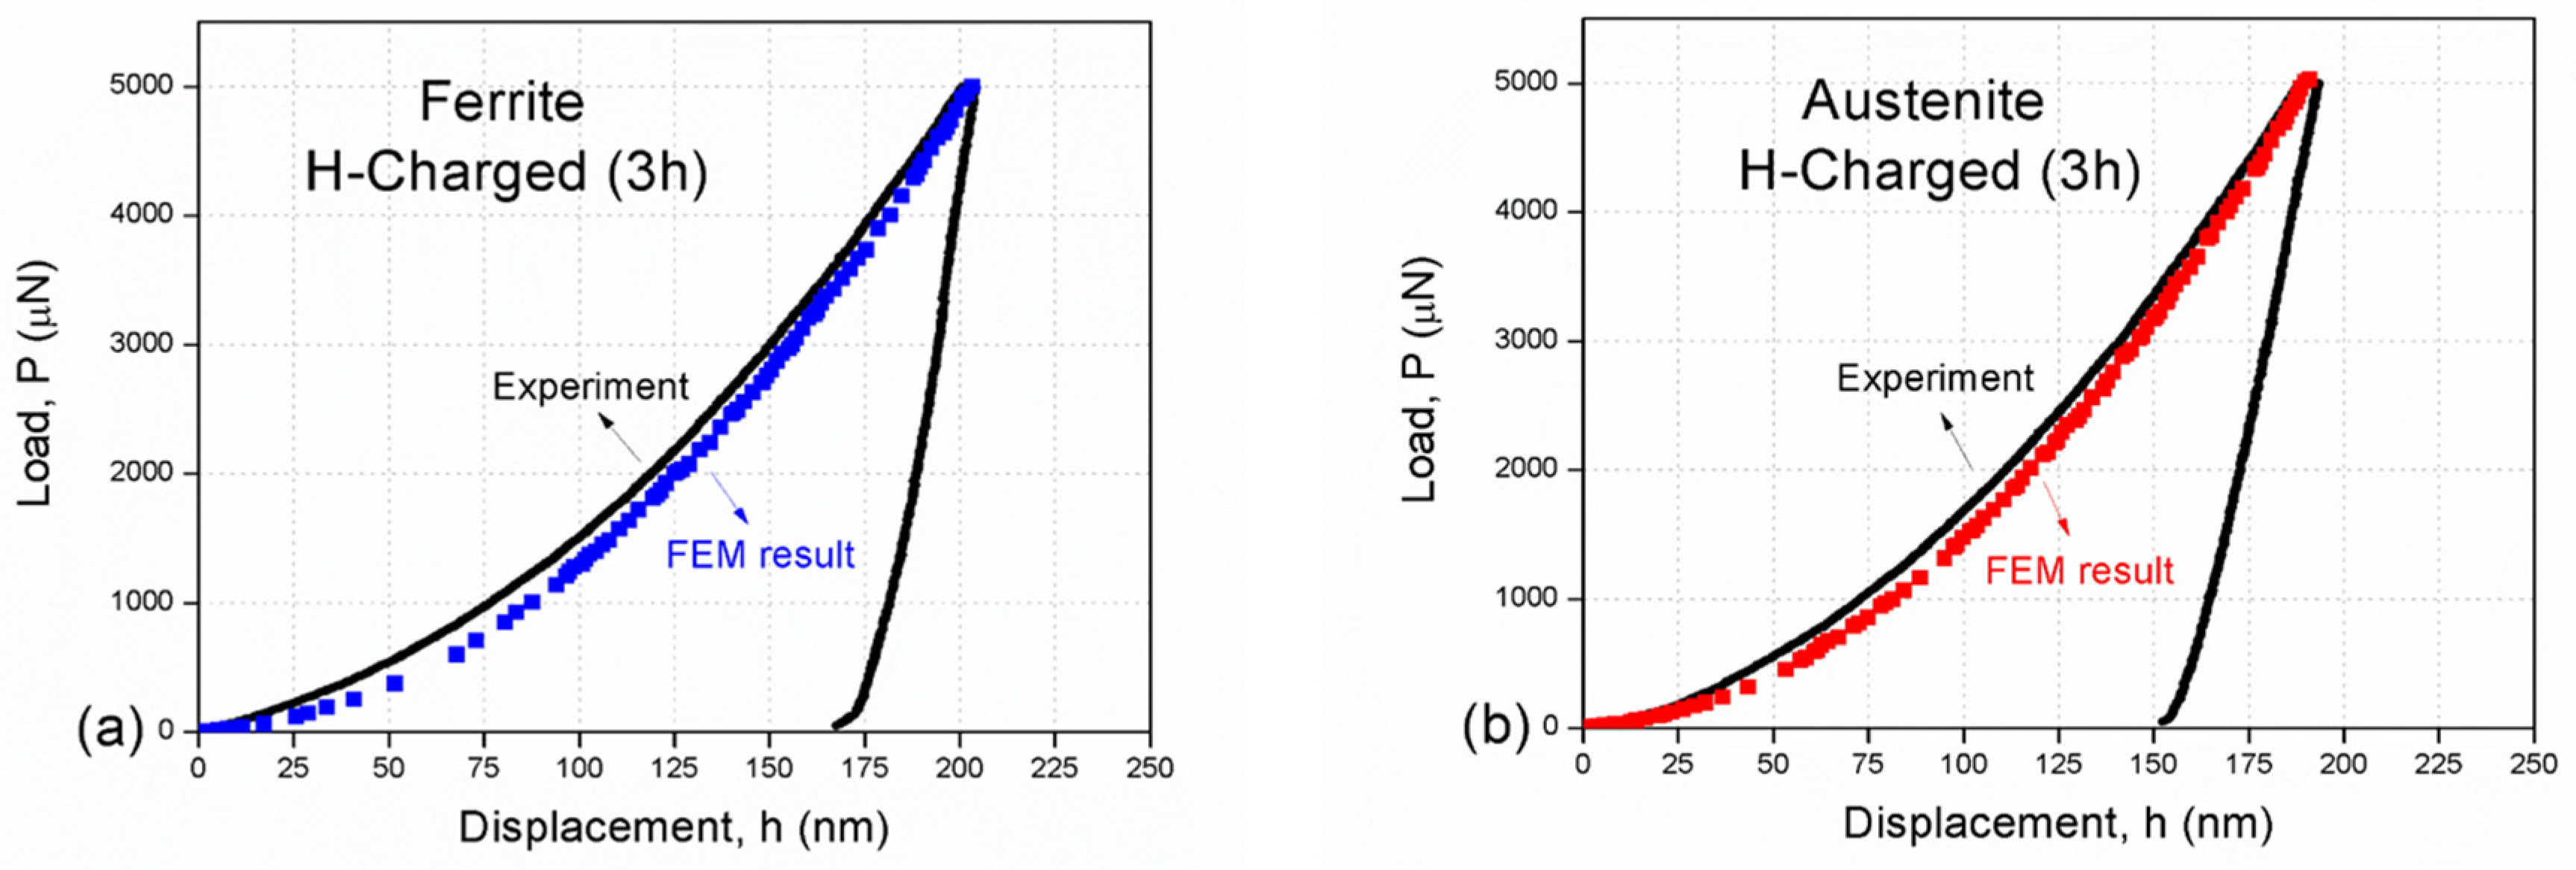
3.4. Finite Element Modelling Results
3.5. Discussion
4. Conclusions
- (1)
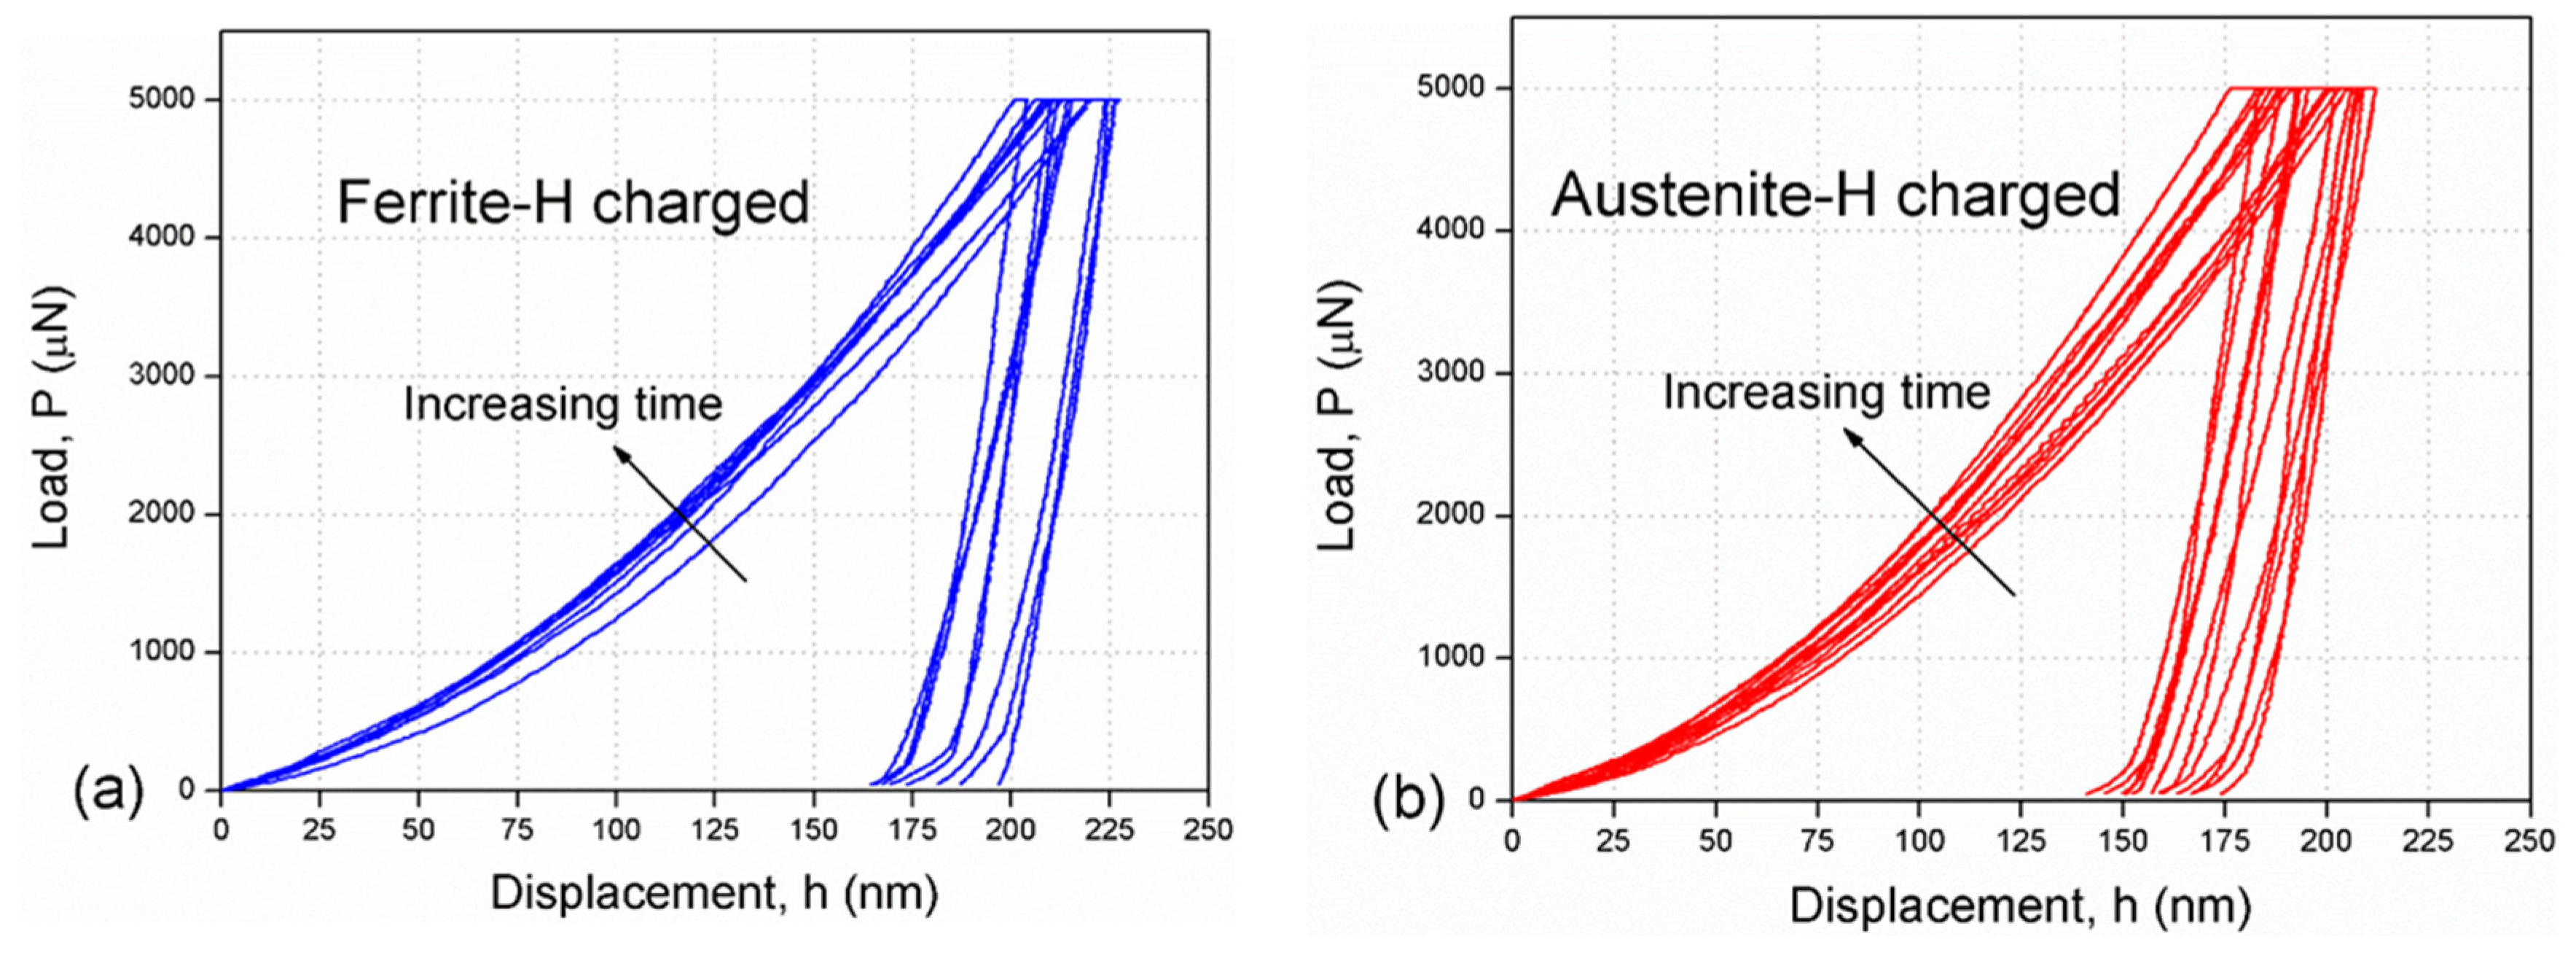
- In the in situ hydrogen charging tests, the nano-hardness values of ferrite and austenite gradually increased with time, showing the performance of hydrogen-induced hardening. The nano-hardness increases of austenite increased more than that of ferrite.
- (2)
- After 3 h of charging, the hardness of ferrite and austenite reached a saturated state, resulting in the respectively increased the nano-hardness of ferrite and austenite by 17.5% and 46.1%, when compared with the non-charged results.
- (3)
- Using the determined material parameters while considering the geometrically necessary dislocations effect in the microstructure-based finite element model, the numerically predicted results are much closer to the experimental data, reducing the errors from about 50% to less than 5%. Based on the modeling analyses in this study, the prediction results are in agreement with our experiment, showing that this is a suitable predictive methodology for reproducing nanoindentation curves.
Author Contributions
Funding
Institutional Review Board Statement
Informed Consent Statement
Data Availability Statement
Conflicts of Interest
References
- Dwivedi, S.K.; Vishwakarma, M. Hydrogen embrittlement in different materials: A review. Int. J. Hydrogen Energy 2018, 43, 21603–21616. [Google Scholar] [CrossRef]
- Yu, H.; Díaz, A.; Lu, X.; Sun, B.; Ding, Y.; Koyama, M.; He, J.; Zhou, X.; Oudriss, A.; Feaugas, X.; et al. Hydrogen Embrittlement as a Conspicuous Material Challenge—Comprehensive Review and Future Directions. Chem. Rev. 2024, 124, 6271–6392. [Google Scholar] [CrossRef]
- Li, X.; Zhang, J.; Cui, Y.; Djukic, M.B.; Feng, H.; Wang, Y. Review of the hydrogen embrittlement and interactions between hydrogen and microstructural interfaces in metallic alloys: Grain boundary, twin boundary, and nano-precipitate. Int. J. Hydrogen Energy 2024, 72, 74–109. [Google Scholar] [CrossRef]
- Popov, B.N.; Lee, J.W.; Djukic, M.B. Hydrogen permeation and hydrogen-induced cracking. In Handbook of Environmental Degradation of Materials; William Andrew Publishing: Norwich, NY, USA, 2018; pp. 133–162. [Google Scholar]
- Ghosh, G.; Rostron, P.; Garg, R.; Panday, A. Hydrogen induced cracking of pipeline and pressure vessel steels: A review. Eng. Fract. Mech. 2018, 199, 609–618. [Google Scholar] [CrossRef]
- Ohaeri, E.; Eduok, U.; Szpunar, J. Hydrogen related degradation in pipeline steel: A review. Int. J. Hydrogen Energy 2018, 43, 14584–14617. [Google Scholar] [CrossRef]
- Behvar, A.; Haghshenas, M.; Djukic, M.B. Hydrogen embrittlement and hydrogen-induced crack initiation in additively manufactured metals: A critical review on mechanical and cyclic loading. Int. J. Hydrogen Energy 2024, 58, 1214–1239. [Google Scholar] [CrossRef]
- Findley, K.O.; O’Brien, M.K.; Nako, H. Critical Assessment 17: Mechanisms of hydrogen induced cracking in pipeline steels. Mater. Sci. Technol. 2015, 31, 1673–1680. [Google Scholar] [CrossRef]
- Djukic, M.; Zeravcic, V.S.; Bakic, G.; Sedmak, A.; Rajicic, B. Hydrogen damage of steels: A case study and hydrogen embrittlement model. Eng. Fail. Anal. 2015, 58, 485–498. [Google Scholar] [CrossRef]
- Djukic, M.B.; Bakic, G.M.; Zeravcic, V.S.; Sedmak, A.; Rajicic, B. The synergistic action and interplay of hydrogen embrittlement mechanisms in steels and iron: Localized plasticity and decohesion. Eng. Fract. Mech. 2019, 216, 106528. [Google Scholar] [CrossRef]
- Sofronis, P.; Birnbaum, H.K. Mechanics of the hydrogendashdislocationdashimpurity interactions—I. Increasing shear modulus. J. Mech. Phys. Solids 1995, 43, 49–90. [Google Scholar] [CrossRef]
- Birnbaum, H.K.; Sofronis, P. Hydrogen-enhanced localized plasticity—A mechanism for hydrogen-related fracture. Mater. Sci. Eng. A 1994, 176, 191–202. [Google Scholar] [CrossRef]
- Martin, M.L.; Dadfarnia, M.; Nagao, A.; Wang, S.; Sofronis, P. Enumeration of the hydrogen-enhanced localized plasticity mechanism for hydrogen embrittlement in structural materials. Acta Mater. 2019, 165, 734–750. [Google Scholar] [CrossRef]
- Luu, W.C.; Liu, P.W.; Wu, J.K. Hydrogen transport and degradation of a commercial duplex stainless steel. Corros. Sci. 2002, 44, 1783–1791. [Google Scholar] [CrossRef]
- Zakroczymski, T.; Glowacka, A.; Swiatnicki, W. Effect of hydrogen concentration on the embrittlement of a duplex stainless steel. Corros. Sci. 2005, 47, 1403–1414. [Google Scholar] [CrossRef]
- Elhoud, A.M.; Renton, N.C.; Deans, W.F. Hydrogen embrittlement of super duplex stainless steel in acid solution. Int. J. Hydrogen Energy 2010, 35, 6455–6464. [Google Scholar] [CrossRef]
- Örnek, C.; Engelberg, D.L. Towards understanding the effect of deformation mode on stress corrosion cracking susceptibility of grade 2205 duplex stainless steel. Mater. Sci. Eng. A 2016, 666, 269–279. [Google Scholar] [CrossRef]
- Yang, J.; Wang, Q.; Guan, K. Effect of stress and strain on corrosion resistance of duplex stainless steel. Int. J. Press. Vessel. Pip. 2013, 110, 72–76. [Google Scholar] [CrossRef]
- Da Silva, B.R.S.; Salvio, F.; Dos Santos, D.S. Hydrogen induced stress cracking in UNS S32750 super duplex stainless steel tube weld joint. Int. J. Hydrogen Energy 2015, 40, 17091–17101. [Google Scholar] [CrossRef]
- Owczarek, E.; Zakroczymski, T. Hydrogen transport in a duplex stainless steel. Acta Mater. 2000, 48, 3059–3070. [Google Scholar] [CrossRef]
- Zakroczymski, T.; Owczarek, E. Electrochemical investigation of hydrogen absorption in a duplex stainless steel. Acta Mater. 2002, 50, 2701–2713. [Google Scholar] [CrossRef]
- Gadelrab, K.R.; Li, G.; Chiesa, M.; Souier, T. Local characterization of austenite and ferrite phases in duplex stainless steel using MFM and nanoindentation. J. Mater. Res. 2012, 27, 1573–1579. [Google Scholar] [CrossRef]
- Schwarm, S.C.; Kolli, R.P.; Aydogan, E.; Mburu, S.; Ankem, S. Characterization of phase properties and deformation in ferritic-austenitic duplex stainless steels by nanoindentation and finite element method. Mater. Sci. Eng. A 2017, 680, 359–367. [Google Scholar] [CrossRef]
- Zhang, Q.; Singaravelu, A.S.S.; Zhao, Y.; Jing, T.; Chawla, N. Mechanical properties of a thermally-aged cast duplex stainless steel by nanoindentation and micropillar compression. Mater. Sci. Eng. A 2019, 743, 520–528. [Google Scholar] [CrossRef]
- Oliver, W.C.; Pharr, G.M. An improved technique for determining hardness and elastic modulus using load and displacement sensing indentation experiments. J. Mater. Res. 1992, 7, 1564–1583. [Google Scholar] [CrossRef]
- Oliver, W.C.; Pharr, G.M. Measurement of hardness and elastic modulus by instrumented indentation: Advances in understanding and refinements to methodology. J. Mater. Res. 2004, 19, 3–20. [Google Scholar] [CrossRef]
- Nix, W.D.; Gao, H. Indentation size effects in crystalline materials: A law for strain gradient plasticity. J. Mech. Phys. Solids 1998, 46, 411–425. [Google Scholar] [CrossRef]
- Knapp, J.A.; Follstaedt, D.M.; Myers, S.M.; Barbour, J.C.; Friedmann, T.A. Finite-element modeling of nanoindentation. J. Appl. Phys. 1999, 85, 1460–1474. [Google Scholar] [CrossRef]
- Durst, K.; Göken, M.; Vehoff, H. Finite element study for nanoindentation measurements on two-phase materials. J. Mater. Res. 2004, 19, 85–93. [Google Scholar] [CrossRef]
- Gadelrab, K.R.; Chiesa, M. Numerically assisted nanoindentation analysis. Mater. Sci. Eng. A 2013, 560, 267–272. [Google Scholar] [CrossRef]
- Kang, J.J.; Becker, A.A.; Wen, W.; Sun, W. Extracting elastic-plastic properties from experimental loading-unloading indentation curves using different optimization techniques. Int. J. Mech. Sci. 2018, 144, 102–109. [Google Scholar] [CrossRef]
- Mente, T.; Boellinghaus, T. Numerical investigations on hydrogen-assisted cracking in duplex stainless steel microstructures. In Cracking Phenomena in Welds IV; Springer: Cham, Switzerland, 2016; pp. 329–359. [Google Scholar]
- Zhou, J.; Gokhale, A.M.; Gurumurthy, A.; Bhat, S.P. Realistic microstructural RVE-based simulations of stress–strain behavior of a dual-phase steel having high martensite volume fraction. Mater. Sci. Eng. A 2015, 630, 107–115. [Google Scholar] [CrossRef]
- Barnoush, A.; Vehoff, H. Electrochemical nanoindentation: A new approach to probe hydrogen/deformation interaction. Scr. Mater. 2006, 55, 195–198. [Google Scholar] [CrossRef]
- Barnoush, A.; Vehoff, H. In situ electrochemical nanoindentation: A technique for local examination of hydrogen embrittlement. Corros. Sci. 2008, 50, 259–267. [Google Scholar] [CrossRef]
- Kheradmand, N.; Johnsen, R.; Olsen, J.S.; Barnoush, A. Effect of hydrogen on the hardness of different phases in super duplex stainless steel. Int. J. Hydrogen Energy 2016, 41, 704–712. [Google Scholar] [CrossRef]
- Zheng, S.M.; Zhao, C. Plasma carburizing and post-treatment of austenitic stainless steel. Adv. Mater. Res. 2011, 228, 114–118. [Google Scholar] [CrossRef]
- Wang, Y.; Wang, X.; Gong, J.; Shen, L.; Dong, W. Hydrogen embrittlement of catholically hydrogen-precharged 304L austenitic stainless steel: Effect of plastic pre-strain. Int. J. Hydrogen Energy 2014, 39, 13909–13918. [Google Scholar] [CrossRef]
- Li, X.; Wang, Y.; Zhang, P.; Li, B.; Song, X.; Chen, J. Effect of pre-strain on hydrogen embrittlement of high strength steels. Mater. Sci. Eng. A 2014, 616, 116–122. [Google Scholar] [CrossRef]
- Bolshakov, A.; Pharr, G.M. Influences of pileup on the measurement of mechanical properties by load and depth sensing indentation techniques. J. Mater. Res. 1998, 13, 1049–1058. [Google Scholar] [CrossRef]
- Karimzadeh, A.; Ayatollahi, M.R.; Alizadeh, M. Finite element simulation of nanoindentation experiment on aluminum 1100. Comput. Mater. Sci. 2014, 81, 595–600. [Google Scholar] [CrossRef]
- Tao, P.; Gong, J.M.; Wang, Y.F.; Jiang, Y.; Li, Y.; Cen, W.W. Characterization on stress-strain behavior of ferrite and austenite in a 2205 duplex stainless steel based on nanoindentation and finite element method. Results Phys. 2018, 11, 377–384. [Google Scholar] [CrossRef]
- Tao, P.; Ye, F.; Liu, H.; Gong, J.M.; Yang, X.Y.; Barrett Richard, A.; Leen Seán, B. Dual-phase cohesive zone modelling and experimental validation for hydrogen-assisted cracking of 2205 duplex stainless steel. Int. J. Press. Vessel. Pip. 2021, 190, 104296. [Google Scholar] [CrossRef]
- Basa, A.; Barnoush, A.; Thaulow, C. Nanomechanical testing of hydrogen effects on super duplex stainless steel. Mech. Test. Diagn. 2012, 2, 5. [Google Scholar]
- Matsumoto, T.; Eastman, J.; Birnbaum, H. Direct observations of enhanced dislocation mobility due to hydrogen. Scr. Metall. 1981, 15, 1033–1037. [Google Scholar] [CrossRef]
- Ferreira, P.J.; Robertson, I.M.; Birnbaum, H.K. Hydrogen effects on the interaction between dislocations. Acta Mater. 1998, 46, 1749–1757. [Google Scholar] [CrossRef]
- Silverstein, R.; Sobol, O.; Boellinghaus, T.; Unger, W.; Eliezer, D. Hydrogen behavior in SAF 2205 duplex stainless steel. J. Alloys Compd. 2017, 695, 2689–2695. [Google Scholar] [CrossRef]
- Hutchinson, J.W.; Fleck, N. Strain gradient plasticity. Adv. Appl. Mech. 1997, 33, 295–361. [Google Scholar]
- Fleck, N.; Muller, G.; Ashby, M.; Hutchinson, J. Strain gradient plasticity: Theory and experiment. Acta Metall. Et Mater. 1994, 42, 475–487. [Google Scholar] [CrossRef]
- Ma, A.; Roters, F.; Raabe, D. A dislocation density based constitutive model for crystal plasticity FEM including geometrically necessary dislocations. Acta Mater. 2006, 54, 2169–2179. [Google Scholar] [CrossRef]
- Giordana, M.F.; Alvarez-Armas, I.; Armas, A. Microstructural characterization of EUROFER 97 during low-cycle fatigue. J. Nucl. Mater. 2012, 424, 247–251. [Google Scholar] [CrossRef]
- Barrett, R.A.; O’Donoghue, P.E.; Leen, S.B. A physically-based high temperature yield strength model for 9Cr steels. Mater. Sci. Eng. A 2018, 730, 410–424. [Google Scholar] [CrossRef]
- Abu Al-Rub, R.K.; Faruk, A.N.M. Dislocation-based model for predicting size-scale effects on the micro and nano indentation hardness of metallic materials. Int. J. Mater. Struct. Integr. 2010, 4, 251–277. [Google Scholar]
- Harjo, S.; Tomota, Y.; Ono, M. Measurements of thermal residual elastic strains in ferrite–austenite Fe–Cr–Ni alloys by neutron and X-ray diffractions. Acta Mater. 1998, 47, 353–362. [Google Scholar] [CrossRef]
- Asgari, M.; Barnoush, A.; Johnsen, R.; Hoel, R. Microstructural characterization of pulsed plasma nitrided 316L stainless steel. Mater. Sci. Eng. A 2011, 529, 425–434. [Google Scholar] [CrossRef]
- Schwarz, U.D. A generalized analytical model for the elastic deformation of an adhesive contact between a sphere and a flat surface. J. Colloid Interface Sci. 2003, 261, 99–106. [Google Scholar] [CrossRef]
- Nibur, K.A.; Bahr, D.F.; Somerday, B.P. Hydrogen effects on dislocation activity in austenitic stainless steel. Acta Mater. 2006, 54, 2677–2684. [Google Scholar] [CrossRef]
- Durst, K.; Maier, V. Dynamic nanoindentation testing for studying thermally activated processes from single to nanocrystalline metals. Curr. Opin. Solid State Mater. Sci. 2015, 19, 340–353. [Google Scholar] [CrossRef]
- Momotani, Y.; Shibata, A.; Terada, D.; Tsuji, N. Effect of strain rate on hydrogen embrittlement in low-carbon martensitic steel. Int. J. Hydrogen Energy 2017, 42, 3371–3379. [Google Scholar] [CrossRef]
- Dadfarnia, M.; Martin, M.L.; Nagao, A.; Sofronis, P.; Robertson, I.M. Modeling hydrogen transport by dislocations. J. Mech. Phys. Solids 2015, 78, 511–525. [Google Scholar] [CrossRef]
- Hong, Y.; Zhou, C.; Zheng, Y.; Zhang, L.; Zheng, J.; Chen, X. Dependence of strain rate on hydrogen-induced hardening of austenitic stainless steel investigated by nanoindentation. Int. J. Hydrogen Energy 2019, 44, 14055–14063. [Google Scholar] [CrossRef]
- Hong, Y.; Zhou, C.; Zheng, Y.; Zhang, L.; Zheng, J.; Chen, X. Effect of hydrogen and strain rate on nanoindentation creep of austenitic stainless steel. Int. J. Hydrogen Energy 2019, 44, 1253–1262. [Google Scholar] [CrossRef]
- Mayo, M.J.; Nix, W.D. A micro-indentation study of superplasticity in Pb, Sn, and Sn-38 wt% Pb. Acta Metall. 1988, 36, 2183–2192. [Google Scholar] [CrossRef]
- Lucas, B.N.; Oliver, W.C. Indentation power-law creep of high-purity indium. Metall. Mater. Trans. A 1999, 30, 601–610. [Google Scholar] [CrossRef]


| C | Cr | Ni | Mo | Mn | Si | Cu | Co | N | Fe |
|---|---|---|---|---|---|---|---|---|---|
| 0.015 | 22.15 | 5.69 | 3.14 | 1.41 | 0.40 | 0.27 | 0.2 | 0.18 | Bal. |
| Property | Ferrite | Austenite |
|---|---|---|
| Nano-hardness, (GPa) | 3.94 0.19 | 4.06 0.23 |
| Reduced modulus, (GPa) | 182.29 5.69 | 177.52 10.86 |
| Elastic modulus, (GPa) | 197.27 | 191.17 |
| Time, t (h) | Nano-hardness, H (GPa) | |||
|---|---|---|---|---|
| Ferrite | Austenite | |||
| 0 | 3.94 0.19 | 4.06 0.23 | ||
| 0.5 | 4.21 0.20 | 6.9% | 4.72 0.17 | 16.3% |
| 1 | 4.36 0.19 | 10.7% | 5.09 0.26 | 25.4% |
| 2 | 4.56 0.18 | 15.7% | 5.89 0.15 | 45.1% |
| 3 | 4.63 0.17 | 17.5% | 5.93 0.13 | 46.1% |
| After 12 h hydrogen release | 3.66 0.08 | 7.1% | 3.98 0.12 | 2.0% |
| Parameter | BCC (Ferrite) | FCC (Austenite) |
|---|---|---|
| (MPa) | 579.49 | 653.10 |
| 2.9 | 3.06 | |
| 0.23 | 0.23 | |
| (GPa) | 79.59 | 76.86 |
| (nm) | 0.2482 | 0.2503 |
| Parameters | Ferrite (Uncharged) | Ferrite (Charged) | Austenite (Uncharged) | Austenite (Charged) |
|---|---|---|---|---|
| Depth, (nm) | 222.28 | 203.37 | 221.14 | 191.11 |
| Dislocation, () | 3.48 × 10¹⁵ | 3.81 × 10¹⁵ | 3.47 × 10¹⁵ | 4.02 × 10¹⁵ |
| Yield strength, (MPa) | 1356.77 | 1392.79 | 1450.68 | 1511.57 |
Disclaimer/Publisher’s Note: The statements, opinions and data contained in all publications are solely those of the individual author(s) and contributor(s) and not of MDPI and/or the editor(s). MDPI and/or the editor(s) disclaim responsibility for any injury to people or property resulting from any ideas, methods, instructions or products referred to in the content. |
© 2024 by the authors. Licensee MDPI, Basel, Switzerland. This article is an open access article distributed under the terms and conditions of the Creative Commons Attribution (CC BY) license (https://creativecommons.org/licenses/by/4.0/).
Share and Cite
Tao, P.; Zhou, W.; Liu, H.; Liu, X. Nanoindentation Study on the Local Evaluation of Hydrogen-Induced Hardening Performance of Ferrite and Austenite in 2205 Duplex Stainless Steel: Experiment and Finite Element Modeling. Coatings 2024, 14, 1075. https://doi.org/10.3390/coatings14081075
Tao P, Zhou W, Liu H, Liu X. Nanoindentation Study on the Local Evaluation of Hydrogen-Induced Hardening Performance of Ferrite and Austenite in 2205 Duplex Stainless Steel: Experiment and Finite Element Modeling. Coatings. 2024; 14(8):1075. https://doi.org/10.3390/coatings14081075
Chicago/Turabian StyleTao, Ping, Wei Zhou, Hongmei Liu, and Xuedong Liu. 2024. "Nanoindentation Study on the Local Evaluation of Hydrogen-Induced Hardening Performance of Ferrite and Austenite in 2205 Duplex Stainless Steel: Experiment and Finite Element Modeling" Coatings 14, no. 8: 1075. https://doi.org/10.3390/coatings14081075
APA StyleTao, P., Zhou, W., Liu, H., & Liu, X. (2024). Nanoindentation Study on the Local Evaluation of Hydrogen-Induced Hardening Performance of Ferrite and Austenite in 2205 Duplex Stainless Steel: Experiment and Finite Element Modeling. Coatings, 14(8), 1075. https://doi.org/10.3390/coatings14081075