Article

Enhanced Analysis of Ice Accretion on Rotating Blades of Horizontal-Axis Wind Turbines Using Advanced 3D Scanning Technology

1
College of Engineering, Northeast Agriculture University, Harbin 150030, China
2
College of Arts and Sciences, Northeast Agriculture University, Harbin 150030, China
*
Author to whom correspondence should be addressed.
Coatings 2024, 14(8), 970; https://doi.org/10.3390/coatings14080970
Submission received: 25 June 2024 / Revised: 15 July 2024 / Accepted: 29 July 2024 / Published: 2 August 2024

Abstract

:
This study investigated the meteorological conditions leading to ice formation on wind turbines in a coastal mountainous area. An enhanced ice formation similarity criterion was developed for the experimental design, utilizing a scaled-down model of a 1.5 MW horizontal-axis wind turbine in icing wind tunnel tests. Three-dimensional ice shapes on the rotating blades were obtained and scanned using advanced 3D laser measurement technology. Post-processing of the scanned data facilitated the construction of solid models of the ice-covered blades. This study analyzed the maximum ice thickness, ice-covered area, and dimensionless parameters such as the maximum dimensionless ice thickness and dimensionless ice-covered area along the blade. Under the experimental conditions, the maximum ice thickness reached 0.5102 m, and the ice-covered area extended up to 0.5549 m2. The dimensionless maximum ice thickness and dimensionless ice-covered area consistently increased along the blade direction. Our analysis of 3D ice shape characteristics and the ice volume under different test conditions demonstrated that wind speed and the liquid water content (LWC) are critical factors affecting ice formation on blade surfaces. For a constant tip speed ratio, higher wind speeds and a greater LWC resulted in increased ice volumes on the blade surfaces. Specifically, increasing the wind speed can augment the ice volume by up to 57.2%, while increasing the LWC can enhance the ice volume by up to 149.2% under the experimental conditions selected in this study.

1. Introduction

When wind turbines operate in cold climate conditions, they may encounter airflow containing supercooled water droplets or encounter rain and snow, resulting in icing on their surfaces. This not only affects their performance but also poses a threat to their safe operation. Therefore, studying icing issues and their mitigation measures for wind turbines is of significant theoretical and practical importance [1]. In icing research, accurately obtaining real ice formation information has long been a crucial focus in the field of icing experiments [2,3,4,5,6]. Detailed 3D ice shape information is a key parameter for experimental goals such as selecting critical ice forms, evaluating anti-icing system performance, and developing ice models. It also holds important value for validating computational fluid dynamics (CFD) icing calculations and aerodynamic calculations under icing conditions.
The primary approaches for investigating the icing morphology on wind turbine blades encompass field observations, simulation calculations, and icing wind tunnel tests. Field observations primarily entail monitoring wind turbine icing within wind farms. However, accurately mapping the ice shape proves challenging due to various practical factors, with the main data collected focusing on changes in wind turbine output power. Simulation calculations employ numerical simulation methods to individually address the flow field around the blades, droplet motion and impact characteristics, heat transfer, and phase change processes, to derive icing shapes [7,8]. With developments in computer technology and CFD technology, simulation calculations have emerged as a crucial tool in icing research. However, due to our limited comprehension of icing mechanisms, particularly the complex coupled mass and heat transfer processes subsequent to the impact of supercooled water droplets on the blade surface, simulation calculations may not precisely determine ice shapes under specific conditions [9,10,11]. Icing wind tunnel tests entail establishing an artificial icing cloud environment on the ground for icing investigations. In comparison to simulation calculations, icing wind tunnel tests can yield quantitative results at a relatively lower cost and serve as the primary method for obtaining icing shapes [12,13,14,15].
The predominant technique utilized to determine the geometric configuration of ice in large icing wind tunnels is the “hot knife method”. This method involves the utilization of heated copper metal sheets to melt ice within ice blocks, thereby creating gaps. Subsequently, ruler paper is inserted into these gaps, and the outer contour of the ice is delineated with a pencil. While this method is simple and easily executable, the process of cutting ice shapes with a hot knife can lead to the melting of ice surrounding the cutting seam, thereby disrupting the ice structure. Additionally, inaccuracies may be introduced into the measurement results of ice shapes due to variables such as the angle and position of the pencil during the manual tracing of ice shape trajectories [16,17]. An alternative approach, the casting method, involves direct contact with the ice to ascertain its 3D shape. Through the judicious selection of materials for manufacturing, this method achieves enhanced precision [18,19]. However, the high cost of casting materials, lack of reusability, and time-intensive casting process significantly constrain the widespread adoption of this technique. Three-dimensional scanning technology represents an efficient and practical non-contact measurement methodology that amalgamates structured light technology, phase measurement technology, and computer vision technology. This technology enables the rapid and effective acquisition of 3D object information, offering significant advantages such as high scanning accuracy, rapid speed, and an extensive scanning range. It has found broad applications in diverse domains including cultural heritage preservation, civil engineering, and industrial inspection [20,21,22,23,24]. When compared with the casting method, 3D scanning facilitates the generation of digital ice shapes. These digital representations serve three primary purposes: data analysis and preservation, model creation for aerodynamic testing, and grid development for CFD simulations. Despite its utility, 3D scanning technology has been underutilized in research pertaining to ice formation on rotating turbine blades. Recent studies conducted by National Aeronautics and Space Administration (NASA) researchers have employed 3D scanning technology to conduct ice shape assessments in icing wind tunnels, thereby acquiring digital ice shape data for aircraft wings and yielding promising results [25,26,27]. Nevertheless, these investigations primarily showcase the feasibility of obtaining detailed ice shapes using this method and do not delve deeper into the icing mechanism. Furthermore, the results are predominantly applicable to aircraft icing research, where substantial distinctions exist in icing behaviors between aircraft wings and turbine blades operating under rotating conditions.
This study focused on conducting icing wind tunnel tests on a scaled-down model of a 1.5 MW horizontal-axis wind turbine. A refined criterion for simulating rotating blade icing, which was developed based on meteorological icing conditions specific to wind turbines in a coastal mountainous region, was utilized. The research delved into exploring experimental and measurement techniques to capture ice formations on the turbine blades. Three-dimensional laser scanning technology was employed to gather detailed information on the ice shapes present on the rotating blades. Subsequently, the scanning data were processed to analyze various icing characteristics, including the maximum ice thickness on 3D cross-sections, ice-covered area, dimensionless parameters, and ice volume.

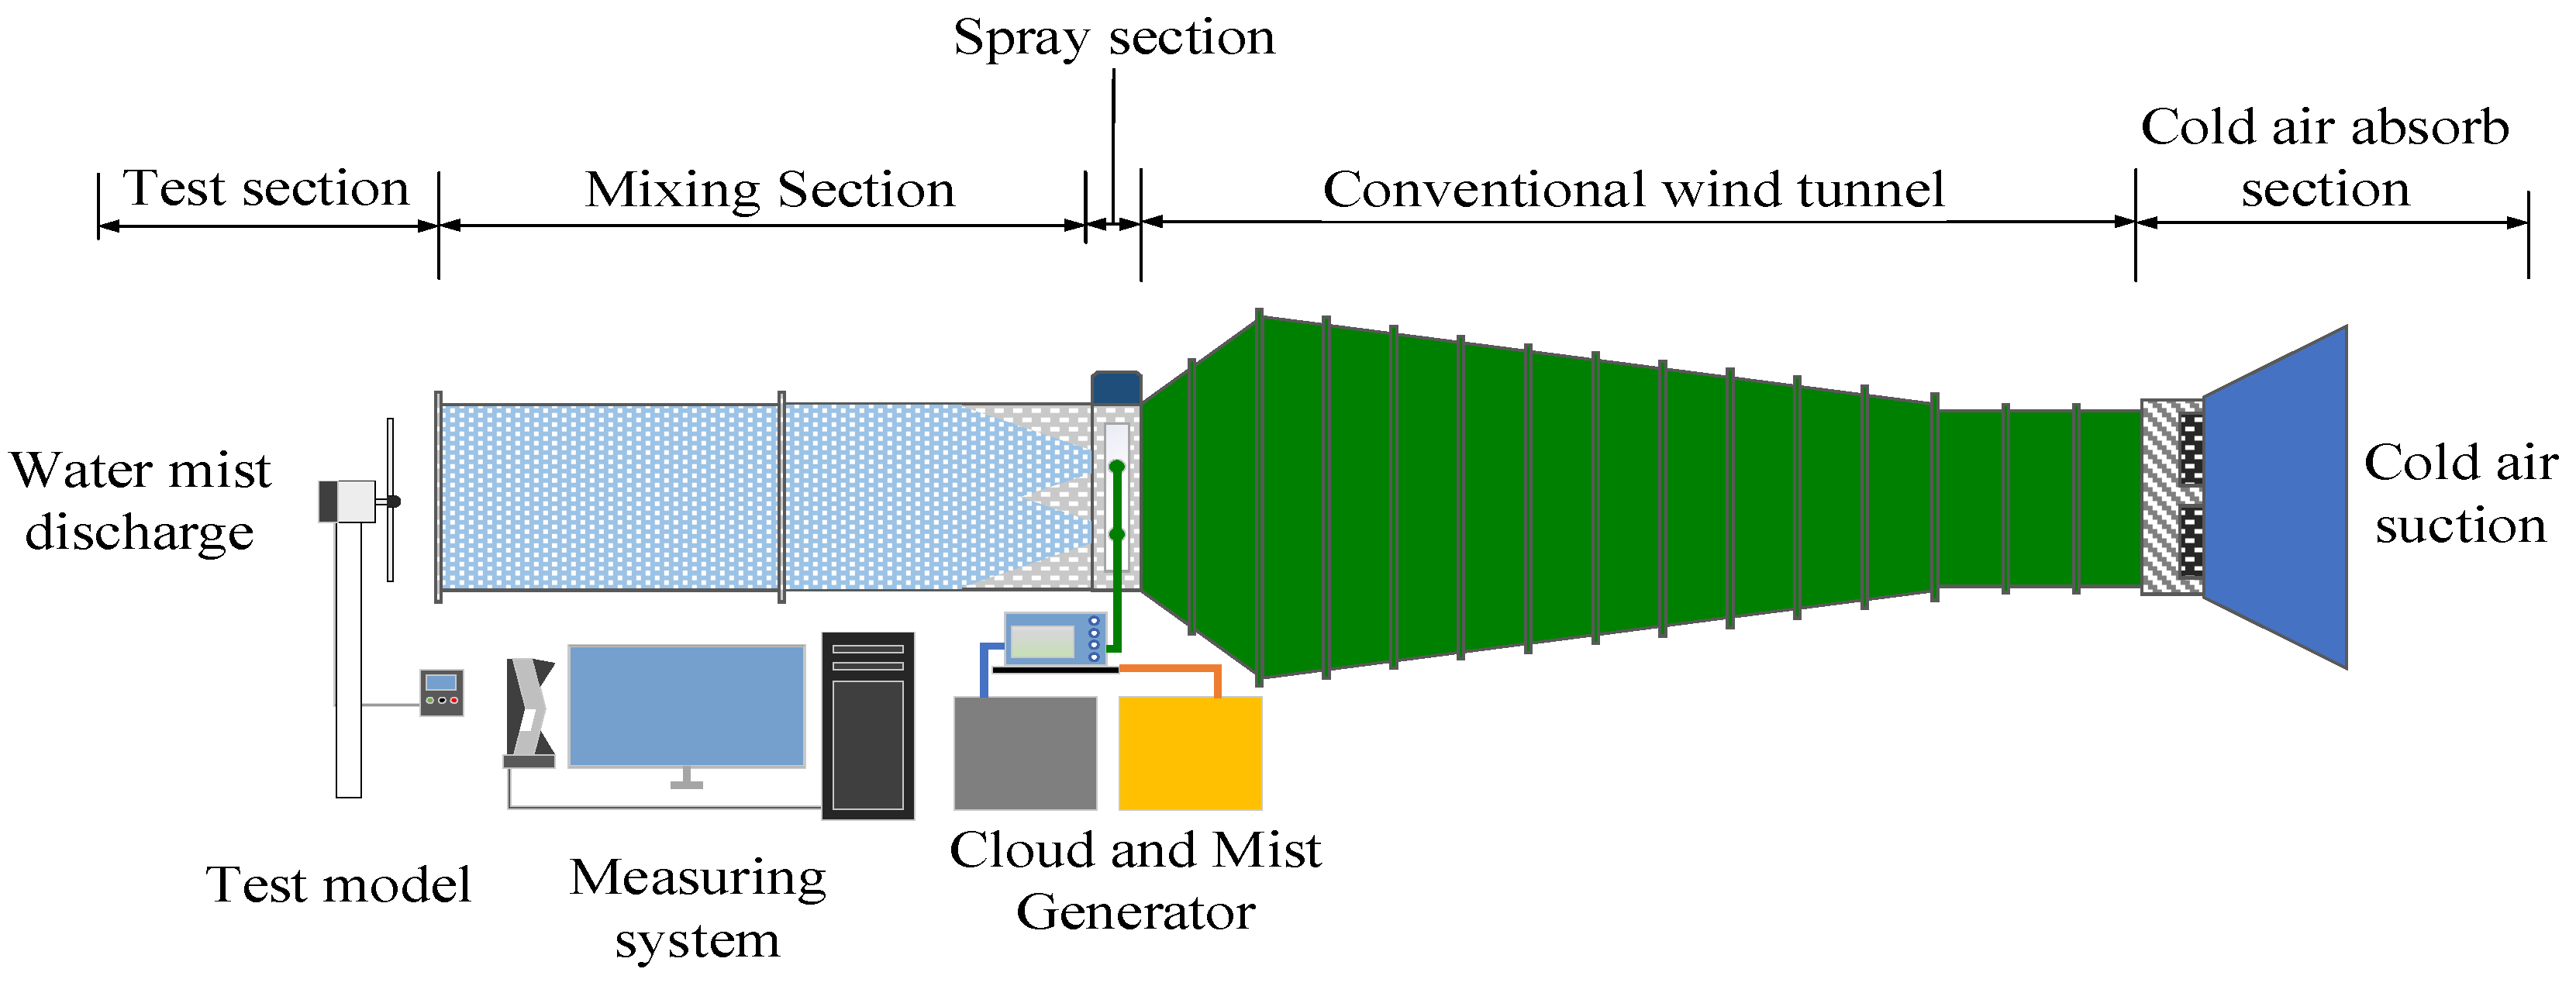
2. Experimental System

Figure 1 illustrates a schematic diagram of the icing wind tunnel test system that was designed and employed in this study. Situated in Northeast China, characterized by cold and extended winters, the laboratory introduced cold air into a standard wind tunnel during the winter season. Building upon this configuration, a naturally low-temperature icing wind tunnel was developed [28,29]. Through this experimental setup, a series of icing tests were performed on wind turbine blades [30,31].
The exit dimensions of the icing wind tunnel test system measure 1 m × 1 m, with an average wind speed accuracy at the exit section of ±3%. The wind tunnel exit section is composed of a spray section, mixing section, test section, and water mist discharge section. The spray system at the exit dispenses water droplets and includes a 2-layer, 4-nozzle spray rack, centrifugal nozzles, controller, air pump, filter device, water tank, and proportional–integral derivative (PID) temperature controller. Electric heating bands are incorporated on the spray rack to prevent water in the pipelines from freezing. The system enables control over the liquid water content (LWC) and mean volumetric diameter (MVD) of droplets through real-time adjustment of the liquid water flow and air pressure. Water droplets undergo supercooling as they pass through the wind tunnel test section with cold air, colliding and freezing on the rotating test blades downstream in the wind tunnel.
The primary parameters of the icing wind tunnel test encompass wind speed, temperature, LWC, and MVD. The wind speed calibration is conducted using an AVM-01 anemometer to measure the wind tunnel exit velocities. Wind speeds vary from 0 m/s to 17 m/s, adjusted by modulating the frequency of the wind tunnel fan motor. LWC calibration is achieved through a grid method employing organic glass (polymethyl methacrylate, PMMA). By regulating the flow rates of the spray system and air pressure, LWC levels are maintained between 0.2 g/m3 and 1.5 g/m3, in accordance with experimental specifications. MVD calibration is carried out using a laser particle size analyzer (Winner-319C (Jinan, China)), indicating that at flow rates ranging from 200 to 400 mL/min and a water pressure of 0.3 MPa, the wind tunnel predominantly consists of water droplets with diameters centered at approximately 30 μm.

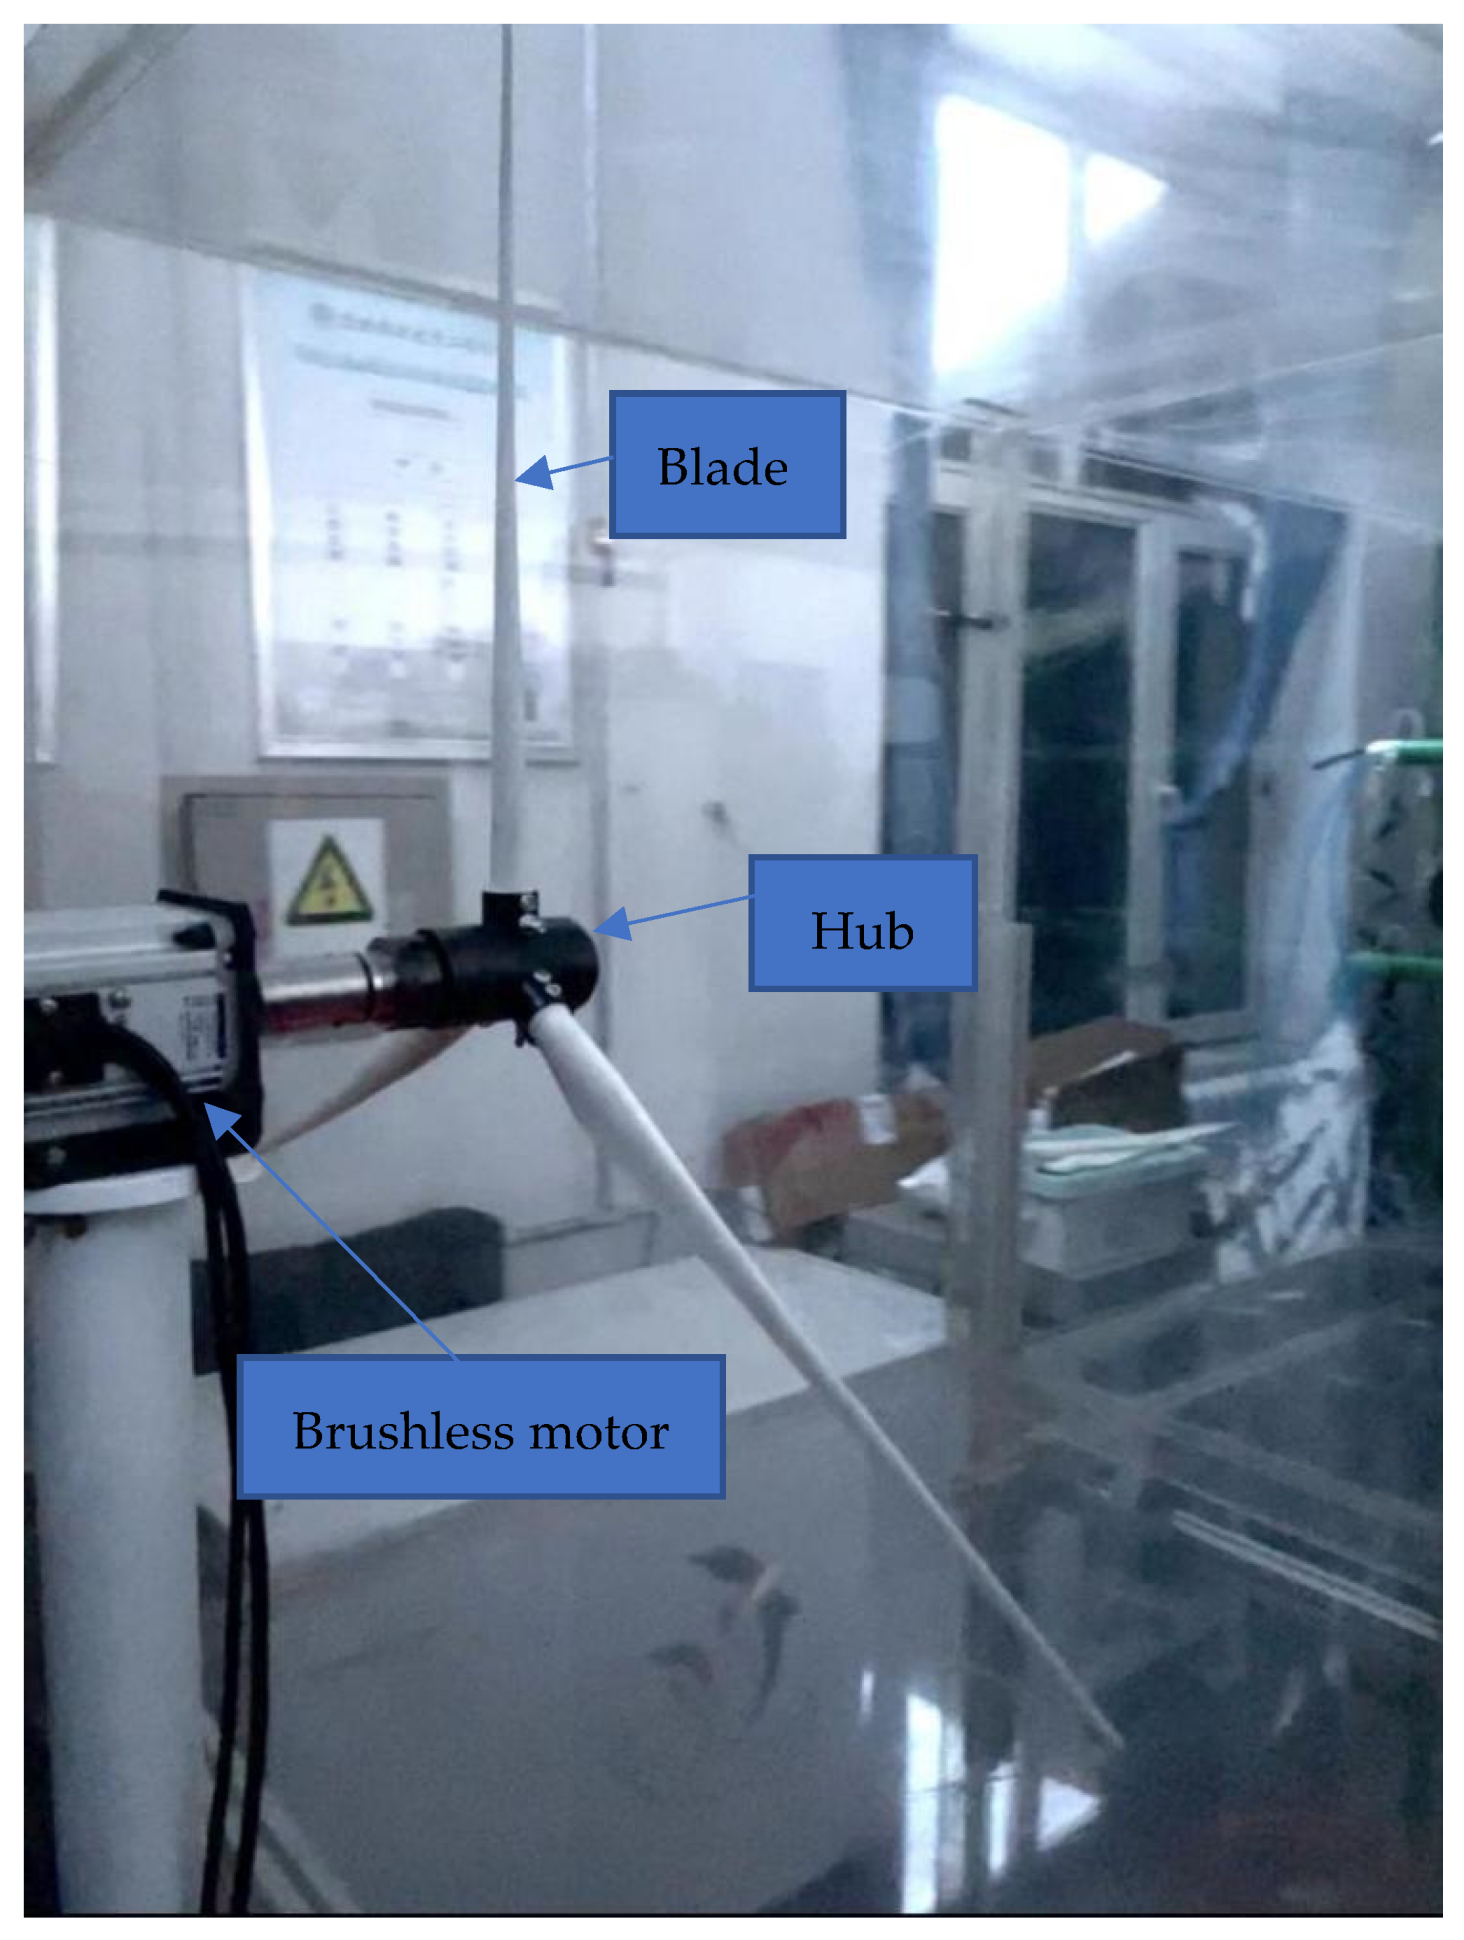
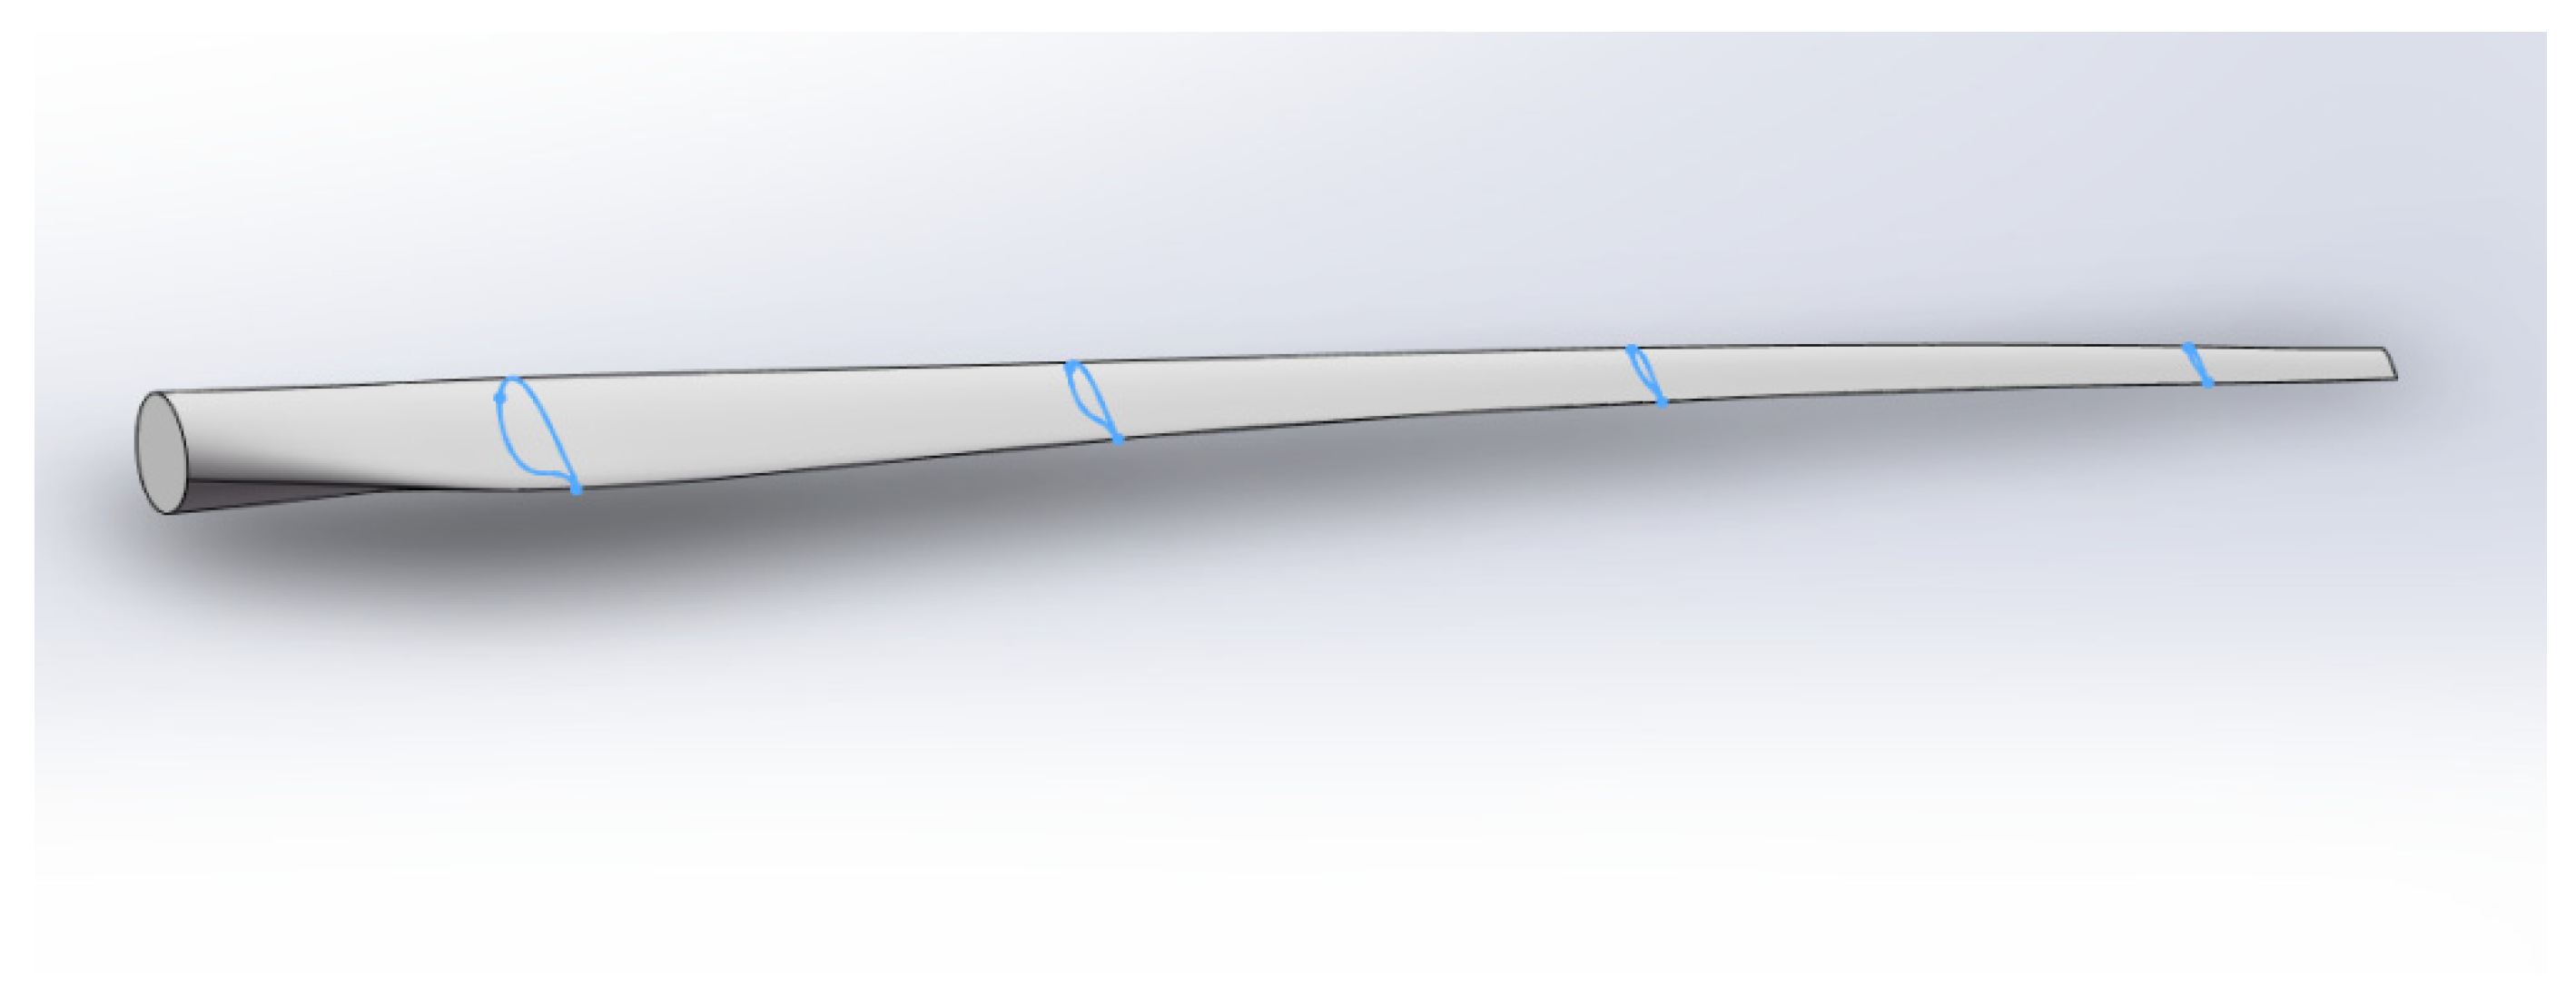
2.1. Experimental Model

Figure 2 illustrates a schematic diagram of the downscaled wind turbine model utilized in the icing wind tunnel experiments. The model operates at a scale ratio of 100:1, featuring a rotor diameter of 0.8 m and blade length of 0.37 m. The central hub is constructed from 45 quenched and tempered steel, while the blades are fabricated using nylon material with a surface roughness of 0.05 mm by employing 3D printing technology. Each blade is affixed to the hub using two bolts, and the hub and blades are linked to a permanent magnet brushless variable frequency motor through a key coupling. The motor, with a power rating of 450 W and a torque of 1.23 N·m, delivers a constant torque output regulated by a controller to uphold a consistent rotational speed of the wind turbine model within the wind tunnel. The motor is securely mounted on a stand to the ground, ensuring alignment of the rotational center of the model with the center of the test section at the wind tunnel exit.

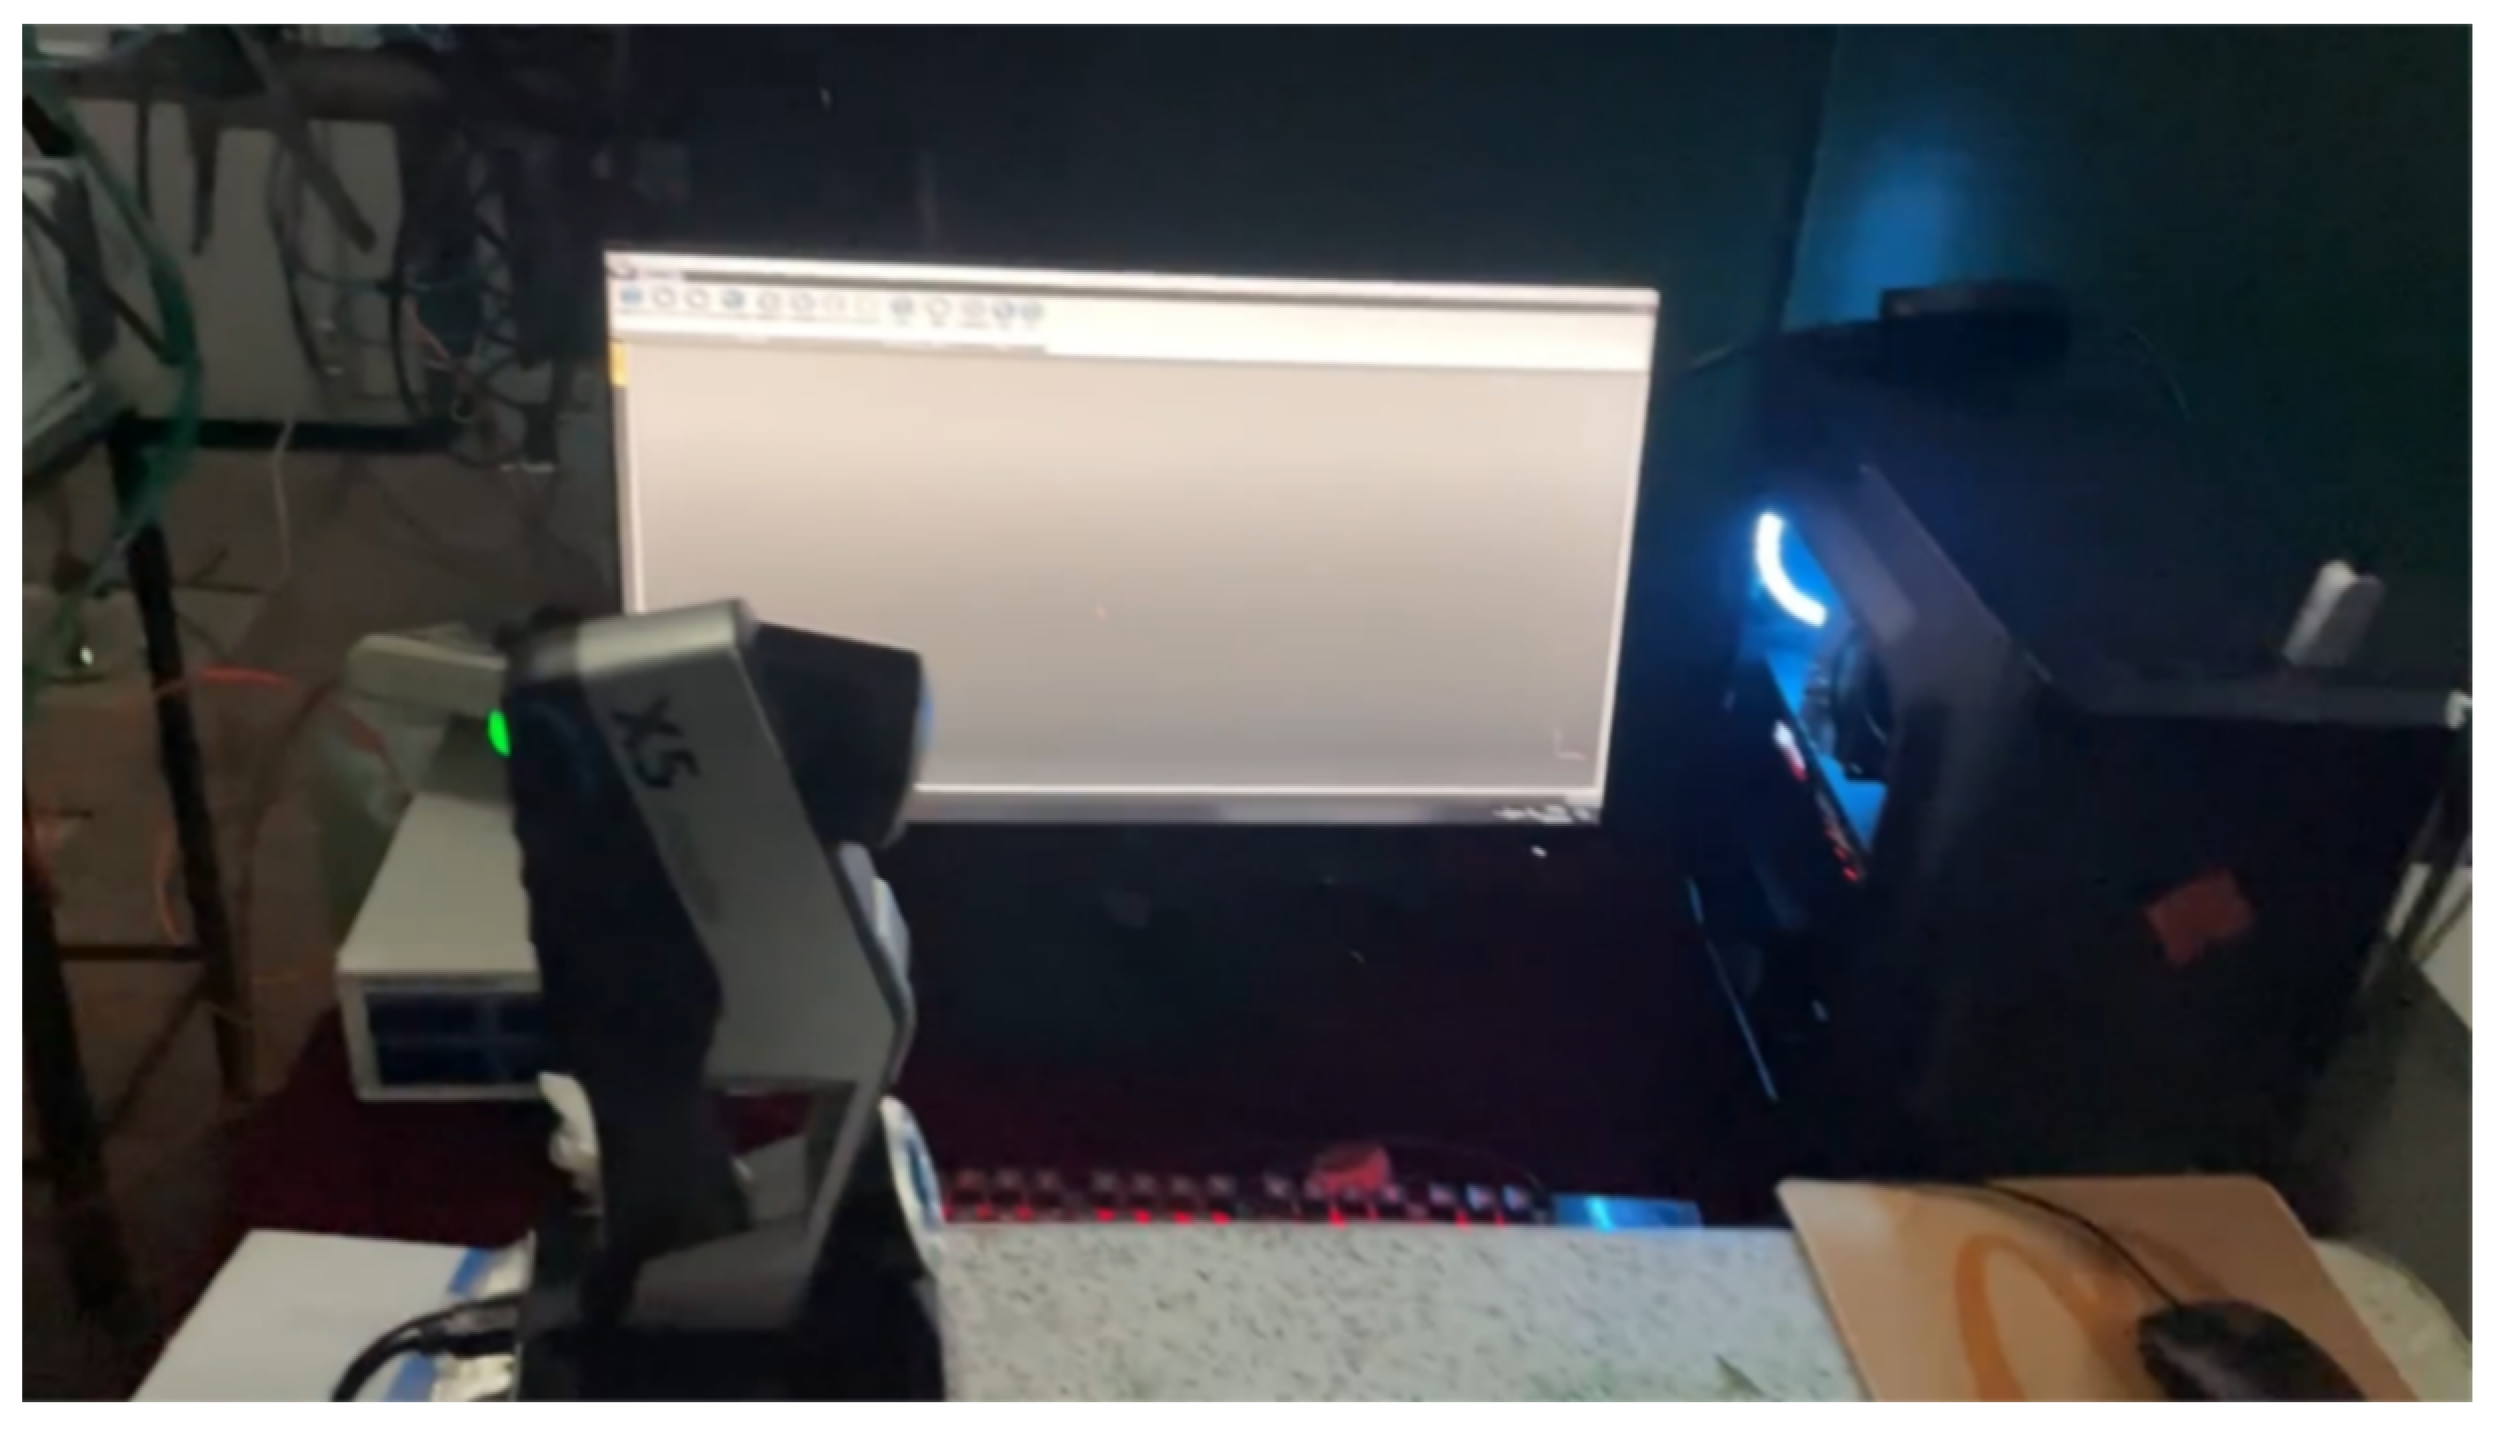
2.2. Measurement Equipment

The laser measurement equipment utilized in this research was the FreeScan X5 multifunctional handheld 3D scanner manufactured by SHINNING 3D (Hangzhou, China). This device is capable of achieving a scanning speed of up to 350,000 points/s with a measurement accuracy of 0.030 mm. The 3D scanner is utilized to capture the external 3D structure of ice formations, acquiring point cloud data of the ice shapes. The scanning measurement system is depicted in Figure 3, produced through 3D modeling and virtual reconstruction. To ensure a high resolution, a slow movement approach is adopted during scanning, with repeated scans of the same area to capture complete regional features.

3. Experimental Methods

3.1. Ice Accretion Similarity Criteria

To ensure that the results of ice accretion wind tunnel experiments are representative of actual icing conditions, adherence to the principles governing icing processes and the identification of suitable similarity criteria are imperative. These criteria serve as a foundation for the selection of appropriate experimental variables in ice accretion wind tunnel tests, guaranteeing that the ice buildup on the test model mirrors real-world scenarios as accurately as possible [32,33]. Presently, Arnold Engineering Development Complex (AEDC) criteria established by NASA and Office National d’Études et de Recherches Aérospatiales (ONERA) criteria developed by French research institutions are well-established systems of similarity criteria. While ONERA’s criteria allow for flexibility in choosing velocity and pressure values, they necessitate that pressure remains within a specific range to achieve comparable icing conditions. On the other hand, AEDC criteria provide guidelines for pressure determination but may surpass the capabilities of wind tunnel equipment in terms of selecting numerical parameters, thereby requiring adjustments in the size of the test model. Consequently, this research adopted an enhanced ice accretion similarity criterion proposed by Yi and Zhu [34]. This criterion incorporates the assumption of equal dynamic pressure as a prerequisite for defining similarity criteria, thereby establishing a connection between pressure and velocity and addressing the limitations of AEDC and ONERA criteria.
Additionally, to ensure similarity of the flow field, this study employed the equivalent velocity method. This methodology aids in overcoming the mutual restrictions imposed by Reynolds numbers on similarity assessments or computations of icing parameters, thereby enabling control over other similarity parameters. The utilization of the equivalent velocity method in achieving flow field similarity in the ice accretion system of rotating wind turbine blades is justified due to the typical location of the ice accretion region at the leading edge of the airfoil. This flow configuration allows the flow field at the leading edge of the wind turbine blade to be treated as a potential flow, resulting in an extremely thin boundary layer at the leading edge of the blade. Consequently, this thin boundary layer allows for the neglect airflow viscous effects and their minimal impact on the icing process [35]. Therefore, within a specific range, it is viable to select the same inlet wind speed for scaled model tests as for full-scale models, which corresponds to selecting the same Mach number. Consequently, the flow field similarity criteria established for the ice accretion similarity system in this study are expressed as follows:
V m = V f
Wind turbine blades are considered common rotating power equipment. Their icing behavior when not in operation resembles that of static airfoil icing. However, when in operation, they display dynamic icing behavior. Consequently, to establish similar icing conditions for wind turbine blades under rotational circumstances, this experiment took into account the necessity of ensuring that the model replicates the same tip speed ratio as an operational wind turbine experiencing the wind speeds, given the limited existing theoretical research on the subject:
λ m = λ f
In summary, the method for selecting ice accretion similarity parameters for rotating blades in this study can be described as follows:
(1)
The characteristic length of the scaled model is selected as follows:
c m = k c f
(2)
The pitch angle of the blades is determined based on geometric similarity as follows:
θ m = θ f
(3)
The test wind speed for the scaled model is selected as follows:
V m = V f
(4)
The test temperature (T) is determined using thermodynamic similarity as follows:
T m = T f
(5)
The test droplet particle diameter (d) is obtained using the modified inertia parameter [36] as follows:
d m = d f ( L m L f ) 1 2 - κ ( p m p f ) κ 2 - κ ( T m T f ) - κ 2 - κ ( v m v f ) κ - 1 2 - κ
(6)
The ice water content LWC in the scaled model test is calculated as follows [34]:
( LWC ) m = ( LWC ) f ( P m / P f ) 0.5 ( L m / L f ) 0.5 ( V m / V f ) 0.5
(7)
The test pressure (P) is determined based on dynamic pressure similarity principles as follows [34]:
P m = P f ( V m V f ) ( T m T f ) 2
(8)
The test time (t) is determined based on the similarity aggregation factor (Ac) [34] as follows:
t m = t f ( L m / L f ) 1.5 ( V m / V f ) 0.5 ( P m / P f ) 0.5
(9)
The tip speed ratio during rotation is determined based on rotational parameter similarity as follows:
λ m = λ f

3.2. Experimental Parameters

Wind turbine blade icing can be classified according to its icing characteristics as rime ice, clear ice, wet snow, and mixed ice. The meteorological conditions for wind turbine icing in this study were derived from the research of Drage and Hauge [37], where they experimentally determined the meteorological conditions for atmospheric icing at Brosviksåta on the Norwegian west coast (Table 1).
In Table 1, the wind speeds are 6 m/s, 8 m/s, and 10 m/s, LWCs are 0.1 g/m3, 0.18 g/m3, and 0.25 g/m3, and the temperature is −8 °C, with an icing duration of 8 h for investigation. Based on these conditions and referring to the rated parameters under different wind speeds of a 1.5 MW horizontal-axis wind turbine generator, to the ice accretion similarity theory parameter selection method described above, and considering the comprehensive capabilities of the ice accretion wind tunnel test, the experimental conditions for scaled model icing wind tunnel tests were selected, as shown in Table 2.

3.3. Experimental Implementation

3.3.1. Preparation of Contrast Agent

The transparency and refraction of ice pose challenges in determining the central axis of the laser beam emitted by a 3D laser scanner when it irradiates the ice surface. This difficulty hinders effective scanning of the ice and impacts ice shape measurement. To address this issue, it is essential to apply a contrast agent on the ice surface before scanning to improve its reflectivity. This enhancement allows the scanner to recognize the surface characteristics of the ice. However, many commercially available contrast agents for 3D scanning contain ethanol, which is added to ensure volatility and leave white traces. When ethanol interacts with ice, it causes melting, leading to the mixing of melted water with ethanol. This mixture inhibits the proper evaporation of ethanol, diminishing the effectiveness of the contrast agent. In this research, a coating based on titanium dioxide was utilized. It was uniformly sprayed onto the ice surface using a spray gun [26]. The ice surface both before and after the application of the contrast agent is illustrated in Figure 4.

3.3.2. Experimental Procedure

The following steps outline the procedure for conducting the icing experiment, ensuring accurate measurement and data collection:
  • Before the icing experiment begins, the model is adjusted to the experimental state, the computer is started, and the scanner is connected. The scanner exposure is adjusted using the software to ensure optimal performance under the experimental conditions of the day;
  • The wind tunnel is opened, and the wind speed is adjusted to the experimental set speed, introducing outdoor cold air flow;
  • Once the temperature reaches the set experimental temperature, the spray system is activated, and the motor controller is adjusted to rotate the wind turbine model according to the specified parameters. The icing time is recorded, and the icing wind tunnel experiment is started;
  • After 120 s of icing time, the icing wind tunnel test system is shut down, marking the end of the icing wind tunnel experiment;
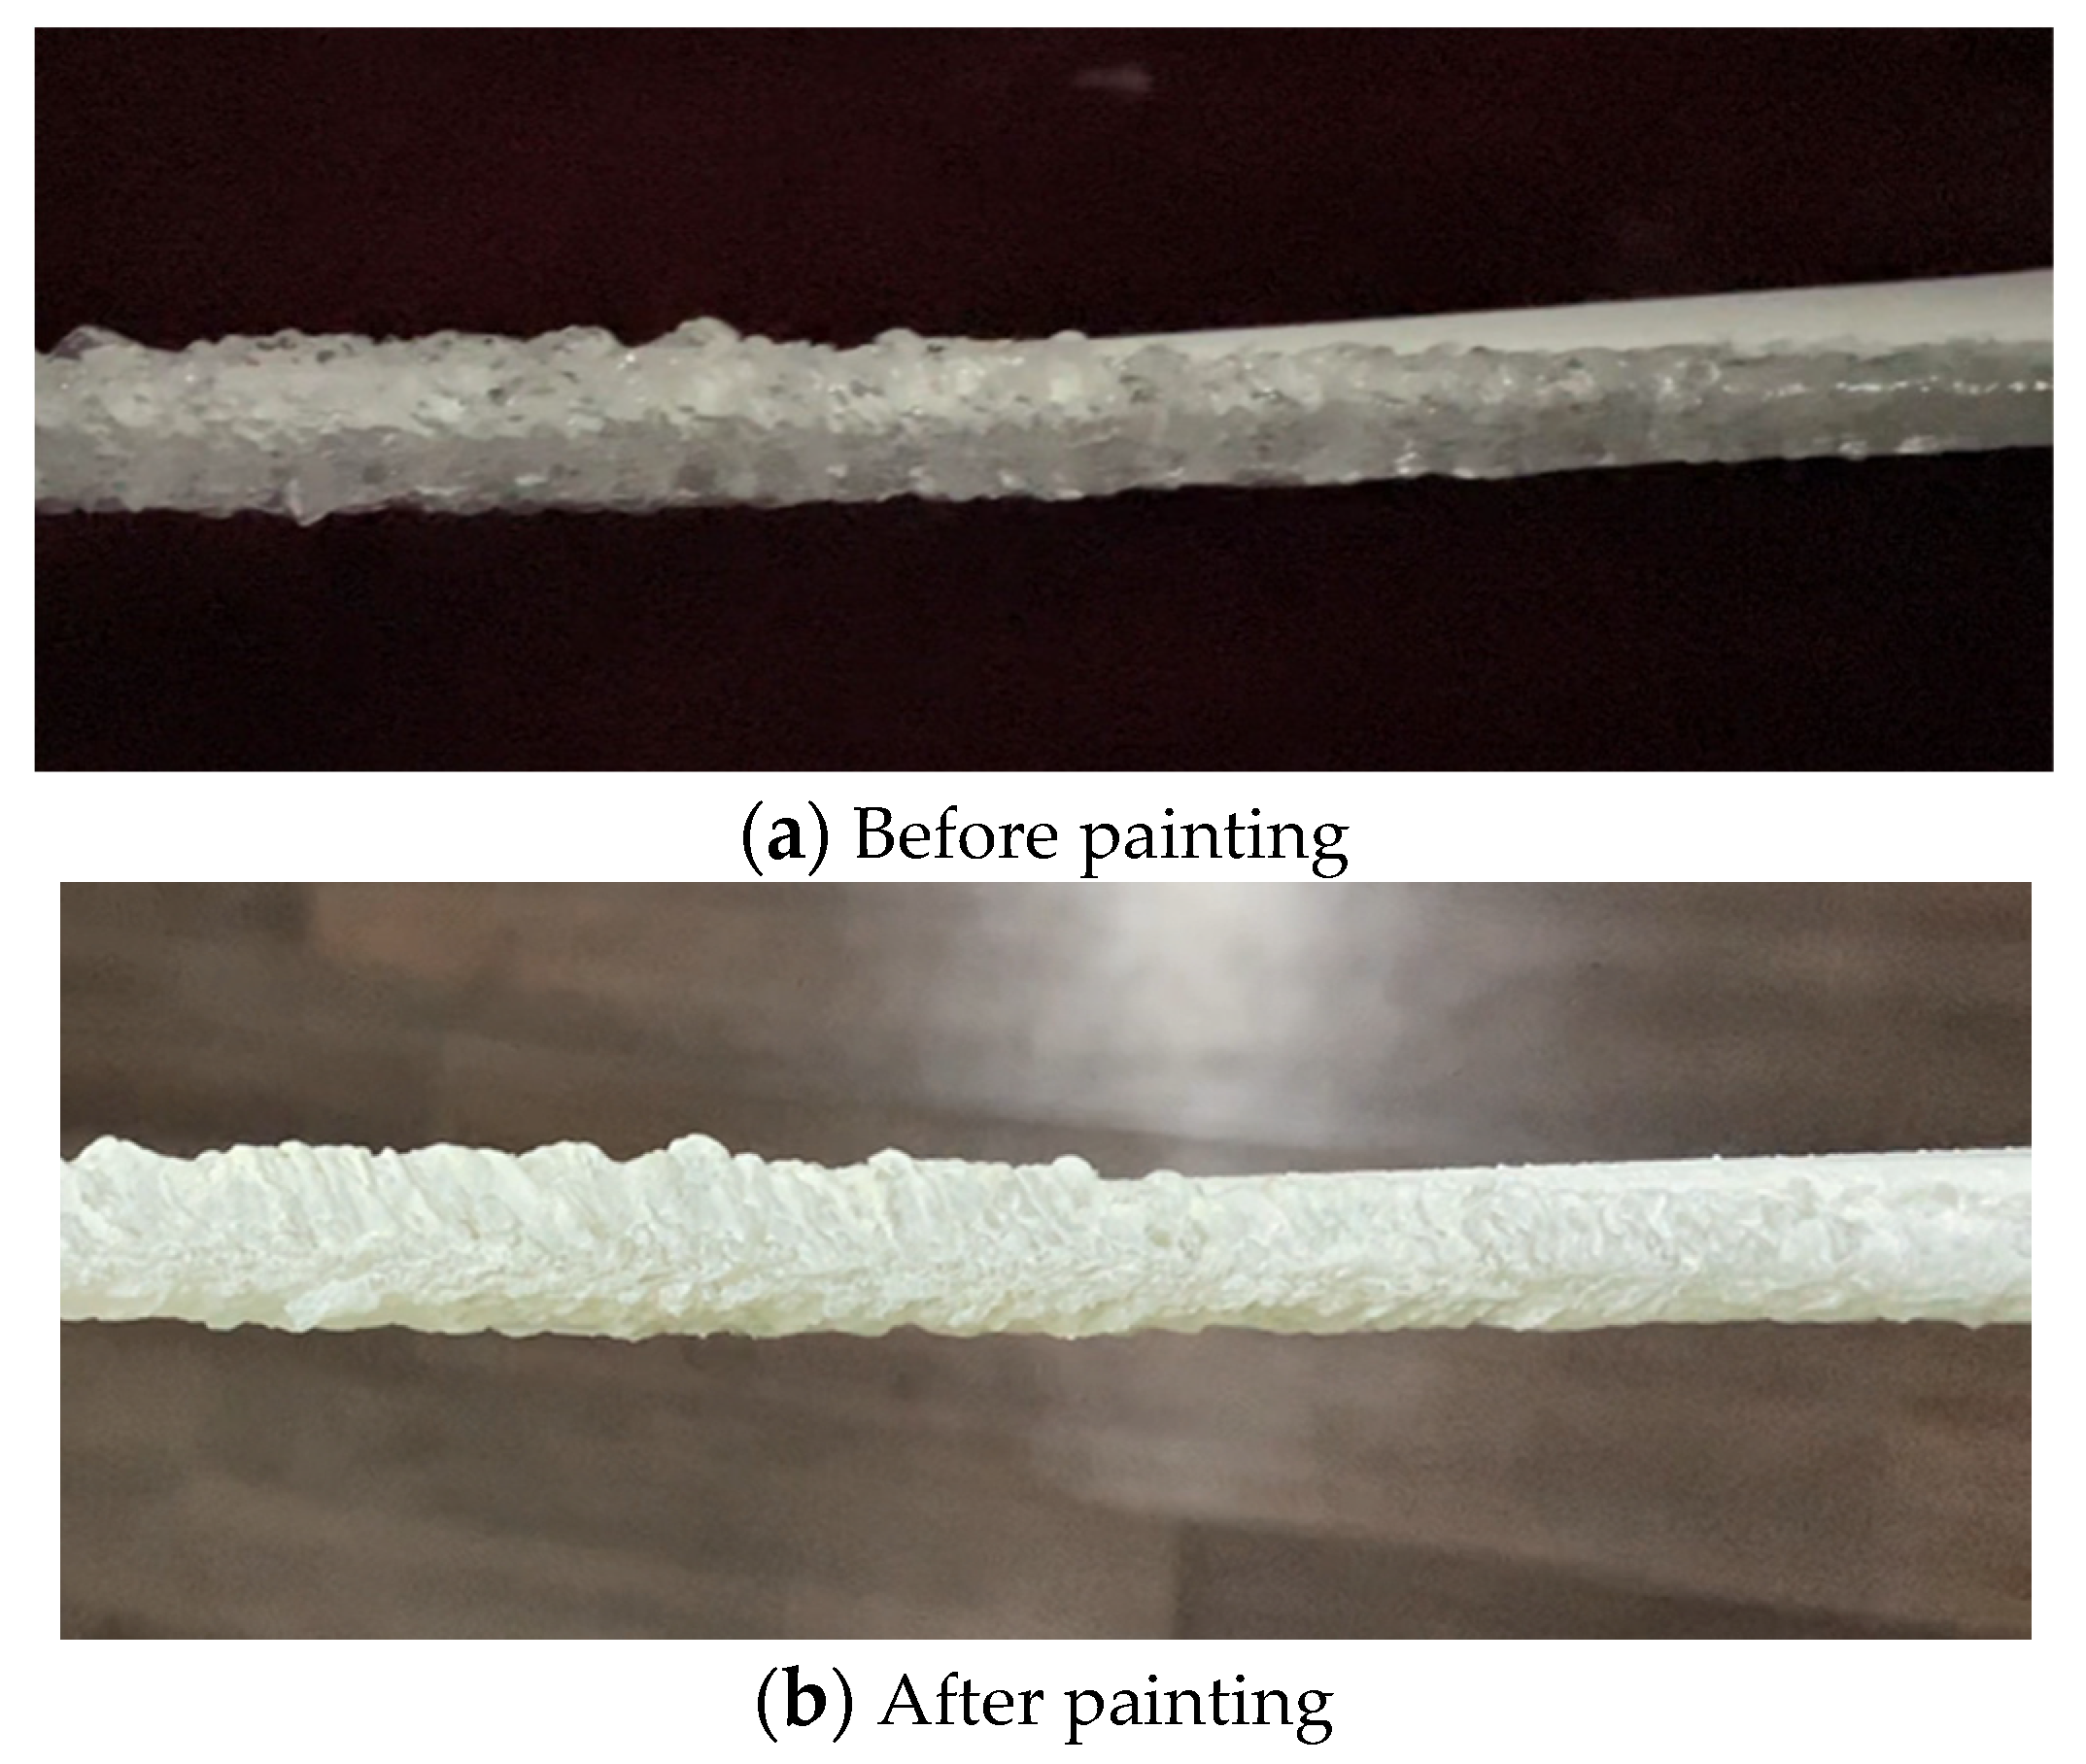
  • Following the experiment, the ice-covered blades are carefully removed. A contrast agent is uniformly sprayed on the ice positions using a spray gun, and the ice-covered blades are fixed on the scanning stage;
  • A handheld 3D laser scanner with a laser scanning probe is used to measure 3D ice profiles of the ice-covered blades from multiple angles. After scanning, the ice shape point cloud data are inspected to ensure comprehensive coverage of the areas to be measured, minimizing data discontinuities;
  • Both the clean model surface point cloud data and the ice shape point cloud data are reconstructed to form model reconstruction surfaces and ice shape reconstruction surfaces. These are aligned and matched to obtain the model-ice shape reconstruction surfaces.

3.3.3. Processing of Scanned Data

The processing of scanned data is conducted utilizing Geomagic Design X [26]. By following the scanning process, both organized and unorganized point cloud data are produced. Only the organized point cloud data are preserved and undergo surface reconstruction to produce solids, which are subsequently transformed into digital models compatible with forward modeling software such as SolidWorks and SCDM. These models are designed for further analysis, physical modeling, or numerical simulations. The detailed steps for processing point cloud data are outlined as follows:
  • Noise Reduction: During the scanning process, uncertainties stemming from the scanner and the scanning environment can lead to certain points deviating from the surface being scanned, thus creating outliers. The utilization of the noise reduction command aids in repositioning these points to their statistically accurate locations, thereby guaranteeing a more seamless arrangement of points;
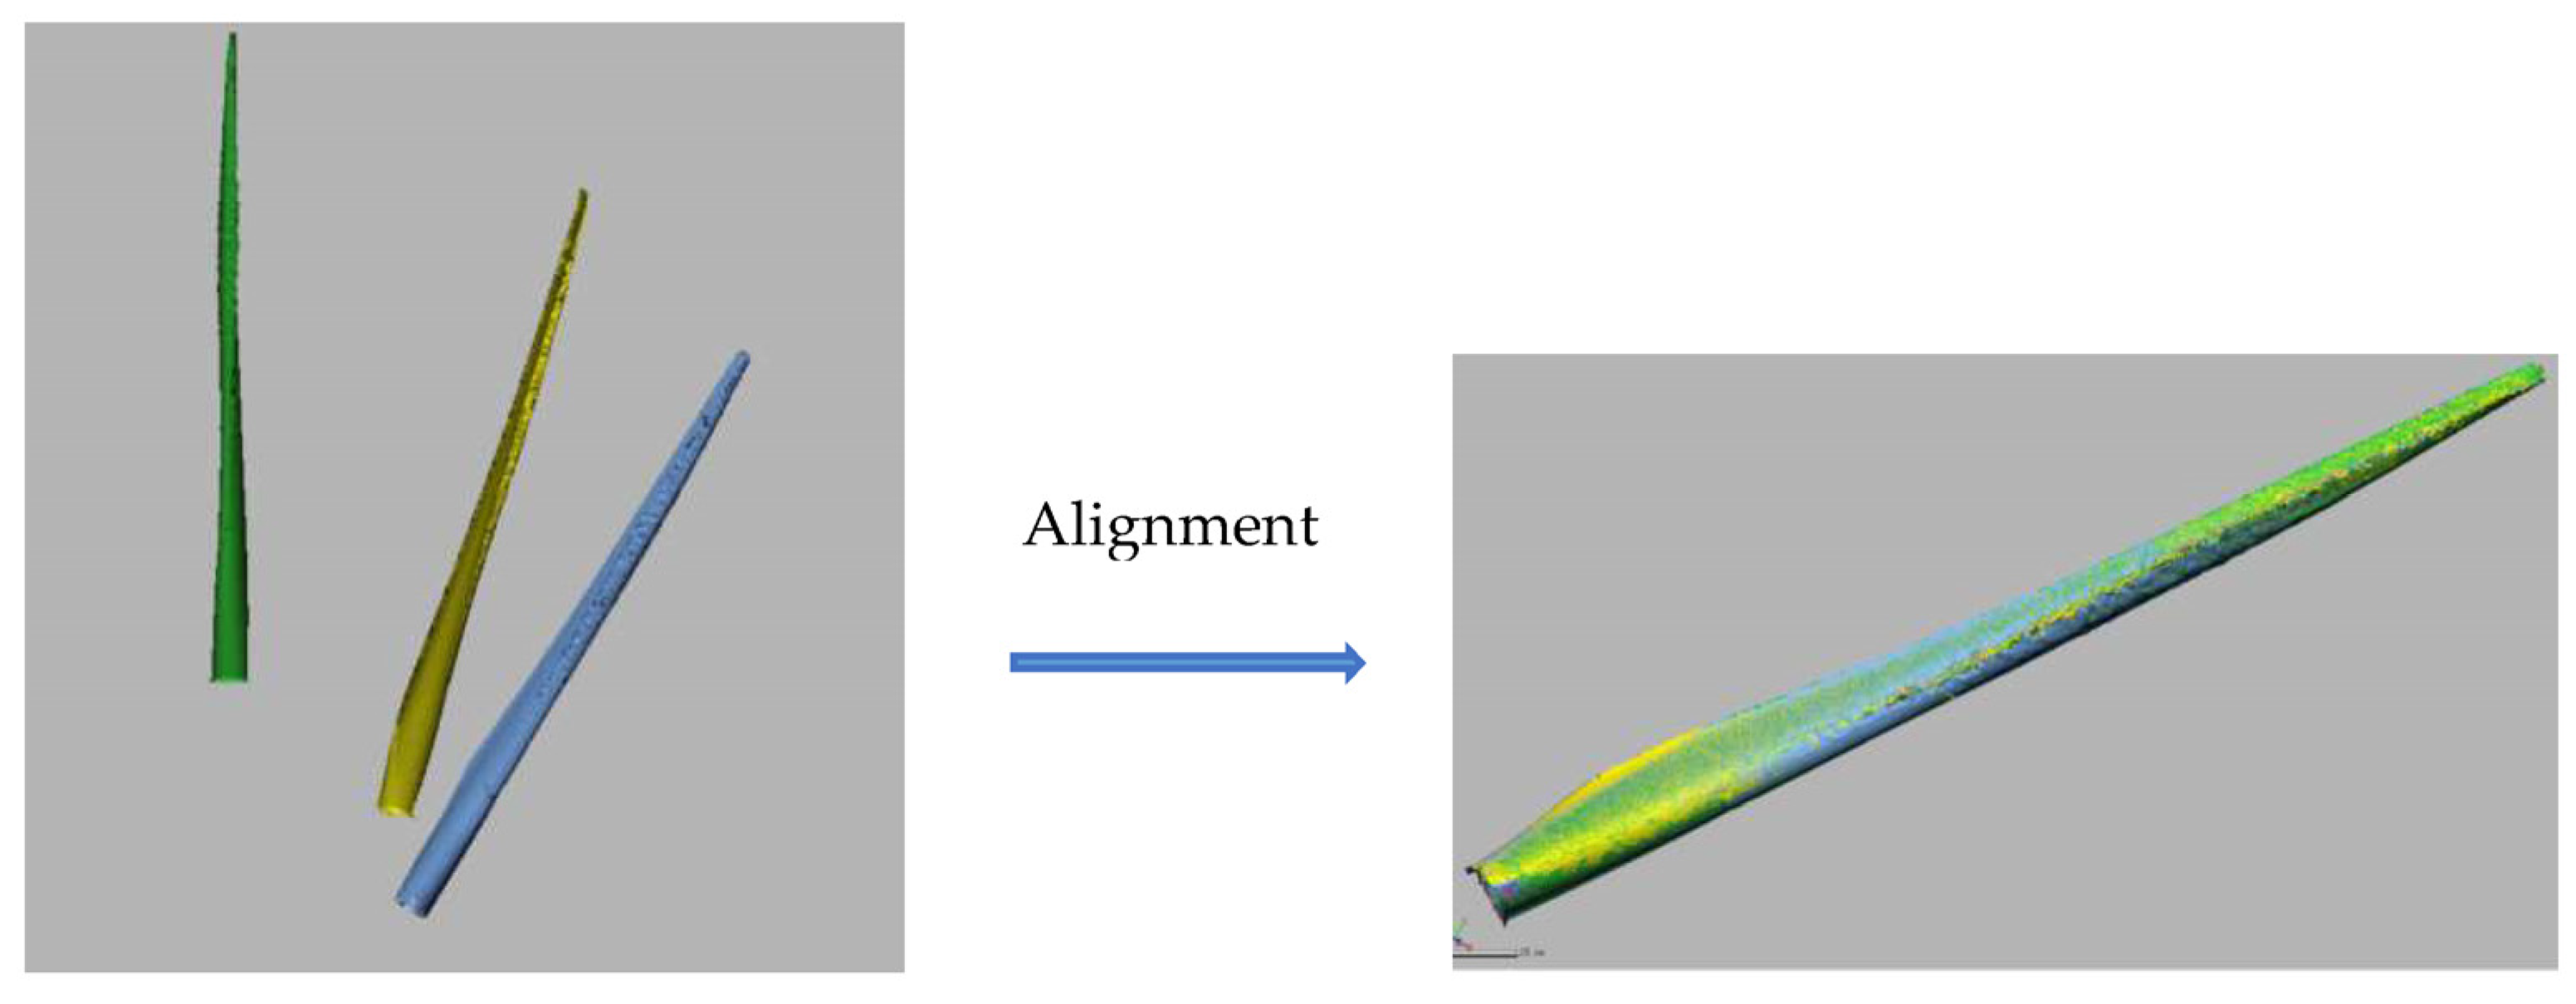
  • Alignment and Merging: The process involves manually aligning multiple scanned point cloud data sets of the same ice-covered blade at various angles to create a more comprehensive point cloud data set. This procedure includes selecting two imported scanned point cloud data sets, identifying three corresponding points on the ice-covered blade that are not on the same plane based on morphological features, and aligning them using Geomagic’s algorithms. This alignment process is repeated for the remaining data sets to combine them and produce a more accurate and complete point cloud data set of the ice-covered blade (Figure 5);
  • Conversion to Triangle Mesh: The merged point cloud data are converted into a triangle mesh surface. During the conversion process, offsets between the camera and laser on the scanner can result in instances where the laser projection is not recognized by the camera, especially when the ice has significant depth or is obscured by other ice features. This can create holes of varying sizes and quantities in the mesh. Smaller holes are filled directly using the “internal hole” command, while larger holes necessitate the use of commands such as “boundary hole” and “bridging” to segment large holes into smaller ones before patching;
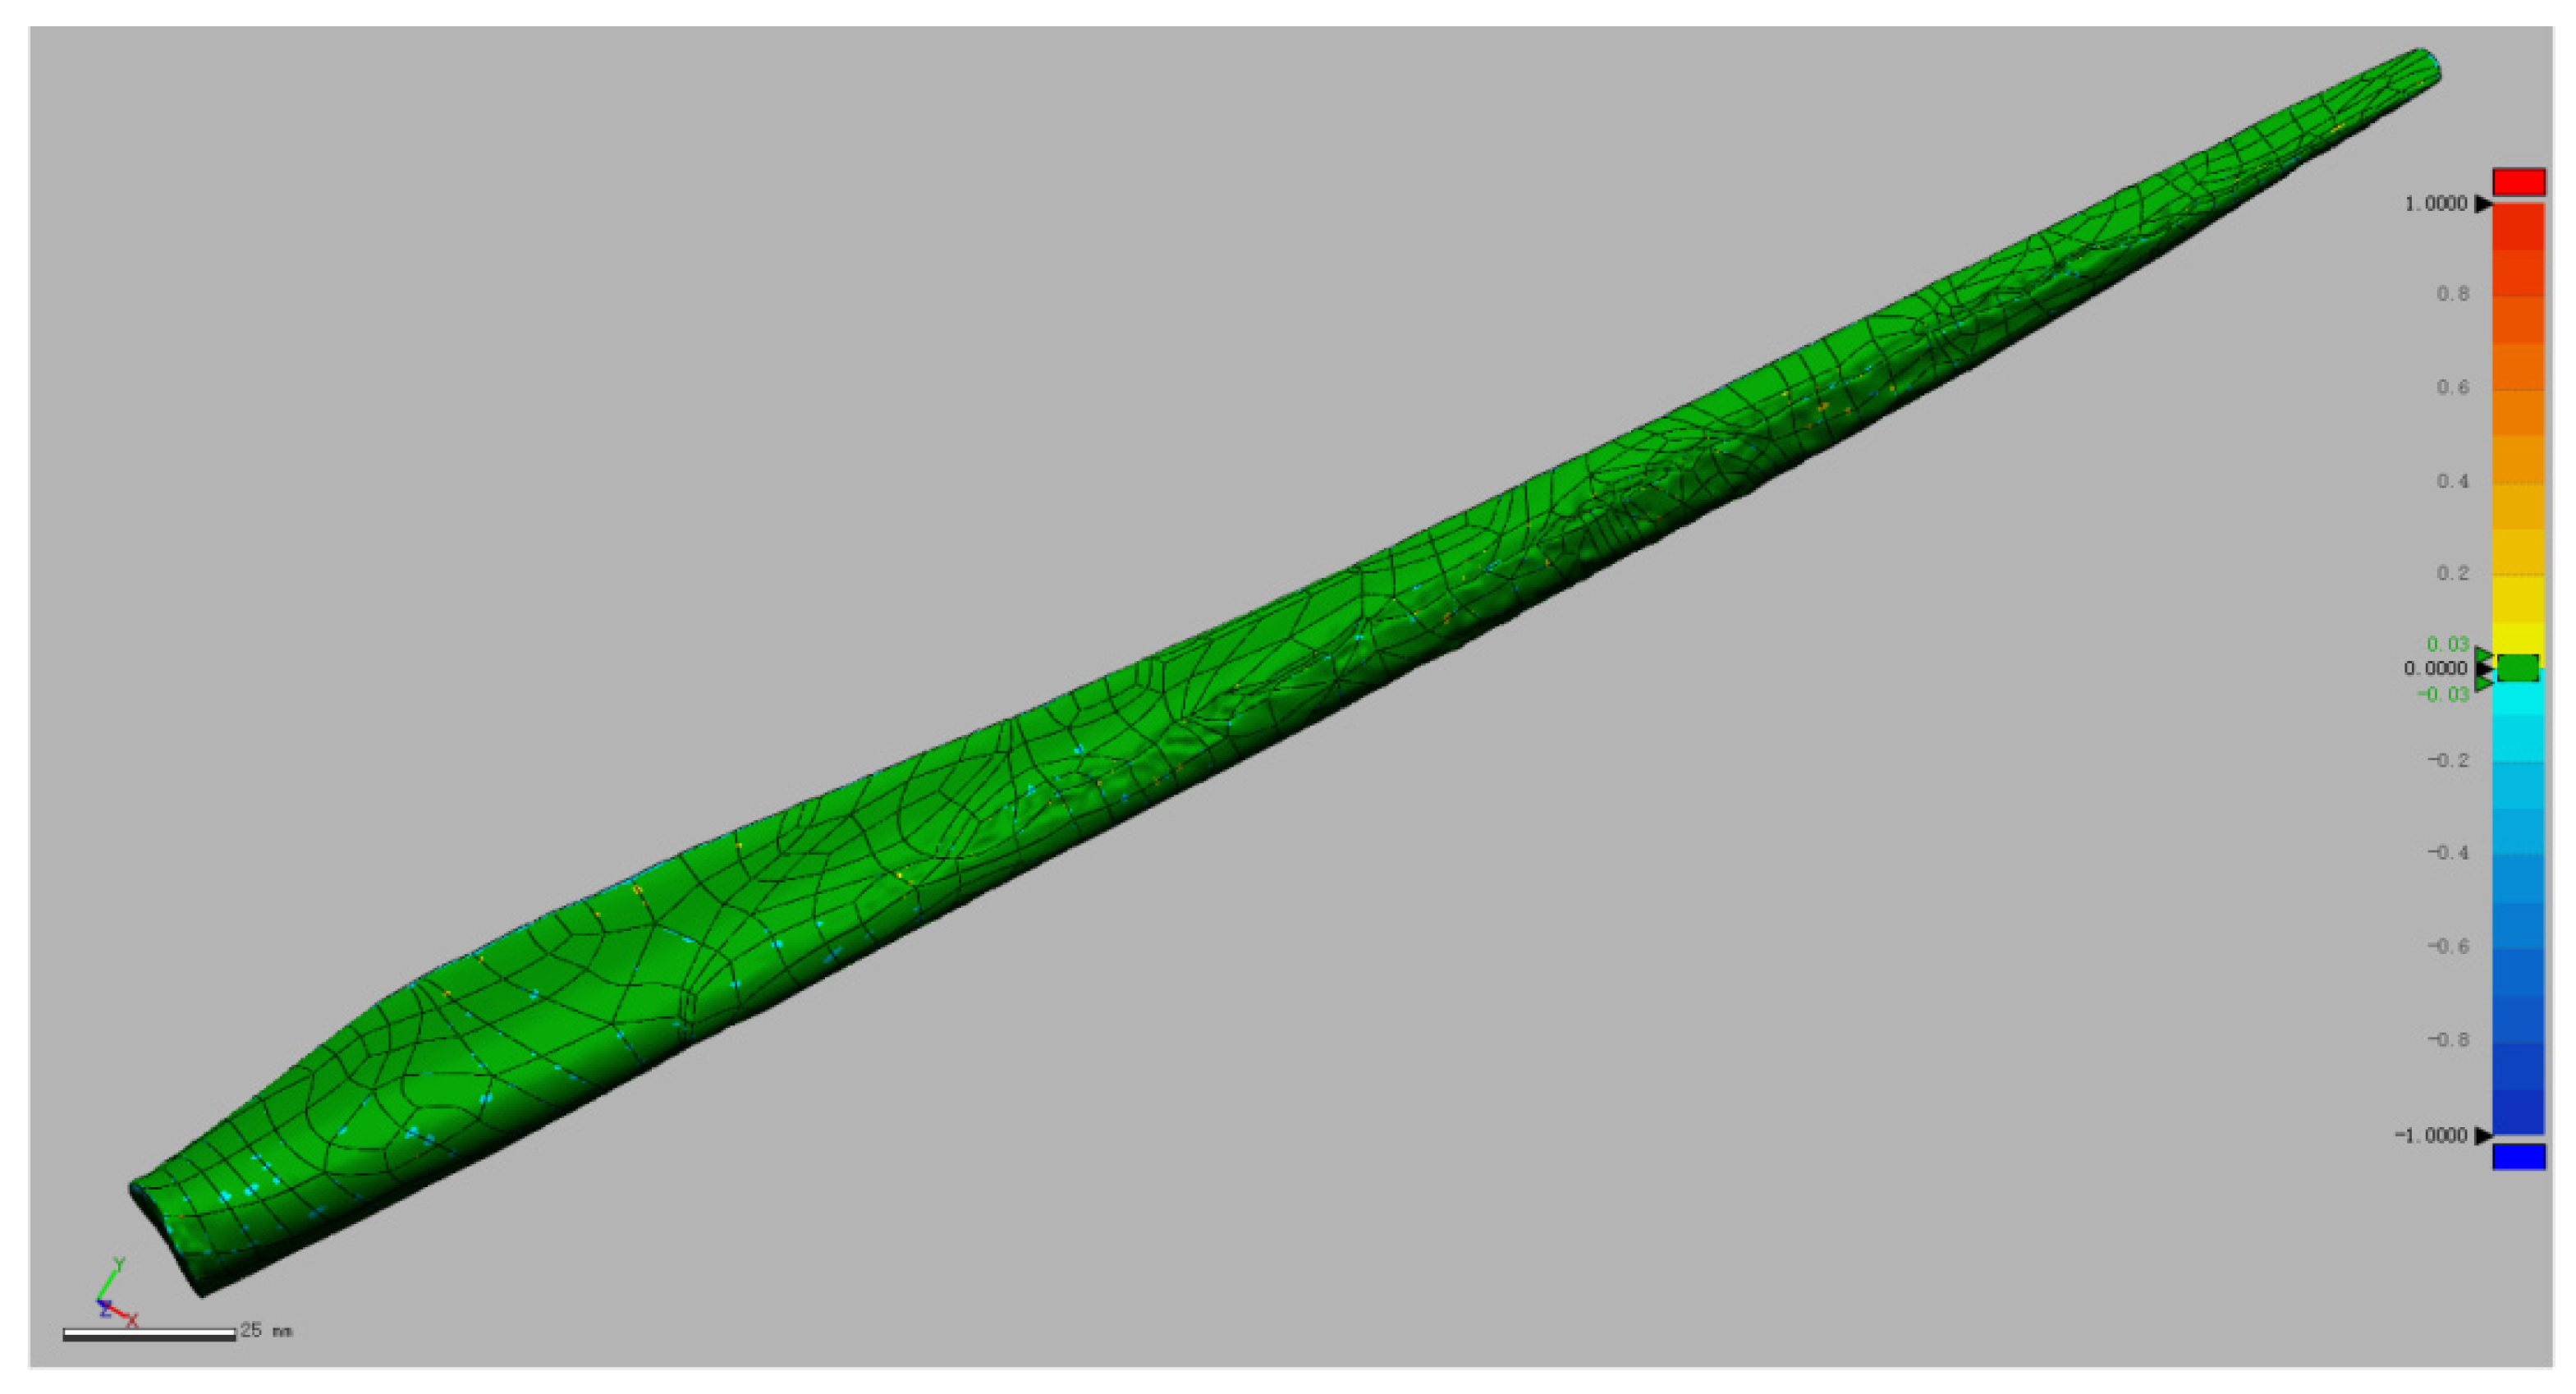
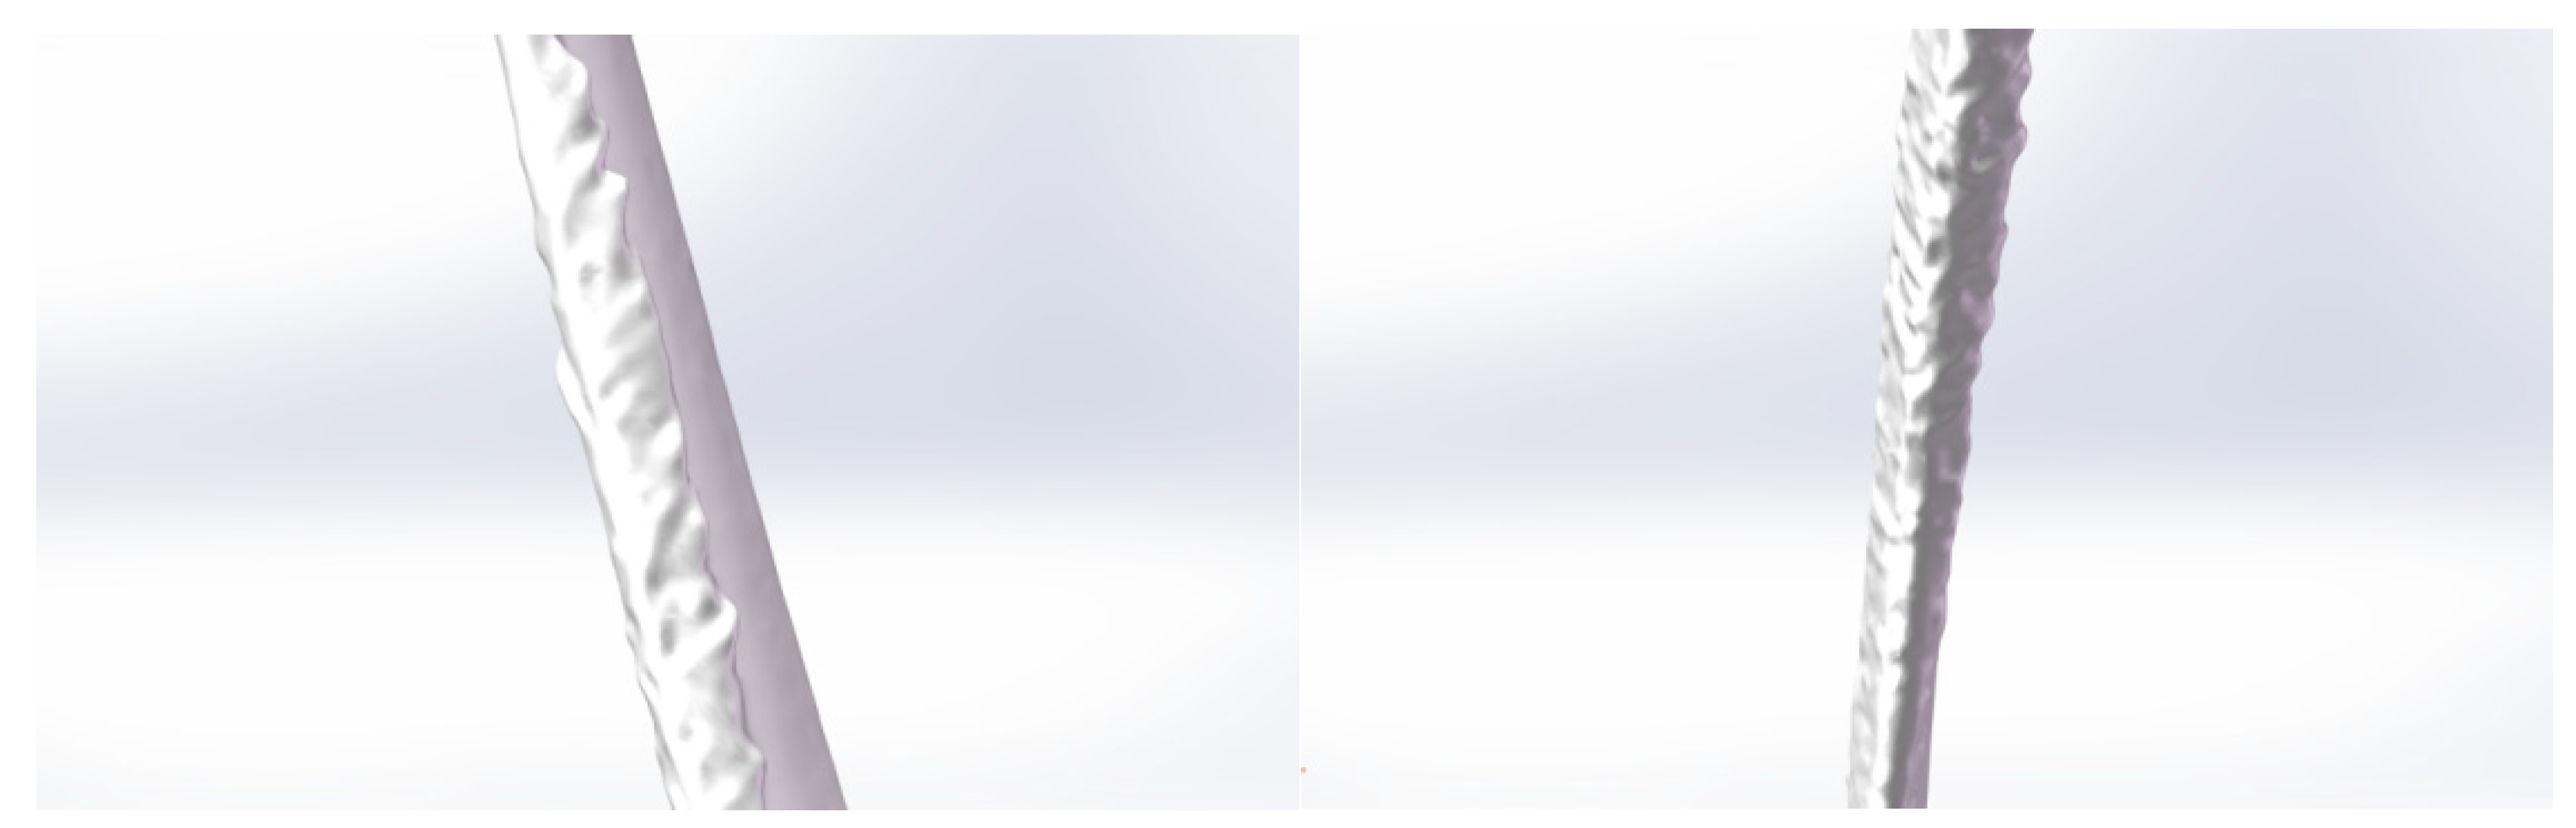
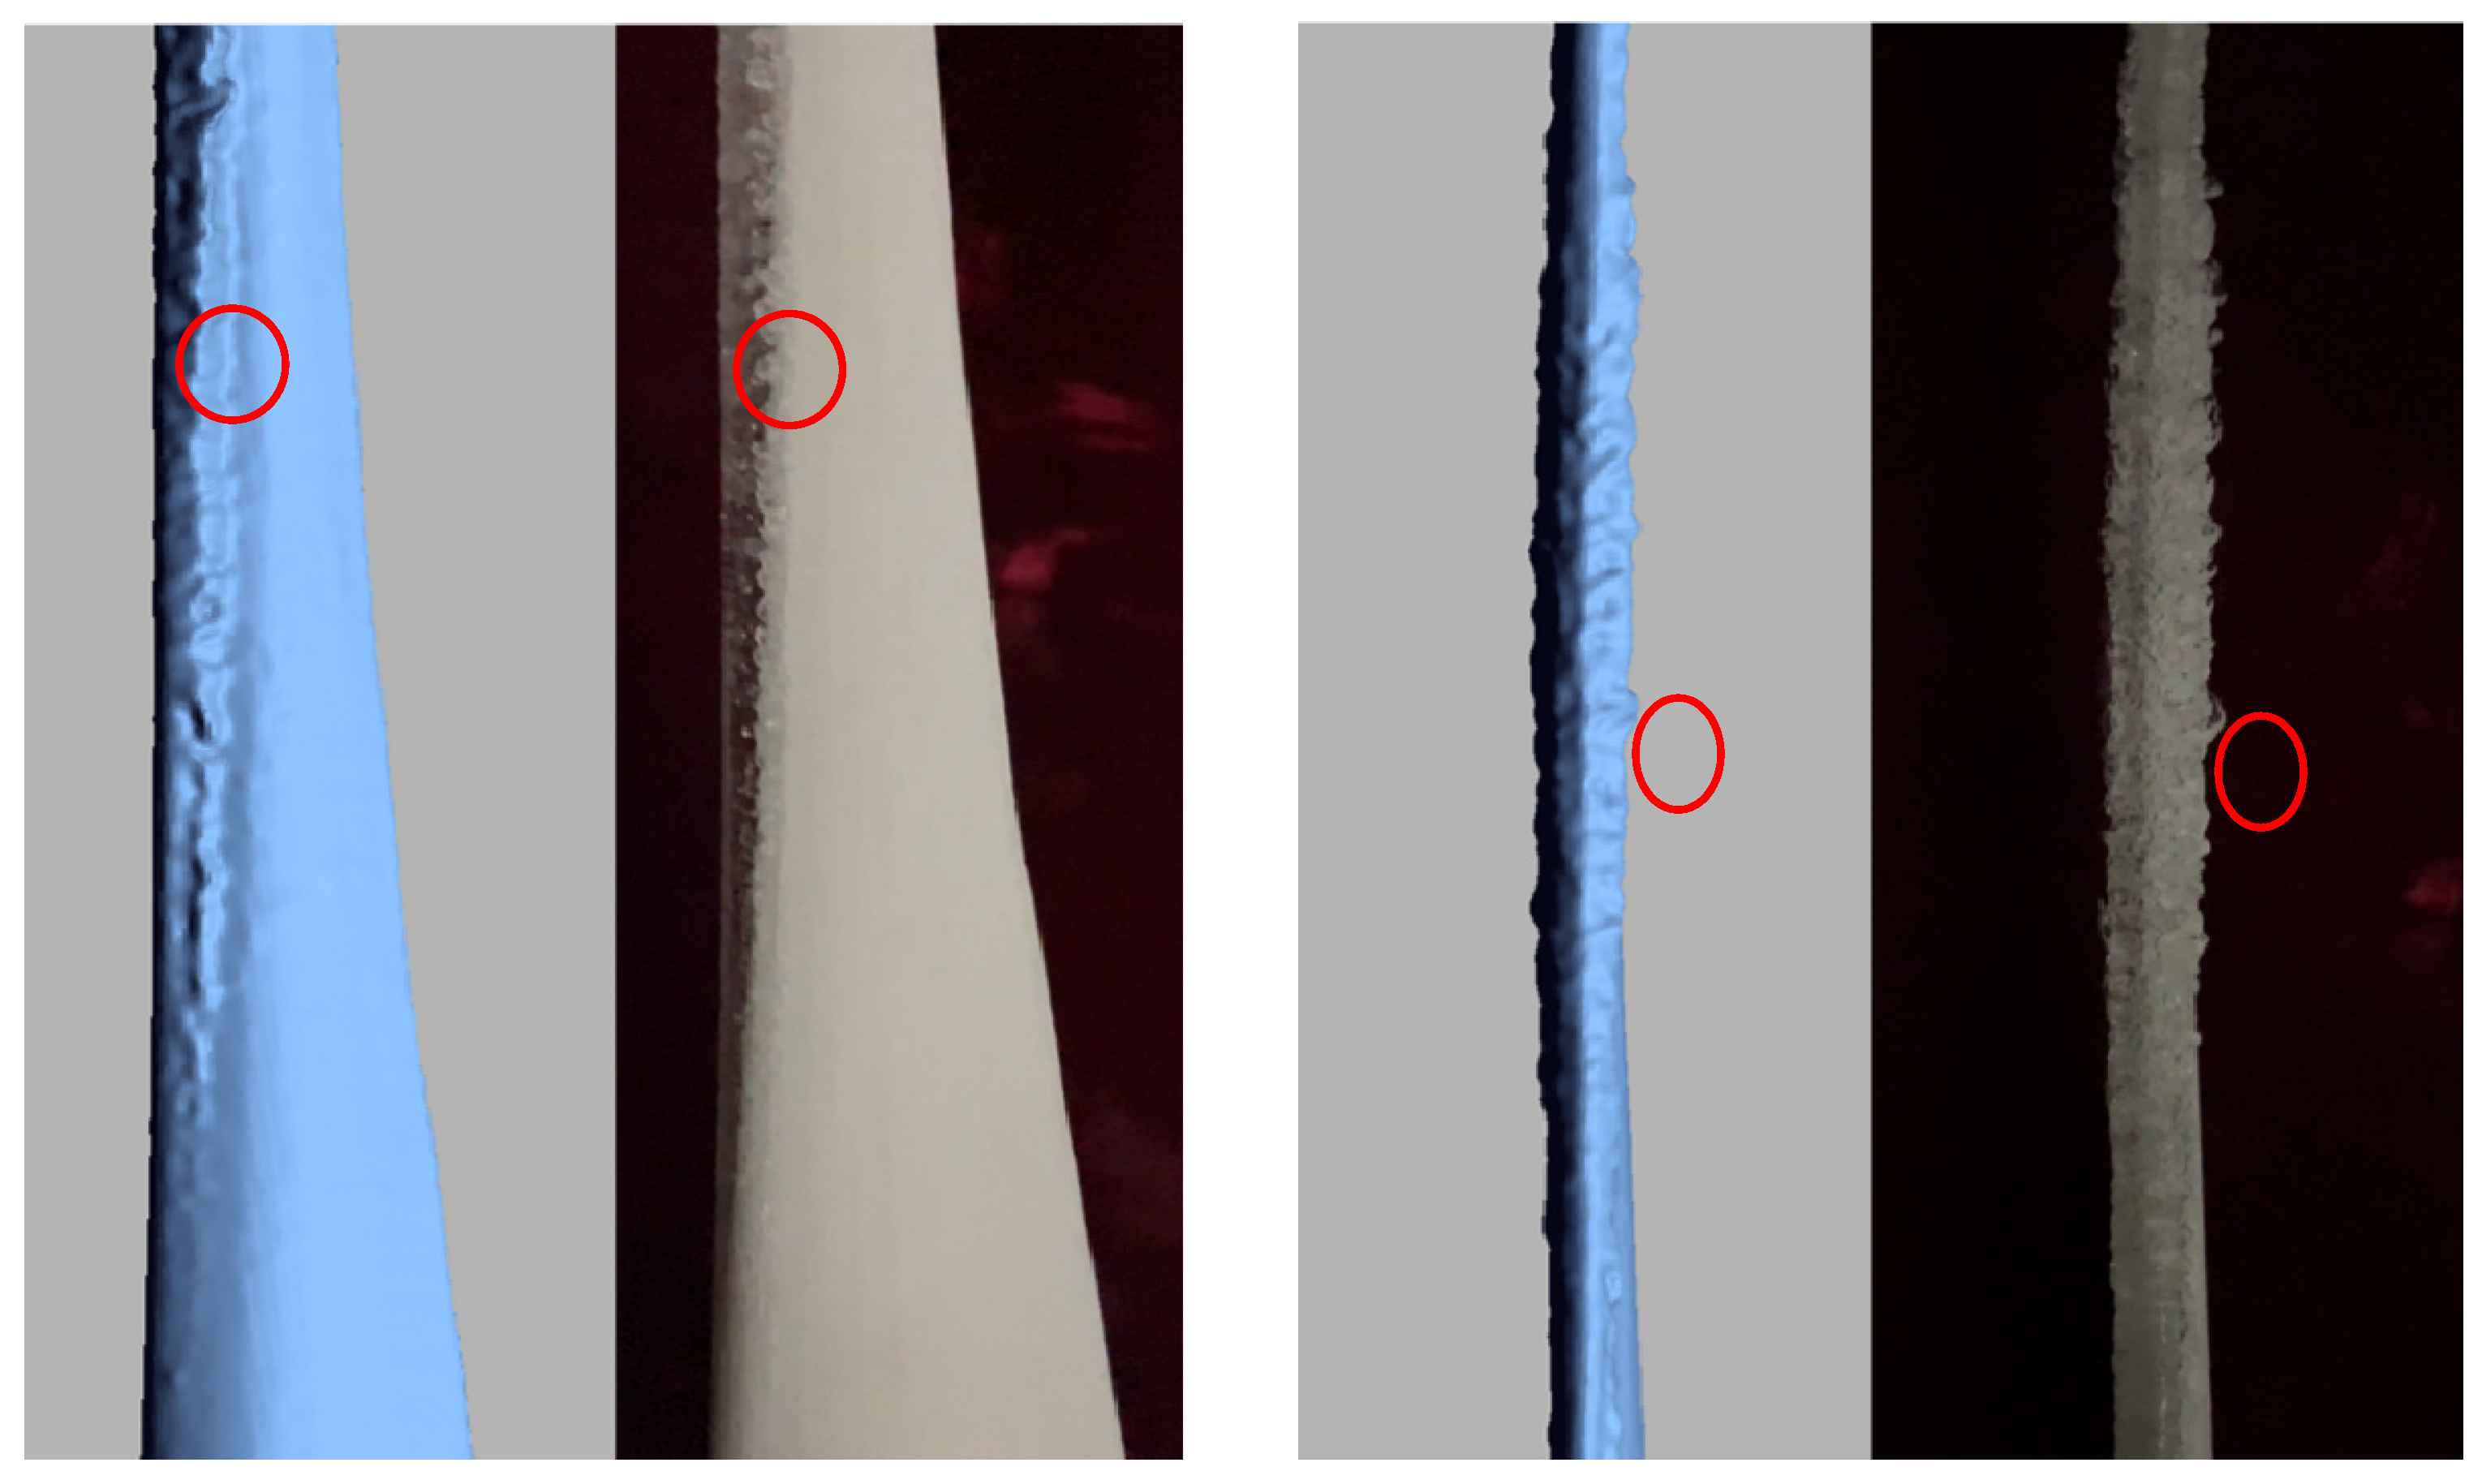
  • After analyzing the point cloud data, different model reconstruction surfaces and ice shape reconstruction surfaces are produced to create solid structures. Figure 6 illustrates a color map representing volumetric deviations between the processed model and the initial scan data, indicating that the majority of locations in the processed model adhere to the specified accuracy threshold of 0.03 mm. Figure 7 depicts detailed perspectives of the ice-covered blade entity formed during post-processing.

4. Experimental Results and Analysis

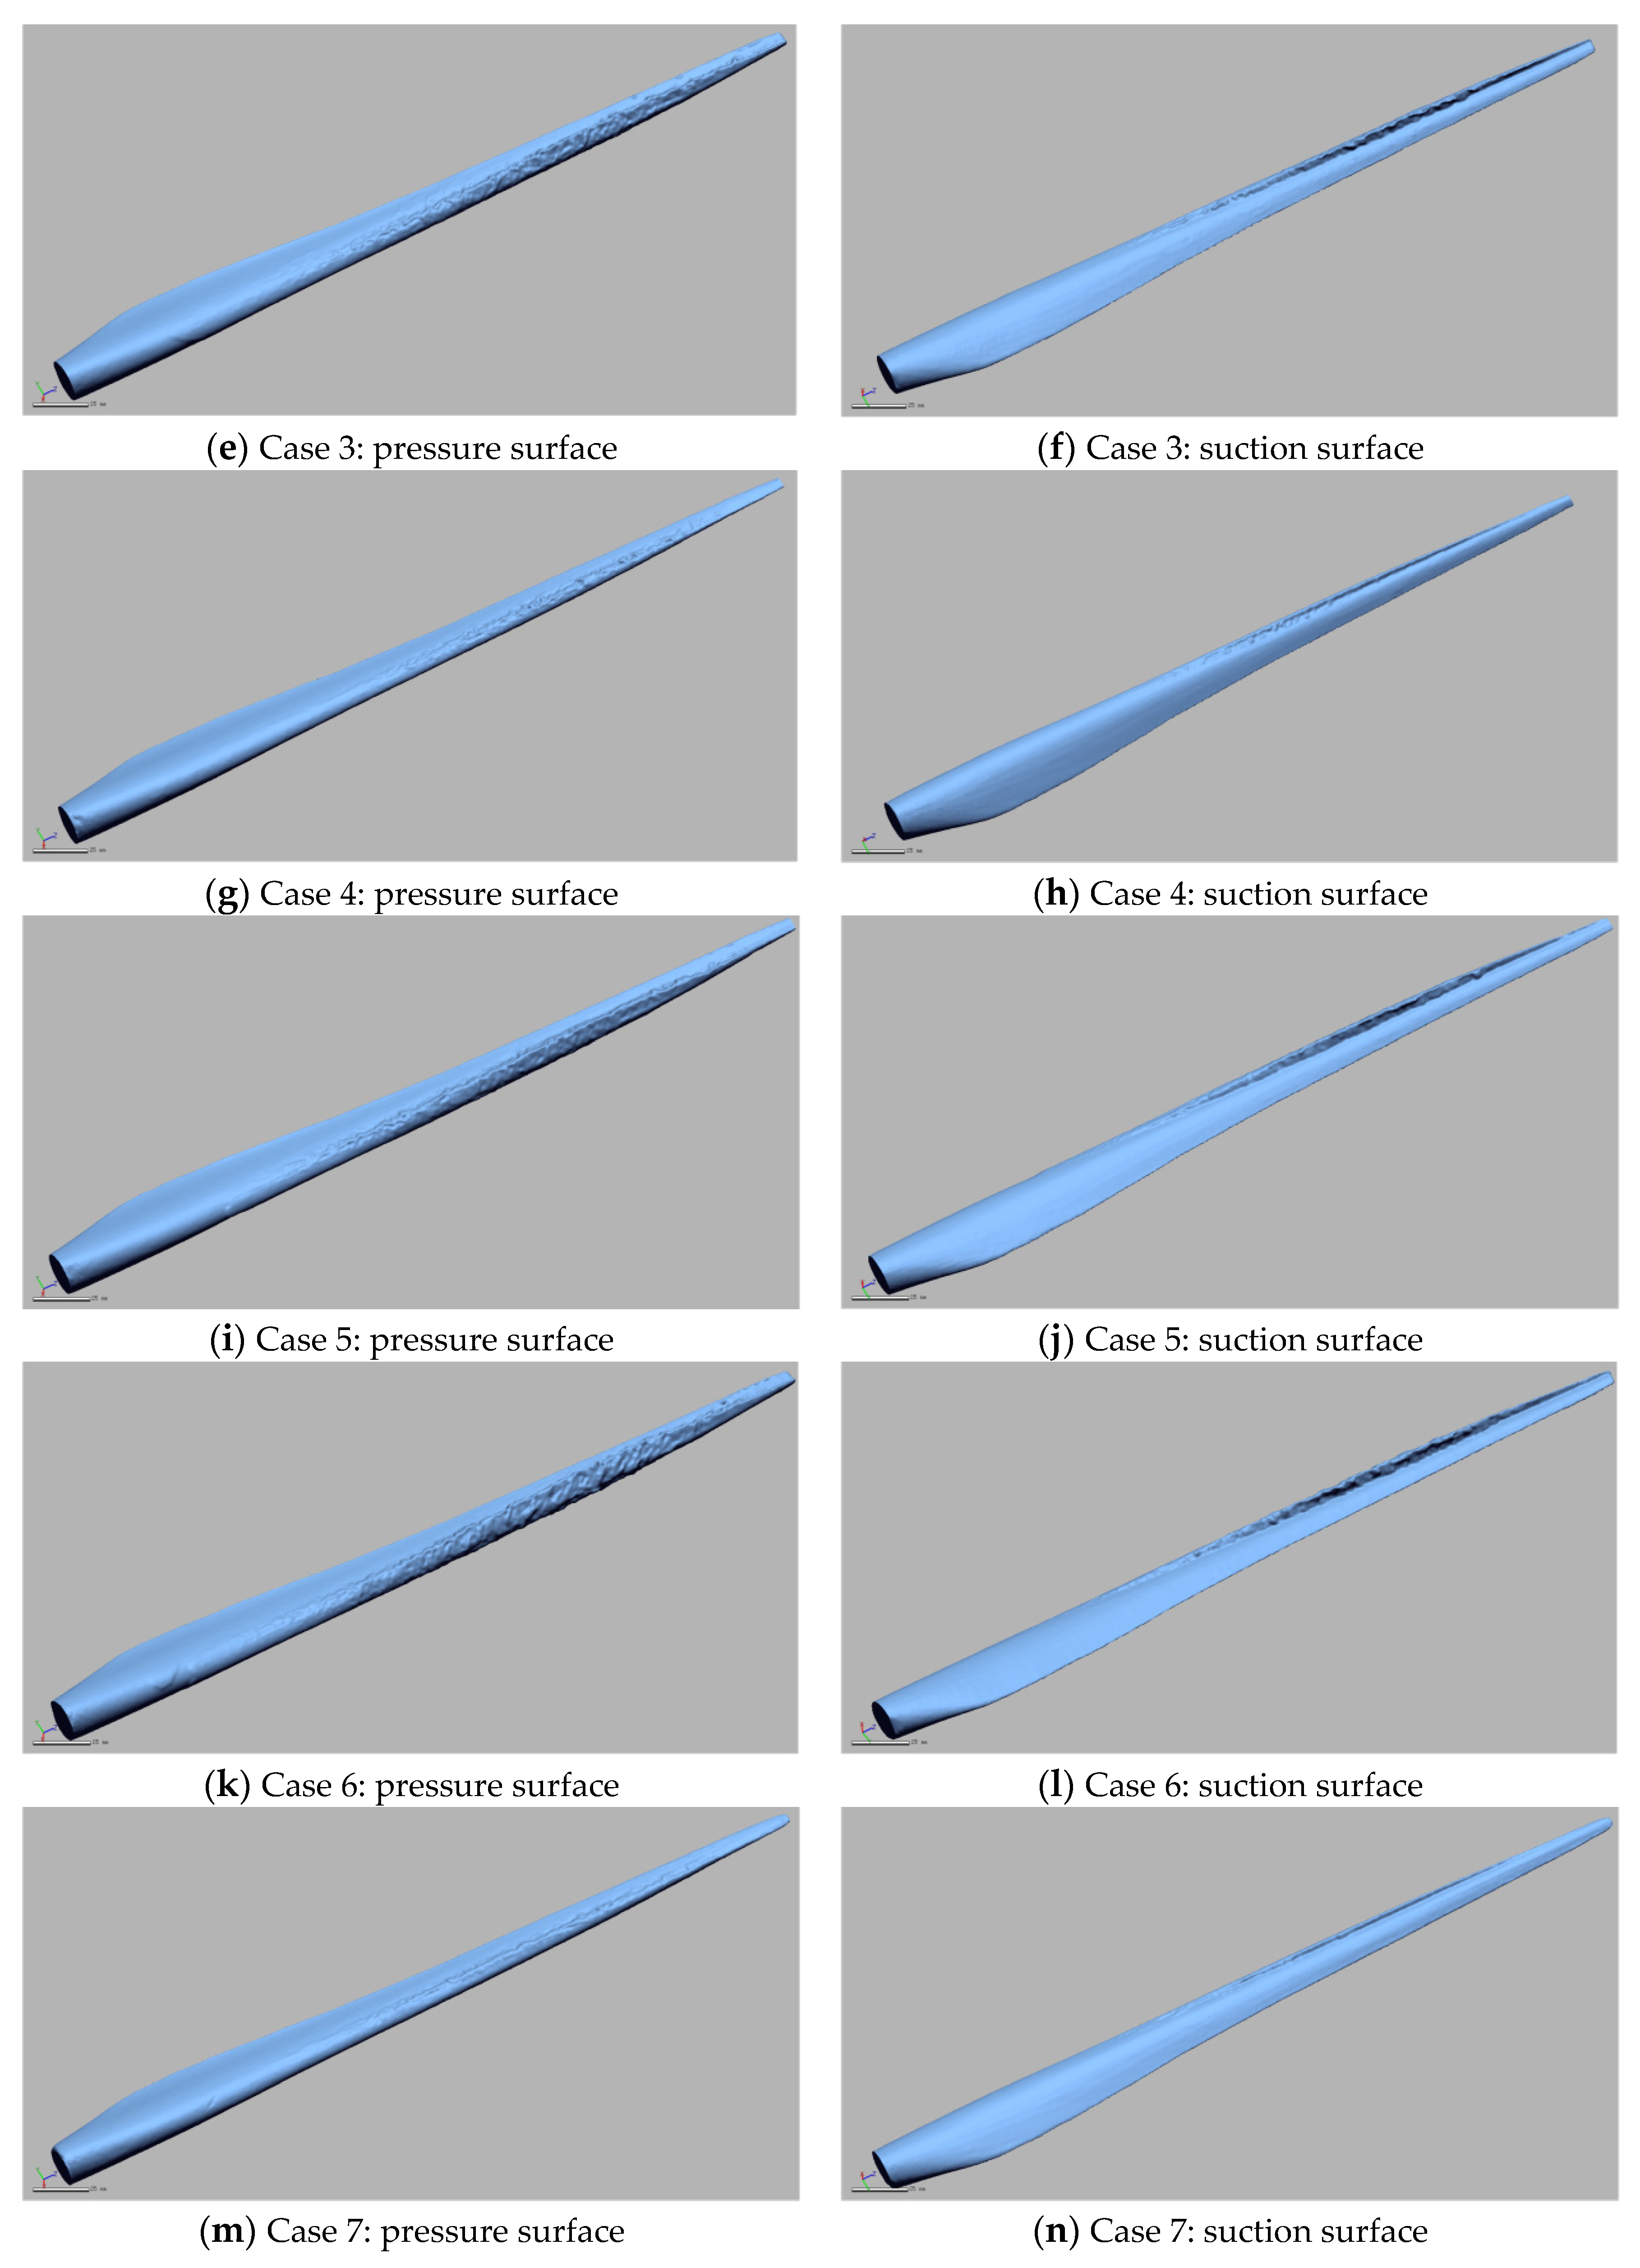
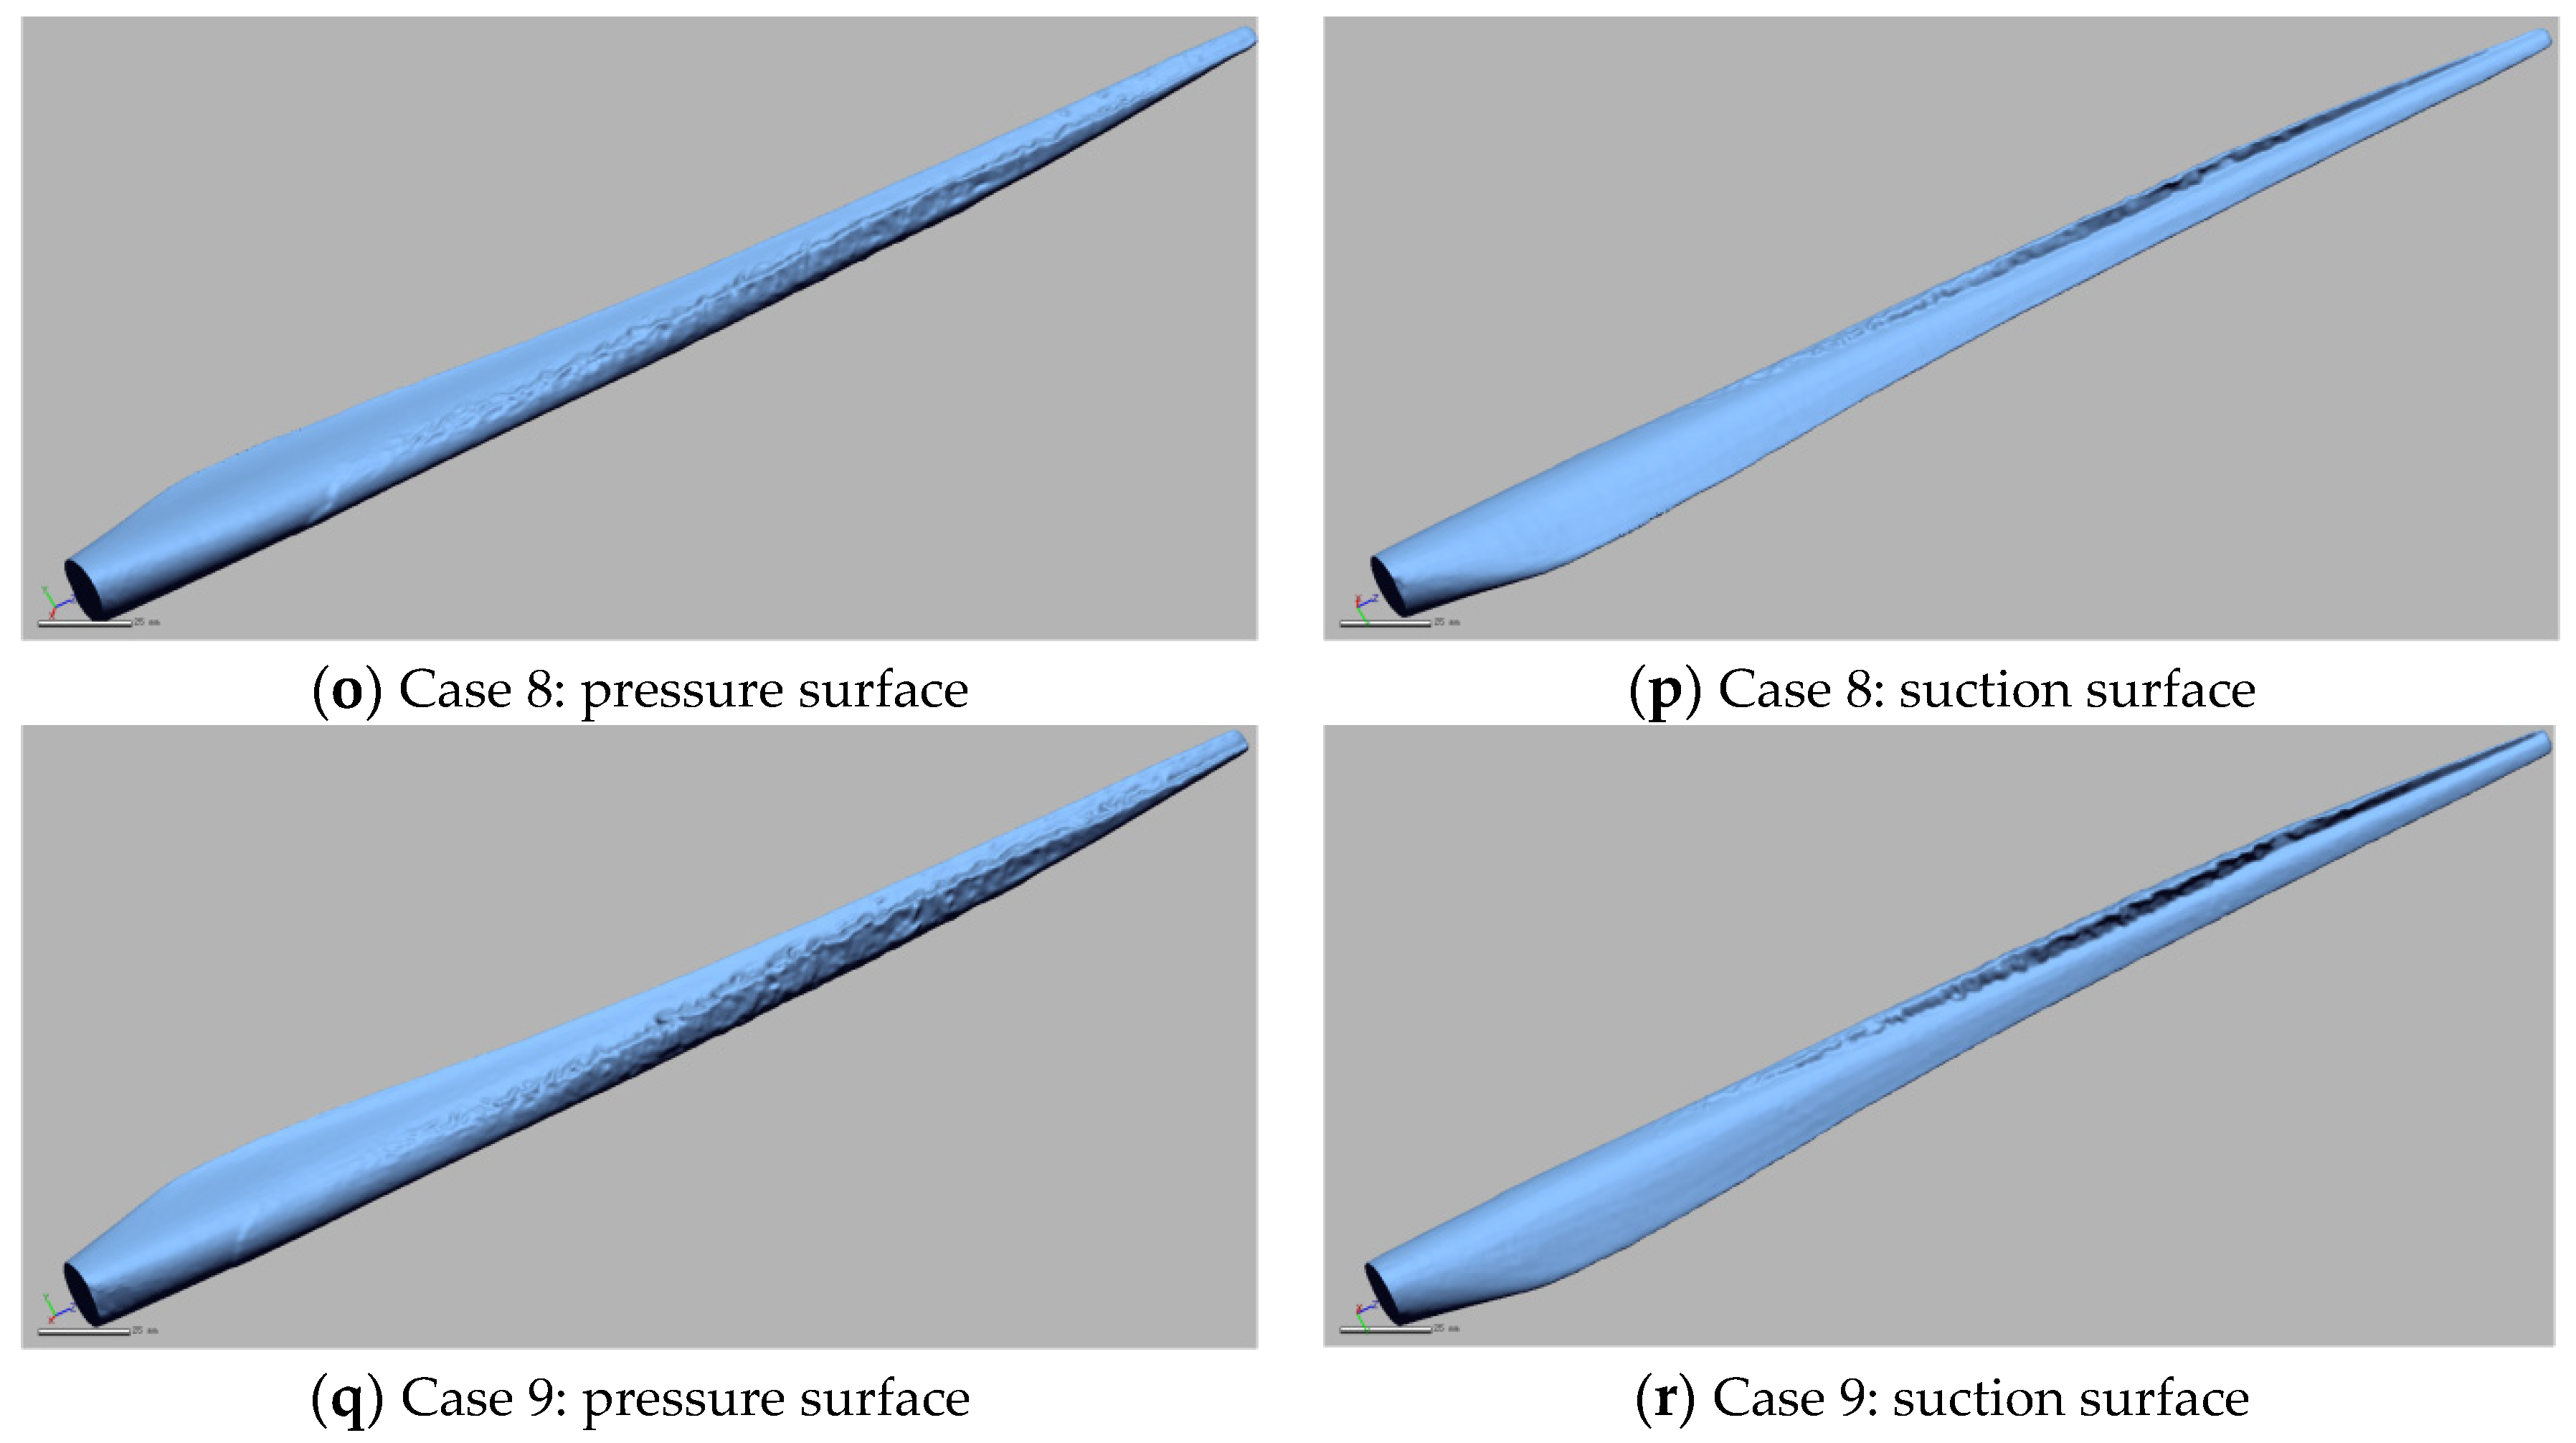
4.1. Three-Dimensional Morphology of Rotating Blade Ice Accretion

The ice accretion wind tunnel experiments were carried out according to the specified parameters, leading to the formation of fully ice-covered blades. Subsequently, a contrast agent was applied to the ice, followed by 3D scans under nine operational conditions. These scans unveiled the 3D morphology of the ice-covered blades (Figure 8).
Figure 8 graphically illustrates the suction and pressure surfaces of a single frozen blade model of a 1.5 MW horizontal-axis wind turbine under nine test conditions in a pictorial form. In Figure 8, ice predominantly forms on the leading edge of the blades. In the vicinity of the root, where the speed of water droplets is reduced because of the wind turbine’s rotation, the ice layer is thinner and smoother. Ice buildup progressively intensifies towards the radial direction; this is because the relative speed in the vicinity of the tip of the blade is greater than that at the root of the blade in the process of rotation, and the increase in the speed will increase the frequency of water droplets in the air impacting the surface of the blade, with scattered regions of localized icing. The external surface of the ice shifts gradually from a smooth to a rough texture along the blade spread, exhibiting inclined or irregular patterns on the rough ice surface. With the increase in wind speed and liquid water content, the increase in icing in the leading edge portion of the blade is relatively significant, and there is a tendency for the icing thickness in the leading edge portion of the blade to increase.
Figure 9 illustrates a comparison between 3D scan results and photographs of ice accretion on the blades, showing a significant level of agreement between the observed ice accretion and 3D scan results. The 3D scanning method effectively captures complex characteristics of the ice accretion.

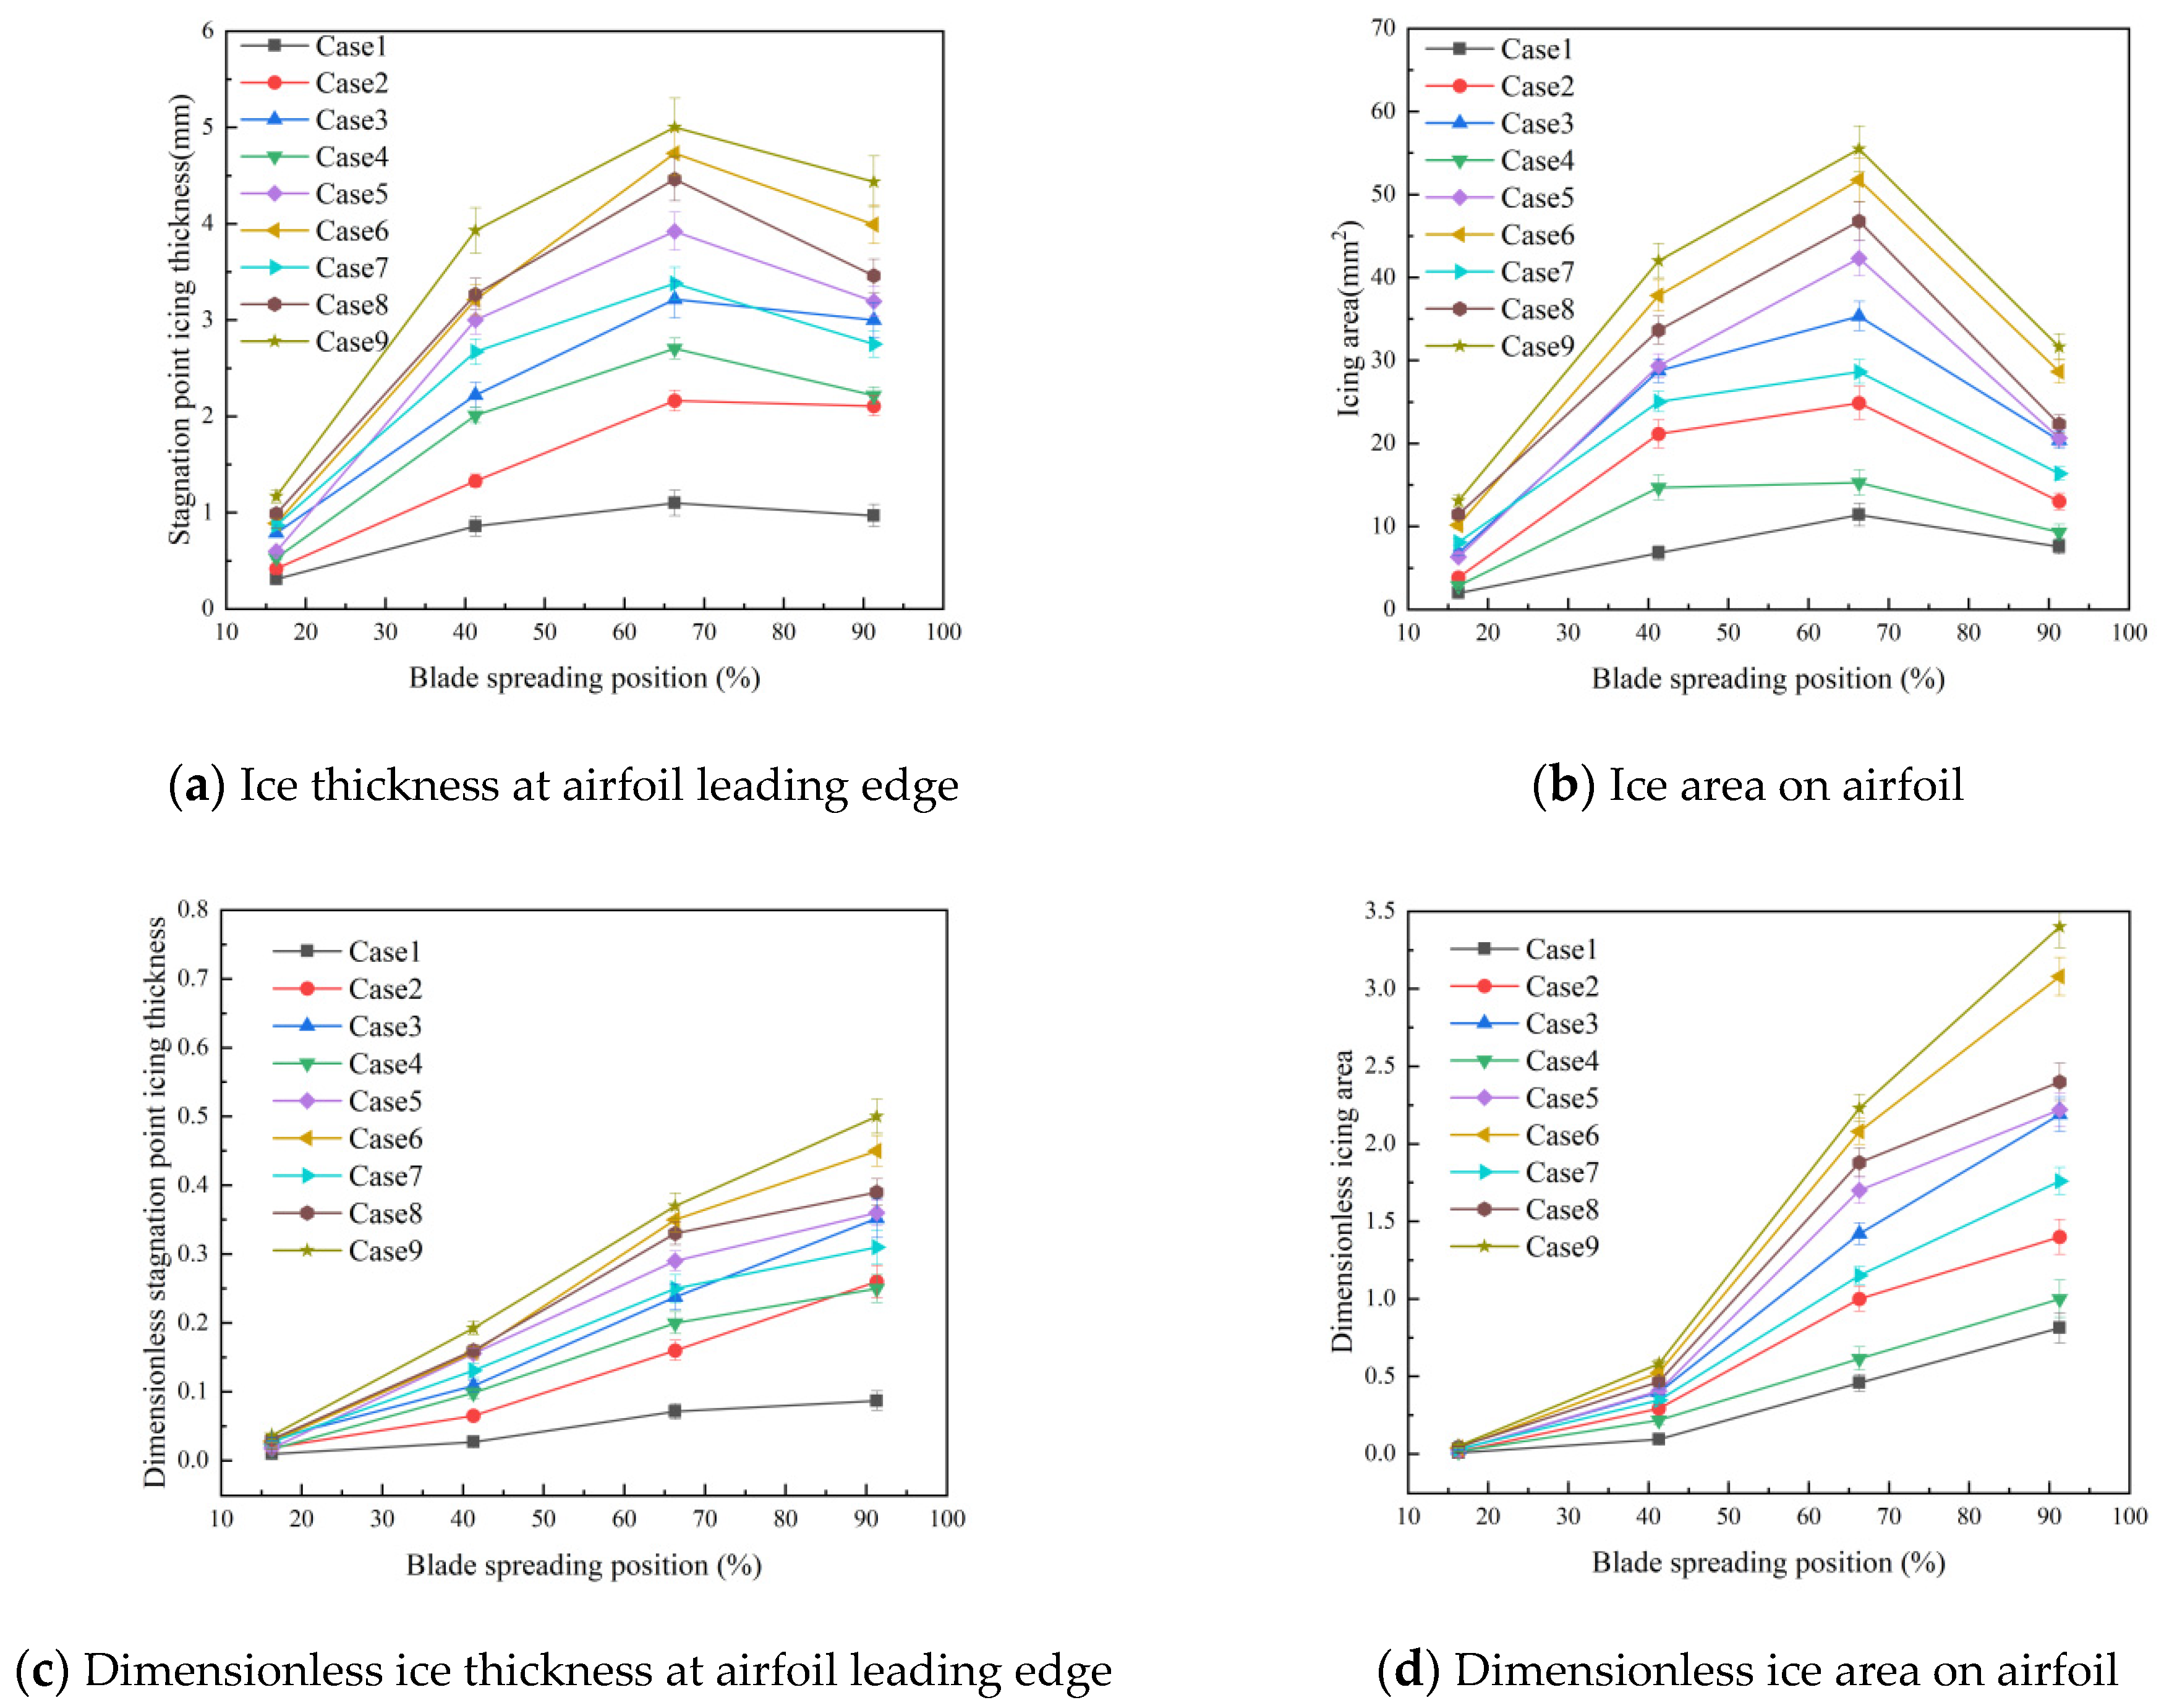
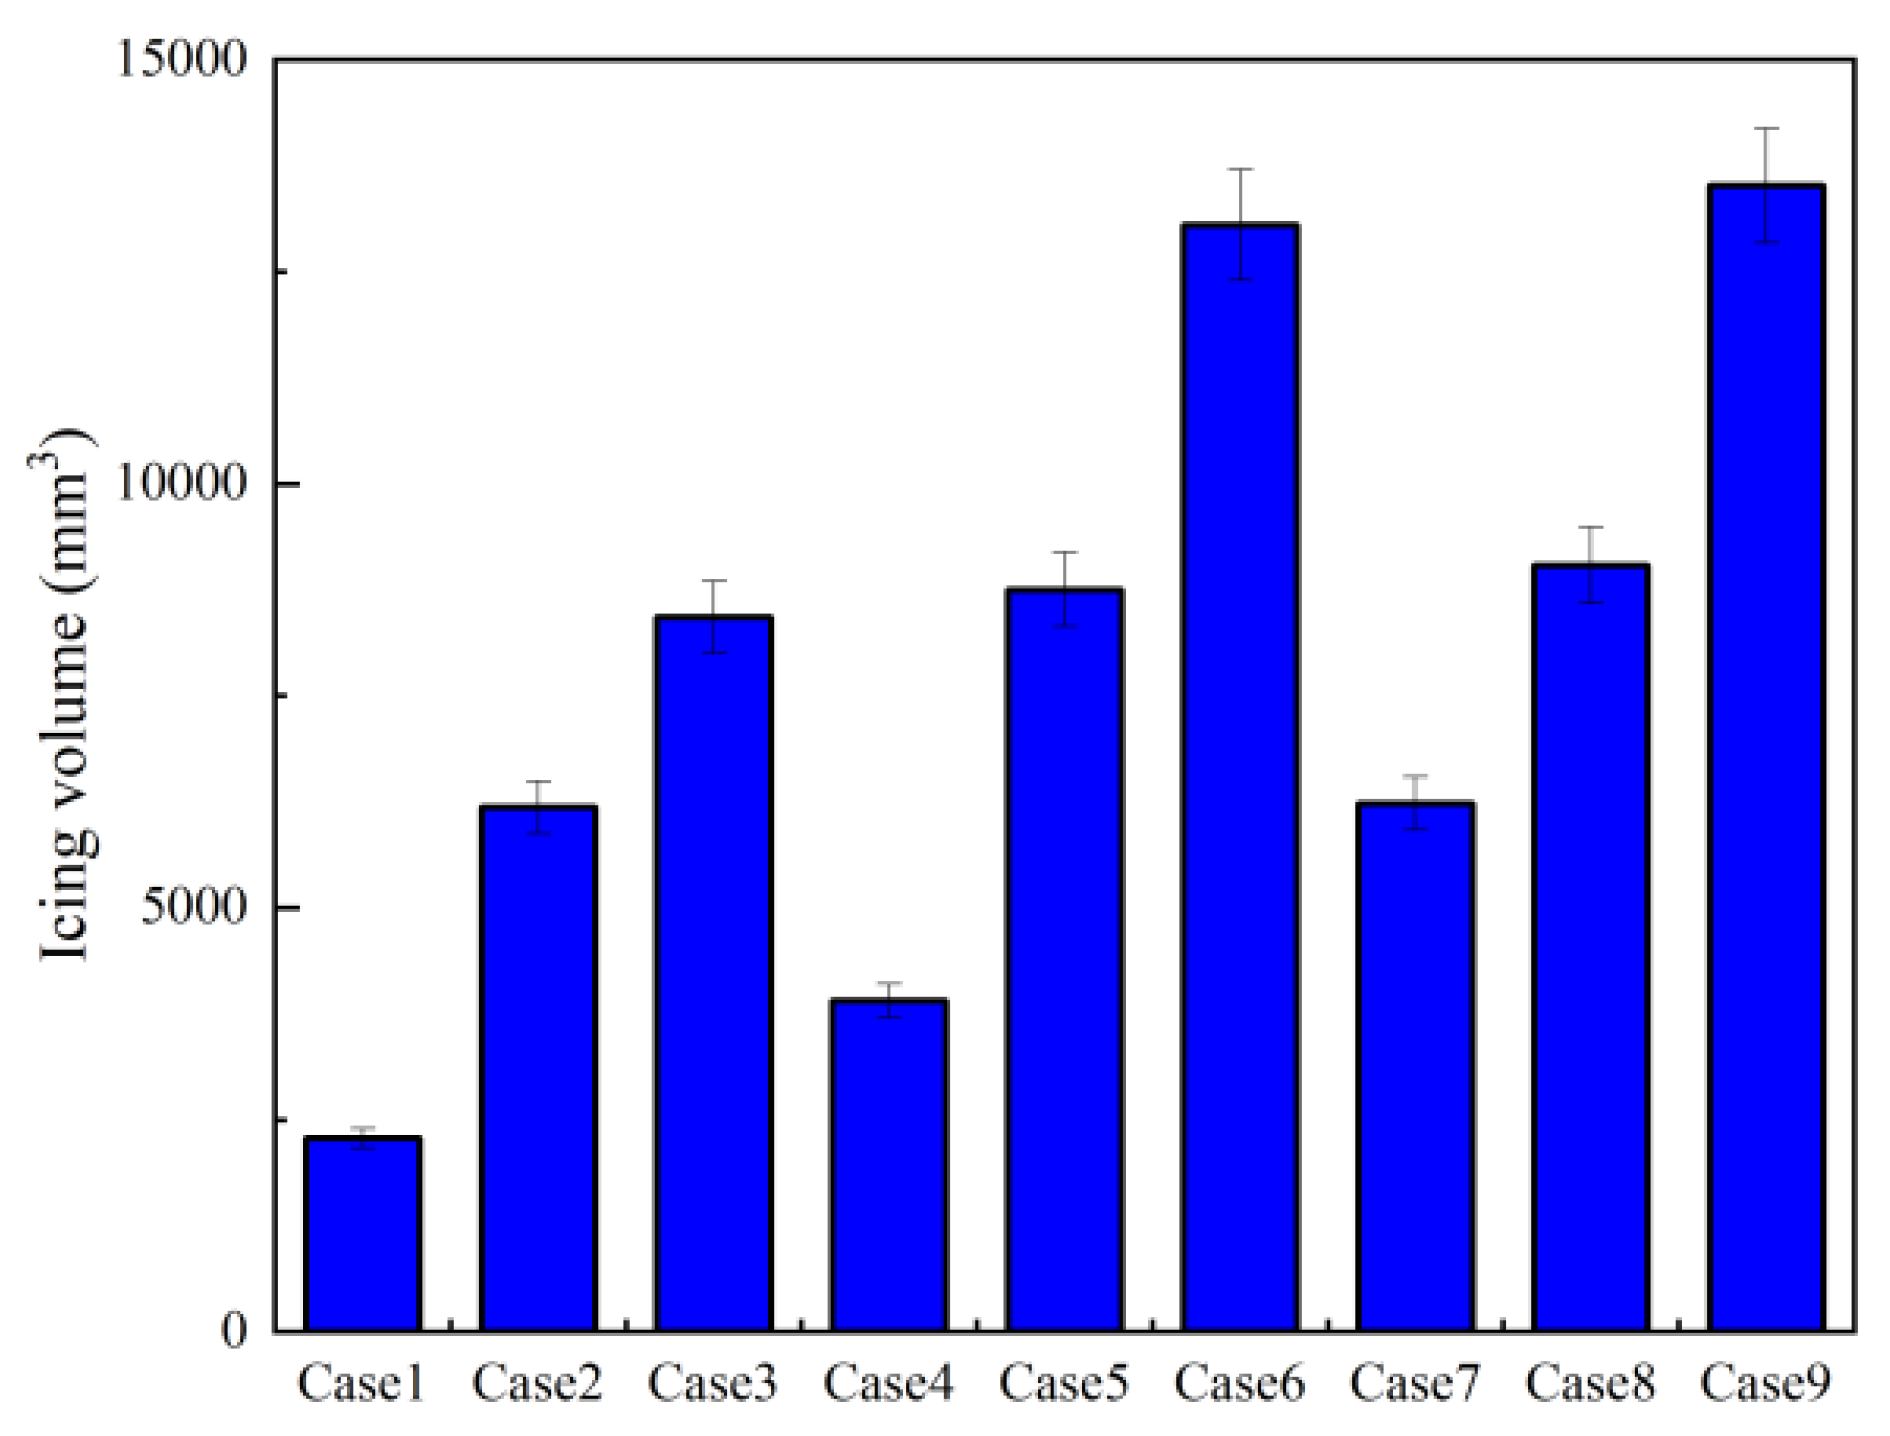
4.2. Analysis of Ice Accretion Characteristics

To examine the ice properties on the surfaces of wind turbine blades, the blade was partitioned into different 2D planes utilizing the blade element momentum theory for the analysis of ice characteristics on the blade surface [38]. The airfoil sections of the wind turbine blade were divided at locations 16.3% (6 cm), 41.3% (15.2 cm), 66.3% (24.4 cm), and 91.3% (33.6 cm) from the blade root (Figure 10).
Since these characteristics are interdependent and not mutually exclusive, not all characteristics were analyzed. Two typical 2D characteristics were selected for analysis: the ice-covered area S and the ice thickness σ at the leading edge of each airfoil section. As the shapes and sizes of the airfoil sections vary along the span of the wind turbine blade, the dimensionless parameters ησ for the dimensionless leading σ and ηs for S were introduced as follows:
where ησ represents the dimensionless leading edge ice thickness, which can be determined as follows:
η σ = σ c
where ηs represents the dimensionless ice-covered area, which can be obtained as follows:
η s = S S blade
The analysis of the ice accretion characteristics on the wind turbine blade surface at various cross-sectional airfoil positions under nine different conditions is presented in Figure 11.
The examination of dimensionless parameters related to the ice accretion thickness and ice-covered area at different cross-sectional airfoil positions (Figure 11) revealed variations. In proximity to the root of the wind turbine blade, the stationary ice thickness was observed to be thinner, with a smaller ice-covered area. Moving towards the spanwise position, the ice thickness initially increased, stabilized, and then decreased, while the ice-covered area initially increased and subsequently decreased. However, for wind turbine blades, an increase in the spanwise position led to a decrease in the chord length and cross-sectional area of the airfoil, resulting in an increase in the dimensionless stationary ice-covered area with the rise in cross-sectional position. This behavior is attributed to the varying curvature radii of the airfoil’s leading edge at different blade positions, causing differences in relative velocities. Smaller curvature radii correspond to higher relative velocities, making it challenging for supercooled water droplets to alter their trajectory when passing over the blade, increasing the likelihood of impacting the leading edge and enhancing water droplet collection efficiency along the spanwise direction. Additionally, the predominant formation of clear ice under the experimental conditions was observed. Upon making an impact with the wind turbine blade surface, supercooled water droplets do not immediately freeze but flow along the spanwise direction due to airflow shear force, gravity, and centrifugal force, gradually freezing over time. This phenomenon suggests that airfoils closer to the blade tip experience a greater impact from ice accretion.
Figure 12 illustrates the ice volume on the blade under various conditions. The influence of the liquid water content (LWC) on the ice volume is analyzed, where the other conditions remain unchanged, namely Cases 1, 2, and 3, Cases 4, 5, and 6, and Cases 7, 8, and 9. For LWC = 0.25 g/m3, 0.45 g/m3, and 0.62 g/m3, the ice volume is increased in all the conditions. The influence of the wind speed on the ice volume is analyzed, where LWC = 0.25 g/m3 and other conditions are kept constant, namely Cases 1, 4, and 7, where the ice volume increases in sequence. The influence of the wind speed on the ice volume is obvious; when the LWC is increased to 0.45 g/m3, namely Cases 2, 5, and 8, the ice volume still increases gradually, but the change is not obvious, and the influence of the wind speed on the ice volume weakens; when the LWC = 0.62 g/m3, namely Cases 3, 6, and 9, the difference in ice volume is small, and the ice volumes of Cases 6 and 9 are almost the same. This indicates that as the LWC increases, the influence of the wind speed on the ice volume gradually decreases.

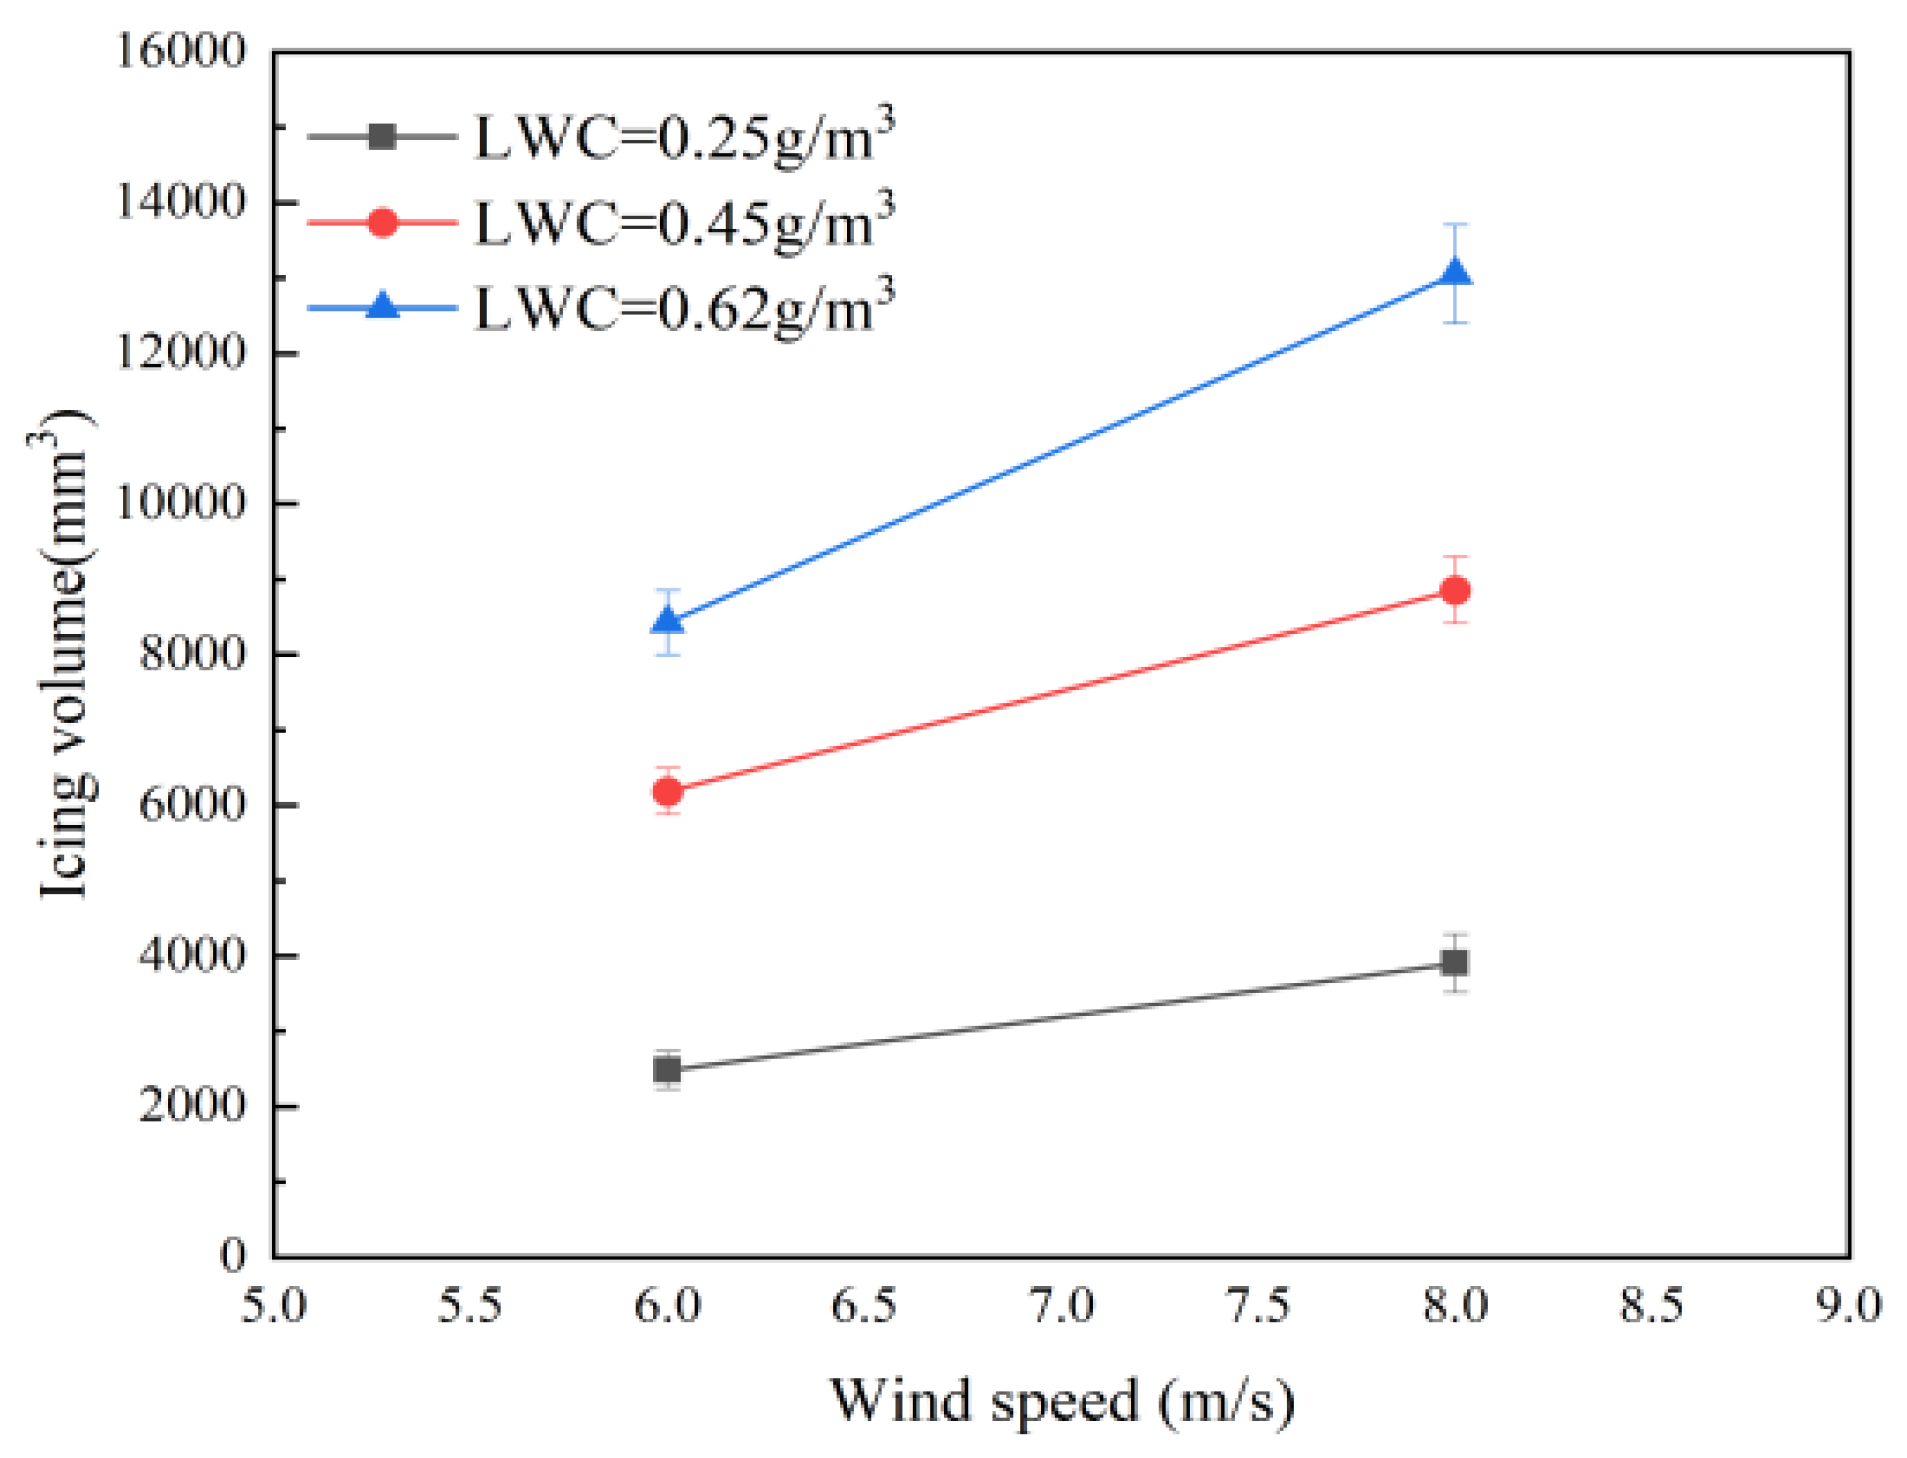
4.3. Analysis of Ice Accretion Characteristics on Blade Surfaces at Different Wind Speeds

For the comparative analysis of ice forms on the blade surfaces of a 1.5 MW wind turbine under different wind speeds, Cases 1 and 4, Cases 2 and 5, and Cases 3 and 6 were chosen based on the same rated tip speed ratio. This investigation revealed that ice accumulation on the blades is significantly impacted by wind speed variations. Higher wind speeds lead to increased ice buildup on the blades, thicker ice formation at the leading edge, and a larger coverage area of ice. This phenomenon is attributed to the higher velocities of blade sections at an 8 m/s wind speed compared to 6 m/s under identical tip speed ratio conditions, which occurs because the relative speed of the blade section is bigger. When water droplets with the same MVD move along the airflow field at the same speed, the greater the wind speed, the greater the velocity at which the water droplets move with the flow field, the less likely they are to deflect with the flow field, and the more likely they are to impact with the leading edge of the blade, resulting in a greater impact area for water droplets.
In Figure 13, the total ice volumes under Cases 1 and 4, Cases 2 and 5, Cases 3 and 6 are 2480.828 mm3, 3900.713 mm3, 6183.353 mm3, 8853.484 mm3, 8426.813 mm3, and 13,048.866 mm3, respectively. The statistical analysis indicates that an increase in wind speed and consequently blade rotational speed results in a higher ice volume on the blade surfaces. Furthermore, higher wind speeds lead to a more significant increase in ice volume; specifically, when the wind speed rises from 6 m/s to 8 m/s, the ice volumes increase by 57.2%, 43.2%, and 54.8%, respectively. This phenomenon can be attributed to the fact that the enhanced inflow velocity modifies the flow field around the blade, elongating the wake region behind the blade. Consequently, this alteration in flow velocity induces a more substantial increase in velocity over the pressure side of the blade and a more pronounced pressure difference between the pressure and suction sides. Within the flow field surrounding the blade, supercooled liquid water droplets are impacted by variations in the airflow, with higher wind speeds leading to a greater number of droplets hitting the pressure side of the blade. As a result, the frequency of impacts on the pressure side increases, while the frequency of impacts on the suction side decreases as supercooled liquid water droplets move away from the blade.

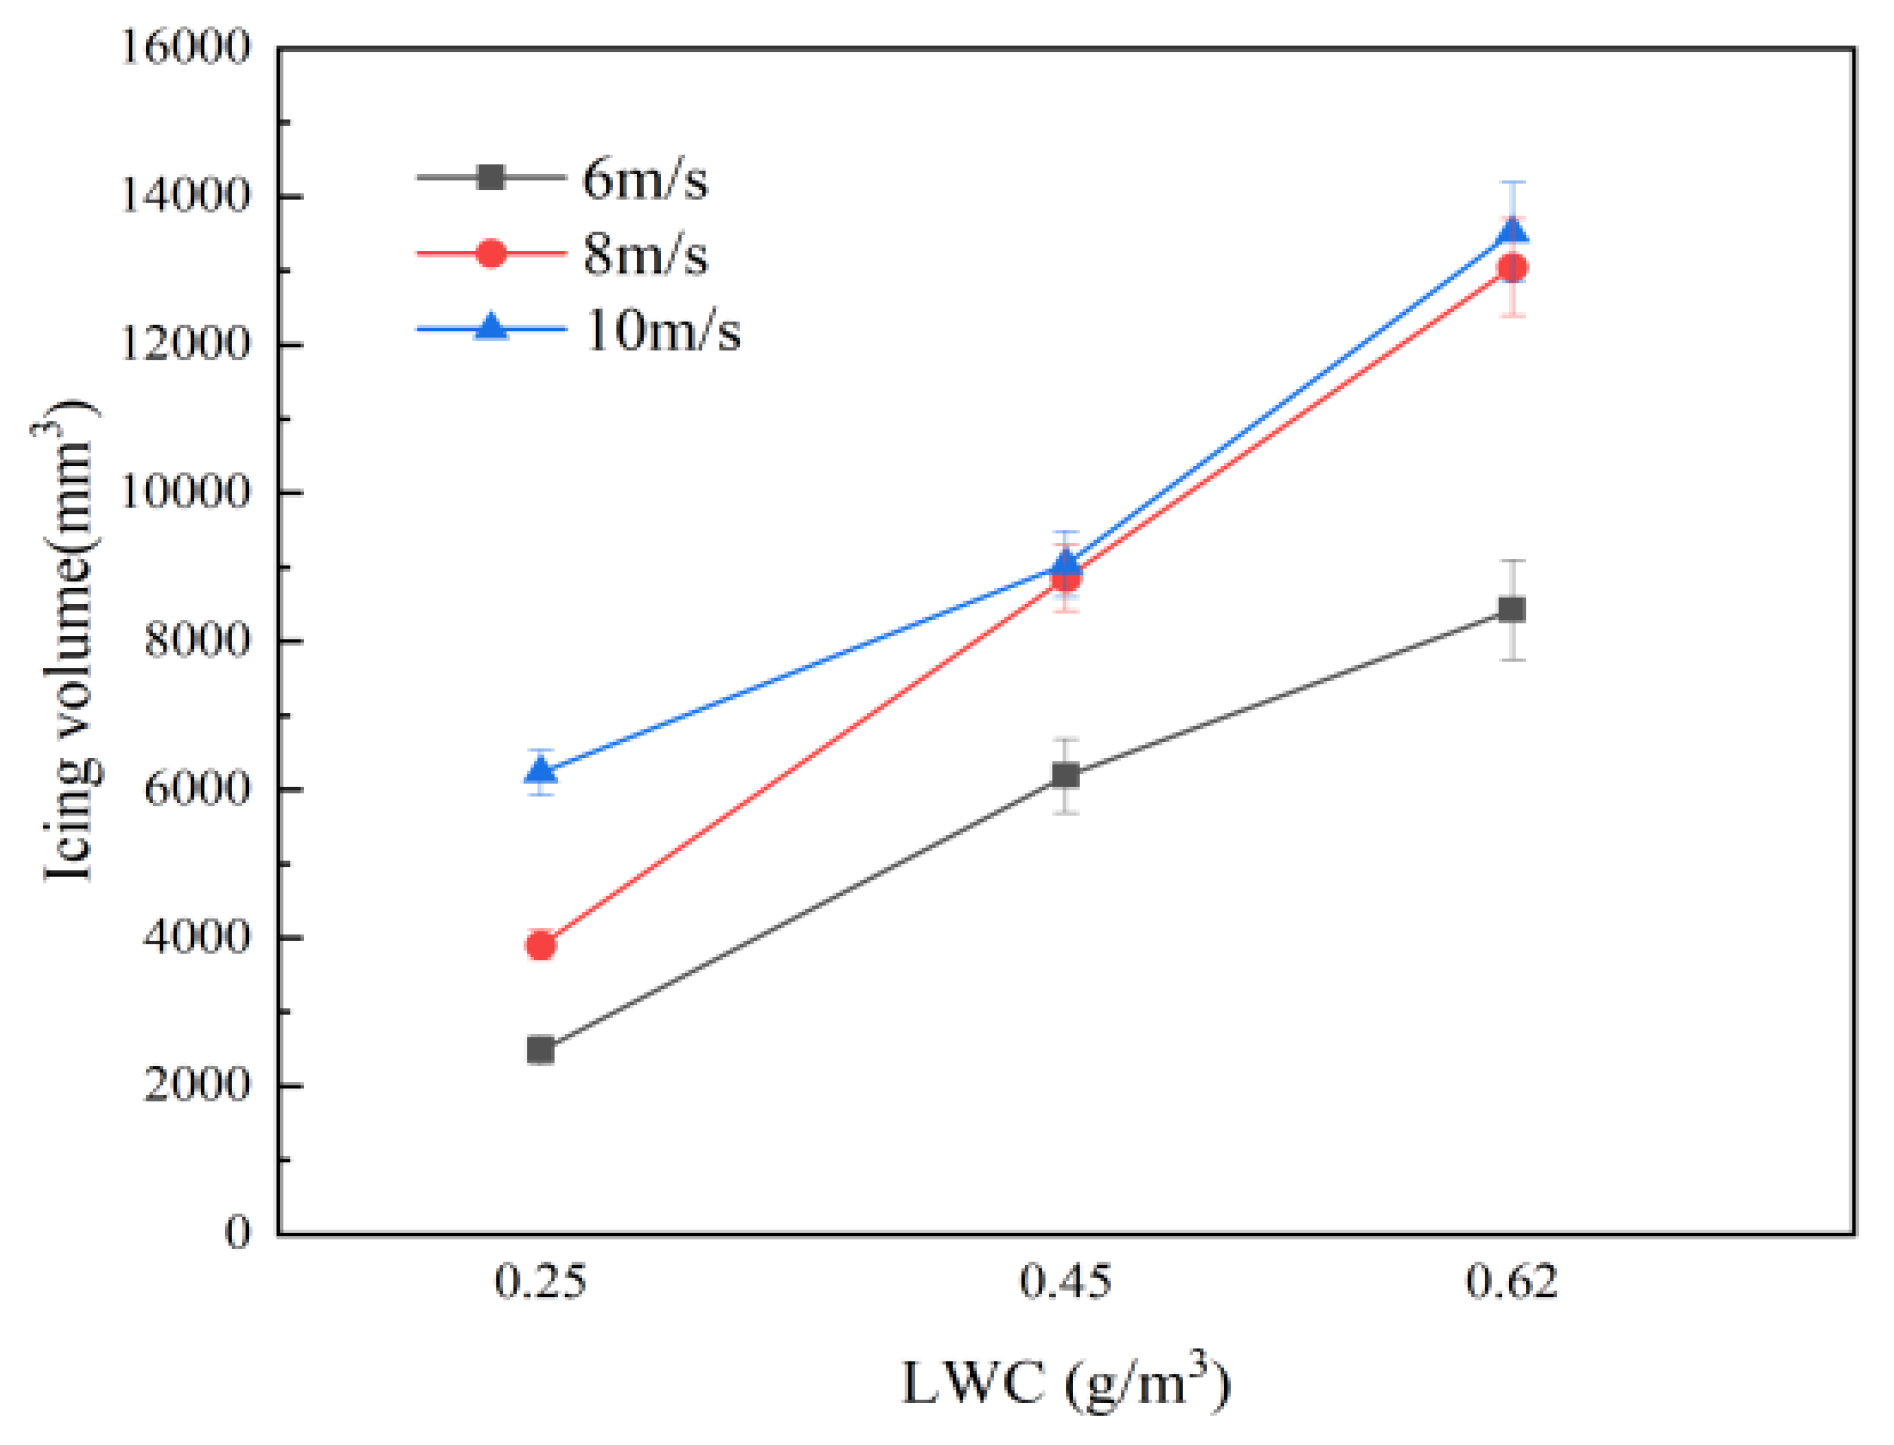
4.4. Analysis of Ice Accretion Characteristics on Blade Surfaces under Different LWCs

The LWC in the air is a crucial parameter for studying wind turbine blade icing, as it reflects the amount of freezable water present. To analyze the impact of varying LWCs under identical icing conditions, Cases 1–3, Cases 4–6, and Cases 7–9 were selected for a comparative analysis of ice forms. Observations of blade surface icing under different LWCs revealed consistent ice morphology and accretion trends. With an increasing LWC, the ice thickness on the blade surface at the same location increases, the 2D cross-sectional area of ice formation enlarges, and there is varying expansion in the icing areas on the suction and pressure sides near the blade root.
In Figure 14, the total ice volumes on the blade surfaces under Cases 7–9 are 6228.42 mm3, 9039.214 mm3, and 13,513.986 mm3, respectively. The statistical analysis indicates that the total ice volume on the blade surfaces increases with a higher LWC in the air. Specifically, at a wind speed of 6 m/s, increasing the LWC leads to ice volume increases of 149.2% and 36.3% for the examined conditions; at 8 m/s, the increases are 126.9% and 47.4%; and at 10 m/s, the increases are 45.1% and 49.5%. This pattern is attributed to the higher LWC, which enhances the freezable water content in the air, resulting in more frequent impacts of supercooled water droplets on the blades. Consequently, this process increases ice thickness and the 2D cross-sectional area of ice formation. In the experimental setup, clear ice is the predominant type of ice formation, where impacted supercooled water droplets freeze upon impact and flow over the blade surface due to various forces. This phenomenon covers areas where no droplets directly impact, leading to ice formation in those regions during wind turbine operation and expanding the overall icing coverage. In contrast, if the ice formation were predominantly frost ice, minimal overflow water would be present on the blade surface, with most supercooled water droplets freezing upon impact. As a result, the icing coverage would approximate the wing surface area between the icing limit and water collection limit for the same icing duration on identical models, resulting in a smaller icing area for frost ice compared to clear ice.

5. Conclusions

Drawing upon pertinent research advancements in icing and taking into account practical engineering implications for wind turbine icing, this study developed a wind tunnel icing test system for 1.5 MW horizontal-axis wind turbine blades, in conjunction with 3D laser scanning technology for ice shape measurement on the test platform, and introduced an experimental research approach appropriate for examining ice buildup on rotating horizontal-axis wind turbine blades. This setup enabled the acquisition of detailed data models of blades covered in ice, offering precise ice shape data to support research on wind turbine icing and de-icing. The primary results can be summarized as follows:
(1)
Under the specified experimental parameters, blade icing predominantly manifested in clear ice and mixed ice states. The icing area emerged within 30% to 50% of the leading edge of the blades. Progressing along the blade’s span from the base, the ice accumulation on the surface shifted from being smooth to rough, with the rough regions exhibiting inclined or irregular patterns that modified the aerodynamic properties of the blades;
(2)
Under the limit conditions set in this study, the maximum ice thickness on 2D wing cross-sections of the ice-covered blades reached 0.5102 m, with an ice-covered area of up to 0.5549 m2, and the icing volume reached 13.514 m3 under the test conditions. When analyzing the influence of the position of the section on the ice accretion characteristics, the 0D maximum ice thickness and ice-covered area increased consistently along the blade’s direction, indicating that the impact of ice accretion is more pronounced on wing sections nearer to the blade tip;
(3)
The quantitative analysis of experimental data revealed that wind speed and the LWC in the air are the predominant factors affecting ice accretion on blade surfaces. When tip speed ratios were held constant, higher wind speeds were found to correlate with elevated surface ice volumes, potentially increasing by 43.2%~57.2% with the escalation of wind speeds. Likewise, higher LWC levels were associated with a greater surface ice volume, potentially increasing by 36.3%~149.2% with higher LWC concentrations.

Author Contributions

Conceptualization, Z.L. and F.F.; formal analysis, Z.L. and Y.D.; funding acquisition, F.F.; investigation, Q.W. and H.L.; methodology, Z.L.; supervision, F.F.; validation, Z.L. and Y.H.; writing—original draft, Z.L.; writing—review and editing, F.F. All authors have read and agreed to the published version of the manuscript.

Funding

This research was funded was by a National Natural Science Foundation of China (NSFC) Project, grant number 52076035, and the “Academic Backbone” of Northeast Agricultural University Fund, grant number 20XG20.T.

Institutional Review Board Statement

Not applicable.

Informed Consent Statement

Not applicable.

Data Availability Statement

Data are contained within the article.

Conflicts of Interest

The authors declare no conflict of interest.

References

  1. Fortin, G.; Perron, J. Wind Turbine Icing and De-Icing. In Proceedings of the 47th AIAA Aerospace Sciences Meeting including The New Horizons Forum and Aerospace Exposition, Orlando, FL, USA, 5–8 January 2009; American Institute of Aeronautics and Astronautics: Washington, DC, USA, 2009. [Google Scholar]
  2. Tan, C.; Papadakis, M.; Miller, D.; Bencic, T.; Tate, P.; Laun, M. Experimental Study of Large Droplet Splashing and Breakup. In Proceedings of the 45th AIAA Aerospace Sciences Meeting and Exhibit, Reno, NV, USA, 8–11 January 2007; American Institute of Aeronautics and Astronautics: Washington, DC, USA, 2007. [Google Scholar]
  3. Miller, D.; Potapczuk, M.; Langhals, T. Preliminary Investigation of Ice Shape Sensitivity to Parameter Variations. In Proceedings of the 43rd AIAA Aerospace Sciences Meeting and Exhibit, Reno, NV, USA, 10–13 January 2005; American Institute of Aeronautics and Astronautics: Washington, DC, USA, 2005. [Google Scholar]
  4. Anderson, D.N.; Tsao, J.-C. Ice Shape Scaling for Aircraft in SLD Conditions; NASA/CR-2008-215302; NASA: Washington, DC, USA, 2008. [Google Scholar]
  5. Broeren, A.P.; Addy, H.E.; Bragg, M.B.; Busch, G.T.; Montreuil, E. Aerodynamic Simulation of Ice Accretion on Airfoils; NASA: Washington, DC, USA, 2011. [Google Scholar]
  6. Diebold, J.M.; Broeren, A.P.; Bragg, M. Aerodynamic Classification of Swept-Wing Ice Accretion. In Proceedings of the 5th AIAA Atmospheric and Space Environments Conference, San Diego, CA, USA, 24–27 June 2013; American Institute of Aeronautics and Astronautics: Washington, DC, USA, 2013. [Google Scholar]
  7. Baizhuma, Z.; Kim, T.; Son, C. Numerical Method to Predict Ice Accretion Shapes and Performance Penalties for Rotating Vertical Axis Wind Turbines under Icing Conditions. J. Wind. Eng. Ind. Aerodyn. 2021, 216, 104708. [Google Scholar] [CrossRef]
  8. Qi, H.; Chang, S.; Yang, Y.; Chang, P. Numerical Investigations on Aero-Engine Icing Characteristics at Mixed Phase Conditions. Appl. Therm. Eng. 2024, 238, 122044. [Google Scholar] [CrossRef]
  9. Kozelkov, A.; Galanov, N.; Semenov, I.; Zhuchkov, R.; Strelets, D. Computational Investigation of the Water Droplet Effects on Shapes of Ice on Airfoils. Aerospace 2023, 10, 906. [Google Scholar] [CrossRef]
  10. Son, C.; Kelly, M.; Kim, T. Boundary-Layer Transition Model for Icing Simulations of Rotating Wind Turbine Blades. Renew. Energy 2021, 167, 172–183. [Google Scholar] [CrossRef]
  11. Son, C.; Kim, T. Development of an Icing Simulation Code for Rotating Wind Turbines. J. Wind. Eng. Ind. Aerodyn. 2020, 203, 104239. [Google Scholar] [CrossRef]
  12. Kind, R.J.; Potapczuk, M.G.; Feo, A.; Golia, C.; Shah, A.D. Experimental and Computational Simulation of In-Flight Icing Phenomena. Prog. Aerosp. Sci. 1998, 34, 257–345. [Google Scholar] [CrossRef]
  13. Enache, A.; Bernay, B.; Glabeke, G.; Planquart, P.; van Beeck, J. Ice Shedding Phenomenon: An Experimental and Numerical Investigation. In Proceedings of the AIAA AVIATION 2020 FORUM, Virtual, 15–19 June 2020; American Institute of Aeronautics and Astronautics: Washington, DC, USA, 2020. [Google Scholar]
  14. Baumert, A.; Bansmer, S.; Trontin, P.; Villedieu, P. Experimental and Numerical Investigations on Aircraft Icing at Mixed Phase Conditions. Int. J. Heat Mass Transf. 2018, 123, 957–978. [Google Scholar] [CrossRef]
  15. Hu, Y.; Xu, C.; Li, S.; Li, P.; Liu, L. Experimental Study on Icing and Anti-Icing of a Rotating Conical Spinner. Appl. Therm. Eng. 2023, 219, 119373. [Google Scholar] [CrossRef]
  16. Wong, S.-C.; Papadakis, M.; Yeong, H.-W.; Wong, S. Comparison of Experimental and Computational Ice Shapes for a Swept Wing Model; SAE International: Warrendale, PA, USA, 2011. [Google Scholar]
  17. Broeren, A.P.; Potapczuk, M.; Riley, J.; Villedieu, P.; Moens, F.; Bragg, M. Swept-Wing Ice Accretion Characterization and Aerodynamics. In Proceedings of the 5th AIAA Atmospheric and Space Environments Conference, San Diego, CA, USA, 24–27 June 2013; American Institute of Aeronautics and Astronautics: Washington, DC, USA, 2013. [Google Scholar]
  18. Papadakis, M.; Yeong, H.W.; Wong, S.C.; Vargas, M.; Potapczuk, M. Experimental Investigation of Ice Accretion Effects on a Swept Wing; NASA: Washington, DC, USA, 2005. [Google Scholar]
  19. Han, Y.; Palacios, J. Analytical and experimental determination of airfoil performance degradation due to ice accretion. In Proceedings of the 4th AIAA Atmospheric and Space Environments Conference, New Orleans, LA, USA, 25–28 June 2012; p. 2794. [Google Scholar]
  20. Xu, H.; Gossett, N.; Chen, B. Knowledge and Heuristic-Based Modeling of Laser-Scanned Trees. ACM Trans. Graph. 2007, 26, 19-es. [Google Scholar] [CrossRef]
  21. Al-Najjar, A.; Amini, M.; Rajan, S.; Green, J.R. Identifying Areas of High-Risk Vegetation Encroachment on Electrical Powerlines Using Mobile and Airborne Laser Scanned Point Clouds. IEEE Sens. J. 2024, 24, 22129–22143. [Google Scholar] [CrossRef]
  22. Narayanan, V.; Singh, R.; Marla, D. A 3D Computational Model of Nanosecond Pulsed Laser Texturing of Metals for Designing Engineered Surfaces. J. Manuf. Sci. Eng. 2024, 146, 051006. [Google Scholar] [CrossRef]
  23. Sjerve, C.; Eng, P.; Benz, A.; Kuan, L. Using Laser Scanning Creatively in a Plant Environment. Insp. J.|Asset Integr. Intell. 2024, 30. [Google Scholar]
  24. Bornhoft, B.; Jain, S.S.; Goc, K.; Bose, S.T.; Moin, P. Large-Eddy Simulations of the NACA23012 Airfoil with Laser-Scanned Ice Shapes. Aerosp. Sci. Technol. 2024, 146, 108957. [Google Scholar] [CrossRef]
  25. Lee, S.; Broeren, A.; Addy, H.; Sills, R.; Pifer, E. Development of 3D Ice Accretion Measurement Method. In Proceedings of the 4th AIAA Atmospheric and Space Environments Conference, New Orleans, LA, USA, 25–28 June 2012; American Institute of Aeronautics and Astronautics: Washington, DC, USA, 2012. [Google Scholar]
  26. Lee, S.; Broeren, A.P.; Kreeger, R.E.; Potapczuk, M.G.; Utt, L. Implementation and Validation of 3-D Ice Accretion Measurement Methodology. In Proceedings of the 6th AIAA Atmospheric and Space Environments Conference, Atlanta, GA, USA, 16–20 June 2014; American Institute of Aeronautics and Astronautics: Washington, DC, USA, 2014. [Google Scholar]
  27. Kreeger, R.E.; Tsao, J.-C. Ice Shapes on a Tail Rotor. In Proceedings of the 6th AIAA Atmospheric and Space Environments Conference, Atlanta, GA, USA, 16–20 June 2014; American Institute of Aeronautics and Astronautics: Washington, DC, USA, 2014. [Google Scholar]
  28. Li, Y.; Wang, S.; Zheng, Y.; Liu, Q.; Feng, F. Design of a Wind Turbine Icing Wind Tunnel Test System Utilizing Natural Low Temperatures. Exp. Fluid Mech. 2016, 30, 54–58. (In Chinese) [Google Scholar]
  29. Li, Y.; Wang, S.; Zheng, Y.; Liu, Q.; Feng, F. Design of a Rotating Blade Icing Wind Tunnel Test System Utilizing Natural Low Temperatures. Exp. Fluid Mech. 2018, 32, 40–47. (In Chinese) [Google Scholar]
  30. Li, Y.; Wang, S.; Yi, X.; Zhou, Z.; Guo, L. Icing Characteristics of a Rotating Cylinder in an Icing Wind Tunnel Test. Acta Aeronaut. Et Astronaut. Sin. 2017, 38, 111–121. (In Chinese) [Google Scholar]
  31. Guo, W.; Shen, H.; Li, Y.; Feng, F.; Tagawa, K. Wind Tunnel Tests of the Rime Icing Characteristics of a Straight-Bladed Vertical Axis Wind Turbine. Renew. Energy 2021, 179, 116–132. [Google Scholar] [CrossRef]
  32. Bragg, M.; Gregorek, G.; Shaw, R. An Analytical Approach to Airfoil Icing. In Proceedings of the 19th Aerospace Sciences Meeting, St. Louis, MO, USA, 12–15 January 1981; American Institute of Aeronautics and Astronautics: Washington, DC, USA, 2012. [Google Scholar]
  33. Anderson, D. Rime-, Mixed-, and Glaze-Ice Evaluations of Three Scaling Laws. In Proceedings of the 32nd Aerospace Sciences Meeting and Exhibit, Reno, NV, USA, 10–13 January 1994; American Institute of Aeronautics and Astronautics: Washington, DC, USA, 1994. [Google Scholar]
  34. Yi, X.; Zhu, G.L. Study on Icing Test Scaling Law. In New Trends in Fluid Mechanics Research; Zhuang, F.G., Li, J.C., Eds.; Springer: Berlin/Heidelberg, Germany, 2009; pp. 249–252. [Google Scholar]
  35. Shi, L.; Feng, F.; Guo, W.; Li, Y. Research and Development of a Small-Scale Icing Wind Tunnel Test System for Blade Airfoil Icing Characteristics. Int. J. Rotating Mach. Hindawi 2021, 2021, e5598859. [Google Scholar]
  36. Langmuir, I.; Blodgett, K. A Mathematical Investigation of Water Droplet Trajectories; Army Air Forces Headquarters, Air Technical Service Command: San Antonio, TX, USA, 1946. [Google Scholar]
  37. Drage, M.A.; Hauge, G. Atmospheric Icing in a Coastal Mountainous Terrain: Measurements and Numerical Simulations, A Case Study. Cold Reg. Sci. Technol. 2008, 53, 150–161. [Google Scholar] [CrossRef]
  38. Li, Y.; Sun, C.; Jiang, Y.; Yi, X.; Xu, Z.; Guo, W. Temperature Effect on Icing Distribution near Blade Tip of Large-Scale Horizontal-Axis Wind Turbine by Numerical Simulation. Adv. Mech. Eng. 2018, 10, 1687814018812247. [Google Scholar] [CrossRef]
Figure 1. Schematic of ice wind tunnel experimental system.
Coatings 14 00970 g001
Figure 2. Installation of experimental model in wind tunnel testing area.
Coatings 14 00970 g002
Figure 3. Handheld laser 3D scanning system.
Coatings 14 00970 g003
Figure 4. Comparison of ice surface before and after spraying with white paint.
Coatings 14 00970 g004
Figure 5. Alignment of multiple point cloud data.
Coatings 14 00970 g005
Figure 6. Model volume deviation color diagram.
Coatings 14 00970 g006
Figure 7. Detailed solid model of ice-covered blade.
Coatings 14 00970 g007
Figure 8. Icing formation on blade surfaces.
Coatings 14 00970 g008aCoatings 14 00970 g008bCoatings 14 00970 g008c
Figure 9. Visual comparison of 3D scanning results and photographs.
Coatings 14 00970 g009
Figure 10. Blade segmentation areas.
Coatings 14 00970 g010
Figure 11. Ice characteristics of each airfoil section.
Coatings 14 00970 g011
Figure 12. Blade ice volume under various operating conditions.
Coatings 14 00970 g012
Figure 13. Impact of wind speed on blade ice volume.
Coatings 14 00970 g013
Figure 14. Impact of LWC on blade ice volume.
Coatings 14 00970 g014
Table 1. Meteorological conditions.
Wind Speed/(m/s)LWC/(g/m3)MVD/μmAtmospheric Temperature/°CAir
Density/(kg/m3)
Air
Viscosity
/(m2/s)
≤7.90.05~0.2530−15~01.2931.7162 × 10−5
Table 2. Experimental conditions.
U
(m/s)
θ
(°)
n
(r/min)
λLWC
(g/m3)
MVD
(μm)
T
(°C)
t
(s)
16012509.00.2530−8120
20.45
30.62
4816709.00.25
50.45
60.62
71017407.50.25
80.45
90.62
Disclaimer/Publisher’s Note: The statements, opinions and data contained in all publications are solely those of the individual author(s) and contributor(s) and not of MDPI and/or the editor(s). MDPI and/or the editor(s) disclaim responsibility for any injury to people or property resulting from any ideas, methods, instructions or products referred to in the content.

