Article

Niobium Oxide Thin Films Grown on Flexible ITO-Coated PET Substrates

by
Alice Marciel
1,2,*,
Alexandre Bastos
2,
Luiz Pereira
1,
Suresh Kumar Jakka
1,
Joel Borges
3,
Filipe Vaz
3,
Marco Peres
4,5,6,
Katharina Lorenz
4,5,6,
Arijeta Bafti
7,
Luka Pavić
8,
Rui Silva
2 and
Manuel Graça
1
1
i3N and Department of Physics, University of Aveiro, Campus Universitário de Santiago, 3810-193 Aveiro, Portugal
2
CICECO, Aveiro Institute of Materials, Department of Materials and Ceramic Engineering, University of Aveiro, 3810-193 Aveiro, Portugal
3
Physics Center of Minho and Porto Universities (CF-UM-UP), University of Minho, Campus de Azurém, 4800-058 Guimarães, Portugal
4
IPFN, Instituto Superior Técnico, University of Lisbon, Avenida Rovisco Pais 1, 1049-001 Lisbon, Portugal
5
INESC MN, Rua Alves Redol 9, 1000-029 Lisboa, Portugal
6
DECN, Instituto Superior Técnico, University of Lisbon, Estrada Nacional 10, Km 139.7, 2695-066 Bodadela, Portugal
7
Faculty of Chemical Engineering and Technology, University of Zagreb, Marulićev trg 19, 10000 Zagreb, Croatia
8
Division of Materials Chemistry, Ruđer Bošković Institute, Bijenička cesta 54, 10000 Zagreb, Croatia
*
Author to whom correspondence should be addressed.
Coatings 2024, 14(9), 1127; https://doi.org/10.3390/coatings14091127
Submission received: 1 August 2024 / Revised: 24 August 2024 / Accepted: 27 August 2024 / Published: 2 September 2024

Abstract

:
Niobium oxide thin films were grown on both rigid and flexible substrates using DC magnetron sputtering for electrochromic applications. Three experimental series were conducted, varying the oxygen to argon flow rate ratio and deposition time. In the first series, the oxygen to argon ratio was adjusted from 0 to 0.32 while maintaining a constant growth time of 30 min. For the second and third series, the oxygen to argon ratios were fixed at 0.40 and 0.56, respectively, with deposition times ranging from 15 to 60 min. A structural transition from crystalline to amorphous was observed at an oxygen to argon flow rate ratio of 0.32. This transition coincided with a change in appearance, from non-transparent with metallic-like electrical conductivity to transparent with dielectric behavior. The transparent niobium oxide films exhibited thicknesses between 51 nm and 198 nm, with a compact, dense, and featureless morphology, as evidenced by both top-view and cross-sectional images. Films deposited on flexible indium tin oxide (ITO)-coated polyethylene terephthalate (PET) substrates displayed a maximum surface roughness (Sq) of 9 nm and a maximum optical transmission of 83% in the visible range. The electrochromic response of niobium oxide thin films on ITO-coated PET substrates demonstrated a maximum coloration efficiency of 30 cm2 C1 and a reversibility of 96%. Mechanical performance was assessed through bending tests. The ITO-coated PET substrate exhibited a critical bending radius of 6.5 mm. Upon the addition of the niobium oxide layer, this decreased to 5 mm. Electrical resistance measurements indicated that the niobium oxide film mitigated rapid mechanical degradation of the underlying ITO electrode beyond the critical bending radius.

1. Introduction

Niobium oxides, encompassing stoichiometric and non-stoichiometric phases such as niobium monoxide (NbO, conductor), niobium dioxide (NbO2, semiconductor), and niobium pentoxide (Nb2O5, dielectric insulator), as well as metastable oxides NbOx (0 < x < 1 and 2 < x < 2.5) and a wide range of Nb2O5 polymorphs, are versatile materials exhibiting remarkable physical properties [1,2,3,4,5,6,7]. Table 1 presents a summary of the physical properties of niobium (Nb) and its stoichiometric oxides.
The niobium–oxygen system, with its diverse range of stoichiometric and non-stoichiometric oxides, has been extensively studied due to its potential applications in batteries [15,16,17], solar cells [18,19,20], capacitors [11,21], optoelectronic devices [22,23], catalysis [24,25,26], sensors [27,28], and biomedical fields [29,30]. Beyond these applications, niobium oxides exhibit electrochromic behavior [31,32,33,34,35], wherein their optical properties undergo persistent changes in response to applied electric fields or currents. These optical variations, measured in transmittance and/or reflectance, are attributed to electrochemically induced reduction reactions [36].
First reported by Reichman in 1980 [32], alongside other metal oxides (Ti, V, Cr, Mn, Fe, Co, Ni, Mo, Rh, Ta, W, and Ir oxides) [37,38], the electrochromic properties of niobium pentoxide have since attracted considerable attention. Various deposition techniques have been employed to fabricate NbOx films, including thermal oxidation [39,40,41], sputtering [42,43,44,45,46], pulsed laser deposition [27,47,48], chemical vapor deposition [49,50,51], atomic layer deposition [52,53,54,55], electrochemical methods [56,57], spray pyrolysis [58,59,60], sol–gel processes [14,61,62,63], and electrophoretic deposition [64].
Electrochromic devices (ECDs) exhibit diverse designs and configurations tailored to specific applications and materials. Conventional absorptive/transmissive ECDs typically consist of a five-layer structure comprising transparent electrical conductors, an electrochromic film, an ion transport layer, an ion storage layer (optionally electrochromic), and a transparent substrate, often glass or flexible polymer [65,66,67,68,69,70] (Figure 1).
Transparent conductors facilitate charge transfer and typically comprise doped metal oxide nanostructures (e.g., indium tin oxide (ITO) and fluorine-doped tin dioxide (FTO) [71,72], aluminum-doped zinc oxide (AZO) [73,74]), silver nanowires (Ag NWs) [75,76], carbon nanotubes [77,78,79,80], graphene [81,82,83], or conductive metal grids [84,85]).
On the other hand, for several years the main interest in the electrochromism phenomenon of employing oxide electrodes has been due to the fact that in the electron transfer process, the electroactive species (for instance H+ or Li+) can be easily intercalated in the amorphous or crystalline structure of the host oxide material [38,86]. These conductive oxide materials make a great choice for electrodes in the above-mentioned metal-oxide electrochromic materials, having been widely employed in the literature for more than 20 years [60,87,88]. In parallel, the everyday need to develop devices that fulfil a flexible, stretchable, architectonic 3D incorporation and with an easy environmental integration framework [89] puts enormous pressure on the choice of electrode to meet these requirements. And naturally, in electrochromic devices, where their flexible application is the subject of increasingly evident technological research, the problem is equally felt. However, the use of metal oxides with electrochromic properties, deposited on flexible substrates with conductive oxides such as ITO and FTO, is still far from being considered technologically viable. To the best of our knowledge, there are not many published works on NbOx-based electrochromic films deposited by DC magnetron sputtering on flexible substrates with ITO. Typically, the technique used is spray pyrolysis [60], where the results achieved, although notable, still mean that the films lack good uniformity. Some other electrochromic oxides, e.g., NiOx, have been successfully deposited on this type of substrate using solution-casting techniques [90], suffering the same side effects, which result from a less precise deposition method. Thus, the attempt to successfully obtain a uniform film deposited by sputtering on flexible substrates marks an important step in the development of the concept of flexible electronics.
Electrochromic layers, forming the core of electrochromic devices, exhibit varying performance based on material composition. Conventional electrochromic layers consist of dense thin films of transition metal oxides (TiO2, V2O5, Cr2O5, MnO2, FeO2, CoO2, NiO2, Nb2O5, MoO3, RhO2, Ta2O5, WO3, IrO2) [38] or electrochromic polymers [91,92] in conjunction with liquid, gel, or solid ion transport layers (electrolytes) to enable functionality. The interface between the electrochromic material, transparent conductor, and ion transport layer significantly influences device performance, with recent advancements focusing on nanostructured electrochromic materials, offering diverse morphologies and enhanced specific surface areas [68,93,94].
Ion transport layers, positioned between the electrochromic and ion storage layers, facilitate ion movement within the device and can be liquid, gel, or solid [95,96,97]. Materials in this category include electrolytes (lithium salts, ammonium salts, ionic liquids) [98,99], ion-conductive polymers [100,101], liquid crystals [102,103], etc. Effective ion transport necessitates sufficient ion conductivity at operating temperatures. Liquid electrolytes generally exhibit higher ion conductivity at room temperature [100,101,104] alongside low electron conductivity to prevent mixed ion–electron conduction and dendrite formation. Additionally, ion transport materials should demonstrate wide electrochemical and chemical stability, interfacial compatibility, non-flammability, non-toxicity, high thermal stability, and adequate mechanical strength (for solid electrolytes) [105,106].
Ion storage layers complement the primary electrochromic layer, either with or without electrochromic properties, to balance charging. These materials require good electrochemical reversibility, stability, capacity, and compatibility with the electrochromic layer [107,108,109].
Electrochromic materials and devices have garnered significant attention in recent years due to their potential applications and advantages, including energy efficiency, sustainability, and innovative design possibilities.
As previously noted, the emergence of multifunctional, flexible electrochromic devices has introduced exciting attributes such as flexibility, stretchability, and foldability, as well as the ability to control color and temperature [72,110,111,112,113,114,115]. However, fabricating these devices remains challenging owing to the complex interplay between growth techniques, substrate properties, and electrode characteristics.
In this work, the properties of NbOx thin films, including morphology and optical, electrical, electrochemical, and mechanical characteristics, were systematically investigated. The study focuses on the influence of the oxygen-to-argon flow rate ratio and the deposition time on these properties. An ITO-coated PET substrate was selected for studying NbOx electrochromic performance due to its high transmittance, good thermal stability, and excellent electrical conductivity. Additionally, it can form a stable interface with similar materials, such as MoOx thin films [36,116,117]. The electrochromic performance of NbOx thin films grown on ITO-coated PET substrates (such as, for example, a maximum reversibility of 96%) is of critical importance, as it opens up the possibility of using NbOx in the design of multifunctional, flexible electrochromic devices.

2. Materials and Methods

2.1. Thin Film Preparation

NbOx thin films were synthesized through reactive DC magnetron sputtering using a custom-built laboratory system. The films were deposited on indium tin oxide (ITO)-coated polyethylene terephthalate (PET) substrates (sheet resistance: 60 Ω/sq), ITO-coated glass (sheet resistance: 5 Ω/sq), and p-type silicon (100) substrates (resistivity: 5–10 Ω·cm).
The cylindrical deposition chamber (60 L) housed a substrate holder positioned 70 mm from the target and equipped with a rotating mechanism for uniform film deposition. A Hüttinger Elektronik (PFG 2500 DC) DC power supply was used to energize the cathode [118]. A niobium target (200 × 100 × 6 mm3, 99.95% purity) was sputtered at a current density of 100 A/m2 in an argon (99.997%) and oxygen (99.997%) plasma. The base pressure was 1 × 10³ Pa, with a constant argon flow of 25 sccm (partial pressure: 3.9 × 101 Pa). The oxygen flow was adjusted to achieve O2/Ar ratios of 0, 0.16, 0.32, 0.40, and 0.56. Substrates were placed on a rotating grounded holder without external heating.
Prior to deposition, substrates underwent plasma treatment in a low-pressure system (Zepto model/Diener Electronic) to enhance film adhesion. Oxygen plasma was applied (5 min) to remove surface impurities, followed by argon plasma (15 min) to induce controlled roughness for nucleation.
The first series of samples were prepared with varying O2/Ar ratios (0 to 0.40) at a constant deposition time of 30 min to explore different niobium oxidation states. In the second and third series, the O2/Ar ratios were fixed at 0.40 and 0.56, respectively, while the deposition time ranged from 15 to 60 min.
Samples with appropriated dimensions depending on the technical analysis (ranging from 5 mm × 5 mm to 10 mm × 10 mm) were prepared. Depending on the substrate, the samples were cut using either a diamond tip or scissors. Prior to analysis performance, the samples were cleaned by blowing with argon. For SEM analyses, samples (5 mm × 5 mm) were assembled in a MicroVise Holder for both top-view and cross-sectional analyses, with carbon conductive tape used as necessary to secure them. Prior to SEM analysis, the samples were coated with a thin film of carbon by thermal evaporation.

2.2. Characterization

2.2.1. Microstructural and Morphologic Characterization

The structural analysis of NbOx thin films was performed using X-ray diffraction (XRD) with a Philips X’pert MRD diffractometer in grazing incidence mode (1°). Scans were conducted using Cu Kα radiation (λ = 1.54060 nm) at a scan rate of 0.01°/s over a 2θ range of 10–80°. XRD patterns were analyzed using HighScore Plus software 4.0.
Film composition was determined by Rutherford backscattering spectroscopy (RBS) using a Van de Graaff accelerator with a 2 MeV He+ particle beam (1 mm diameter). Random spectra were acquired by tilting the sample 5° and rotating it during measurement to prevent channeling. Backscattered particles were detected using a PIN diode detector at 165°. Depth-dependent composition profiles were obtained through fitting using the nuclear data furnace code (NDF) [119,120].
X-ray photoelectron spectroscopy (XPS) was performed using a Kratos Axis Ultra HSA spectrometer with Al Kα excitation (1486.6 eV) in hybrid spectroscopy mode, analyzing a 300 µm × 700 µm area. XPS signals were calibrated using the C 1 s peak at 285 eV from adventitious hydrocarbons. Spectra were acquired at a pass energy of 40 eV with a step size of 0.1 eV.
Raman spectra were collected at room temperature using a Horiba Jobin Yvon HR800 spectrometer (Horiba Scientific, Kyoto, Japan) in backscattering geometry to minimize substrate signal. A He-Cd laser (325 nm or 442 nm) was used for excitation, with a 100× objective lens. The 325 nm line was employed for thinner samples to reduce substrate interference.
The surface and cross-sectional morphology of the NbOx thin films were examined by scanning electron microscopy (SEM) using a Hitachi SU-70 model. Surface roughness was further analyzed using an S-NEOX 3D Optical Profiler system (Sensofar Metrology, Terrassa, Spain).

2.2.2. Optical Characterization

Transmittance spectra of the thin films grown on ITO-coated PET and ITO-coated glass substrates, under normal incidence in visible range, were measured by means of a Shimazu UV-2100 spectrometer (Shimadzu Corporation, Kyoto, Japan).

2.2.3. Electrical Characterization

Electrical measurements were conducted in both DC and AC modes at room temperature. The electrical resistivity of bulk NbOx thin films grown on silicon substrates at O2/Ar flow rate ratios of 0, 0.16, and 0.32 was determined from current-voltage (I–V) characteristics measured using a HP 34401A multimeter and an ISO-Tech IPS 2303 DD dual-tracking power supply (Isotech, Conchester, VT, USA).
Impedance spectroscopy was employed to analyze NbOx thin films grown on ITO-coated glass substrates at an O2/Ar flow rate ratio of 0.40 and varying deposition times (15, 30, and 60 min). Measurements were performed in bulk configuration using a Novocontrol Alpha-A Dielectric Spectrometer (Novocontrol Technologies, Montabaur, Germany) over a frequency range of 0.01 to 1 MHz at a voltage of 10–20 mV.
For electrical contacts, 4 mm long gold electrode pads were deposited on the NbOx thin films grown on ITO-coated glass substrates using a Quorum Technologies SC7620 Sputter Coater. Platinum wires were attached to the gold pads and ITO-coated glass surface for connection to the measurement instrument.

2.2.4. Electrochromic Characterization

Cyclic voltammetry (CV) measurements were conducted using a Metrohm Autolab PGstat 302N potentiostat in a three-electrode configuration. A three-electrode optical glass cell was employed, with the NbOx thin film grown on an ITO-coated PET substrate serving as the working electrode, a platinum wire as the counter electrode, and a low-leakage Ag/AgCl/KCl (3 M) electrode as the reference. The electrolyte solution consisted of 1 M lithium perchlorate (LiClO4) in propylene carbonate (PC). Cyclic voltammograms were obtained by sweeping the potential from −2.0 to +2.0 V vs. Ag/AgCl/KCl (3 M) at a scan rate of 10 mV/s.
All experiments were performed at room temperature within an argon (99.9999% purity) atmosphere-controlled glovebox. The water content was continuously monitored in parts per million (ppm) using a DS 400 chart recorder coupled with a FA 515 Ex dew point sensor and a CP110 differential pressure transmitter.

2.2.5. Mechanical Characterization

The mechanical properties of both the ITO-coated PET substrates and the thin films deposited thereon were assessed using a custom-built collapsing radius system [121]. This method involves clamping a sample between two parallel plates and progressively reducing the plate separation using a linear actuator. To prevent premature cracking, the sample is initially subjected to a relatively large bending radius, allowing for controlled deformation studies.
As illustrated in Figure 2, the bending radius in this configuration is half the distance between the plates. The custom system incorporates a linear actuator driven by a stepper motor with a screw-thread mechanism, providing a 100 mm travel range and a maximum speed of 5 mm/s.
Polylactic acid (PLA) fixtures were designed to hold the samples, while printed circuit boards (PCBs) served as electrical contacts for conductive film testing. A multimeter measured the electrical resistance of the ITO-coated PET substrate. A computer-controlled automated system synchronized the bending process with data acquisition. The electrical resistance of the ITO-NbOx composite was measured using a parallel plate sample holder connected to an electrometer (Figure 2c).

3. Results and Discussion

3.1. Microstructural and Morphologic Characterization

3.1.1. Structural Analysis

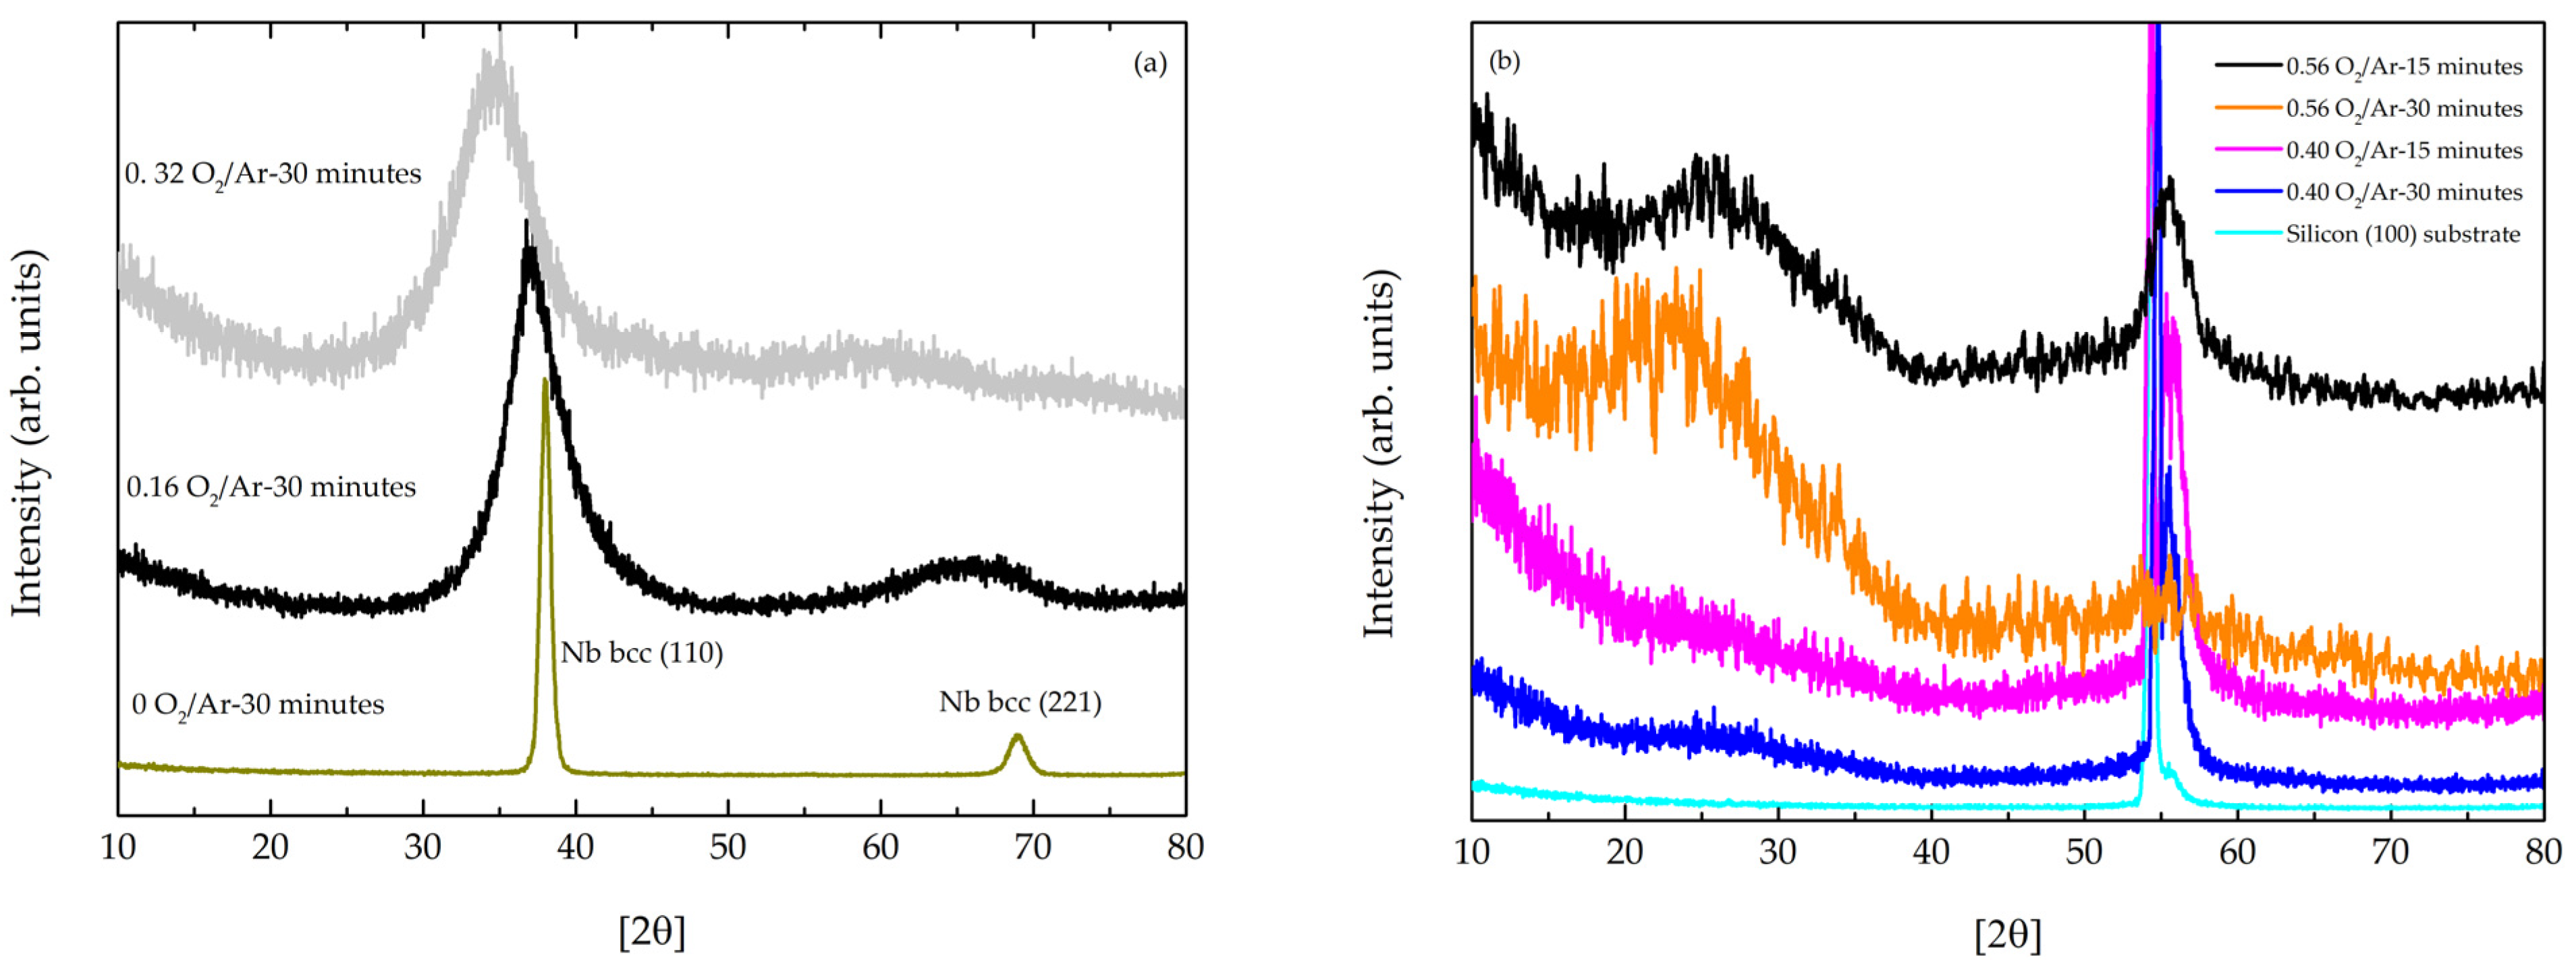
XRD patterns of the first series of NbOx films grown on silicon substrates (Figure 3) exhibited a progressive transition from polycrystalline to amorphous structures with increasing oxygen content. Films deposited at O2/Ar flow rate ratios of 0.32 or lower were polycrystalline. The film grown at an O2/Ar ratio of 0 (Nb film) displayed a body-centered cubic (bcc) niobium structure, consistent with JCPDS Card No. 00-035-0789 [122,123]. For films deposited at O2/Ar ratios of 0.16 and 0.32, diffraction peaks were observed at approximately 37° and 35°, respectively. This shift to lower angles suggests oxygen-induced lattice strain in the niobium structure [124].
Diffractograms of the second and third series (transparent films) with O2/Ar flow rate ratios of 0.40 and 0.56, respectively, displayed broad bands centered at approximately 26° and 22° (Figure 3b). These broad bands confirmed the formation of an amorphous NbOx structure [31,125,126,127,128].
The more intense peaks around 55° are from the silicon substrate where the films were deposited.

3.1.2. Composition of the Films

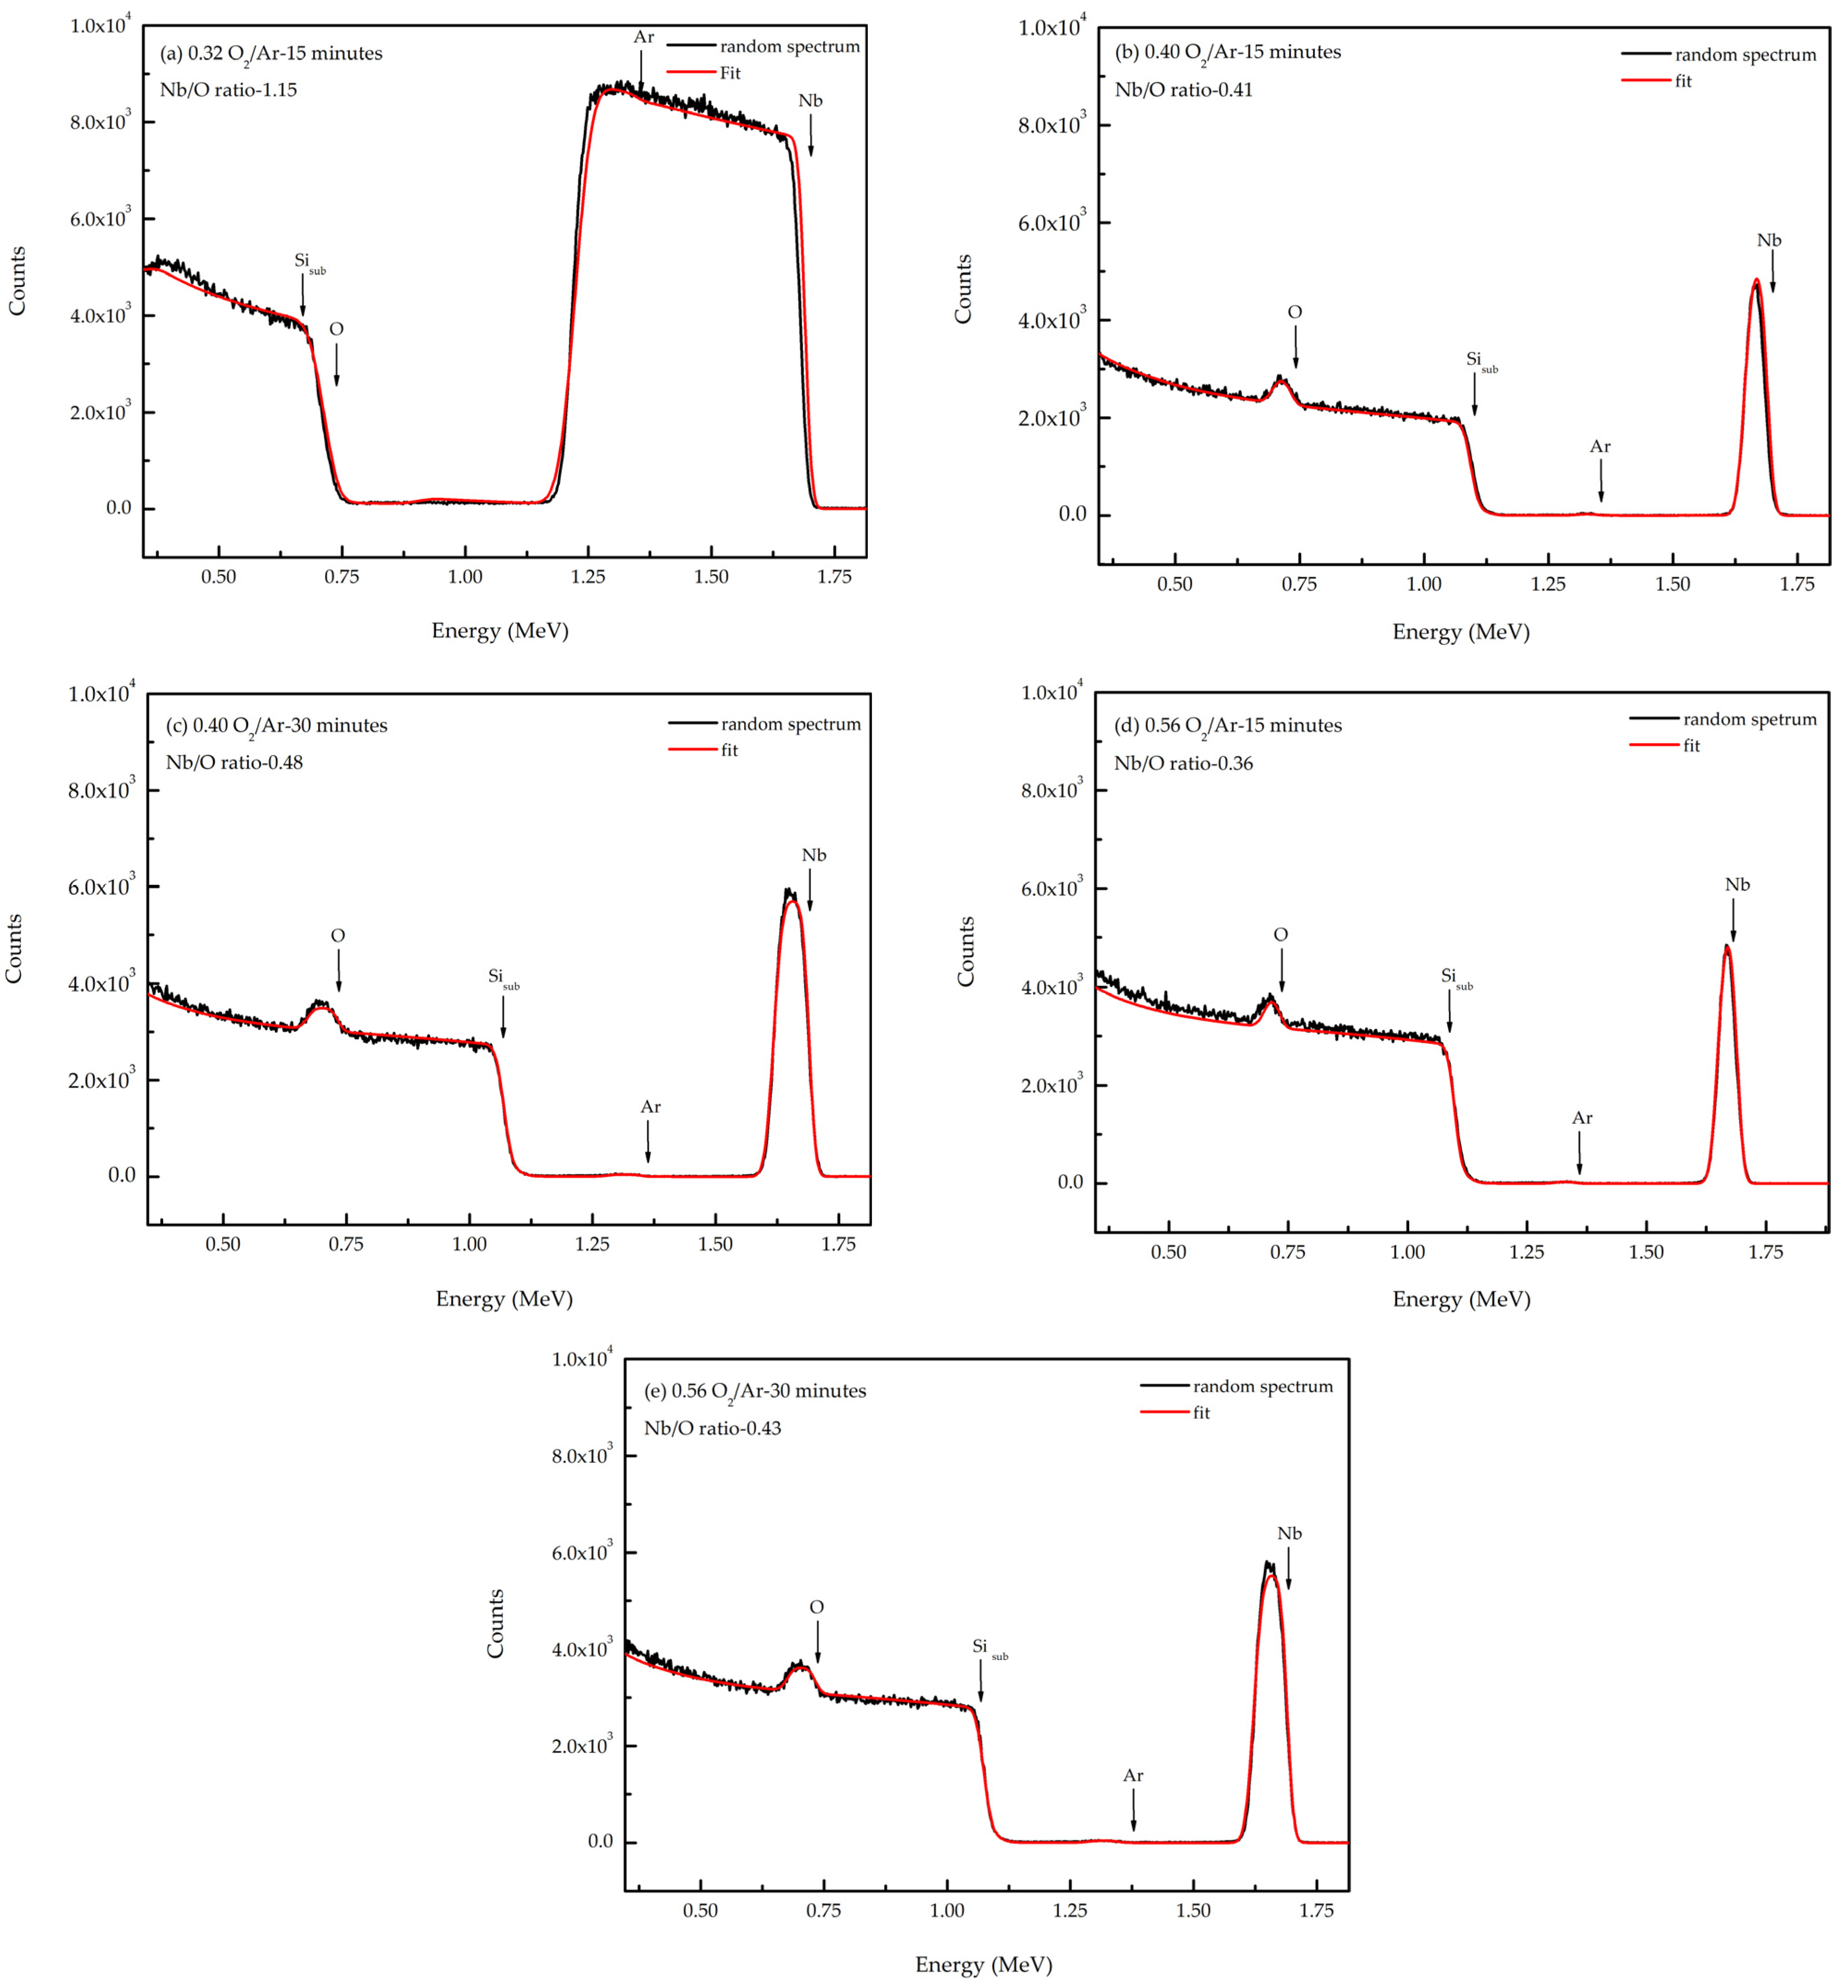
In order to estimate the density and determine the composition of the different thin films, the NDF code was used to fit the RBS spectra (red lines in Figure 4). Despite the low precision in estimating the oxygen concentration using RBS, both because it is a light element and due to the fact that the signal related to oxygen is overlapped by the silicon barrier signal, it was possible to perform a qualitative analysis of the Nb/O ratio for the various deposited films in the function of the O2/Ar ratio.
Figure 4a–e presents RBS spectra of NbOx thin films deposited on silicon substrates at O2/Ar flow rate ratios of 0.32, 0.40, and 0.56. These films exhibit a transition from a metallic to a transparent appearance. The spectra reveal four distinct barriers, corresponding to niobium (Nb), oxygen (O), argon (Ar), and silicon (Si). The argon peak is associated with the sputtering process, while the silicon peak originates from the substrate.
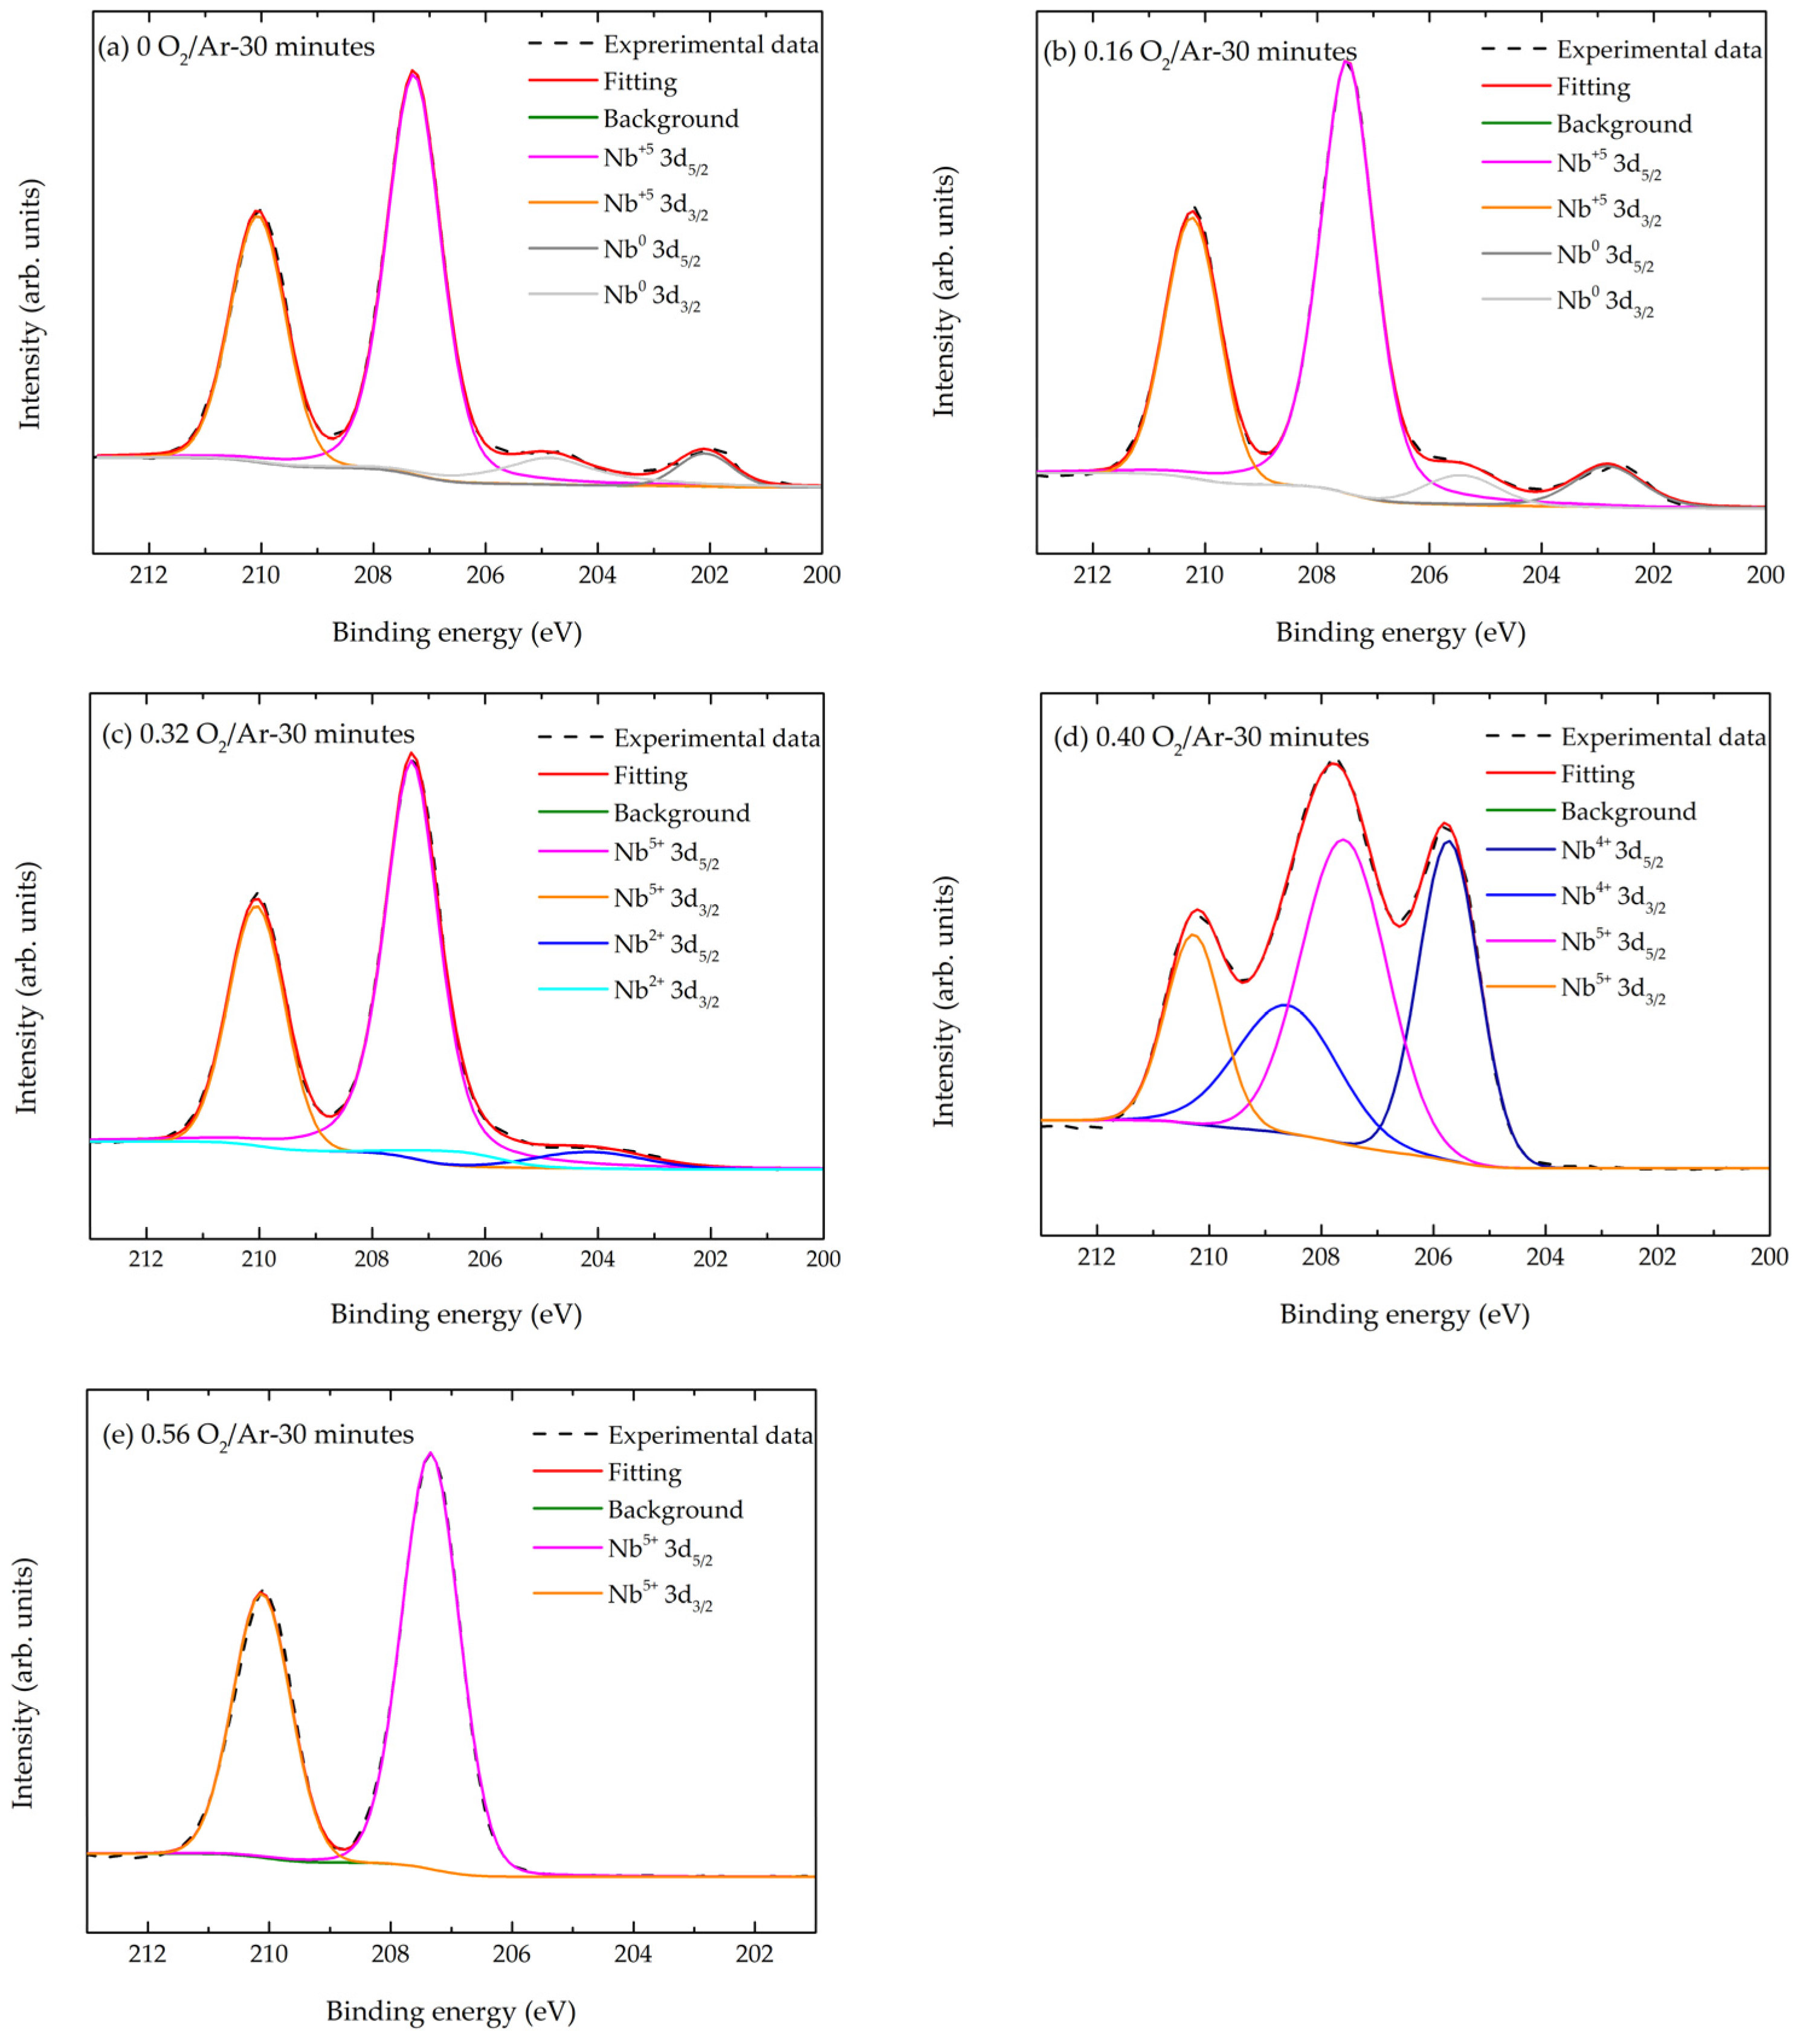
The film deposited at an O2/Ar ratio of 0.32 for 15 min (Figure 4a) exhibited a Nb/O ratio of 1.15, indicating a substoichiometric Nb oxide with mixed valence states (Nb2+ and Nb5+), likely accompanied by oxygen vacancies, as confirmed by XPS (Figure 5c).
Regarding the film deposited at an O2/Ar ratio of 0.40 for 30 min (Figure 4c), this exhibited a Nb/O ratio of 0.48, suggesting a substoichiometric Nb oxide close in composition to Nb2O5 but with a slight oxygen deficiency. XPS results (Figure 5d) corroborated the presence of mixed valence states (Nb4+ and Nb5+), implying an incomplete oxidation process, possibly due to insufficient oxygen for the complete conversion of NbO2 to Nb2O5. In summary, this analysis of the Nb/O ratio clearly suggests the presence of an amorphous structure. These RBS spectra also reveal that, for a fixed deposition time, increasing the O2/Ar ratio leads to thinner films. Based on RBS fit results, the thickness of the thin films (in atoms/cm2) and the density, considering the thickness SEM measurements, were estimated (Table 2).

3.1.3. Surface Chemistry Analyses

Figure 5a–e presents high-resolution XPS spectra of the Nb 3d state for samples grown at various O2/Ar ratios. The spectra exhibit the characteristic spin-orbit splitting of the Nb 3d core level. Deconvolution into two doublets, corresponding to different oxidation states, was performed using Lorentzian–Gaussian line shapes, assuming a spin-orbit splitting of 2.78 eV and an intensity ratio of 1.5 between the 3d5/2 and 3d3/2 components.
The presence of Nb5+, Nb4+, Nb2+, and Nb⁰ oxidation states was identified. For the Nb⁰ state, the Nb 3d5/2 and 3d3/2 peaks were located at 202.1 eV and 204.9 eV (Figure 5a) and 202.7 eV and 205.5 eV (Figure 5b), respectively, for films grown at O2/Ar ratios of 0 and 0.16. The Nb2+ and Nb4+ oxidation states displayed Nb 3d5/2 and Nb 3d3/2 peak positions at 204.0 eV and 206.8 eV (Figure 5c) and 205.7 eV and 208.8 eV (Figure 5d), respectively. The Nb5+ oxidation state exhibited Nb 3d5/2 and Nb 3d3/2 peak positions at 207.1 eV and 210.06 eV (Figure 5a), 207.5 eV and 210.2 eV (Figure 5b), 207.3 eV and 210.05 eV (Figure 5c), 207.6 eV and 210.3 eV (Figure 5d), and 207.3 eV and 210.3 eV (Figure 5e). These values align with reports in the literature [129,130].
A thin layer of native niobium pentoxide was observed on the film surfaces (Figure 5a), likely formed upon atmospheric exposure, regardless of the sample composition [43].
All binging energies values for niobium oxides species are presented in Table 3.

3.1.4. Raman Analyses

Figure 6a,b displays Raman spectra of the first, second, and third series of NbOx thin films. Characteristic Raman spectra of niobium oxides typically exhibit bands attributed to stretching and bending vibrational modes of metal–oxygen bonds, such as Nb-O-Nb (200–300 cm1), Nb-O (500–700 cm1), and Nb=O (850–1000 cm1) [134,135].
The Raman spectra of films grown at O2/Ar flow rate ratios up to 0.32 (Figure 6a) share similarities, displaying four broad bands centered at approximately 270, 490, 640, and 810 cm1, along with a peak at 520 cm1. The 520 cm1 peak corresponds to optical phonon vibrations of the silicon substrate. The presence of both NbO6 octahedra and NbO4 tetrahedra in films grown at O2/Ar ratios of 0 and 0.16 is suggested by the Raman spectra.
The broad band at approximately 640 cm1 is associated with stretching modes of NbO6 octahedra, characteristic of amorphous niobium pentoxide structures [134,136,137], while the broad band at around 810 cm1 corresponds to Nb-O symmetric modes of the NbO4 tetrahedral structure [138]. An increase in the O2/Ar flow rate ratio leads to a decrease in intensity of the 810 cm1 band and a more pronounced 640 cm1 band. It is worth noting that the exposure of the as-deposited films to atmosphere likely resulted in the formation of a native Nb2O5 layer, contributing to the NbO6 octahedra structure.
While XRD and XPS confirm the presence of metallic niobium (bcc) in films grown at O2/Ar flow rate ratios of 0 and 0.16, pure metals typically exhibit weak Raman scattering [139].
Raman spectra of films deposited at O2/Ar flow rate ratios of 0.40 and 0.56 (Figure 6b) showed similarities, with four broad and weak bands at approximately 300, 490, 810, and 900 cm1, a strong 640 cm1 band, and the silicon substrate peak at 520 cm1.
The prominent 640 cm1 band in films grown at O2/Ar flow rate ratios of 0.40 and 0.56 indicates the presence of an amorphous Nb2O5 phase, consistent with XRD (Figure 3b) and XPS (Figure 5d,e) results. The weak 810 cm1 band is likely associated with Nb-O symmetric modes of the NbO4 tetrahedral structure [138]. XPS analysis of films grown at an O2/Ar flow rate ratio of 0.40 confirms the presence of mixed Nb4+ and Nb5+ valence states.

3.1.5. Morphological and Thin Growth Features

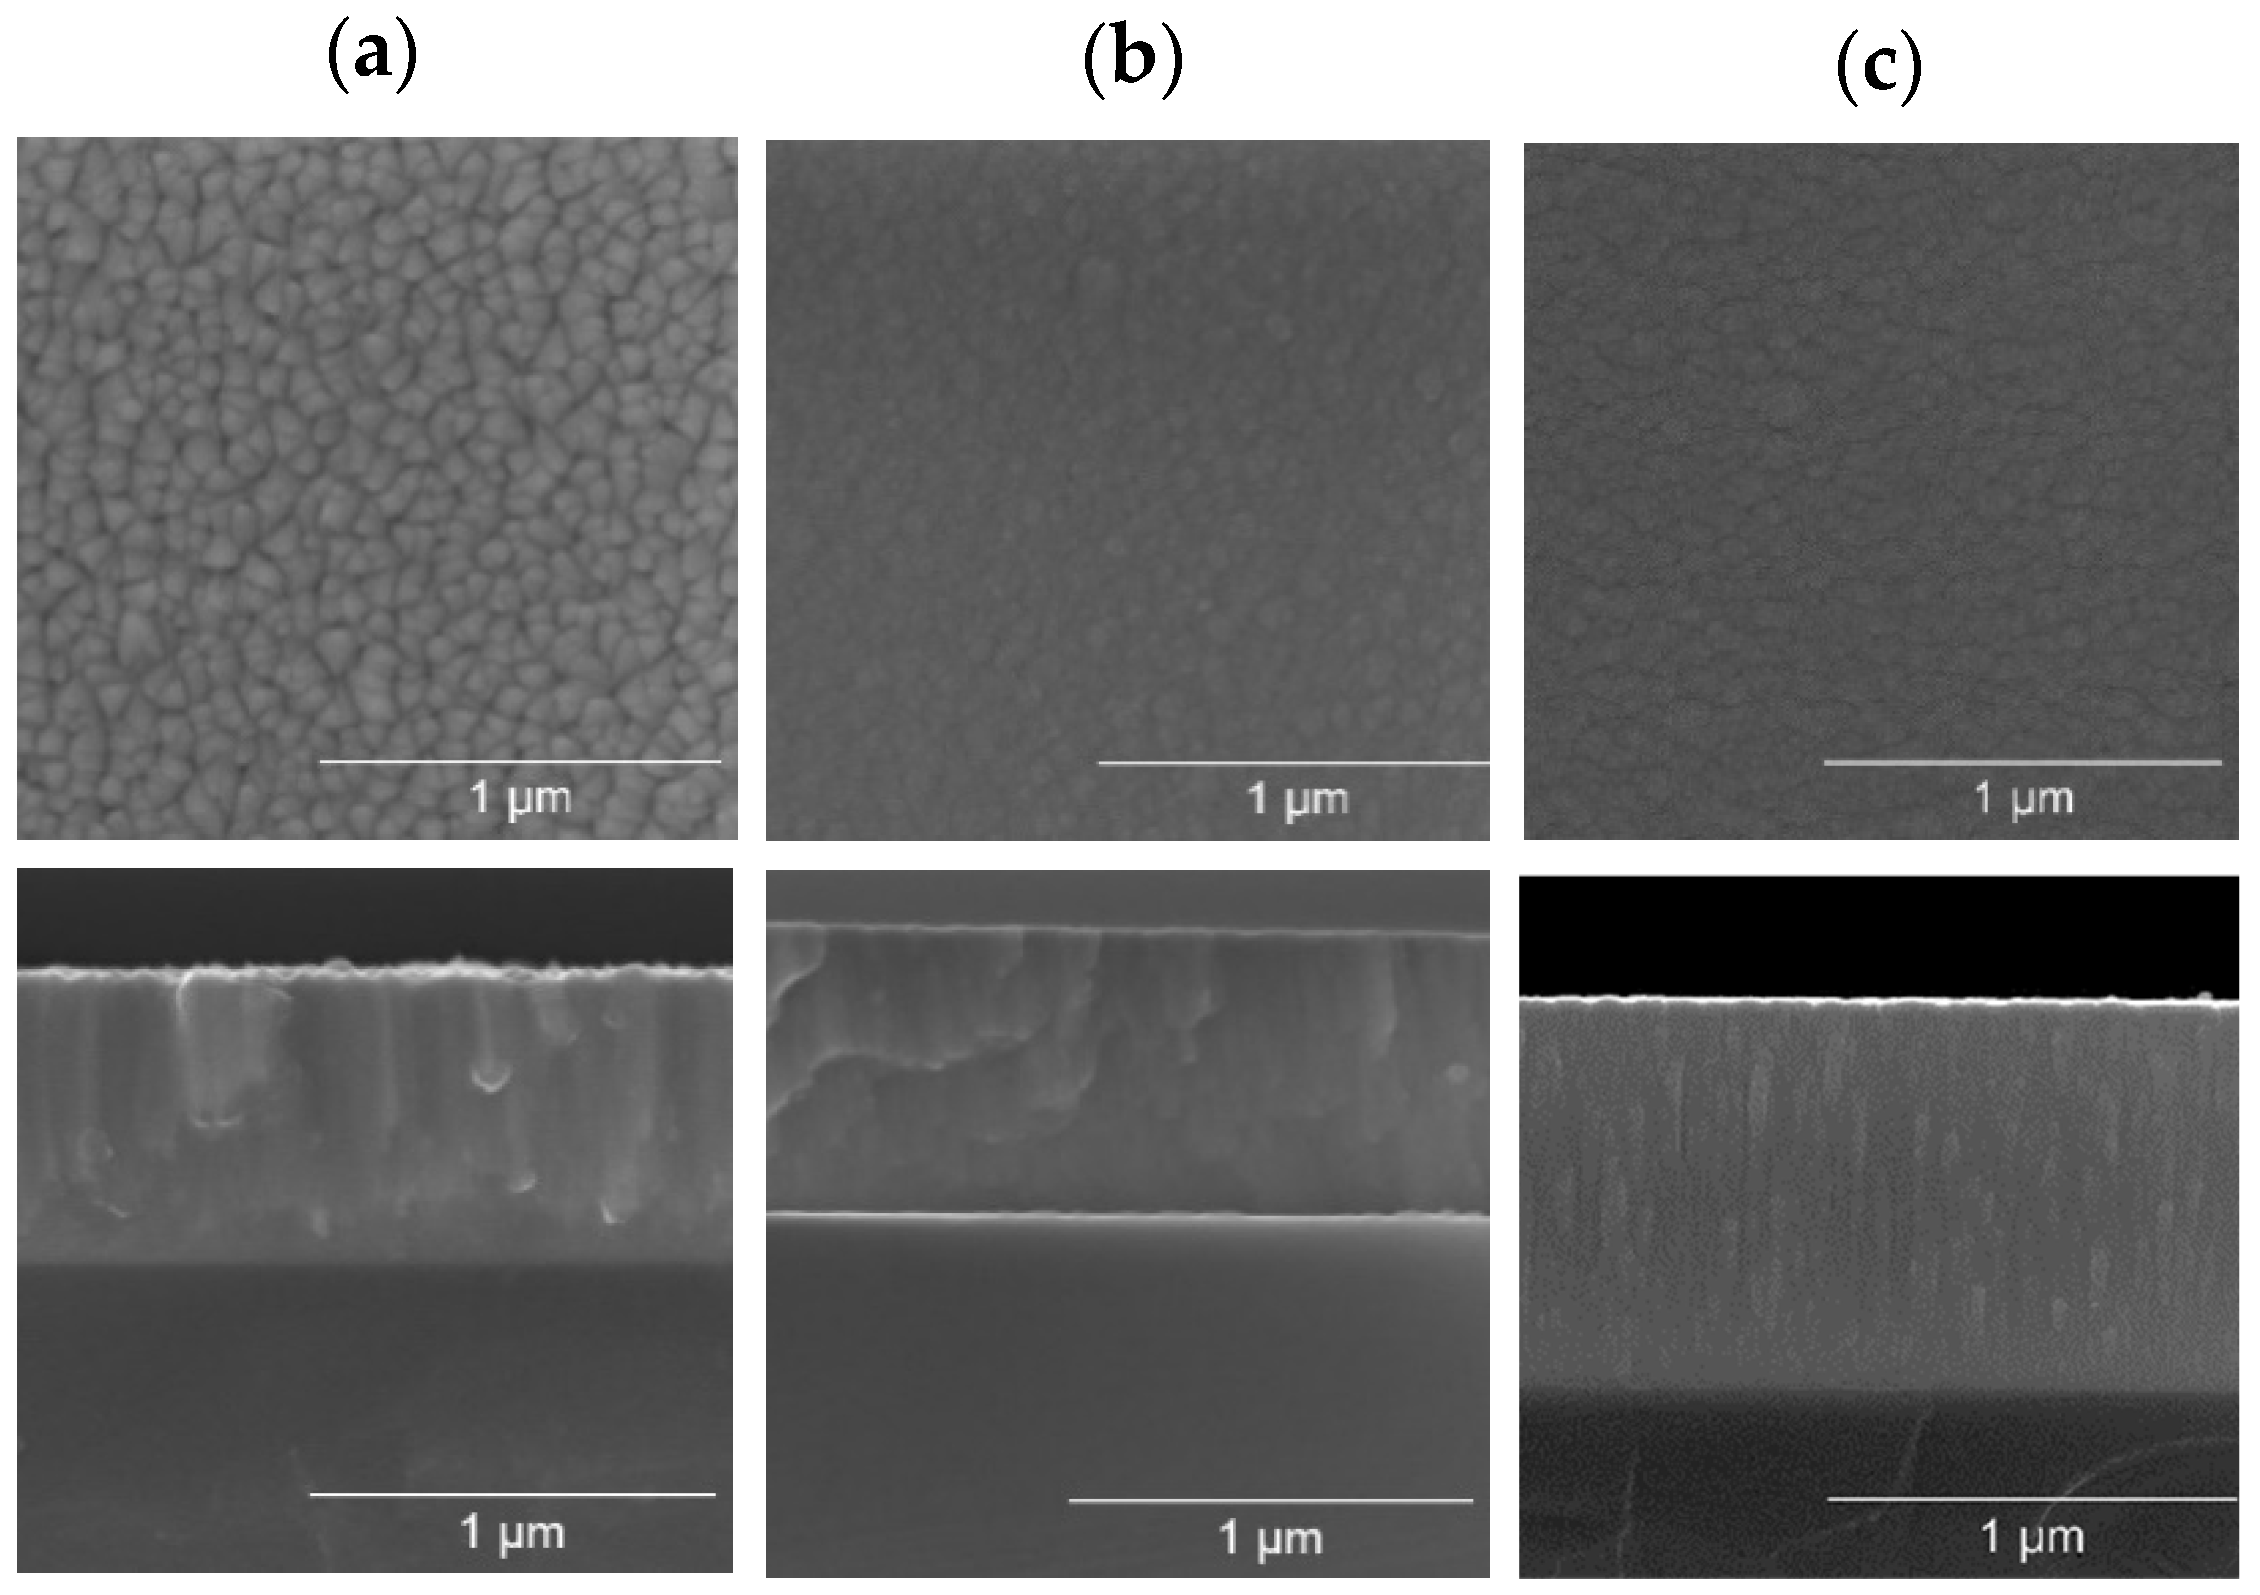
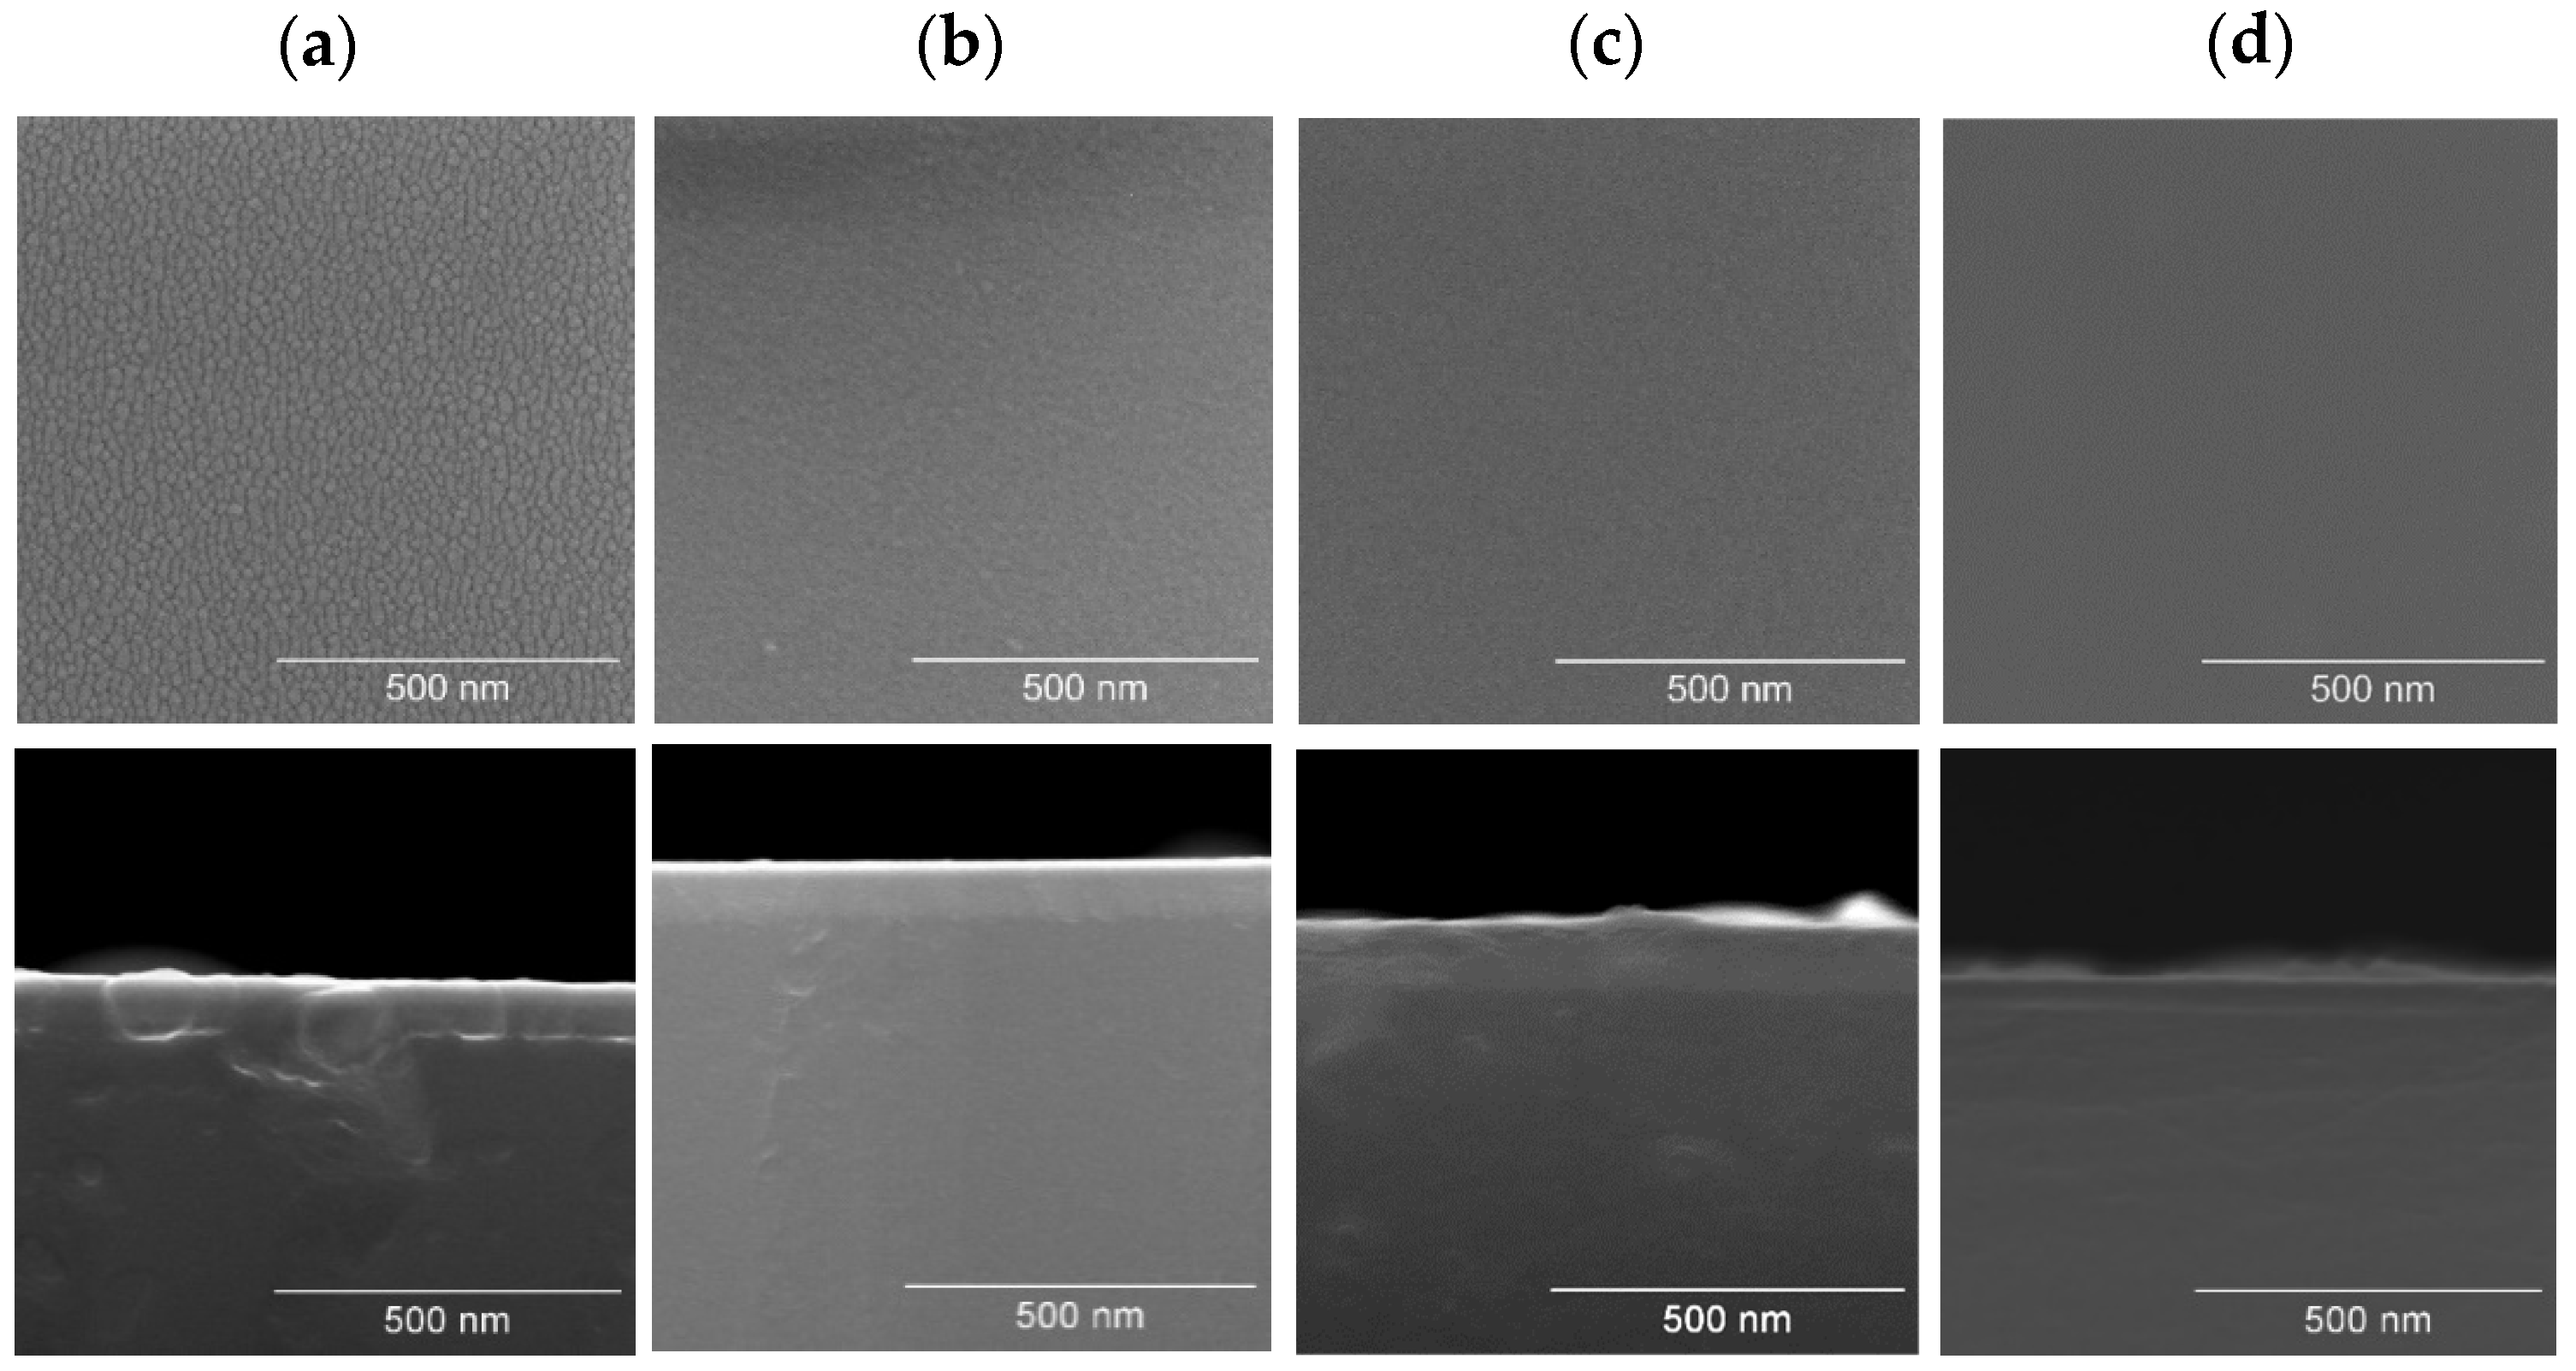
The two-dimensional (2D) surface and cross-section morphologies of NbOx thin films deposited on silicon and ITO-coated PET substrates were investigated using SEM micrographs, as shown in Figure 7, Figure 8 and Figure 9. The SEM micrographs show that NbOx thin films grown at O2/Ar flow rate ratios of up to 0.32 exhibited a well-defined structure, with defined grains in the top view and columnar grain growth in the cross-section (Figure 7).
Upon increasing the flow rate ratio of O2/Ar to 0.40 and 0.56, the NbOx thin films’ SEM images revealed a compact/dense and inexpressive morphology on both top view and cross-section, without evidence of the presence of cracks or porosity. A slight texturing on the top view prevails on NbOx thin films with higher deposition times, as shown in Figure 8.
A decrease in film thickness was observed with decreasing deposition time and increasing O2/Ar flow rate. For instance, at an O2/Ar flow rate of 0.40, reducing the deposition time from 30 min to 15 min resulted in a thickness reduction from 75 nm to 60 nm. Similarly, at a constant deposition time of 30 min, increasing the O2/Ar flow rate from 0.40 to 0.56 led to a decrease in thickness from 88 nm to 51 nm.
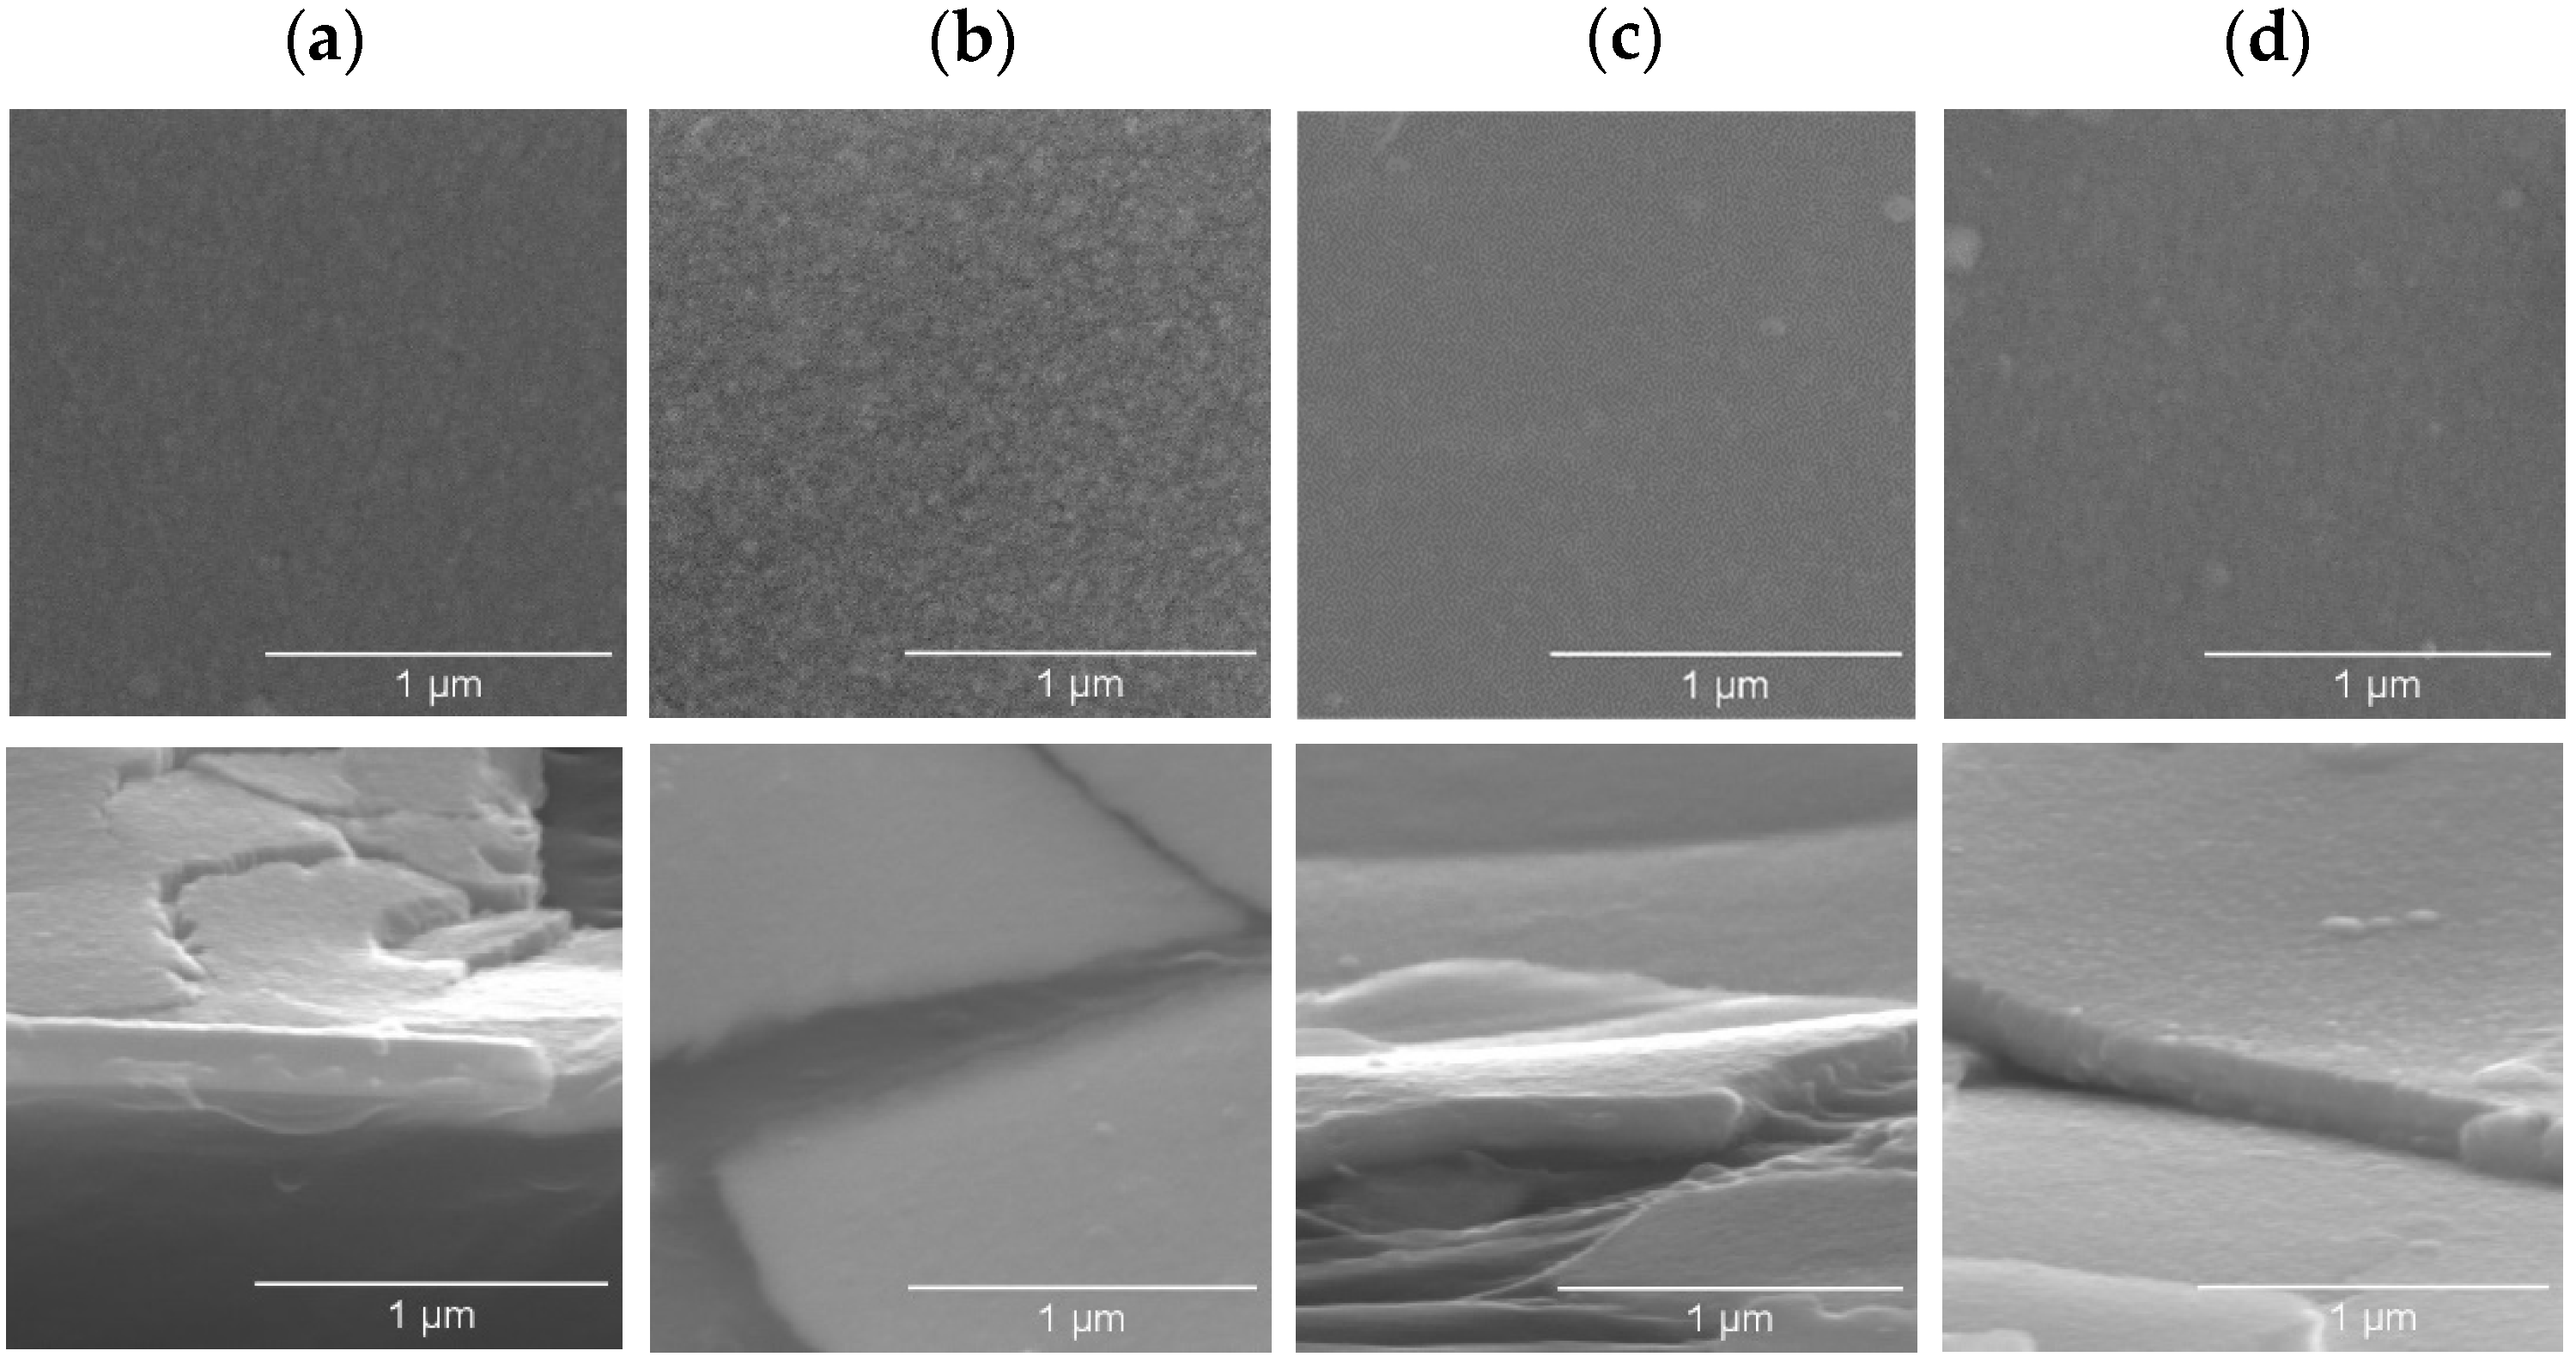
SEM micrographs of thin films grown on ITO-coated PET substrates (Figure 9) revealed morphological similarities to those grown on silicon substrates.
Table 4 presents the roughness values of samples grown at O2/Ar flow rate ratios of 0.40 and 0.56 with varying deposition times, as determined by optical profilometry. Thin films deposited on ITO-coated PET substrates exhibited roughness values ranging from 3 to 9 nm. A decreasing trend in roughness was observed with an increasing O2/Ar flow rate ratio. This correlation is supported by SEM micrographs, which revealed a smoother surface morphology in top-view images of films grown at an O2/Ar flow rate ratio of 0.56 (Figure 9).

3.2. Optical Response of Thin Films

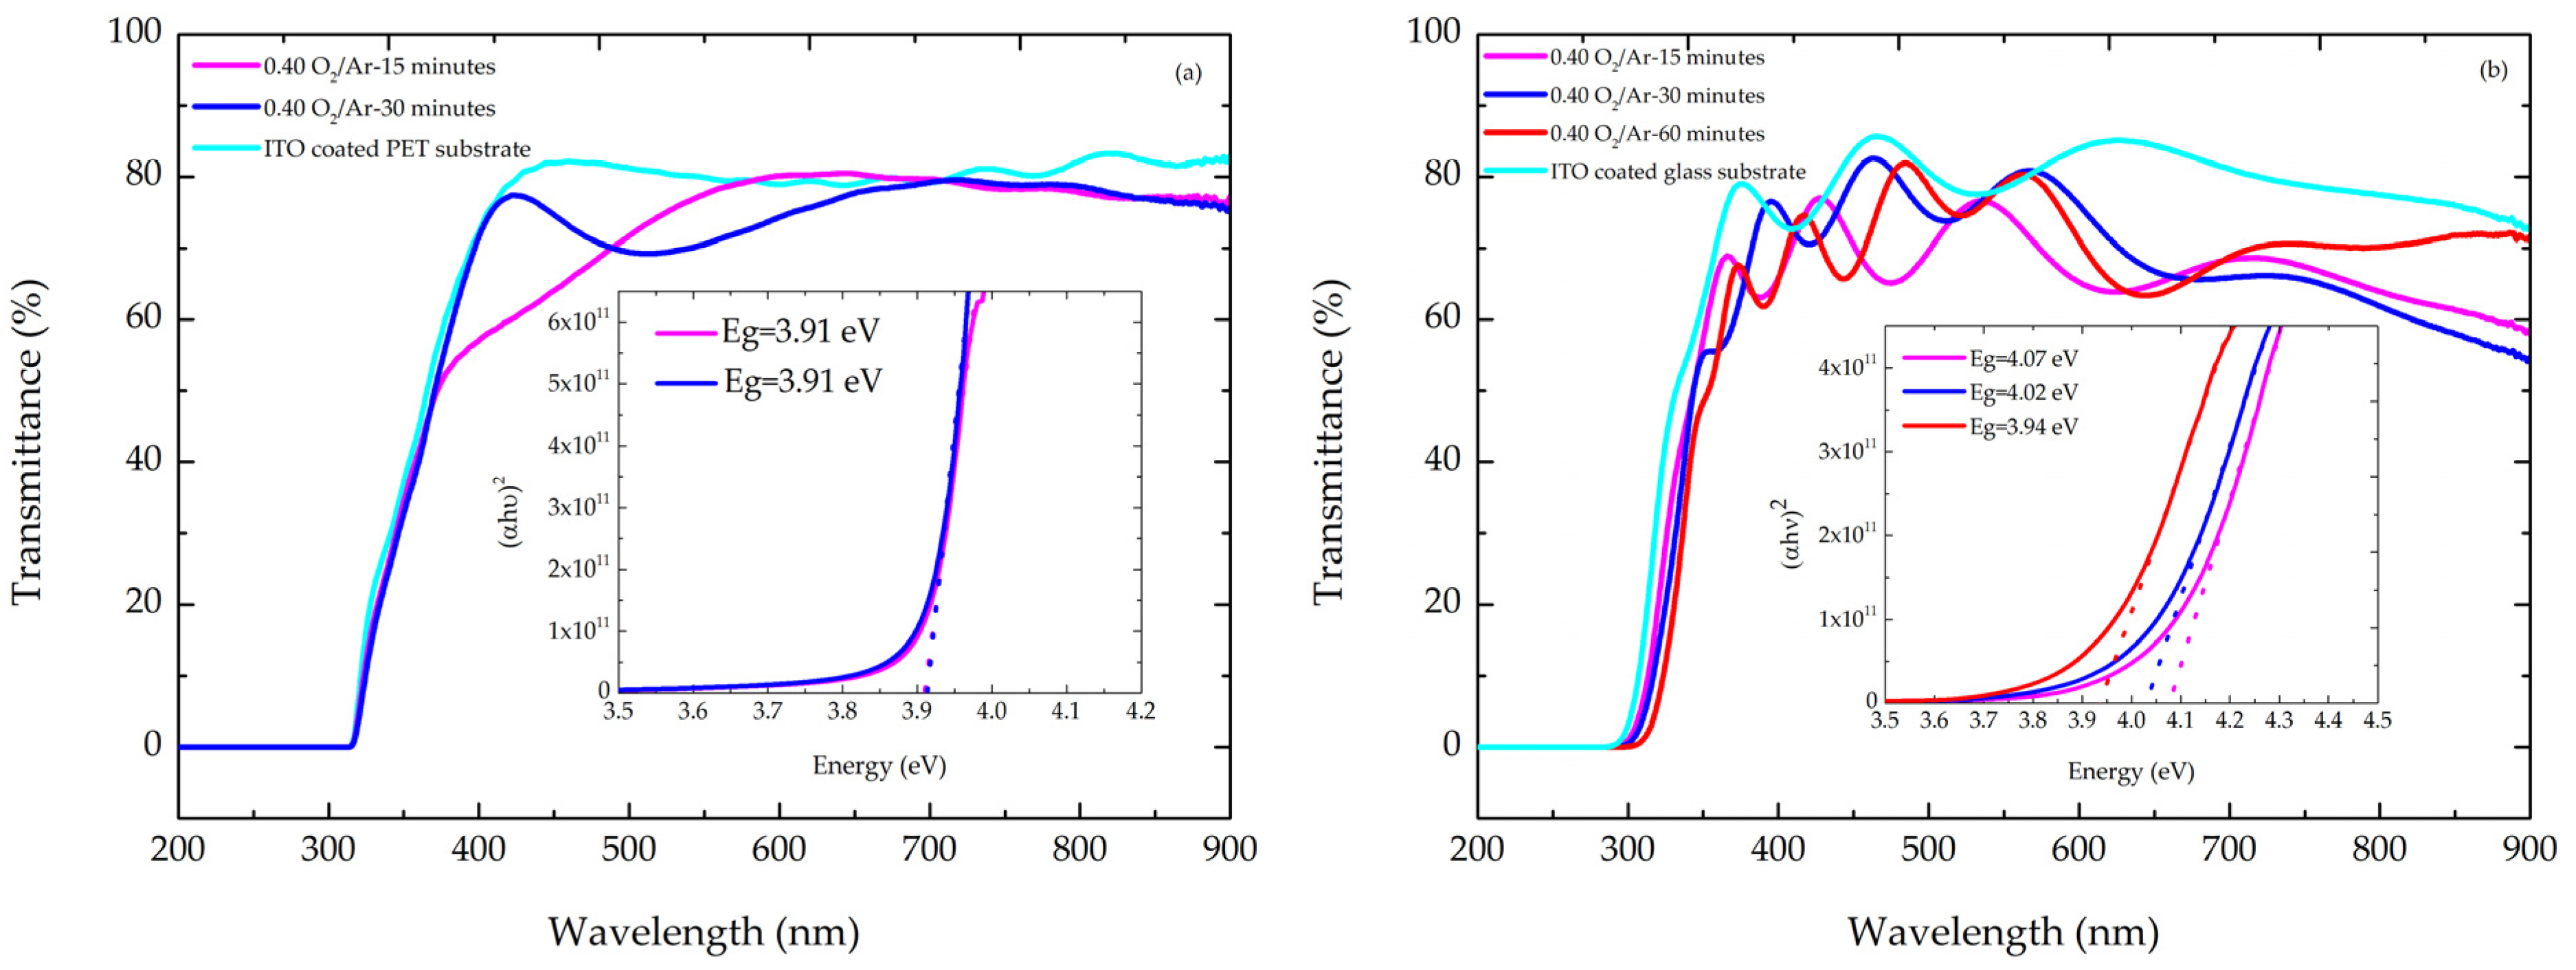
Figure 10a,b illustrate the transmittance spectra of NbOx films deposited on ITO-coated PET and ITO-coated glass substrates at an O2/Ar flow rate ratio of 0.40 and varying deposition times. NbOx films grown on ITO-coated glass exhibited higher visible-range transmittance (maximum of 83%) compared to those on ITO-coated PET (maximum of 81%). These transmittance values align with reported data for sputtered Nb2O5 films [140,141,142].
The Tauc method [142,143] was employed to determine the direct and indirect bandgap energies of the NbOx films by extrapolating the linear portion of (αhν)2 versus hν plots for direct transitions and (αhν)1/2 versus hν plots for indirect transitions, where α is the absorption coefficient and hν is the photon energy. The maximum direct bandgap values were found to be 3.91 eV for NbOx films on ITO-coated PET and 4.07 eV for NbOx films on ITO-coated glass, both deposited at an O2/Ar flow rate ratio of 0.40. The direct band gap values obtained are consistent with those reported in previous studies [9,13].
A red shift (decrease in bandgap energy) was observed with increasing film thickness, potentially due to enhanced disorder and the presence of defects associated with substoichiometric Nb2O5 (as confirmed by RBS, Table 2). The direct bandgap energy behavior observed may be linked to an increase in oxygen ion vacancies within the NbOx thin films as the deposition time increases [144].
Table 5 summarizes the transmittance and bandgap values for all samples investigated.

3.3. Electrical Characterization

The electrical resistivity, at room temperature, of the NbOx thin films at 0 (without oxygen introduction), 0.16, and 0.32 O2/Ar flow rate ratios was measured using the four-probe method [43,145]. The thin films’ resistivity was calculated using Equation (1):
ρ = V i w F 3
where ρ represents the resistivity, V the measured voltage, i the applied current, w the film thickness, and F 3 a correction factor related to the geometry of the sample [8,146]. Correction factors were determined through geometric series calculations. The contacted area was assumed to be infinitesimally small, a highly accurate approximation for the physical configurations employed. The four-point probes were arranged collinearly and equidistantly.
Figure 11 illustrates the electrical resistivity of NbOx thin films as a function of oxygen content in the sputtering atmosphere. The NbOx film grown at an O2/Ar flow rate ratio of 0 exhibited a resistivity of 98.2 µΩ·cm, consistent with previous studies [147].
A significant increase in resistivity was observed with increasing oxygen content, reaching values in the thousands of µΩ·cm (Figure 11a,b). The film prepared at an O2/Ar flow rate ratio of 0.32 displayed a metallic appearance and the highest resistivity of approximately 2000 µΩ·cm, potentially attributed to the presence of metastable suboxides (NbOx, 0 < x < 1) [11].
Upon further increasing the oxygen content in the sputtering atmosphere, a threshold was reached beyond which the film structure transitioned from crystalline to amorphous. Concomitantly, optical transparency emerged, accompanied by significant changes in electrical properties. The samples exhibited notably high resistivity, consistent with previously discussed findings.
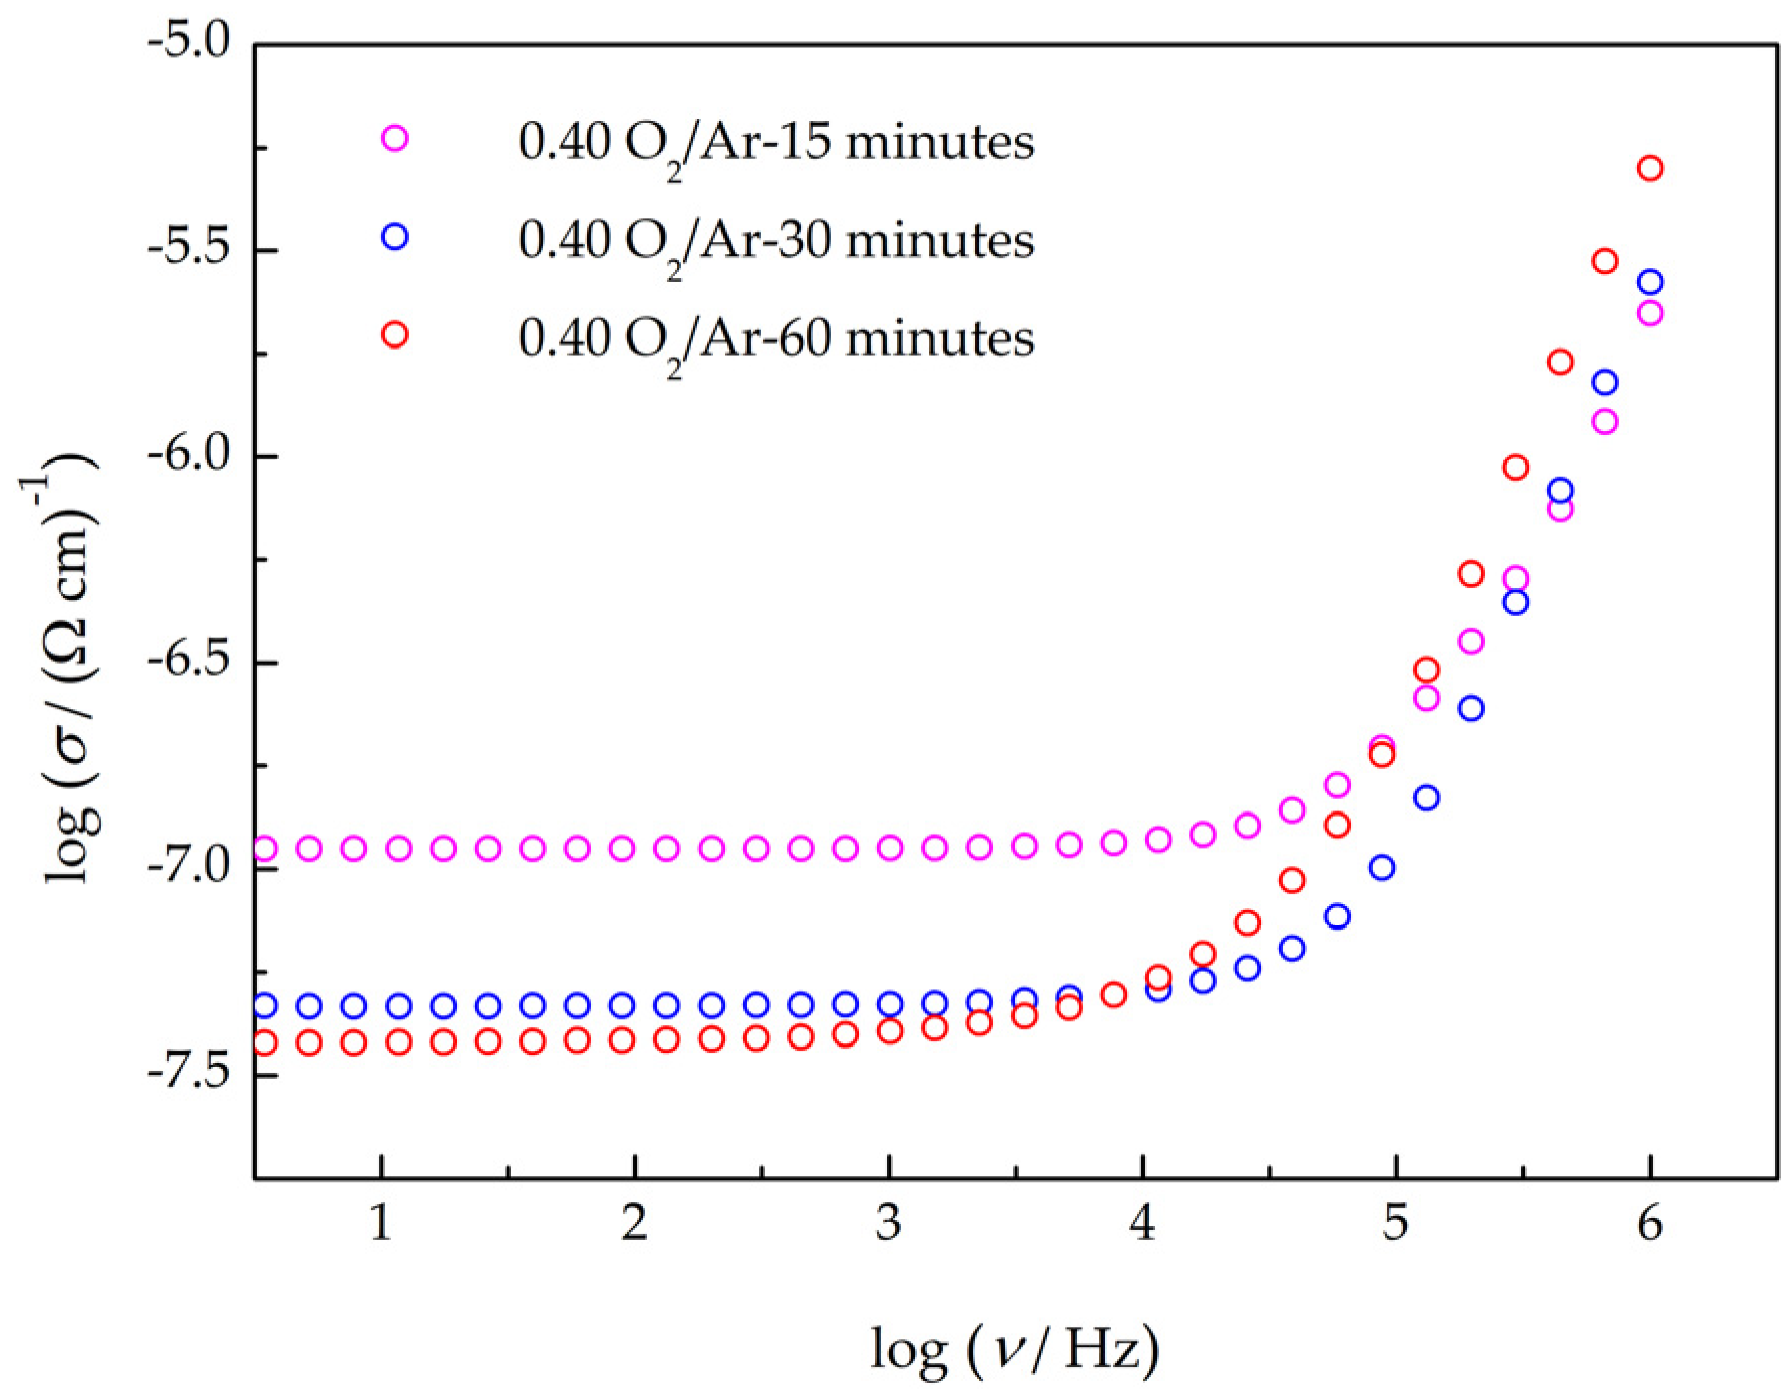
Figure 12 presents the bulk electrical conductivity of NbOx thin films grown on ITO-coated glass at an O2/Ar flow rate ratio of 0.40 and varying deposition times as a function of frequency.
Figure 13 illustrates the frequency-dependent imaginary part of the dielectric permittivity for NbOx thin films grown on ITO-coated glass at an O2/Ar flow rate ratio of 0.40 and varying deposition times. Analysis of both the electrical conductivity (Figure 12) and the imaginary part of the impedance (Figure 13) as functions of frequency reveals a dielectric relaxation phenomenon occurring at approximately 1 kHz. This indicates consistent dielectric behavior across all samples.
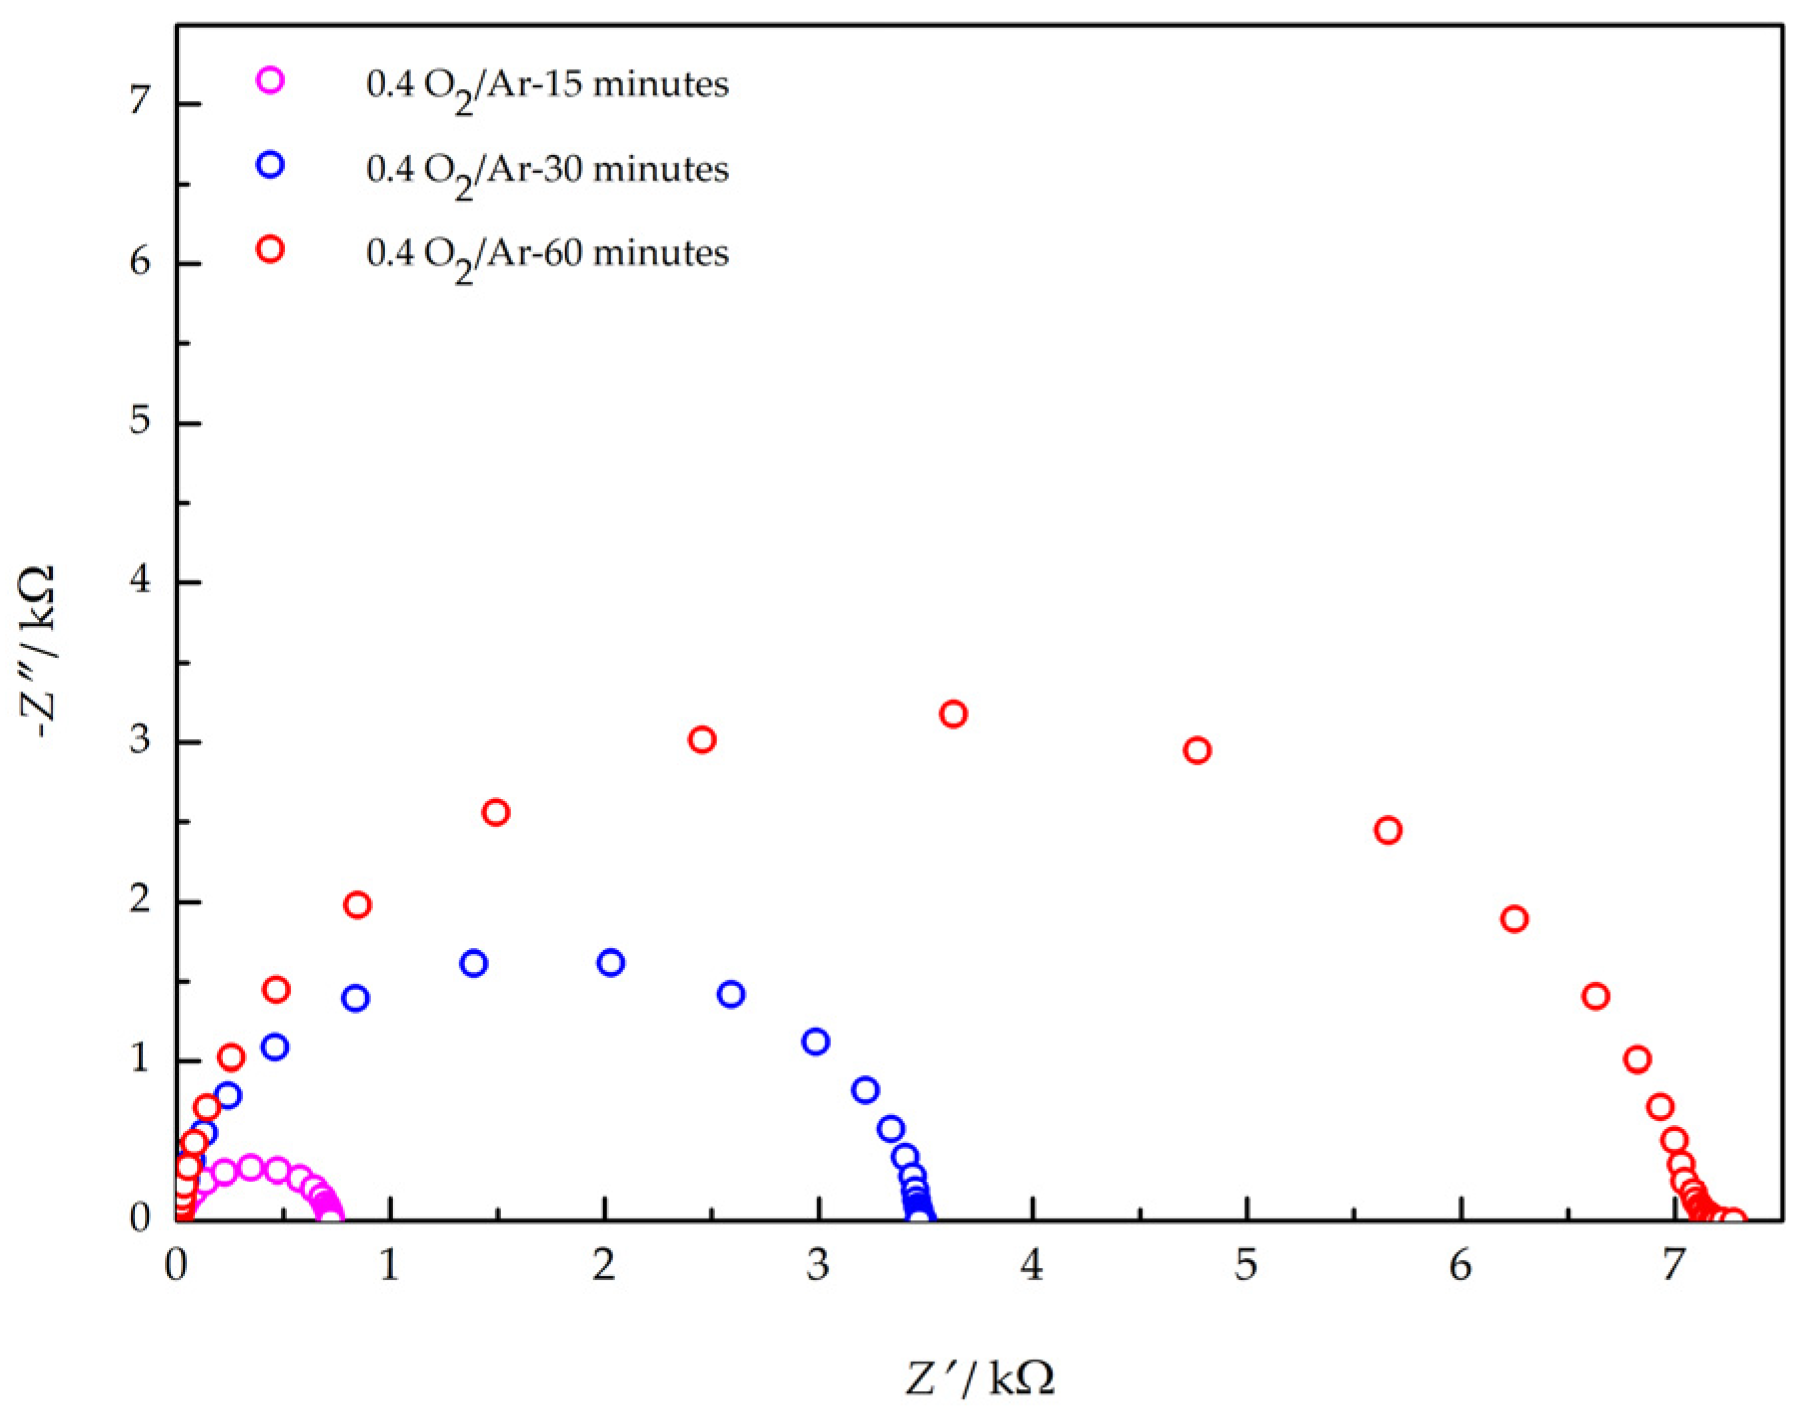
Figure 14 shows the Cole–Cole plot of the NbOx thin films grown on ITO-coated glass at a 0.40 flow rate ratio of O2/Ar with different deposition times, as a function of the frequency. The Cole–Cole plot revealed a dielectric relaxation phenomenon close to the Debye model [148].
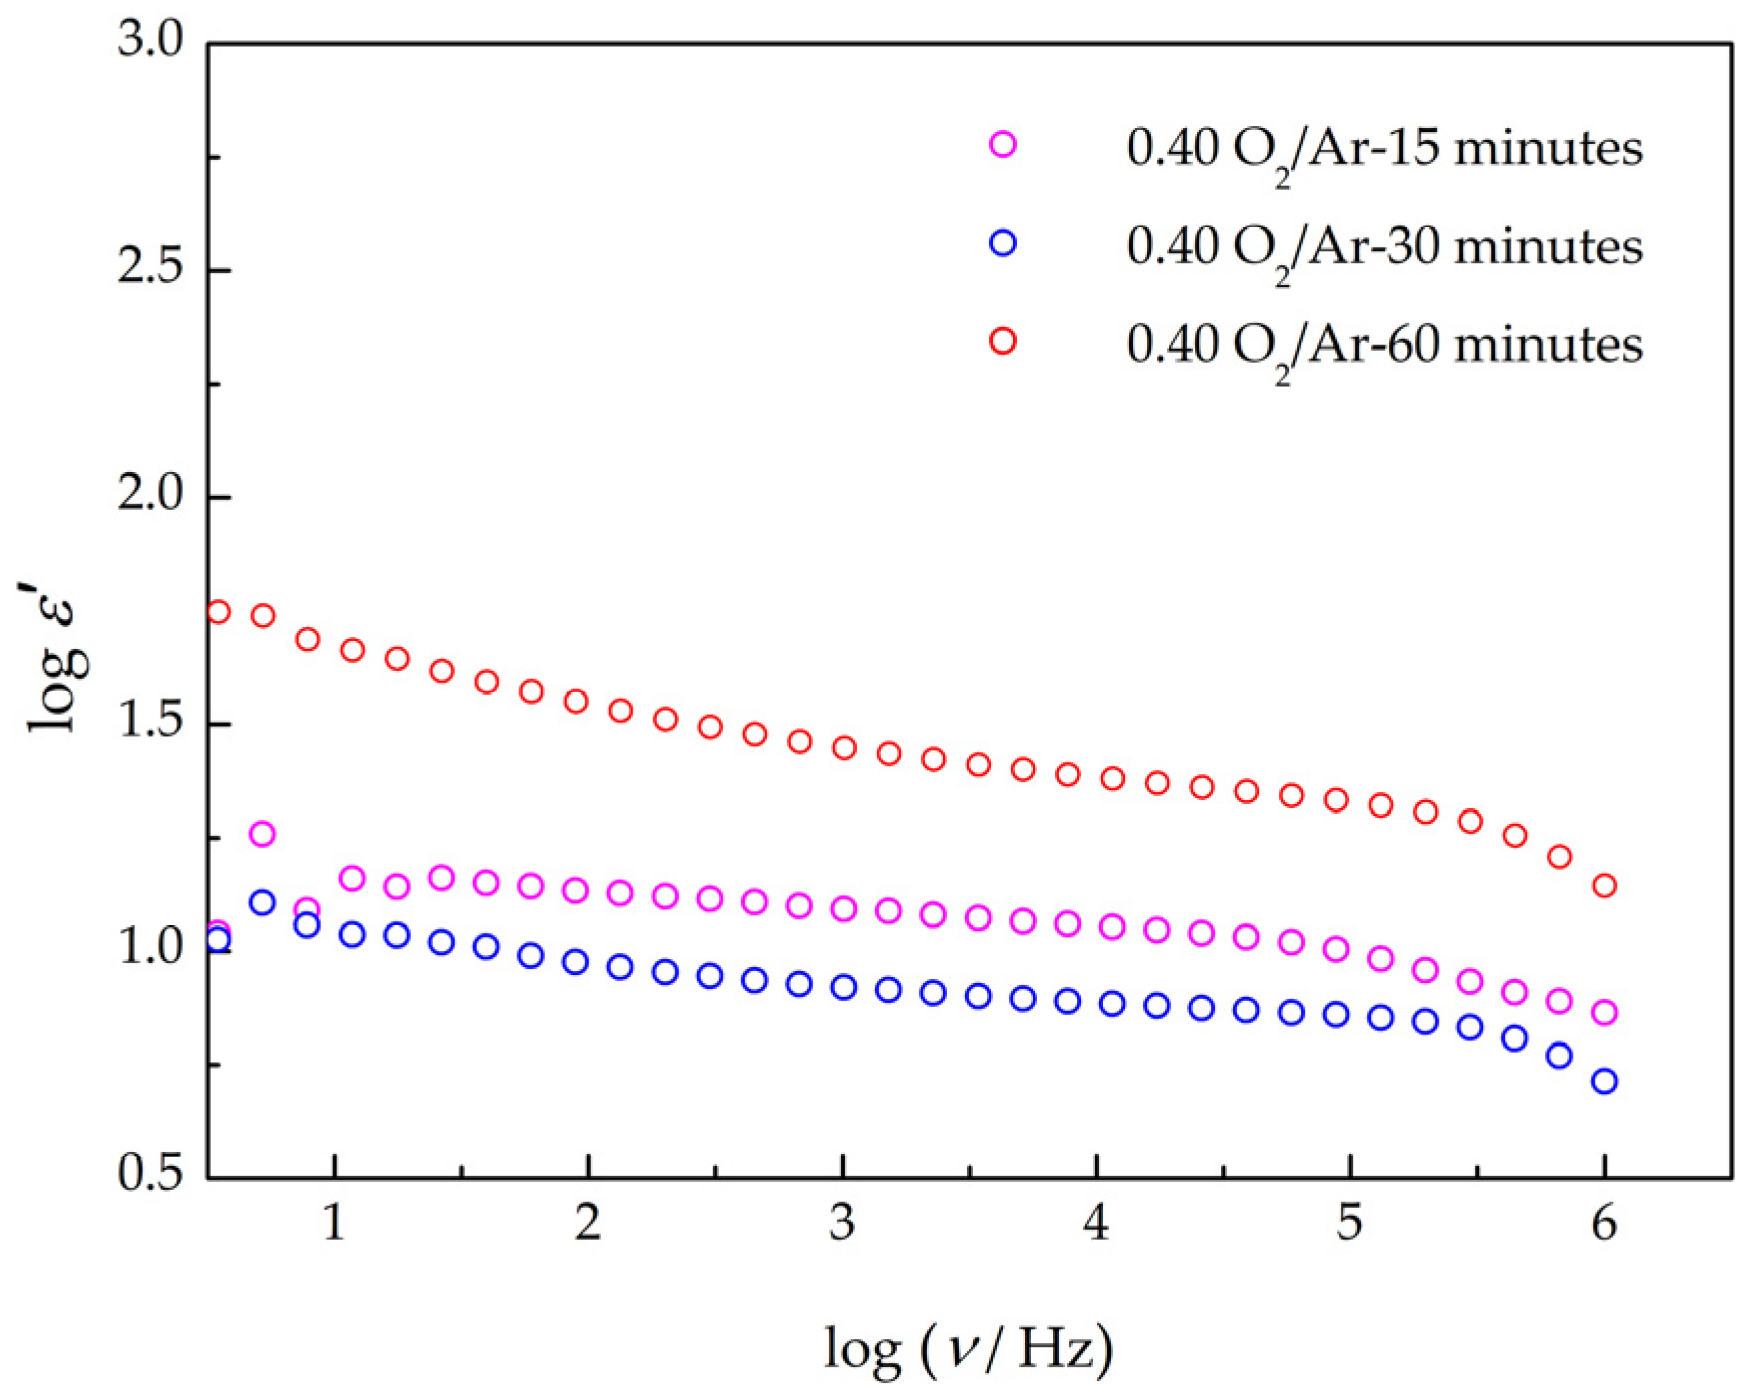
Figure 15 presents the dielectric constant (ε′) of transparent NbOx thin films grown on ITO-coated glass at an O2/Ar flow rate ratio of 0.40 for deposition times of 15, 30, and 60 min. While both samples exhibit similar profiles, the thicker films (60 min deposition) display higher ε′ values across the frequency range (1 Hz to 106 Hz), reaching a maximum of approximately 28 at 1 kHz.
Variations in the dielectric constant as a function of frequency suggest structural differences among the NbOx thin films with varying deposition times, consistent with RBS findings. The obtained dielectric constant values agree with those reported in previous studies [149,150].

3.4. Electrochromic Characterization

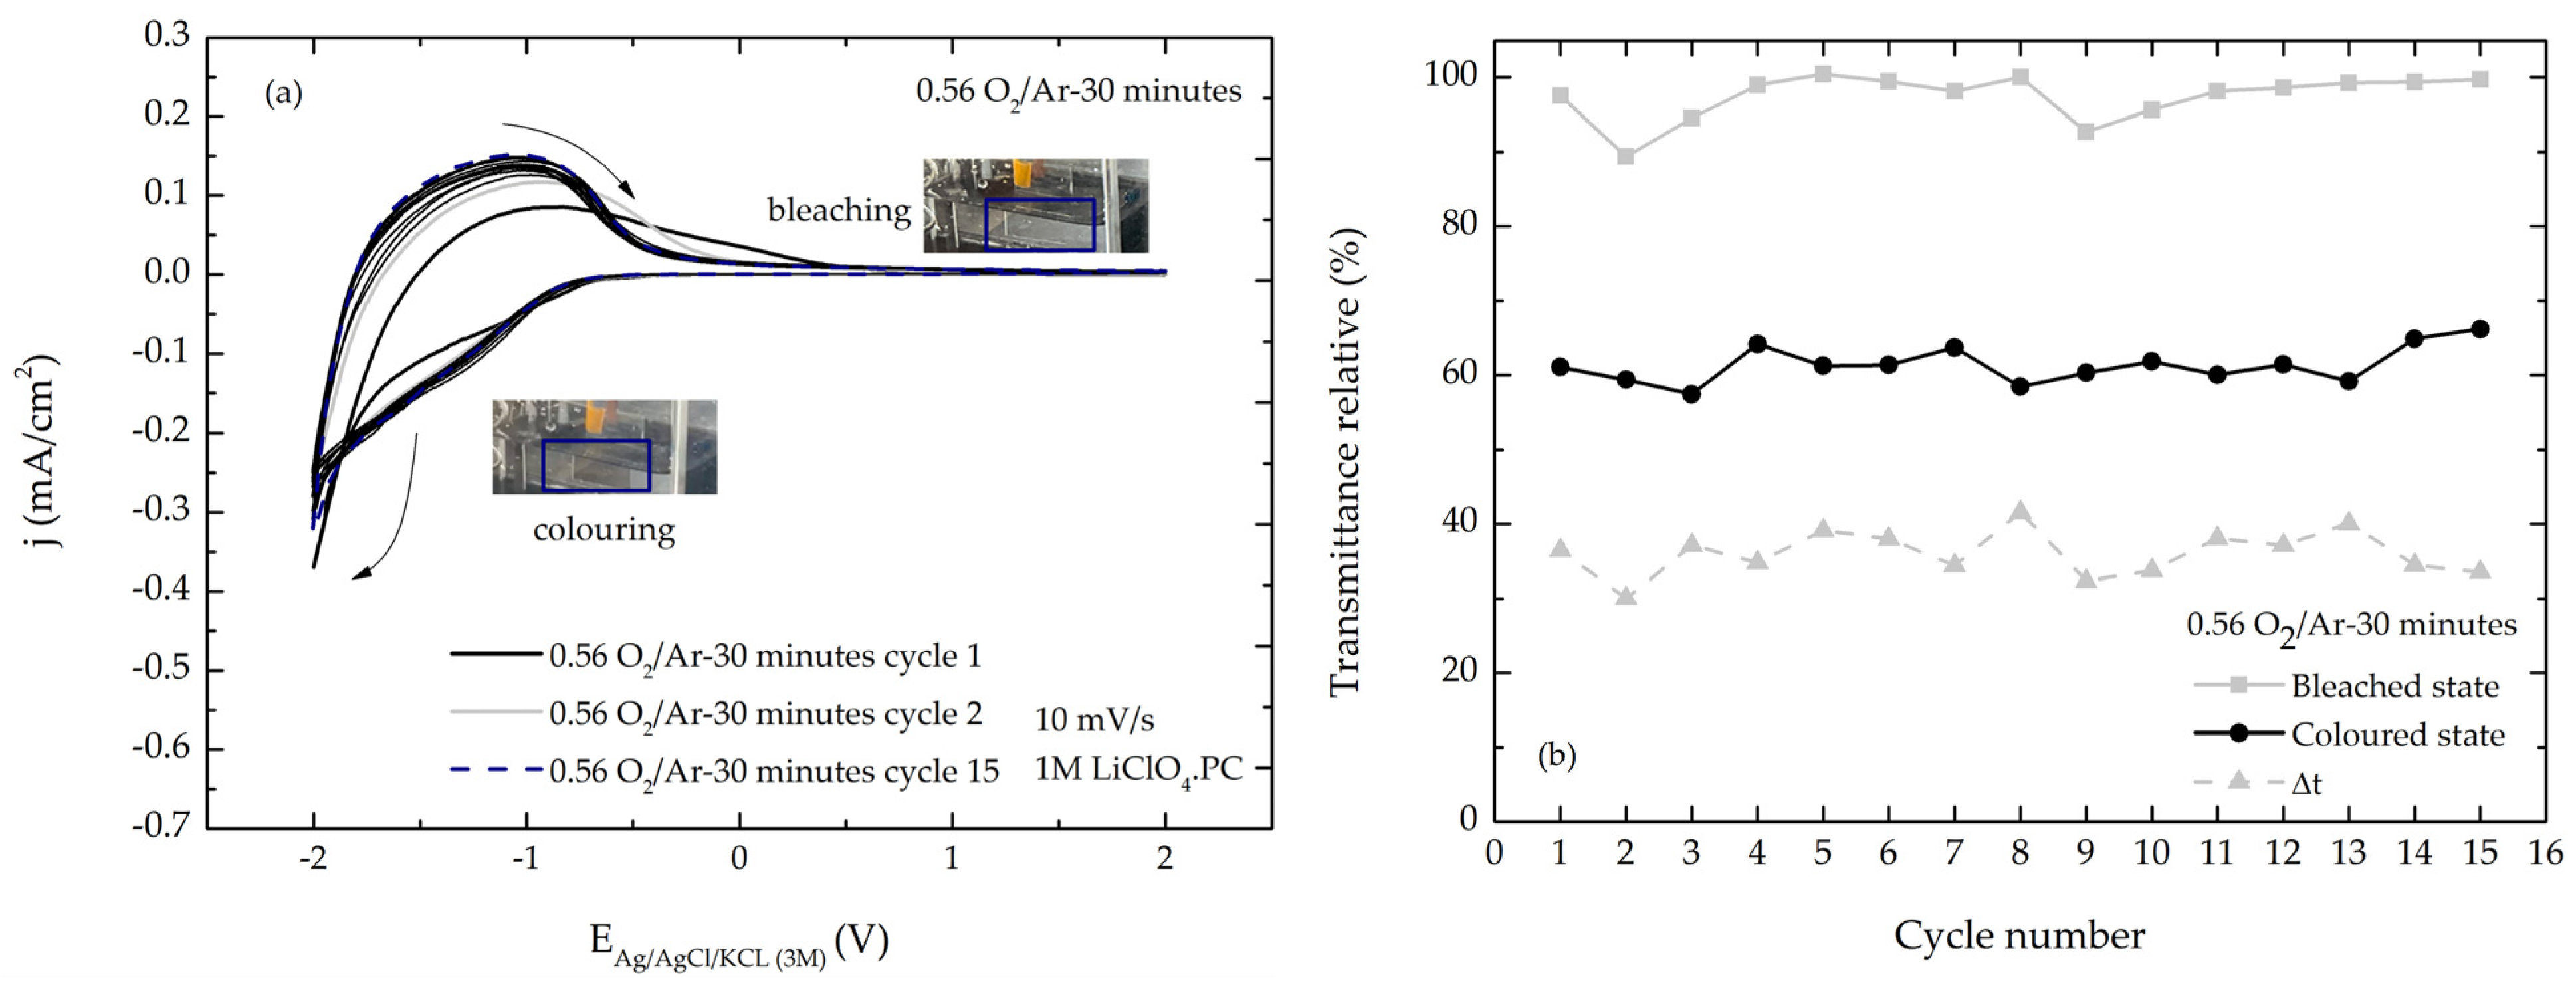
A critical aspect of electrochromic materials is their capacity to maintain structural integrity and performance over repeated cycles. The NbOx thin films deposited on ITO-coated PET substrates demonstrated excellent reversibility and cyclability when subjected to 15 cycles in a lithium perchlorate-propylene carbonate electrolyte at a scan rate of 10 mVs−1 between −2.0 V and 2.0 V (Figure 16, Figure 17, Figure 18 and Figure 19). This consistent behavior indicates robust stability.
Upon cycling, the transparent NbOx films exhibited reversible and consistent color changes from transparent to brown, characteristic of electrochromic behavior. Nb2O5 thin films, containing Nb5+ sites, are typically colorless. The intercalation of charges during the redox process reduces Nb5+ to lower valence states, such as Nb4+, resulting in film darkening. Subsequent de-intercalation re-oxidizes the film to its original colorless Nb2O5 state. This coloration and bleaching process is attributed to the following electrochemical redox reaction [31,33,38]:
N b 2 O 5 c o l o u r l e s s + x L i + + x e L i x N b 2 O 5 ( d a r k )
In Equation (2), the insertion coefficient, x, represents the fraction of Li+ ion sites within the Nb2O5 lattice that can be occupied. Typically, nearly fully lithiated crystalline niobium oxides and their various phases exhibit a blue coloration, while amorphous niobium oxides tend towards brown [151,152]. The observed brown coloration of the amorphous NbOx thin films in this study, consistent with XRD and Raman results, is attributed to the reduction reaction.
Figure 16a, Figure 17a, Figure 18a and Figure 19a present cyclic voltammetry (CV) curves for NbOx films grown on ITO-coated PET substrates with varying O2/Ar flow rates (0.40 to 0.56) and deposition times (15 and 30 min). Upon cathodic sweeping, the NbOx thin films exhibited a progressive intensification of brown coloration. Conversely, anodic sweeping resulted in bleaching and a return to a colorless state.
Figure 16b, Figure 17b, Figure 18b and Figure 19b illustrate the evolution of relative transmittance for the investigated NbOx thin films. During the cathodic sweep, the current density increased, reaching a negative maximum at −2.0 V vs. Ag/AgCl/KCl (3M), accompanied by the development of a brown coloration. This coloration arises from the intercalation of electrons and Li+ ions into the NbOx film, reducing Nb5+ to lower valence states such as Nb4+.
Upon reversing the potential sweep to anodic conditions (from −2.0 to 2.0 V vs. Ag/AgCl/KCl (3M)), the current density transitioned from negative to positive, peaking at approximately 1.0 V before decreasing as the film bleached. This bleaching process corresponds to Li+ de-intercalation from the film structure.
The cyclic voltammograms (Figure 16a, Figure 17a, Figure 18a and Figure 19a) exhibit a broad peak during the anodic scan and a characteristic “spike” at −2.0 V vs. Ag/AgCl/KCl (3M) during the cathodic scan, consistent with previous studies [33,62].
The diffusion coefficient of lithium ions during the intercalation and deintercalation process into the NbOx host lattice was obtained by the Randles–Sevick equation [36]:
J p = 2.72 × 10 5 n 3 / 2 D 1 / 2 C v 1 / 2
where J p represents the peak current density (A/cm2), n is the number of electrons involved in the redox process (assumed to be 1), D signifies the diffusion coefficient of ions (anodic i p a and cathodic i p c ) (cm2/s), C represents the concentration of active ions in the electrolyte solution (mol/cm3), and ν is the scan rate (V/s). Lithium ion diffusion coefficients determined for both intercalation and de-intercalation processes indicate potential lithium ion trapping within the NbOx structure. This phenomenon may be associated with surface roughness and film morphology.
The correlation between intercalated/de-intercalated charge and color reversibility was found to be more pronounced in NbOx films with lower O2/Ar flow rates (0.40).
Coloration efficiency, defined as the change in optical density per unit charge injected per unit electrode area, is another critical electrochromic parameter. The equation for coloration efficiency is
η λ = O D Q A
In Equation (4), ΔOD represents the change in optical density, Q is the intercalated charge, and A is the electrode area. The maximum coloration efficiency achieved in this study was 30 cm2/C for NbOx films grown at an O2/Ar flow rate ratio of 0.40 for 15 min (Table 6). This work presents the first reported electrochromic parameters for NbOx thin films deposited on ITO-coated PET substrates. Table 7 provides a comparison of electrochromic performance values for Nb2O5 thin films grown on glass substrates reported in the literature.

3.5. Mechanical Characterization

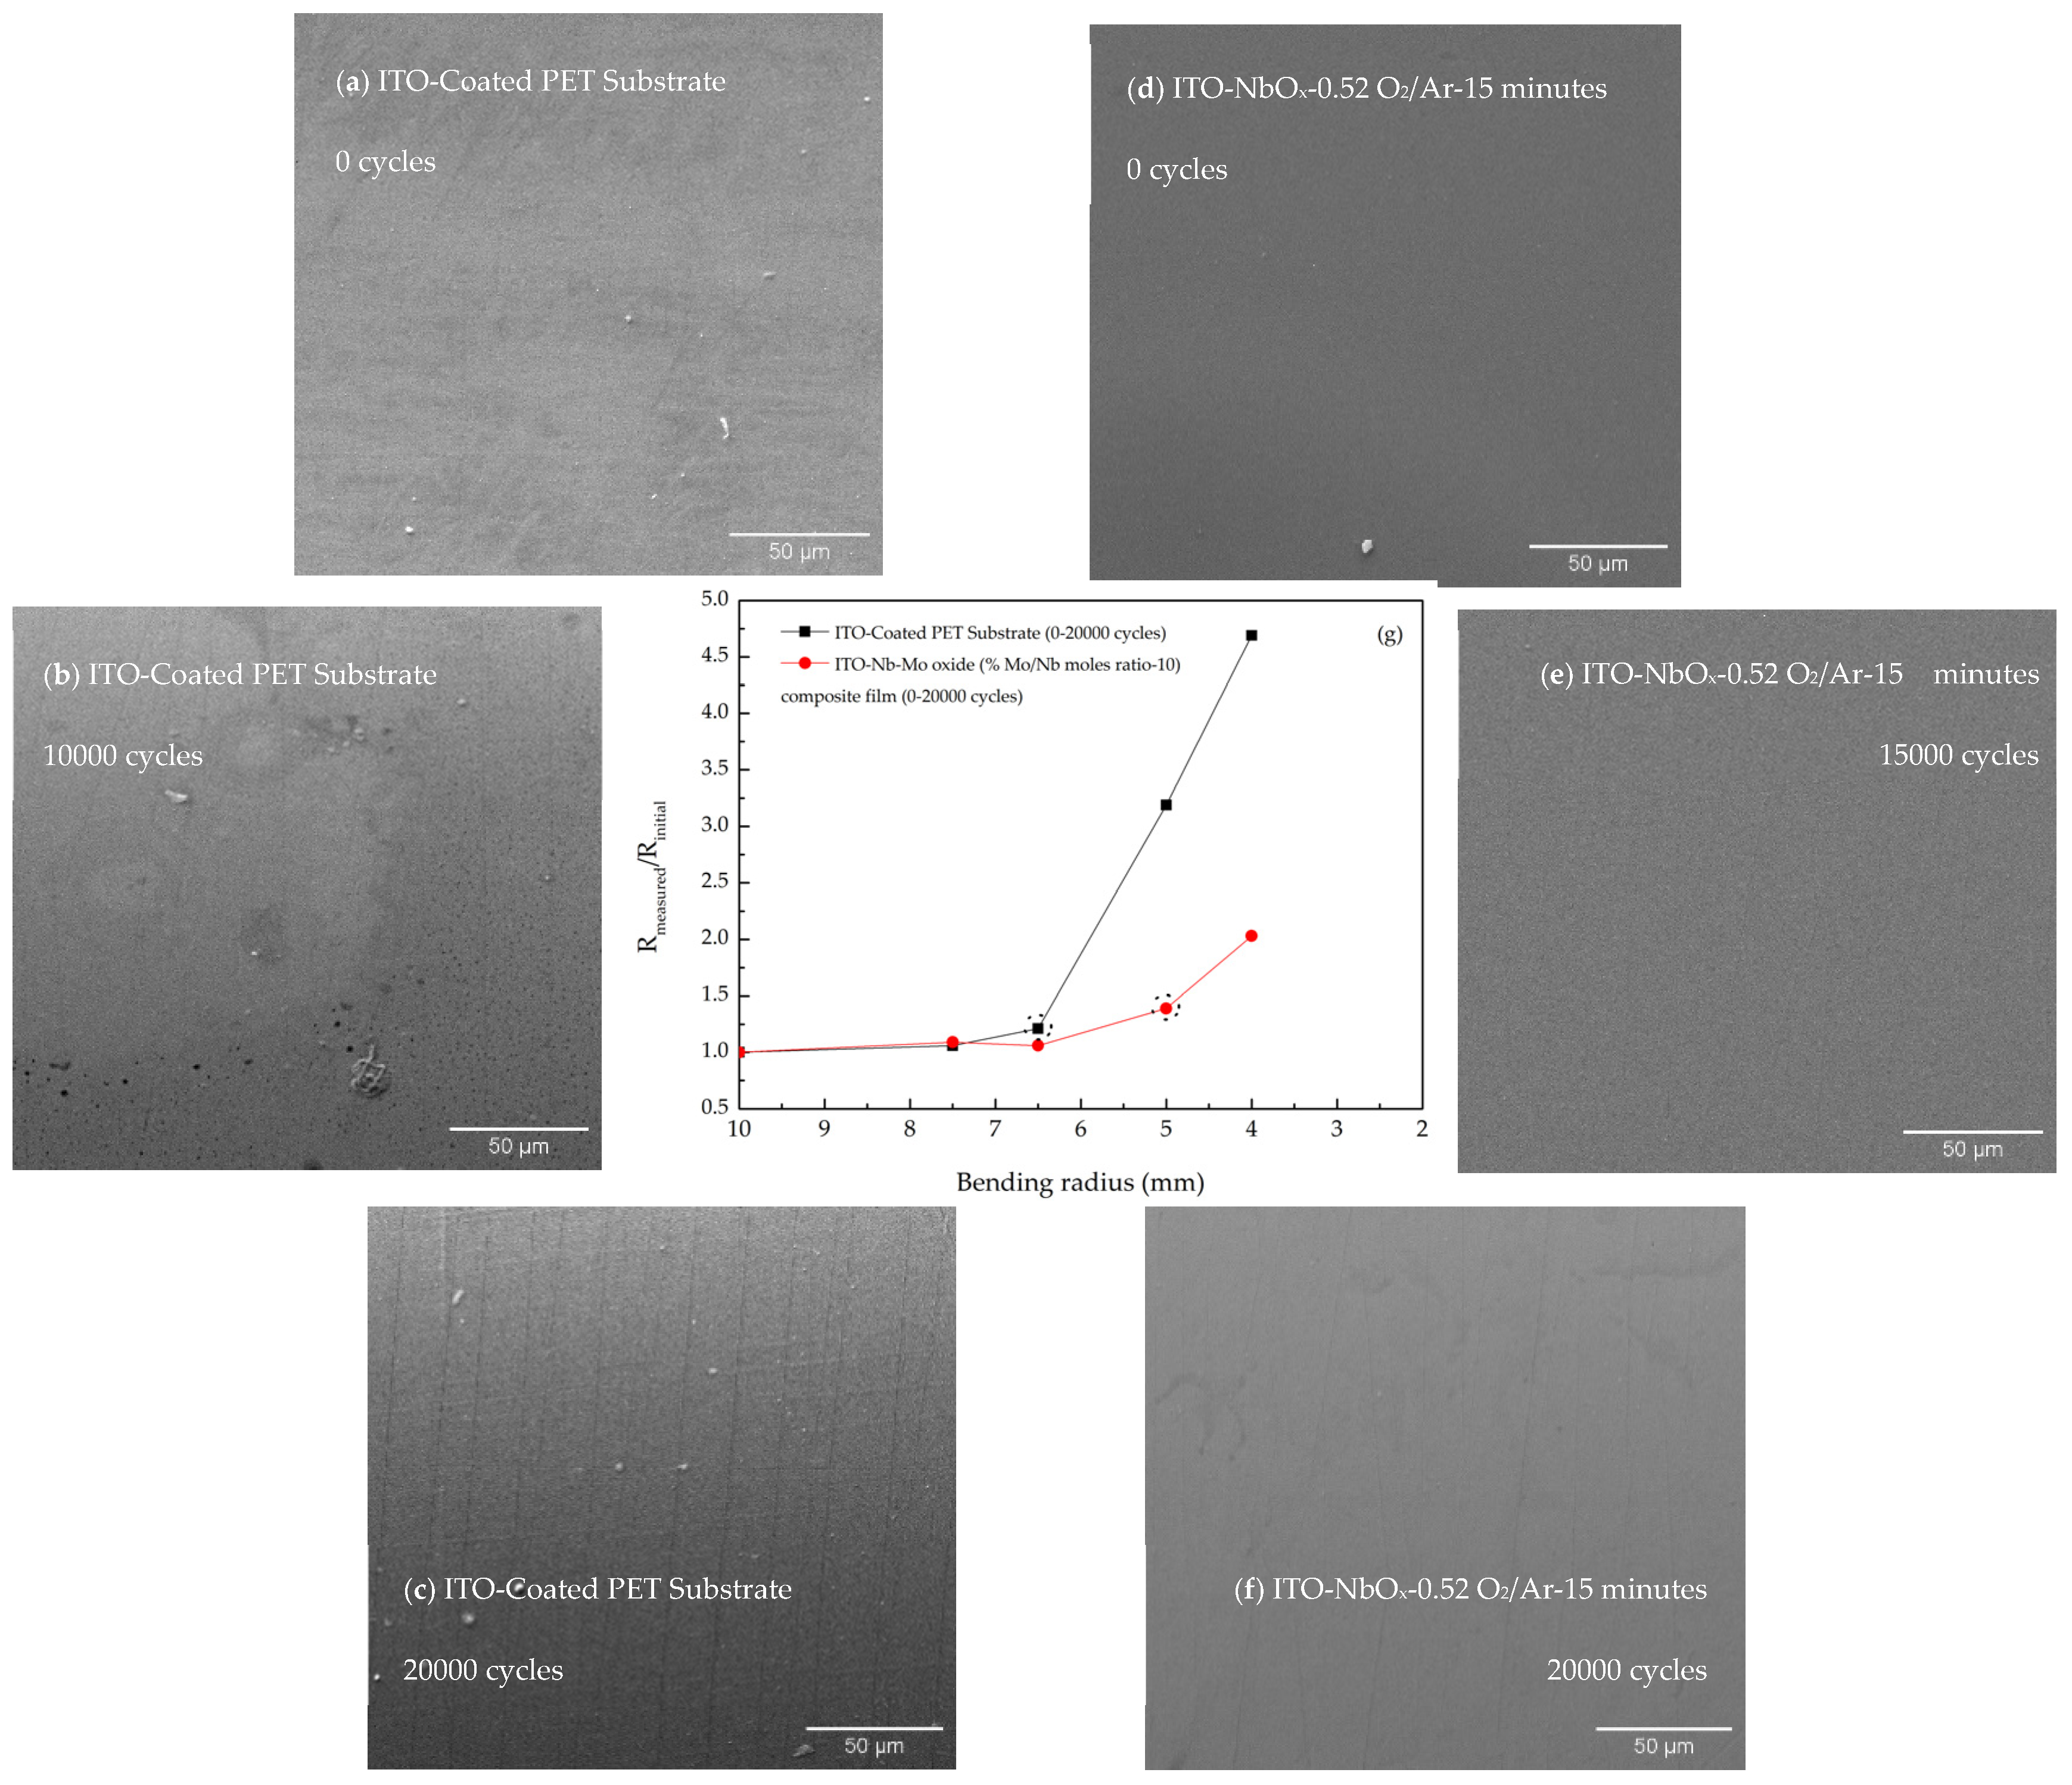
The mechanical integrity of flexible devices is paramount, particularly under bending conditions. Bending tests conducted on ITO-coated polyethylene terephthalate (PET) substrates and transparent niobium oxide (NbOx) thin films revealed a critical bending radius of 6.5 mm for the former and 5 mm for the ITO-NbOx composite, beyond which the number and length of cracks increased significantly (Figure 20a–f).
Post critical bending, the ITO-coated PET substrate demonstrated a rapid exponential increase in electrical resistance, whereas the ITO-NbOx composite exhibited a more gradual rise. These findings suggest that the NbOx layer mitigates the rapid mechanical degradation of the underlying ITO electrode.

4. Conclusions

NbOx thin films with thicknesses ranging from 51 to 198 nm were successfully deposited on rigid and flexible substrates via DC reactive sputtering. XRD analysis indicated a structural transition from crystalline Nb to amorphous NbOx at an O2/Ar flow rate ratio of 0.32. XPS revealed a corresponding evolution in chemical composition, with an increase in oxidation state from Nb⁰ to Nb5+ as the flow rate ratio of O2/Ar ratio increased. RBS measurements demonstrated a decrease in the Nb/O ratio with rising O2/Ar flow and an increase in the Nb/O ratio with longer deposition times.
These transparent and flexible films exhibited a maximum optical transmittance of 83% in the visible range and a bandgap energy of 4.07 eV. Dielectric studies revealed a maximum dielectric constant (ε′) of 28 at 300 K and 1 kHz for films grown at an O2/Ar flow rate ratio of 0.40 for 60 min.
Electrochromic measurements on NbOx films deposited on ITO-coated PET substrates demonstrated a maximum coloration efficiency of 30 cm2/C and a reversibility of 96%. In situ electrical resistance measurements revealed an increase in resistance for ITO-coated PET substrates subjected to bending.

Author Contributions

Conceptualization, R.S. and M.G.; Methodology, A.M., A.B. (Alexandre Bastos), L.P. (Luiz Pereira), S.K.J., J.B., M.P., K.L., A.B. (Arijeta Bafti), L.P. (Luka Pavić) and M.G.; Validation, M.G. and R.S.; Formal analysis, A.M., A.B. (Alexandre Bastos), L.P. (Luiz Pereira), S.K.J., J.B., F.V., M.P., K.L., A.B. (Arijeta Bafti) and L.P. (Luka Pavić); Investigation, A.M., J.B., F.V. and M.G.; Data curation, A.M., A.B. (Alexandre Bastos), L.P. (Luiz Pereira), S.K.J., J.B., F.V., M.P., K.L., A.B. (Arijeta Bafti), L.P. (Luka Pavić) and M.G; Writing—original draft preparation, A.M.; Writing—review and editing, A.B. (Alexandre Bastos), L.P. (Luiz Pereira), S.K.J., J.B., F.V., M.P., K.L., R.S. and M.G.; Visualization, M.G., Supervision, M.G.; Project administration, R.S. and M.G.; Funding acquisition, R.S. and M.G. All authors have read and agreed to the published version of the manuscript.

Funding

This research received no external fundings.

Institutional Review Board Statement

Not applicable.

Informed Consent Statement

Not applicable.

Data Availability Statement

Data are contained within the article.

Acknowledgments

The authors are grateful to the LAS laboratory at CEMUP for the XPS measurements. They also acknowledge the support from CICECO-Aveiro Institute of Materials (UIDB/50011/2020 (DOI 10.54499/UIDB/50011/2020), UIDP/50011/2020 (DOI 10.54499/UIDP/50011/2020), and LA/P/0006/2020 (DOI 10.54499/LA/P/0006/2020), via FCT/MCTES (PIDDAC)), and i3N (UIDB/50025/2020, UIDP/50025/2020, and LA/P/0037/2020 projects, as well as LISBOA-01-0247-FEDER-039985/POCI-01-0247-FEDER-039985 projects).

Conflicts of Interest

The authors declare no conflict of interest.

References

  1. Norman, N. Metallic oxide phases of niobium and tantalum. J. Less Common Met. 1962, 4, 52–61. [Google Scholar] [CrossRef]
  2. Andersson, S.; Wadsley, A.D. Crystallographic shear and diffusion paths in certain higher oxides of niobium, tungsten, molybdenum and titanium. Nature 1966, 211, 581–583. [Google Scholar] [CrossRef]
  3. Kimura, S. Phase Equilibria in the System NbO2-Nb2O5: Phase Relations at 1300 and 1400 °C and Related Thermodynamic Treatment. J. Solid State Chem. 1973, 6, 438–449. [Google Scholar] [CrossRef]
  4. Gatehouse, B.M.; Wadsley, A.D. The Crystal Structure of the High Temperature form of Niobium Pentoxide. Acta Cryst. 1964, 17, 1545. [Google Scholar] [CrossRef]
  5. Lindau, I.; Spicer, W.E. Oxidation of Nb as studied by the uv-photoemission technique. J. Appl. Phys. 1974, 45, 3720–3725. [Google Scholar] [CrossRef]
  6. Ramakrishna, S.; Le Viet, A.; Reddy, M.V.; Jose, R.; Chowdari, B.V.R. Nanostructured Nb2O5 polymorphs by electrospinning for rechargeable lithium batteries. J. Phys. Chem. C 2010, 114, 664–671. [Google Scholar] [CrossRef]
  7. Nico, C.; Monteiro, T.; Graça, M.P.F. Niobium oxides and niobates physical properties: Review and prospects. Prog. Mater. Sci. 2016, 80, 1–37. [Google Scholar] [CrossRef]
  8. Hulm, J.K.; Jones, C.K.; Hein, R.A.; Gibson, J.W. Superconductivity in the TiO and NbO Systems. J. Low Temp. Phys. 1972, 7, 291–307. [Google Scholar] [CrossRef]
  9. Lide, D.R. CRC Handbook of Chemistry and Physics, 96th ed.; CRC Press: Boca Raton, FL, USA, 2016. [Google Scholar]
  10. Adler, D. Mechanisms for Metal-Nonmetal Transitions in Transition-Metal Oxides and Sulfifes. Rev. Mod. Phys. 1968, 40, 714–736. [Google Scholar] [CrossRef]
  11. Bach, D. EELS Investigations of Stoichiometric Niobium Oxides and Niobium-Based Capacitors; Karlsruher Institut für Technologie: Karlsruhe, Germany, 2009. [Google Scholar] [CrossRef]
  12. Mozalev, A.; Vázquez, R.M.; Bittencourt, C.; Cossement, D.; Gispert-Guirado, F.; Llobet, E.; Habazaki, H. Formation-structure-properties of niobium-oxide nanocolumn arrays via self-organized anodization of sputter-deposited aluminum-on-niobium layers. J. Mater. Chem. C Mater. 2014, 2, 4847–4860. [Google Scholar] [CrossRef]
  13. Venkataraj, S.; Drese, R.; Liesch, C.; Kappertz, O.; Jayavel, R.; Wuttig, M. Temperature stability of sputtered niobium-oxide films. J. Appl. Phys. 2002, 91, 4863–4871. [Google Scholar] [CrossRef]
  14. Macek, B.O.M. Electrochromism of sol-gel derived niobium oxide films. Sol. Energy Mater. Sol. Cells 1998, 54, 121–130. [Google Scholar] [CrossRef]
  15. Wang, B.; Zhao, Y.; Banis, M.N.; Sun, Q.; Adair, K.R.; Li, R.; Sham, T.K.; Sun, X. Atomic Layer Deposition of Lithium Niobium Oxides as Potential Solid-State Electrolytes for Lithium-Ion Batteries. ACS Appl. Mater. Interfaces 2018, 10, 1654–1661. [Google Scholar] [CrossRef] [PubMed]
  16. Yi, T.F.; Sari, H.M.K.; Li, X.; Wang, F.; Zhu, Y.R.; Hu, J.; Zhang, J.; Li, X. A review of niobium oxides based nanocomposites for lithium-ion batteries, sodium-ion batteries and supercapacitors. Nano Energy 2021, 85, 105955. [Google Scholar] [CrossRef]
  17. Yuan, T.; Soule, L.; Zhao, B.; Zou, J.; Yang, J.; Liu, M.; Zheng, S. Recent Advances in Titanium Niobium Oxide Anodes for High-Power Lithium-Ion Batteries. Energy Fuels 2020, 34, 13321–13334. [Google Scholar] [CrossRef]
  18. Lira-Cantu, M.; Krebs, F.C. Hybrid solar cells based on MEH-PPV and thin film semiconductor oxides (TiO2, Nb2O5, ZnO, CeO2 and CeO2-TiO2): Performance improvement during long-time irradiation. Sol. Energy Mater. Sol. Cells 2006, 90, 2076–2086. [Google Scholar] [CrossRef]
  19. Ok, M.R.; Ghosh, R.; Brennaman, M.K.; Lopez, R.; Meyer, T.J.; Samulski, E.T. Surface patterning of mesoporous niobium oxide films for solar energy conversion. ACS Appl. Mater. Interfaces 2013, 5, 3469–3474. [Google Scholar] [CrossRef]
  20. Lira-Cantu, M.; Norrman, K.; Andreasen, J.W.; Krebs, F.C. Oxygen release and exchange in niobium oxide MEHPPV hybrid solar cells. Chem. Mater. 2006, 18, 5684–5690. [Google Scholar] [CrossRef]
  21. Lim, E.; Kim, H.; Jo, C.; Chun, J.; Ku, K.; Kim, S.; Lee, H.I.; Nam, I.S.; Yoon, S.; Kang, K.; et al. Advanced hybrid supercapacitor based on a mesoporous niobium pentoxide/carbon as high-performance anode. ACS Nano 2014, 8, 8968–8978. [Google Scholar] [CrossRef]
  22. Yu, X.; Marks, T.J.; Facchetti, A. Metal oxides for optoelectronic applications. Nat. Mater. 2016, 15, 383–396. [Google Scholar] [CrossRef]
  23. Onozato, T.; Katase, T.; Yamamoto, A.; Katayama, S.; Matsushima, K.; Itagaki, N.; Yoshida, H.; Ohta, H. Optoelectronic properties of valence-state-controlled amorphous niobium oxide. J. Phys. Condens. Matter 2016, 28, 255001. [Google Scholar] [CrossRef] [PubMed]
  24. Nowak, I.; Ziolek, M. Niobium Compounds: Preparation, Characterization, and Application in Heterogeneous Catalysis. Chem. Rev. 1999, 99, 3603–3624. [Google Scholar] [CrossRef]
  25. Ushikubo, T. Recent topics of research and development of catalysis by niobium and tantalum oxides. Catal. Today 2000, 57, 331–338. [Google Scholar] [CrossRef]
  26. Wachs, I.E.; Jehng, J.-M.; Deo, G.; Hu, H.; Arora, N. Redox properties of niobium oxide catalysts. Catal. Today 1996, 28, 199–205. [Google Scholar] [CrossRef]
  27. Gimon-Kinsel, M.E.; Balkus, K.J. Pulsed laser deposition of mesoporous niobium oxide thin films and application as chemical sensors. Microporous Mesoporous Mater. 1999, 28, 113–123. [Google Scholar] [CrossRef]
  28. Kurioka, N.; Watanabe, D.; Haneda, M.; Shimanouchi, T.; Mizushima, T.; Kakuta, N.; Ueno, A.; Hanaoka, T.; Sugi, Y. Preparation of Niobium Oxide Films as a Humidity Sensor. Catal. Today 1993, 16, 495–501. [Google Scholar] [CrossRef]
  29. Safavi, M.S.; Walsh, F.C.; Visai, L.; Khalil-Allafi, J. Progress in Niobium Oxide-Containing Coatings for Biomedical Applications: A Critical Review. ACS Omega 2022, 7, 9088–9107. [Google Scholar] [CrossRef]
  30. Olivares-Navarrete, R.; Olaya, J.J.; Ramírez, C.; Rodil, S.E. Biocompatibility of niobium coatings. Coatings 2011, 1, 72–87. [Google Scholar] [CrossRef]
  31. Mjejri, I.; Grocassan, R.; Rougier, A. Enhanced Coloration for Hybrid Niobium-Based Electrochromic Devices. ACS Appl. Energy Mater. 2018, 1, 4359–4366. [Google Scholar] [CrossRef]
  32. Reichman, B.; Bard, A.J. Electrochromism at Niobium Pentoxide Electrodes in Aqueous and Acetonitrile Solutions. J. Electrochem. Soc. 1980, 127, 241. [Google Scholar] [CrossRef]
  33. Yoshimura, K.; Miki, T.; Tanemura, S. Niobium Oxide Electrochromic Thin Films Prepared by Reactive DC Magnetron Sputtering. Jpn. J. Appl. Phys. 1995, 34, L1293. [Google Scholar] [CrossRef]
  34. Savinell, R.F.; Miki, T.; Tanemura, S. Electrochromic Properties of Niobium Oxide Thin Films Prepared by DC Magnetron Sputtering; John Wiley & Sons Inc.: Hoboken, NJ, USA, 1997. [Google Scholar]
  35. Orel, B. In Situ UV-Vis and Ex Situ IR spectroelectrochemical investigations of amorphous and crystalline electrochromic Nb2O5 films in charged/discharged states. J. Solid State Electrochem. 1998, 2, 221–236. [Google Scholar] [CrossRef]
  36. Marciel, A.; Graça, M.; Bastos, A.; Pereira, L.; Suresh Kumar, J.; Borges, J.; Vaz, F.; Peres, M.; Magalhães, S.; Lorenz, K.; et al. Molybdenum oxide thin films grown on flexible ito-coated pet substrates. Materials 2021, 14, 821. [Google Scholar] [CrossRef]
  37. Mortimer, R.J.; Rosseinsky, D.R.; Monk, P.M.S. Electrochromic Materials and Devices; Wiley-VCH: Weinheim, Germany, 2015. [Google Scholar]
  38. Granqvist, C.G. Handbook of Inorganic Electrochromic Materials, 1995th ed.; Elsevier: Amsterdam, The Netherlands, 1995. [Google Scholar]
  39. Zhao, Y.; Zhang, Z.; Lin, Y. Optical and dielectric properties of a nanostructured NbO2 thin film prepared by thermal oxidation. J. Phys. D Appl. Phys. 2004, 37, 3392–3395. [Google Scholar] [CrossRef]
  40. Lim, J.H.; Choi, J. Formation of niobium oxide nanowires by thermal oxidation. J. Ind. Eng. Chem. 2009, 15, 860–864. [Google Scholar] [CrossRef]
  41. Nico, C.; Rino, L.; Matos, M.; Monteiro, R.; Costa, F.M.; Monteiro, T.; Graça, M.P. NbO/Nb2O5 core-shells by thermal oxidation. J. Eur. Ceram Soc. 2013, 33, 3077–3083. [Google Scholar] [CrossRef]
  42. Murphy, N.R.; Moreno-Tarango, A.J.; Ramana, C.V.; Sun, L.; Jones, J.G.; Grant, J.T. Hybrid co-deposition of molybdenum doped niobium pentoxide (NbxMoyOz) thin films. J. Alloys Compd. 2016, 681, 350–358. [Google Scholar] [CrossRef]
  43. Foroughi-Abari, A.; Cadien, K.C. Growth, structure and properties of sputtered niobium oxide thin films. Thin Solid Films 2011, 519, 3068–3073. [Google Scholar] [CrossRef]
  44. Tanvir, M.T.; Aoki, Y.; Habazaki, H. Formation of porous niobium films by oblique angle deposition: Influence of substrate morphology. Thin Solid Films 2009, 517, 6711–6716. [Google Scholar] [CrossRef]
  45. Gao, H.; Wang, S.; Xu, D.; Wang, X.; Zhong, Q.; Zhong, Y.; Li, J.; Cao, W. Study of DC magnetron sputtered Nb films. Crystals 2022, 12, 31. [Google Scholar] [CrossRef]
  46. Lorenz, R.; O’Sullivan, M.; Fian, A.; Sprenger, D.; Lang, B.; Mitterer, C. Effects of bias pulse frequencies on reactively sputter deposited NbOx films. Thin Solid Films 2018, 660, 335–342. [Google Scholar] [CrossRef]
  47. Choi, S.; Kong, J.J.; Qin, Q.Z. Electrochemical and Electrochromic Properties of Niobium Oxide Thin Films Fabricated by Pulsed Laser Deposition. J. Electrochem. Soc. 1999, 146, 3914–3918. [Google Scholar]
  48. Grosse, V.; Pansow, C.; Steppke, A.; Schmidl, F.; Undisz, A.; Rettenmayr, M.; Grib, A.; Seidel, P. Pulsed laser deposition of niobium thin films for in-situ device fabrication and their superconducting properties. J. Phys. Conf. Ser. 2010, 234, 012015. [Google Scholar] [CrossRef]
  49. Fiz, R.; Appel, L.; Gutiérrez-Pardo, A.; Ramírez-Rico, J.; Mathur, S. Electrochemical Energy Storage Applications of CVD Grown Niobium Oxide Thin Films. ACS Appl. Mater. Interfaces 2016, 8, 21423–21430. [Google Scholar] [CrossRef]
  50. Maruyama, T.; Kanagawa, T. Electrochromic Properties of Niobium Oxide Thin Films Prepared by Chemical Vapor Deposition. J. Electrochem. Soc. 1994, 141, 2868–2871. [Google Scholar] [CrossRef]
  51. Dabirian, A.; Kuzminykh, Y.; Wagner, E.; Benvenuti, G.; Rushworth, S.; Hoffmann, P. Evaluation of niobium dimethylamino-ethoxide for chemical vapour deposition of niobium oxide thin films. Thin Solid Films 2014, 571, 94–101. [Google Scholar] [CrossRef]
  52. Kukli, K.; Ritala, M.; Leskelä, M.; Lappalainen, R. Niobium Oxide Thin Films Grown by Atomic Layer Epitaxy. Chem. Vap. Depos. 1998, 4, 29–34. [Google Scholar] [CrossRef]
  53. Lee, S.H.; Kwon, J.D.; Ahn, J.H.; Park, J.S. Compositional and electrical modulation of niobium oxide thin films deposited by plasma-enhanced atomic layer deposition. Ceram. Int. 2017, 43, 6580–6584. [Google Scholar] [CrossRef]
  54. Basuvalingam, S.B.; Macco, B.; Knoops, H.C.M.; Melskens, J.; Kessels, W.M.; Bol, A.A. Comparison of thermal and plasma-enhanced atomic layer deposition of niobium oxide thin films. J. Vac. Sci. Technol. A Vac. Surf. Films 2018, 36, 041503. [Google Scholar] [CrossRef]
  55. Aribia, A.; Sastre, J.; Chen, X.; Gilshtein, E.; Futscher, M.H.; Tiwari, A.N.; Romanyuk, Y.E. In Situ Lithiated ALD Niobium Oxide for Improved Long Term Cycling of Layered Oxide Cathodes: A Thin-Film Model Study. J. Electrochem. Soc. 2021, 168, 040513. [Google Scholar] [CrossRef]
  56. Leet, G.R.; Crayston, J.A. Studies on the electrochemical deposition of niobium oxide. J. Mater. Chem. 1996, 6, 187–192. [Google Scholar]
  57. Fomanyuk, S.S.; Krasnov, Y.S.; Kolbasov, G.Y.; Zaichenko, V.N. Electrochemical deposition of electrochromic niobium oxide films from an acidic solution of niobium peroxo complexes. Russ. J. Appl. Chem. 2013, 86, 644–647. [Google Scholar] [CrossRef]
  58. Mujawar, S.H.; Inamdar, A.I.; Patil, S.B.; Patil, P.S. Electrochromic properties of spray-deposited niobium oxide thin films. Solid State Ion. 2006, 177, 3333–3338. [Google Scholar] [CrossRef]
  59. Mujawar, S.H.; Inamdar, A.I.; Betty, C.A.; Ganesan, V.; Patil, P.S. Effect of post annealing treatment on electrochromic properties of spray deposited niobium oxide thin films. Electrochim. Acta 2007, 52, 4899–4906. [Google Scholar] [CrossRef]
  60. Romero, R.; Dalchiele, E.A.; Martín, F.; Leinen, D.; Ramos-Barrado, J.R. Electrochromic behaviour of Nb2O5 thin films with different morphologies obtained by spray pyrolysis. Sol. Energy Mater. Sol. Cells 2009, 93, 222–229. [Google Scholar] [CrossRef]
  61. Özer, N.; Chen, D.G.; Lampert, C.M. Preparation and properties of spin-coated Nb2O5 films by the sol-gel process for electrochromic applications. Thin Solid Films 1996, 277, 162–168. [Google Scholar] [CrossRef]
  62. Schmitt, M.; Heusing, S.; Aegerter, M.A.; Pawlicka, A.; Avellaneda, C. Electrochromic properties of Nb2O5 sol-gel coatings. Sol. Energy Mater. Sol. Cells 1998, 54, 9–17. [Google Scholar] [CrossRef]
  63. Özer, N.; Rubin, M.D.; Lampert, C.M. Optical and electrochemical characteristics of niobium oxide films prepared by sol-gel process and magnetron sputtering: A comparison. Sol. Energy Mater. Sol. Cells 1996, 40, 285–296. [Google Scholar] [CrossRef]
  64. Andoni, I.; Ziegler, J.M.; Jha, G.; Gadre, C.A.; Flores-Zuleta, H.; Dai, S.; Qiao, S.; Xu, M.; Chen, V.T.; Pan, X.; et al. Investigating the Degradation of Nb2O5 Thin Films across 10,000 Lithiation/Delithiation Cycles. ACS Appl. Energy Mater. 2021, 4, 6542–6552. [Google Scholar] [CrossRef]
  65. Granqvist, C.G. Recent progress in thermochromics and electrochromics: A brief survey. Thin Solid Films 2016, 614, 90–96. [Google Scholar] [CrossRef]
  66. Guo, J.; Liang, Y.; Zhang, S.; Ma, D.; Yang, T.; Zhang, W.; Li, H.; Cao, S.; Zou, B. Recent progress in improving strategies of metal oxide-based electrochromic smart window. Green Energy Resour. 2023, 1, 100007. [Google Scholar] [CrossRef]
  67. Rai, V.; Singh, R.S.; Blackwood, D.J.; Zhili, D. A Review on Recent Advances in Electrochromic Devices: A Material Approach. Adv. Eng. Mater. 2020, 22, 2000082. [Google Scholar] [CrossRef]
  68. Granqvist, C.G.; Arvizu, M.A.; Pehlivan, I.B.; Qu, H.Y.; Wen, R.T.; Niklasson, G.A. Electrochromic materials and devices for energy efficiency and human comfort in buildings: A critical review. Electrochim. Acta 2017, 259, 1170–1182. [Google Scholar] [CrossRef]
  69. Livage, J.; Ganguli, D. Sol-gel electrochromic coatings and devices: A review. Sol. Energy Mater. Sol. Cells 2001, 68, 365–381. [Google Scholar] [CrossRef]
  70. Granqvist, C. Electrochromic Materials Out of a niche. Nat. Mater. 2006, 5, 89–90. [Google Scholar] [CrossRef]
  71. Granqvist, C.G. Transparent Conductive Electrodes for Electrochromic Devices: A Review. Appl. Phys. A 1993, 57, 19–24. [Google Scholar] [CrossRef]
  72. Cai, G.; Wang, J.; Lee, P.S. Next-Generation Multifunctional Electrochromic Devices. Acc. Chem. Res. 2016, 49, 1469–1476. [Google Scholar] [CrossRef]
  73. Khemasiri, N.; Klamchuen, A.; Jessadaluk, S.; Rattanawarinchai, P.; Borklom, P.; Rangkasikorn, A.; Rahong, S.; Saekung, C.; Horprathum, M.; Chananonnawathorn, C.; et al. Systematic investigations on morphological properties of aluminum-doped zinc oxide transparent electrode prepared from pulsed laser deposition and its electrochromic application. Vacuum 2023, 209, 111797. [Google Scholar] [CrossRef]
  74. Wang, M.; Liu, Q.; Dong, G.; He, Y.; Diao, X. Influence of thickness on the structure, electrical, optical and electrochromic properties of AZO thin films and their inorganic all-solid-state devices. Electrochim. Acta 2017, 258, 1336–1347. [Google Scholar] [CrossRef]
  75. Cai, G.; Darmawan, P.; Cui, M.; Wang, J.; Chen, J.; Magdassi, S.; Lee, P.S. Highly Stable Transparent Conductive Silver Grid/PEDOT:PSS Electrodes for Integrated Bifunctional Flexible Electrochromic Supercapacitors. Adv. Energy Mater. 2016, 6, 1501882. [Google Scholar] [CrossRef]
  76. Han, J.; Yang, J.; Gao, W.; Bai, H. Ice-Templated, Large-Area Silver Nanowire Pattern for Flexible Transparent Electrode. Adv. Funct. Mater. 2021, 31, 2010155. [Google Scholar] [CrossRef]
  77. Che, B.; Zhou, D.; Li, H.; He, C.; Liu, E.; Lu, X. A highly bendable transparent electrode for organic electrochromic devices. Org. Electron. 2019, 66, 86–93. [Google Scholar] [CrossRef]
  78. Shen, K.Y.; Hu, C.W.; Chang, L.C.; Ho, K.C. A complementary electrochromic device based on carbon nanotubes/conducting polymers. Sol. Energy Mater. Sol. Cells 2012, 98, 294–299. [Google Scholar] [CrossRef]
  79. Costalin, M.; Mjejri, I.; Penin, N.; Viraphong, O.; Shanov, V.; Rougier, A. Films of directionally oriented carbon nanotubes as counter electrodes for electrochromic devices. J. Phys. Chem. Solids 2021, 154, 110035. [Google Scholar] [CrossRef]
  80. Yanagi, K.; Moriya, R.; Yomogida, Y.; Takenobu, T.; Naitoh, Y.; Ishida, T.; Kataura, H.; Matsuda, K.; Maniwa, Y. Electrochromic carbon electrodes: Controllable visible color changes in metallic single-wall carbon nanotubes. Adv. Mater. 2011, 23, 2811–2814. [Google Scholar] [CrossRef]
  81. Choi, D.S.; Han, S.H.; Kim, H.; Kang, S.H.; Kim, Y.; Yang, C.M.; Kim, T.Y.; Yoon, D.H.; Yang, W.S. Flexible electrochromic films based on CVD-graphene electrodes. Nanotechnology 2014, 25, 395702. [Google Scholar] [CrossRef]
  82. Zhao, L.; Zhao, L.; Xu, Y.; Qiu, T.; Zhi, L.; Shi, G. Polyaniline electrochromic devices with transparent graphene electrodes. Electrochim. Acta 2009, 55, 491–497. [Google Scholar] [CrossRef]
  83. Lin, F.; Bult, J.B.; Nanayakkara, S.; Dillon, A.C.; Richards, R.M.; Blackburn, J.L.; Engtrakul, C. Graphene as an efficient interfacial layer for electrochromic devices. ACS Appl. Mater. Interfaces 2015, 7, 11330–11336. [Google Scholar] [CrossRef]
  84. Ghosh, D.S.; Chen, T.L.; Pruneri, V. High figure-of-merit ultrathin metal transparent electrodes incorporating a conductive grid. Appl. Phys. Lett. 2010, 96, 041109. [Google Scholar] [CrossRef]
  85. Schneider, J.; Rohner, P.; Thureja, D.; Schmid, M.; Galliker, P.; Poulikakos, D. Electrohydrodynamic NanoDrip Printing of High Aspect Ratio Metal Grid Transparent Electrodes. Adv. Funct. Mater. 2016, 26, 833–840. [Google Scholar] [CrossRef]
  86. Bueno, P.R.; Faira, R.C.; Bulhões, L.O.S. EQCM study during lithium insertion/deinsertion processes in Nb2O5 films prepared by the polymeric precursor method. Solid State Ion. 2005, 176, 1175–1180. [Google Scholar] [CrossRef]
  87. Granqvist, C.G. Electrochromic tungsten oxide films: Review of progress 1993–1998. Sol. Energy Mater. Sol. Cells 2000, 60, 201–262. [Google Scholar] [CrossRef]
  88. Granqvist, C.G.; Avendaño, E.; Azens, A. Electrochromic coatings and devices: Survey of some recent advances. Thin Solid Films 2003, 442, 201–211. [Google Scholar] [CrossRef]
  89. Dong, D.; Dhanabalan, S.S. Peter Francis Mathew Elango, Mingjie Yang, Sumeet Walia, Sharath Sriram, and Madhu Bhaskaran, “Emerging applications of metal-oxide thin films for flexible and stretchable electronic devices”. Appl. Phys. Rev. 2023, 10, 031314. [Google Scholar] [CrossRef]
  90. Kwak, J.Y.; Jung, Y.H.; Park, J.; Kang, Y.-C.; Kim, Y.I. Electrochromic Performance of NiOx Thin Film on Flexible PET/ITO Prepared by Nanocrystallite-Dispersion Sol. J. Korean Chem. Soc. 2021, 65, 125–132. [Google Scholar]
  91. Wang, H.; Barrett, M.; Duane, B.; Gu, J.; Zenhausern, F. Materials and processing of polymer-based electrochromic devices. Mater. Sci. Eng. B 2018, 228, 167–174. [Google Scholar] [CrossRef]
  92. Jensen, J.; Hösel, M.; Dyer, A.L.; Krebs, F.C. Development and manufacture of polymer-based electrochromic devices. Adv. Funct. Mater. 2015, 25, 2073–2090. [Google Scholar] [CrossRef]
  93. Yang, G.; Zhang, Y.M.; Cai, Y.; Yang, B.; Gu, C.; Zhang, S.X.A. Advances in nanomaterials for electrochromic devices. Chem. Soc. Rev. 2020, 49, 8687–8720. [Google Scholar] [CrossRef]
  94. Runnerstrom, E.L.; Llordés, A.; Lounis, S.D.; Milliron, D.J. Nanostructured electrochromic smart windows: Traditional materials and NIR-selective plasmonic nanocrystals. Chem. Commun. 2014, 50, 10555–10572. [Google Scholar] [CrossRef]
  95. Thakur, V.K.; Ding, G.; Ma, J.; Lee, P.S.; Lu, X. Hybrid materials and polymer electrolytes for electrochromic device applications. Adv. Mater. 2012, 24, 4071–4096. [Google Scholar] [CrossRef]
  96. Goodenough, J.B. Ceramic solid electrolytes. Solid State Ion. 1997, 94, 17–25. [Google Scholar] [CrossRef]
  97. Ito, Y.; Nohira, T. Non-Conventional Electrolytes for Electrochemical Applications. Electrochim. Acta 2000, 45, 2611–2622. [Google Scholar] [CrossRef]
  98. Galiński, M.; Lewandowski, A.; Stepniak, I. Ionic liquids as electrolytes. Electrochim. Acta 2006, 51, 5567–5580. [Google Scholar] [CrossRef]
  99. Zhou, D.; Zhou, R.; Chen, C.; Yee, W.A.; Kong, J.; Ding, G.; Lu, X. Non-volatile polymer electrolyte based on poly(propylene carbonate), Ionic liquid, and lithium perchlorate for electrochromic devices. J. Phys. Chem. B 2013, 117, 7783–7789. [Google Scholar] [CrossRef]
  100. Hallinan, D.T.; Balsara, N.P. Polymer electrolytes. Annu. Rev. Mater. Res. 2013, 43, 503–525. [Google Scholar] [CrossRef]
  101. Di Noto, V.; Lavina, S.; Giffin, G.A.; Negro, E.; Scrosati, B. Polymer electrolytes: Present, past and future. Electrochim. Acta 2011, 57, 4–13. [Google Scholar] [CrossRef]
  102. Ruan, Q.; Yao, M.; Yuan, D.; Dong, H.; Liu, J.; Yuan, X.; Fang, W.; Zhao, G.; Zhang, H. Ionic liquid crystal electrolytes: Fundamental, applications and prospects. Nano Energy 2023, 106, 108087. [Google Scholar] [CrossRef]
  103. Chai, S.; Xu, F.; Zhang, R.; Wang, X.; Zhai, L.; Li, X.; Qian, H.-J.; Wu, L.; Li, H. Hybrid Liquid-Crystalline Electrolytes with High-Temperature-Stable Channels for Anhydrous Proton Conduction. J. Am. Chem. Soc. 2021, 143, 21433–21442. [Google Scholar] [CrossRef]
  104. Eftekhari, A.; Kim, D.W. Sodium-ion batteries: New opportunities beyond energy storage by lithium. J. Power Sources 2018, 395, 336–348. [Google Scholar] [CrossRef]
  105. Fu, J.; Li, Z.; Zhou, X.; Guo, X. Ion transport in composite polymer electrolytes. Mater. Adv. 2022, 3, 3809–3819. [Google Scholar] [CrossRef]
  106. Huang, J.; Wu, K.; Xu, G.; Wu, M.; Dou, S.; Wu, C. Recent progress and strategic perspectives of inorganic solid electrolytes: Fundamentals, modifications, and applications in sodium metal batteries. Chem. Soc. Rev. 2023, 52, 4933–4995. [Google Scholar] [CrossRef]
  107. He, J.; You, L.; Tran, D.T.; Mei, J. Low-Temperature Thermally Annealed Niobium Oxide Thin Films as a Minimally Color Changing Ion Storage Layer in Solution-Processed Polymer Electrochromic Devices. ACS Appl. Mater. Interfaces 2019, 11, 4169–4177. [Google Scholar] [CrossRef]
  108. Li, X.; Wang, Z.; Chen, K.; Zemlyanov, D.Y.; You, L.; Mei, J. Stabilizing Hybrid Electrochromic Devices through Pairing Electrochromic Polymers with Minimally Color-Changing Ion-Storage Materials Having Closely Matched Electroactive Voltage Windows. ACS Appl. Mater. Interfaces 2021, 13, 5312–5318. [Google Scholar] [CrossRef]
  109. He, J.; Mukherjee, S.; Zhu, X.; You, L.; Boudouris, B.W.; Mei, J. Highly Transparent Crosslinkable Radical Copolymer Thin Film as the Ion Storage Layer in Organic Electrochromic Devices. ACS Appl. Mater. Interfaces 2018, 10, 18956–18963. [Google Scholar] [CrossRef]
  110. Wang, K.; Wu, H.; Meng, Y.; Zhang, Y.; Wei, Z. Integrated energy storage and electrochromic function in one flexible device: An energy storage smart window. Energy Env. Sci. 2012, 5, 8384–8389. [Google Scholar] [CrossRef]
  111. Nuroldayeva, G.; Balanay, M.P. Flexing the Spectrum: Advancements and Prospects of Flexible Electrochromic Materials. Polymers 2023, 15, 2924. [Google Scholar] [CrossRef]
  112. Hui, Z.; Zhang, L.; Ren, G.; Sun, G.; Yu, H.D.; Huang, W. Green Flexible Electronics: Natural Materials, Fabrication, and Applications. Adv. Mater. 2023, 35, 2211202. [Google Scholar] [CrossRef]
  113. Li, W.; Bai, T.; Fu, G.; Zhang, Q.; Liu, J.; Wang, H.; Sun, Y.; Yan, H. Progress and challenges in flexible electrochromic devices. Sol. Energy Mater. Sol. Cells 2022, 240, 111709. [Google Scholar] [CrossRef]
  114. Fang, H.; Zhao, Z.; Wu, W.; Wang, H. Progress in Flexible Electrochromic Devices. Wuji Cailiao Xuebao/J. Inorg. Mater. 2021, 36, 140–151. [Google Scholar] [CrossRef]
  115. Yun, T.G.; Park, M.; Kim, D.-H.; Kim, D.; Cheong, J.Y.; Bae, J.G.; Han, S.M.; Kim, I.-D. All-Transparent Stretchable Electrochromic Supercapacitor Wearable Patch Device. ACS Nano 2019, 13, 3141–3150. [Google Scholar] [CrossRef]
  116. Li, X.; Cai, K.; Gao, M.; Du, Y.; Shen, S. Recent advances in flexible thermoelectric films and devices. Nano Energy 2021, 89, 106309. [Google Scholar] [CrossRef]
  117. Nandihalli, N. Thermoelectric films and periodic structures and spin Seebeck effect systems: Facets of performance optimization. Mater. Today Energy 2022, 25, 100965. [Google Scholar] [CrossRef]
  118. Domingues, R.P.; Rodrigues, M.S.; Lopes, C.; Pedrosa, P.; Alves, E.; Barradas, N.P.; Borges, J.; Vaz, F. Thin films composed of metal nanoparticles (Au, Ag, Cu) dispersed in AlN: The influence of composition and thermal annealing on the structure and plasmonic response. Thin Solid Films 2019, 676, 12–25. [Google Scholar] [CrossRef]
  119. Barradas, N.P.; Jeynes, C.; Webb, R.P. Simulated annealing analysis of Rutherford backscattering data. Appl. Phys. Lett. 1997, 71, 291–293. [Google Scholar] [CrossRef]
  120. Barradas, N.P.; Jeynes, C. Advanced physics and algorithms in the IBA DataFurnace. Nucl. Instrum. Methods Phys. Res. B 2008, 266, 1875–1879. [Google Scholar] [CrossRef]
  121. Grego, S.; Lewis, J.; Vick, E.; Temple, D. Development and evaluation of bend-testing techniques for flexible-display applications. J. Soc. Inf. Disp. 2005, 13, 575. [Google Scholar] [CrossRef]
  122. Li, X.; Cao, W.H.; Tao, X.F.; Ren, L.L.; Zhou, L.Q.; Xu, G.F. Structural and nanomechanical characterization of niobium films deposited by DC magnetron sputtering. Appl. Phys. A. Mater. Sci. Process 2016, 122, 1–6. [Google Scholar] [CrossRef]
  123. Kumar, T.S.; Kumar, S.R.; Rao, M.L.; Prakash, T.L. Preparation of Niobium Metal Powder by Two-Stage Magnesium Vapor Reduction of Niobium Pentoxide. J. Metall. 2013, 2013, 629341. [Google Scholar] [CrossRef]
  124. Halbritter, J. On the Oxidation and on the Superconductivity of Niobium. Appl. Phys. A 1987, 43, 1–28. [Google Scholar] [CrossRef]
  125. Coşkun, Ö.D.; Demirel, S. The optical and structural properties of amorphous Nb2O5 thin films prepared by RF magnetron sputtering. Appl. Surf. Sci. 2013, 277, 35–39. [Google Scholar] [CrossRef]
  126. Lee, C.-C.; Tien, C.-L.; Hsu, J.-C. Internal stress and optical properties of Nb2O5 thin films deposited by ion-beam sputtering. Appl. Opt. 2002, 41, 2043–2047. [Google Scholar] [CrossRef]
  127. Ye, R.; Ohta, K.; Baba, M. Electrochemical Properties of Amorphous Nb2O5 Thin Film and Its Application to Rechargeable Thin Film Lithium Ion Batteries. ECS Trans. 2016, 73, 49–55. [Google Scholar] [CrossRef]
  128. Coşkun, Ö.D.; Demirel, S.; Atak, G. The effects of heat treatment on optical, structural, electrochromic and bonding properties of Nb2O5 thin films. J. Alloys Compd. 2015, 648, 994–1004. [Google Scholar] [CrossRef]
  129. Karulkar, P.C.; Nordman, J.E. STUDY OF THIN Nb OXIDE FILMS. J. Vac. Sci. Technol. 1979, 17, 462–465. [Google Scholar] [CrossRef]
  130. King, B.R.; Patel, H.C.; Gulino, D.A.; Tatarchuk, B.J. Kinetic measurements of oxygen dissolution into niobium substrates: In situ x-ray photoelectron spectroscopy studies. Thin Solid Films 1990, 192, 351–369. [Google Scholar] [CrossRef]
  131. Wagner, C.D.; Riggs, W.M.; Davis, L.E.; Moulder, J.F.; Muilenberg, G.E.; Spectroscopy, H.O.X.-R.P. Eden Prairie, 1979th ed.; Perkin-Elmer Corporation: Waltham, MA, USA, 1979. [Google Scholar]
  132. Bharti, D.C.; Rhee, S.W. Dielectric properties and X-ray photoelectron spectroscopic studies of niobium oxide thin films prepared by direct liquid injection chemical vapor deposition method. Thin Solid Films 2013, 548, 195–201. [Google Scholar] [CrossRef]
  133. Darlinski, A.; Halbritter, J. Angle-resolved XPS Studies of Oxides at NbN, NbC, and Nb Surfaces. Surf. Interface Anal. 1987, 10, 223–237. [Google Scholar] [CrossRef]
  134. McConnell, A.A. Raman spectra of niobium oxides. Spectrochim. Acts 1976, 32, 1067–1076. [Google Scholar] [CrossRef]
  135. Jehng, J.-M.; Wachs, I.E. Niobium Oxide Solution Chemistry. J. Raman Spectrosc. 1991, 22, 83–89. [Google Scholar] [CrossRef]
  136. Skrodczky, K.; Antunes, M.M.; Han, X.; Santangelo, S.; Scholz, G.; Valente, A.A.; Pinna, N.; Russo, P.A. Niobium pentoxide nanomaterials with distorted structures as efficient acid catalysts. Commun. Chem. 2019, 2, 129. [Google Scholar] [CrossRef]
  137. Graça, M.P.F.; Saraiva, M.; Freire, F.N.A.; Valente, M.A.; Costa, L.C. Electrical analysis of niobium oxide thin films. Thin Solid Films 2015, 585, 95–99. [Google Scholar] [CrossRef]
  138. Jehng, J.-M.; Wachs, I.E. Structural Chemistry and Raman Spectra of Niobium Oxides. Am. Chem. Soc. 1991, 3, 100–107. [Google Scholar] [CrossRef]
  139. Goncharov, A.F.; Struzhkin, V.V. Raman spectroscopy of metals, high-temperature superconductors and related materials under high pressure. J. Raman Spectrosc. 2003, 34, 532–548. [Google Scholar] [CrossRef]
  140. Usha, N.; Sivakumar, R.; Sanjeeviraja, C.; Arivanandhan, M. Niobium pentoxide (Nb2O5) thin films: Rf Power and substrate temperature induced changes in physical properties. Optik 2015, 126, 1945–1950. [Google Scholar] [CrossRef]
  141. Chen, K.N.; Hsu, C.M.; Liu, J.; Liou, Y.C.; Yang, C.F. Investigation of antireflection Nb2O5 thin films by the sputtering method under different deposition parameters. Micromachines 2016, 7, 151. [Google Scholar] [CrossRef]
  142. Al-Baradi, A.M.; El-Nahass, M.M.; Hassanien, A.M.; Atta, A.A.; Alqahtani, M.S.; Aldawsari, A.O. Influence of RF sputtering power on structural and optical properties of Nb2O5 thin films. Optik 2018, 168, 853–863. [Google Scholar] [CrossRef]
  143. Makuła, P.; Pacia, M.; Macyk, W. How To Correctly Determine the Band Gap Energy of Modified Semiconductor Photocatalysts Based on UV-Vis Spectra. J. Phys. Chem. Lett. 2018, 9, 6814–6817. [Google Scholar] [CrossRef]
  144. Lai, F.; Lin, L.; Huang, Z.; Gai, R.; Qu, Y. Effect of thickness on the structure, morphology and optical properties of sputter deposited Nb2O5 films. Appl. Surf. Sci. 2006, 253, 1801–1805. [Google Scholar] [CrossRef]
  145. Valdest, L.B. Resistivity Measurements on Germanium for Transistors. Proc. IRE 1954, 42, 420–427. [Google Scholar] [CrossRef]
  146. Smits, F.M. Measurement the of Sheet Resistivities Four-Point Probe. Bell Syst. Tech. J. 1958, 37, 711–718. [Google Scholar] [CrossRef]
  147. Sosniak, J. The deposition of niobium thin films by dc diode and substrate bias sputtering. J. Appl. Phys. 1968, 39, 4157–4163. [Google Scholar] [CrossRef]
  148. Fuschillo, N.; Annamalai, N.K. Dielectric properties of amorphous Nb2O5 thin films. Thin Solid Films 1975, 30, 145–154. [Google Scholar] [CrossRef]
  149. Fernández, J.A.; Schmelcher, P.; González-Férez, A.R. Preparation, Optical and Dielectric Properties of Vapor-Deposited Niobium Oxide Thin Films. J. Electrochem. Soc. 1969, 116, 234–239. [Google Scholar]
  150. Cho, N.H.; Kang, H.B.; Kim, Y.H. Dielectric characteristics and chemical structures of Nb2O5 thin films grown by solgel techniques. Ferroelectrics 1994, 152, 43–48. [Google Scholar] [CrossRef]
  151. Ong, G.K.; Cabezas, C.A.S.; Dominguez, M.N.; Skjærvø, S.L.; Heo, S.; Milliron, D.J. Electrochromic Niobium Oxide Nanorods. Chem. Mater. 2020, 32, 468–475. [Google Scholar] [CrossRef]
  152. Monk, P.M.S.; Mortimer, R.J.; Rosseinsky, D.R. Electrochromism and Electrochromic Devices; Cambridge University Press: Cambridge, UK, 2007. [Google Scholar]
  153. Yao, D.D.; Rani, R.A.; O’Mullane, A.P.; Kalantar-Zadeh, K.; Ou, J.Z. High performance electrochromic devices based on anodized nanoporous Nb2O5. J. Phys. Chem. C 2014, 118, 476–481. [Google Scholar] [CrossRef]
  154. Pawlicka, A.; Atik, M.; Aegerter, M.A. Synthesis of Nb2O5 thin films for electrochromic devices. J. Mater. Sci. Lett. 1995, 14, 1568–1570. [Google Scholar] [CrossRef]
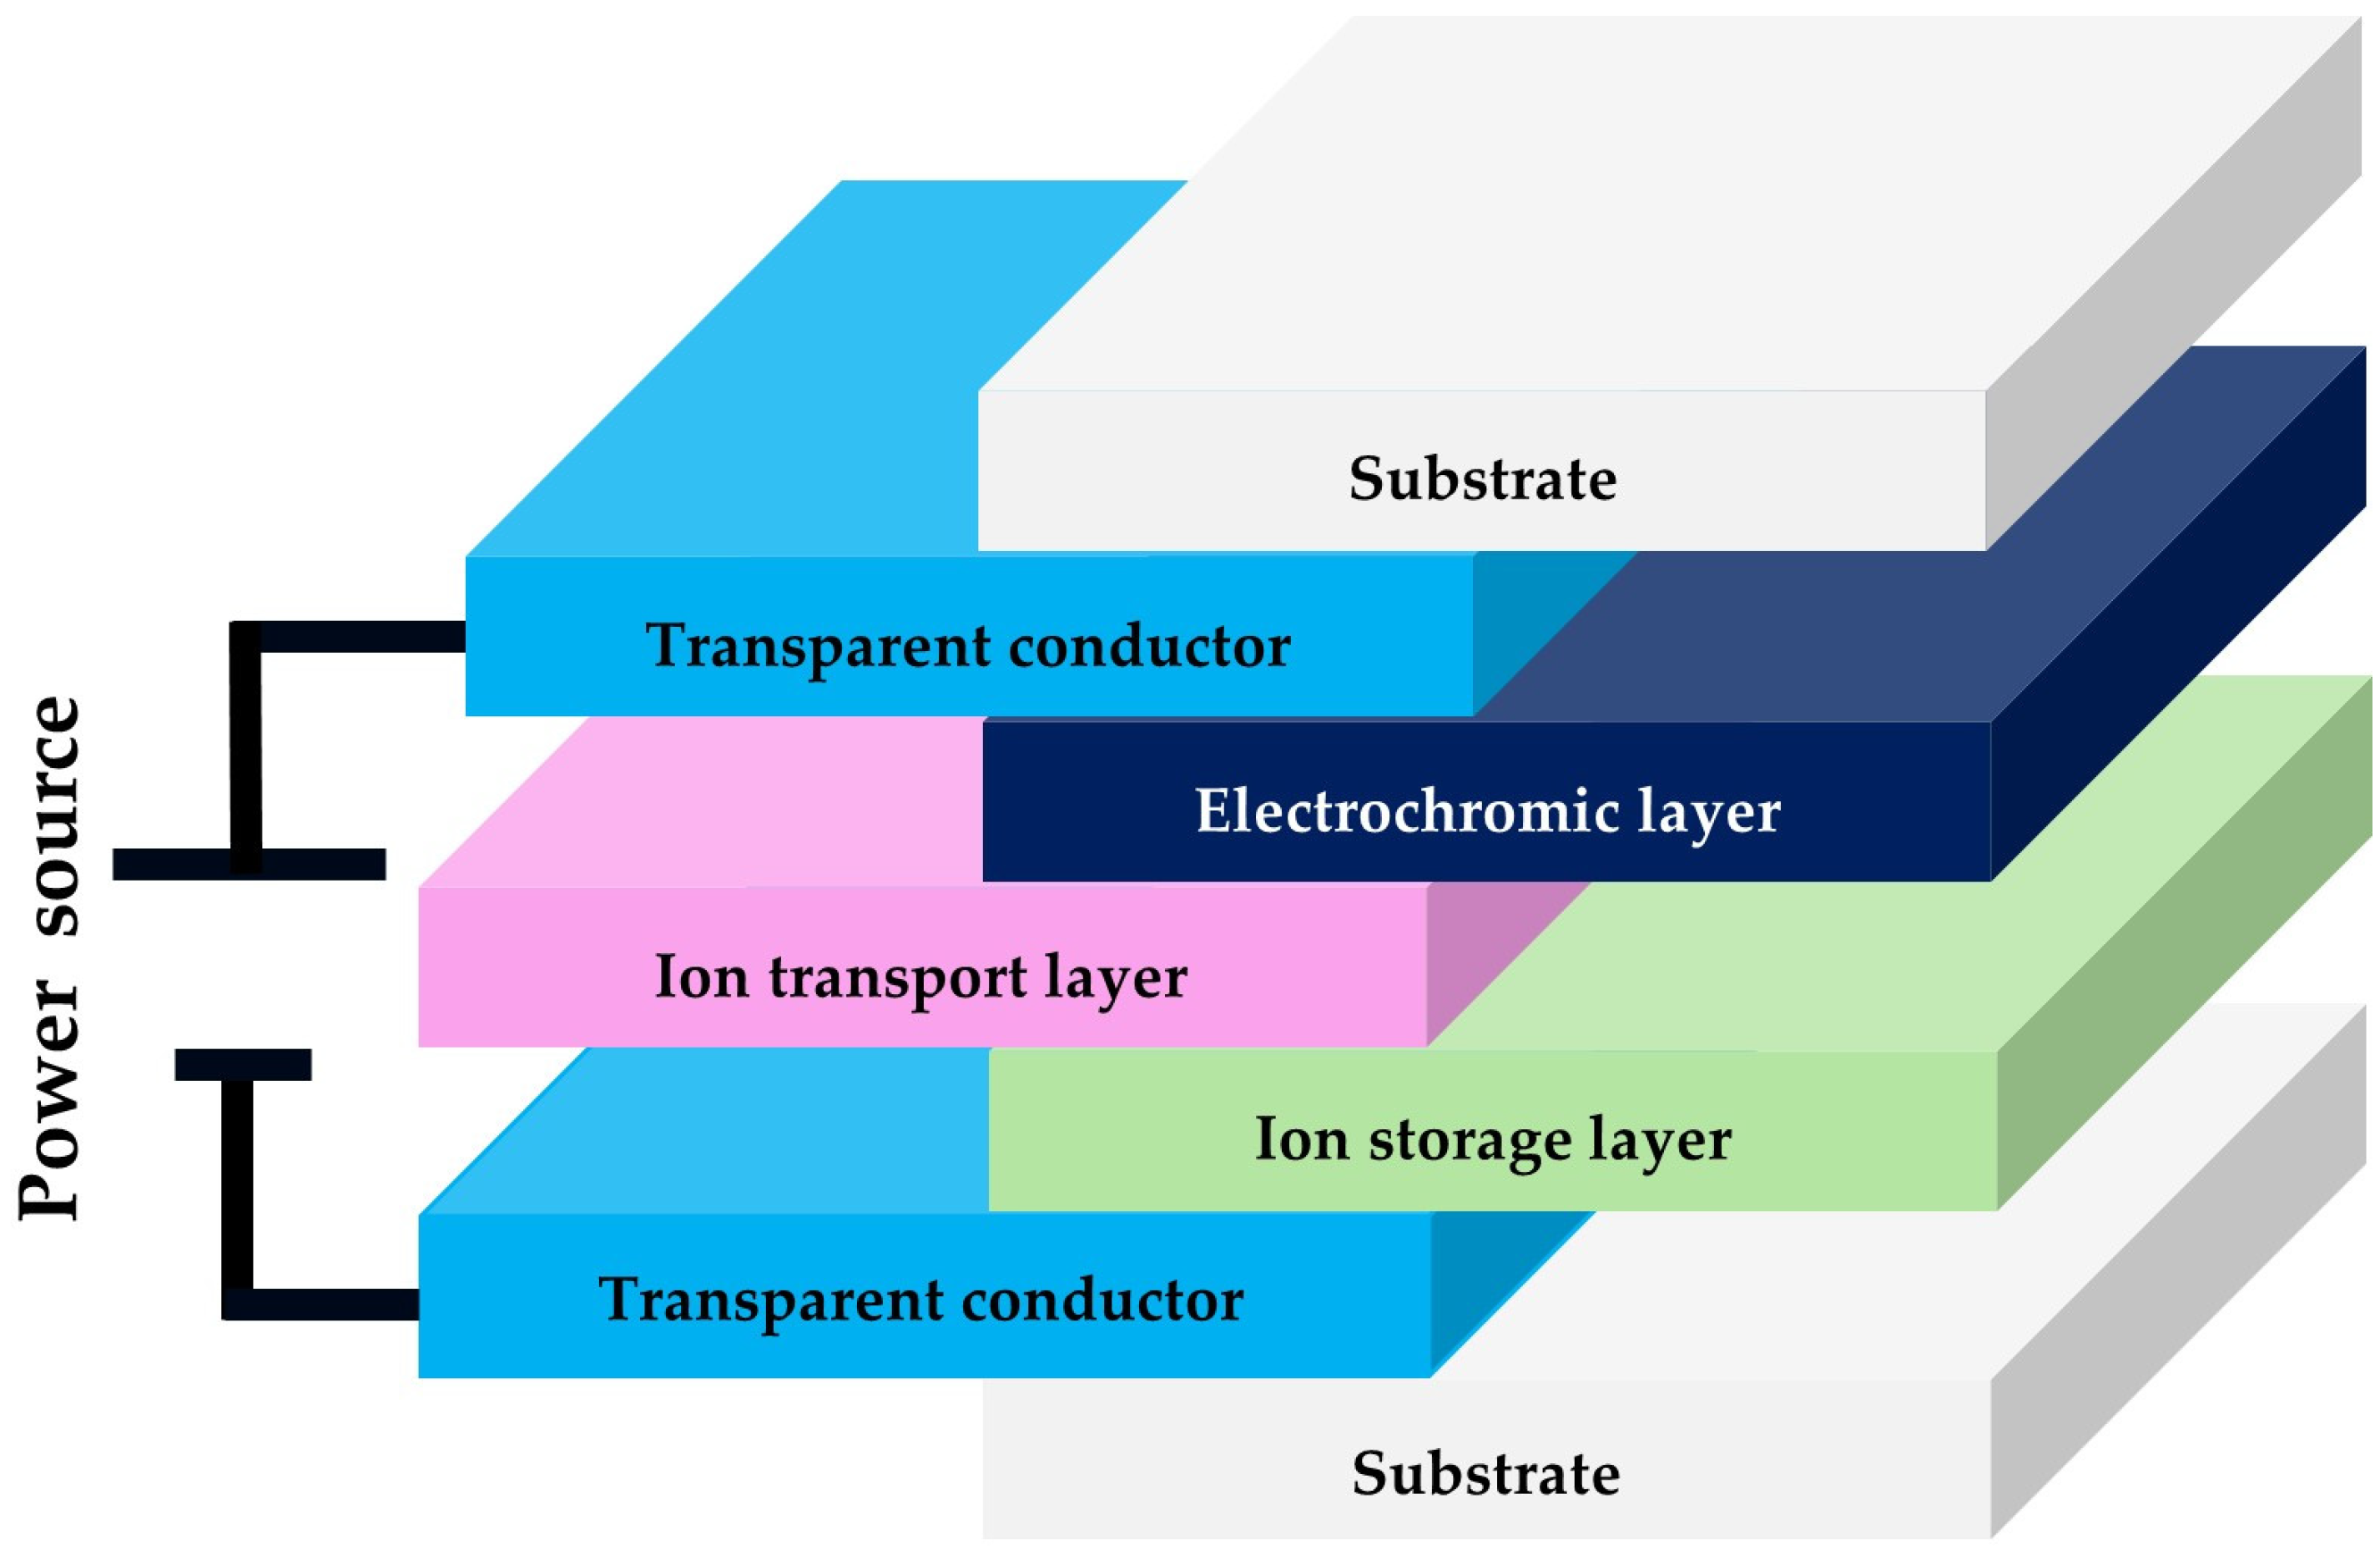
Figure 1. Configuration of an electrochromic device.
Coatings 14 01127 g001
Figure 2. Collapsing radius system: (a) schematic; (b) photography; (c) sample holder in a parallel plate geometry used for measuring the ITO-NbOx composite.
Coatings 14 01127 g002
Figure 3. X-ray diffraction of (a) first series of NbOx thin films grown with different flow rate ratios of O2/Ar for 30 min (all samples have metallic-like appearance); (b) second and third series of NbOx thin films grown at 0.40 and 0.56 flow rate ratios of O2/Ar and different deposition times.
Coatings 14 01127 g003
Figure 4. RBS spectrum obtained by measuring the last sample from the first, second, and third series: (a) NbOx thin films grown with a flow rate ratio of O2/Ar of 0.32 for 15 min (samples have metallic-like appearance); samples of the second and third series, grown with 0.40 and 0.56 O2/Ar flow rate ratios and different growth times (b,d) for 15 min and (c,e) 30 min. The vertical arrows identify the different barriers associated with the various elements present in the film and the substrate. Simulated spectra were obtained (red lines) by fitting the data using the NDF code.
Coatings 14 01127 g004
Figure 5. High-resolution XPS spectra of the Nb 3d state showing the spin-orbit splitting. The deconvoluted peaks associated with the 3d3/2 and 3d5/2 orbitals are indicated for the films’ growth at (a) 0 O2/Ar-30 min, (b) 0.16 O2/Ar-30 min, (c) 0.32 O2/Ar-30 min, (d) 0.40 O2/Ar-30 min, and (e) 0.56 O2/Ar-30 min.
Coatings 14 01127 g005
Figure 6. Raman analyses of NbOx thin films. (a) First series of NbOx thin films grown at different flow rate ratios of O2/Ar (0, 0.16, 0.32) and the same deposition times; (b) second and third series of NbOx thin films deposited at 0.40 and 0.56 O2/Ar flow rate ratios and different deposition times.
Coatings 14 01127 g006
Figure 7. Surface and cross-section SEM micrographs of the first series of NbOx films grown on a silicon substrate with O2/Ar flow rate ratios varying from 0 up to 0.32: (a) 0 O2/Ar-30 min; (b) 0.16 O2/Ar-30 min; (c) 0.32 O2/Ar-30 min.
Coatings 14 01127 g007
Figure 8. Surface and cross-section SEM micrographs of the NbOx films grown with 0.40 and 0.56 O2/Ar flow rate ratios: (a) 0.40 O2/Ar-30 min; (b) 0.40 O2/Ar-15 min; (c) 0.56 O2/Ar-30 min; (d) 0.56 O2/Ar-15 min.
Coatings 14 01127 g008
Figure 9. Surface (upper images) and cross-section (lower images) SEM micrographs of the NbOx films grown on ITO-coated PET substrates with 0.40 and 0.56 O2/Ar flow rate ratios: (a) 0.40 O2/Ar-30 min; (b) 0.40 O2/Ar-15; (c) 0.56 O2/Ar-30 min; (d) 0.56 O2/Ar-15 min.
Coatings 14 01127 g009
Figure 10. Transmission spectra and plots of (αv)2 versus ℎv for direct transition in NbOx films grown on ITO-coated PET substrate (a) and on ITO-coated glass substrate (b) at 0.40 O2/Ar flow rate ratio with different deposition times.
Coatings 14 01127 g010
Figure 11. Electrical resistivity of NbOx thin films measured at room temperature: (a) grown on silicon substrate at different O2/Ar flow rate ratios (using the four-probe method); (b) grown on ITO-coated glass with different deposition times (by impedance spectroscopy at a frequency of 1 kHz).
Coatings 14 01127 g011
Figure 12. Electrical conductivity (RT) of NbOx films grown on ITO-coated glass as a function of frequency.
Coatings 14 01127 g012
Figure 13. Imaginary part of the impedance of NbOx films grown on ITO-coated glass as function of frequency.
Coatings 14 01127 g013
Figure 14. Cole−Cole plot of NbOx films grown on ITO-coated glass.
Coatings 14 01127 g014
Figure 15. Dielectric constant of NbOx films grown on ITO-coated glass at a 0.40 flow rate ratio if O2/Ar as a function of frequency.
Coatings 14 01127 g015
Figure 16. (a) CV curves (the arrows indicate the scan direction) and (b) evolution of representative transmittance (ΔT represents the relative optical transmittance difference) of NbOx films grown on ITO-coated PET substrates at a 0.40 O2/Ar flow rate ratio with 15 min of growth time at a scan rate of 10 mV/s.
Coatings 14 01127 g016
Figure 17. (a) CV curves (the arrows indicate the scan direction) and (b) evolution of representative transmittance (ΔT represents the relative optical transmittance difference) of NbOx films grown on ITO-coated PET substrates at a 0.40 O2/Ar flow rate ratio with 30 min of growth time at a scan rate of 10 mV/s.
Coatings 14 01127 g017
Figure 18. (a) CV curves (the arrows indicate the scan direction) and (b) evolution of representative transmittance (ΔT represents the relative optical transmittance difference) of NbOx films grown on ITO-coated PET substrates at a 0.56 O2/Ar flow rate ratio with 15 min of growth time at a scan rate of 10 mV/s.
Coatings 14 01127 g018
Figure 19. (a) CV curves (the arrows indicate the scan direction) and (b) evolution of representative transmittance (ΔT represents the relative optical transmittance difference) of NbOx films grown on ITO-coated PET substrates at a 0.56 O2/Ar flow rate ratio with 30 min of growth time at a scan rate of 10 mV/s.
Coatings 14 01127 g019
Figure 20. Surface SEM micrographs of ITO-coated PET substrate (ac) and NbOx films grown on ITO-coated PET substrate at a 0.52 flow rate ratio of O2/Ar-15 min (df) at 0 cycles, critical bending radius and 20,000 cycles; (g) electrical resistance variation of the samples after bend-testing using the collapsing radius geometry.
Coatings 14 01127 g020
Table 1. Some of the physical properties of the Nb and stoichiometric niobium oxides.
Physical PropertiesNb
[7,8,9]
NbO
[7,8,9]
NbO2
[9,10,11,12,13]
Nb2O5
[9,11,14]
crystal systemcubiccubictetragonal depends on its polymorph, synthesis parameters and technique
space group O h 9 O h 1 C 4 h 6
density (g/cm3) at 20 °C8.57 7.305.904.47
melting point (°C)2477193719011500
boiling point (°C)4744---
qualitative solubilityacid--hydrofluoric acid
electrical resistivity μΩ·cm at 25 °C15.221107-
conductivity σ (S/cm) at 25 °C~7.5 × 10⁴~4.8 × 10⁴~10−4~10−16–10−6
relative atomic mass92.906108.905124.905265.80
Table 2. Thin film density estimated using RBS fit results.
NbOx
Thin Film
DensityThickness (nm)+Density
(g/cm3)
++Nb/O Ratio
(1015 atm/cm2)*
0.32 O2/Ar-15 min35055106.111.15
0.40 O2/Ar-60 min14541984.570.49
0.40 O2/Ar-30 min693754.720.48
0.40 O2/Ar-15 min463604.450.41
0.56 O2/Ar-60 min11071534.480.48
0.56 O2/Ar-30 min669884.490.43
0.56 O2/Ar-15 min426514.570.36
* Estimated from SEM micrographs. + Density estimated considering the stoichiometry obtained from the fit of RBS data and the thickness estimated from SEM micrographs. ++ Nb/O ratio estimated by RBS.
Table 3. Binding energies (eV) of the Nb 3d orbitals obtained by XPS and those from the literature.
NbOx Thin FilmNb 3d
Orbitals
Nb0(metal) Nb2+ (NbO)Nb4+ (NbO2)Nb5+ (Nb2O5)
0 O2/Ar-30 minNb 3d3/2204.9--210.6
Nb 3d5/2202.1--207.1
0.16 O2/Ar-30 minNb 3d3/2205.5--210.2
Nb 3d5/2202.8--207.5
0.32 O2/Ar-30 minNb 3d3/2-206.8-210.0
Nb 3d5/2-204.0-207.3
0.40 O2/Ar-30 minNb 3d3/2--208.6210.3
Nb 3d5/2--205.7207.6
0.56 O2/Ar-30 minNb 3d3/2---210.1
Nb 3d5/2---207.3
From the literature
[130,131,132,133]
Nb 3d3/2205.0
204.7
205.1
206.8
206.6
207.0
208.8
208.6
208.8
210.0
209.9
210.2
Nb 3d5/2202.2
202.0
202.3
204.0
203.9
204.3
206.0
205.9
206.0
207.3
207.2
207.4
Table 4. Surface roughness (root mean square height, Sq) measured by optical profilometry of the NbOx thin films grown at 0.40 and 0.56 O2/Ar flow rate ratios with different deposition times on ITO-coated PET substrate and ITO-glass substrate.
Sample Sq (nm) of NbOx Thin Films Grown on ITO-Coated PET SubstrateSq (nm) of NbOx Thin Films Grown on ITO-Coated Glass Substrate
0.40 O2/Ar-15 min910
0.40 O2/Ar-30 min67
0.40 O2/Ar-60 min-4
0.56 O2/Ar-15 min37
0.56 O2/Ar-30 min33
0.56 O2/Ar-60 min-5
SampleSq (nm)
ITO-coated PET substrate4
ITO-coated glass substrate2
Table 5. Transmittance maximum (maximum of the interference fringes) and band gap of the NbOx thin films grown at 0.40 and 0.56 O2/Ar flow rate ratios with different deposition times on ITO-coated PET substrate and ITO-glass substrate.
Transmittance (%)
(Thin Films Grown on
ITO-Coated PET
Substrate)
Bandgap (eV)
(Thin Films Grown on
ITO-Coated PET
Substrate)
Transmittance (%)
(Thin Films Grown on
ITO-Coated Glass Substrate)
Bandgap (eV)
(Thin Films Grown on
ITO-Coated Glass Substrate)
0.40 O2/Ar-15 min81%3.9178%4.07
0.40 O2/Ar-30 min80%3.9177%4.02
0.40 O2/Ar-60 min--83%3.94
0.56 O2/Ar-15 min81%3.9177%4.05
0.56 O2/Ar-30 min80%3.9083%4.04
0.56 O2/Ar-60 min--82%3.98
Table 6. Cyclic voltammetry measurements of the NbOx films grown on ITO-coated PET substrates at 0.40 and 0.56 O2/Ar flow rate ratios with 15 and 30 min of growth.
Sample0.40 O2/Ar
15 min
0.40 O2/Ar
30 min
0.56 O2/Ar
15 min
0.56 O2/Ar
30 min
Scan rate (mV/s)10101010
jpc (A/cm2)3.67 × 10−44.60 × 10−44.28 × 10−42.81 × 10−4
Vpc (VAg/AgCl/KCl (3M))−2.00−2.00−2.00−2.00
jpa (A/cm2)1.28 × 10−42.14 × 10−41.30 × 10−41.51 × 10−4
Vpc (VAg/AgCl/KCl (3M))−1.20−1.04−1.14−1.02
Diffusion coefficient
(cm2s−1)
Dinsertion1.82 × 10−102.36 × 10−102.86 × 10−101.07 × 10⁻¹⁰
Dextraction2.21 × 10−116.19 × 10−112.29 × 10−113.07 × 10⁻¹¹
Intercalated charge (C/cm2)0.0170.0280.0170.017
Deintercalated charge (C/cm2)0.0160.0260.0140.016
Reversibility (%)96%95%82%89%
Coloration efficiency at 630 nm (cm2/C)30272625
Table 7. Electrochromic performances of NbOx thin films reported in the literature.
From the LiteratureTechnique of GrowthSubstrateReversibility (%)ΔTColor
Efficiency (CE) cm2/C
Tc (s)Tb (s)
Nb2O5 [153]RF
sputtering
FTO coated glass--4713.37.5
Nb2O5 [31]Sol–gel/dip coatingITO-coated glass-332623
Nb2O5 [62]Sol–gel/dip coating ITO-coated glass--22--
Nb2O5 [154]Sol–gel/dip coating ITO-coated glass--15--
Nb2O5 [58]Spray pyrolysis FTO-coated glass85%-133.74.7
Nb2O5 [128]RF
sputtering
1731 (high temperature glass)-25.44.63--
Disclaimer/Publisher’s Note: The statements, opinions and data contained in all publications are solely those of the individual author(s) and contributor(s) and not of MDPI and/or the editor(s). MDPI and/or the editor(s) disclaim responsibility for any injury to people or property resulting from any ideas, methods, instructions or products referred to in the content.