Article

Study of the Impact of Surface Topography on Wear Resistance

1
School of Intelligent Manufacturing, Huanghuai University, Zhumadian 463000, China
2
Key Laboratory of Advanced Manufacturing and Intelligent Technology, Ministry of Education, Harbin University of Science and Technology, Harbin 150080, China
*
Author to whom correspondence should be addressed.
Coatings 2024, 14(9), 1128; https://doi.org/10.3390/coatings14091128
Submission received: 4 August 2024 / Revised: 24 August 2024 / Accepted: 27 August 2024 / Published: 2 September 2024

Abstract

:
The surface texture parameter is a real reflection of the surface topography, which is closely related to the tribological properties of the surface, and the study of the correlation between the surface texture parameter and wear resistance is of great significance in revealing the tribological influence mechanism of the surface and realising the functional manufacturing of the surface. This paper takes the ball-end milling surface as the research object, establishes the three-dimensional simulation model of the surface topography, and analyses the surface topography and the surface texture parameter change rule. Based on the improved correlation analysis model, the correlation characteristics between the surface texture parameters, and between the surface texture parameters and the relative wear rate of per unit sliding distance KV, were investigated, and the prediction model of KV was established based on the surface texture parameters Sku, Sa, Sxp, Sp, and Ssk, and the correctness of the model was verified by experiments. The study in this paper provides a new idea to further reveal the relationship between surface topographical features and wear resistance and to guide the functional manufacturing of surfaces.

1. Introduction

Surface texture characteristics induced by machining have an important influence on the mechanical properties and functional characteristics of machined parts, such as tribological properties, load carrying capacity, wear resistance, etc. [1,2,3,4]. The surface roughness parameter is the most commonly used characterisation of surface texture, and numerous studies have shown that the tribological behaviour of surfaces under dry or lubricated conditions is not only influenced by Ra and Rq, but also by other surface parameters [5]. In recent years, the study of the relationship between surface texture and tribological properties has gradually shifted from two-dimensional roughness parameters to three-dimensional surface texture parameters.
The surface texture parameter Sa is commonly used in the evaluation of surface topography and tribological properties, but when Sa is similar or the same on different surfaces, the differences in other surface texture parameters can be significant, which in turn can lead to completely different friction and wear properties [6]. Andrzej found that the parameters Ssk and Sku have a significant effect on volumetric wear, and that the amount of wear is closely related to the parameters of the bearing area ratio curve [7]. Yang et al. investigated the correlation between Ssk, Sku, and wear performance and proposed a method to discriminate wear performance based on Sa and Ssk under different loads [8]. Despite the extensive research carried out by many scholars, the correlation between surface texture parameters and friction and wear characteristics is still not clear [9,10,11].
In the study of surface texture parameters and friction and wear performance, the correlation analysis between the parameters helps in the selection of the parameters. The selected parameters must be relevant to manufacturing and functionality, so the correct correlation analysis is the basic prerequisite for the study [12]. Pawel screened the surface roughness parameters on the basis of correlation analysis and linear regression and established a parameter set for surface characterisation [13]. Yang et al. investigated the correlation between surface roughness parameters and grinding parameters based on Pearson’s correlation analysis and multivariate analysis of variance, and accordingly established the characterisation parameter set [14]. Mieczyslaw investigated the correlation between surface texture parameters using Pearson’s linear correlation coefficient [15]. Current correlation studies mainly focus on analysing the degree of correlation between parameters based on Pearson’s correlation coefficient; however, Pearson’s correlation coefficient only evaluates the linear correlation between parameters, and the correlation between surface texture parameters and functional parameters is not always linear, so the study based on the Pearson’s correlation coefficient is not accurate.
Ball-end milling is one of the most commonly used machining methods in manufacturing [16,17]. The ball-end milling surface has a unique pit-shaped structure, and when the machining parameters are changed, the surface topography will be changed [18]. Adjusting the spindle speed and changing the depth of cut during machining are in essence changing the tool vibration during machining, which in turn affects the topographical characteristics of the machined surface. Therefore, based on the vibration difference in adjacent cutter teeth during the ball-end milling process, this paper establishes a three-dimensional simulation model of the surface topography, analyses the change rule of the surface texture parameters, and discusses the contact pressure and wear characteristics of different surfaces using ABAQUS software (2020). Based on the grey system theory, an improved correlation analysis model was established to explore the correlation between the surface texture parameters, the evaluation parameter of wear resistance—relative wear rate per unit sliding distance KV—was proposed, and the correlation between the three-dimensional surface texture parameters and Kv was analysed. On this basis, a prediction model for KV based on the surface texture parameters Sku, Sa, Sxp, Sp, and Ssk was established, and the correctness of the model was verified by experiments. The study in this paper provides a new approach to reveal the intrinsic correlation between surface texture parameters and to explore the mechanism of the influence of surface topographic features on wear characteristics.

2. Modelling and Simulation

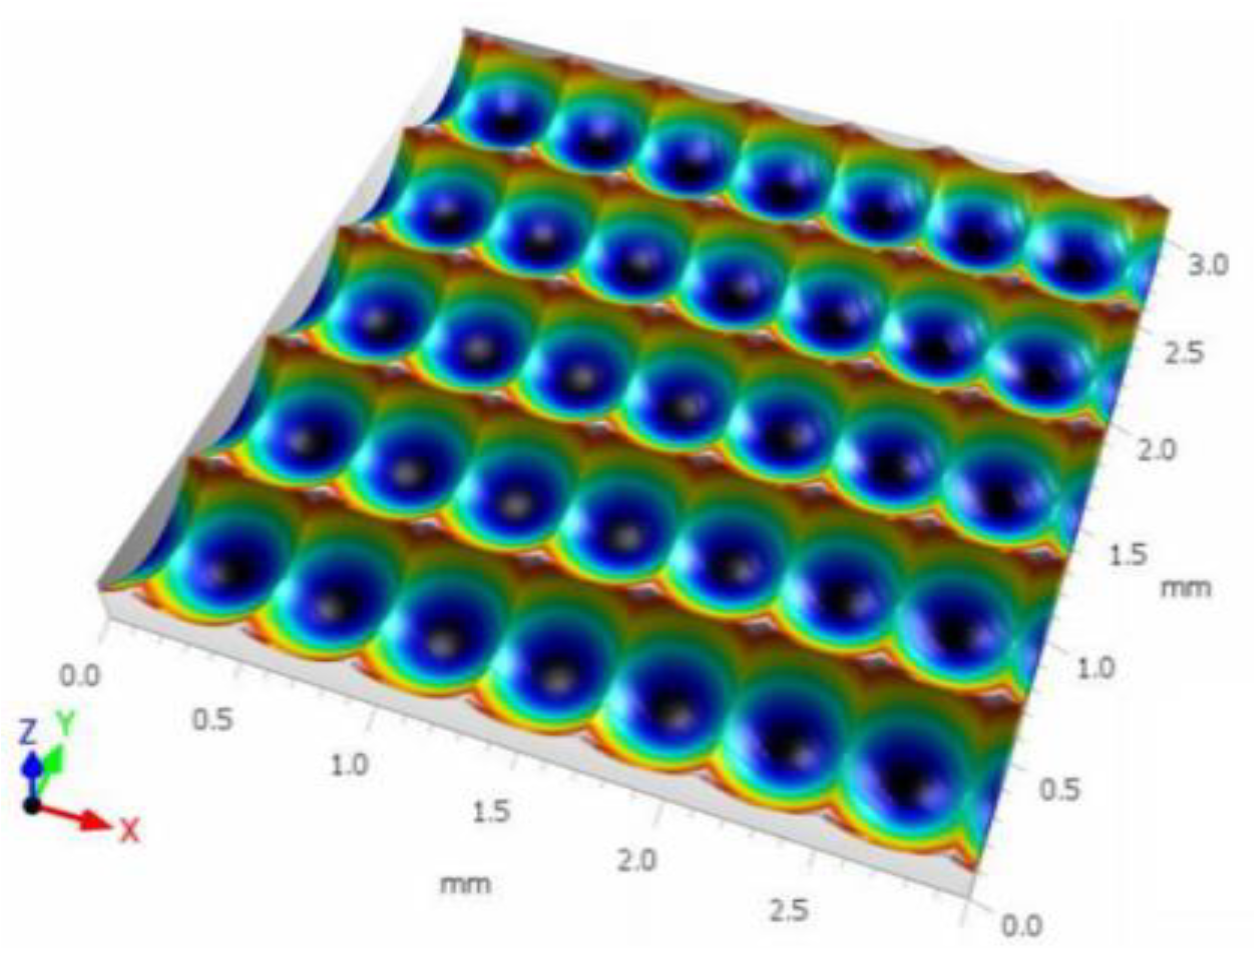
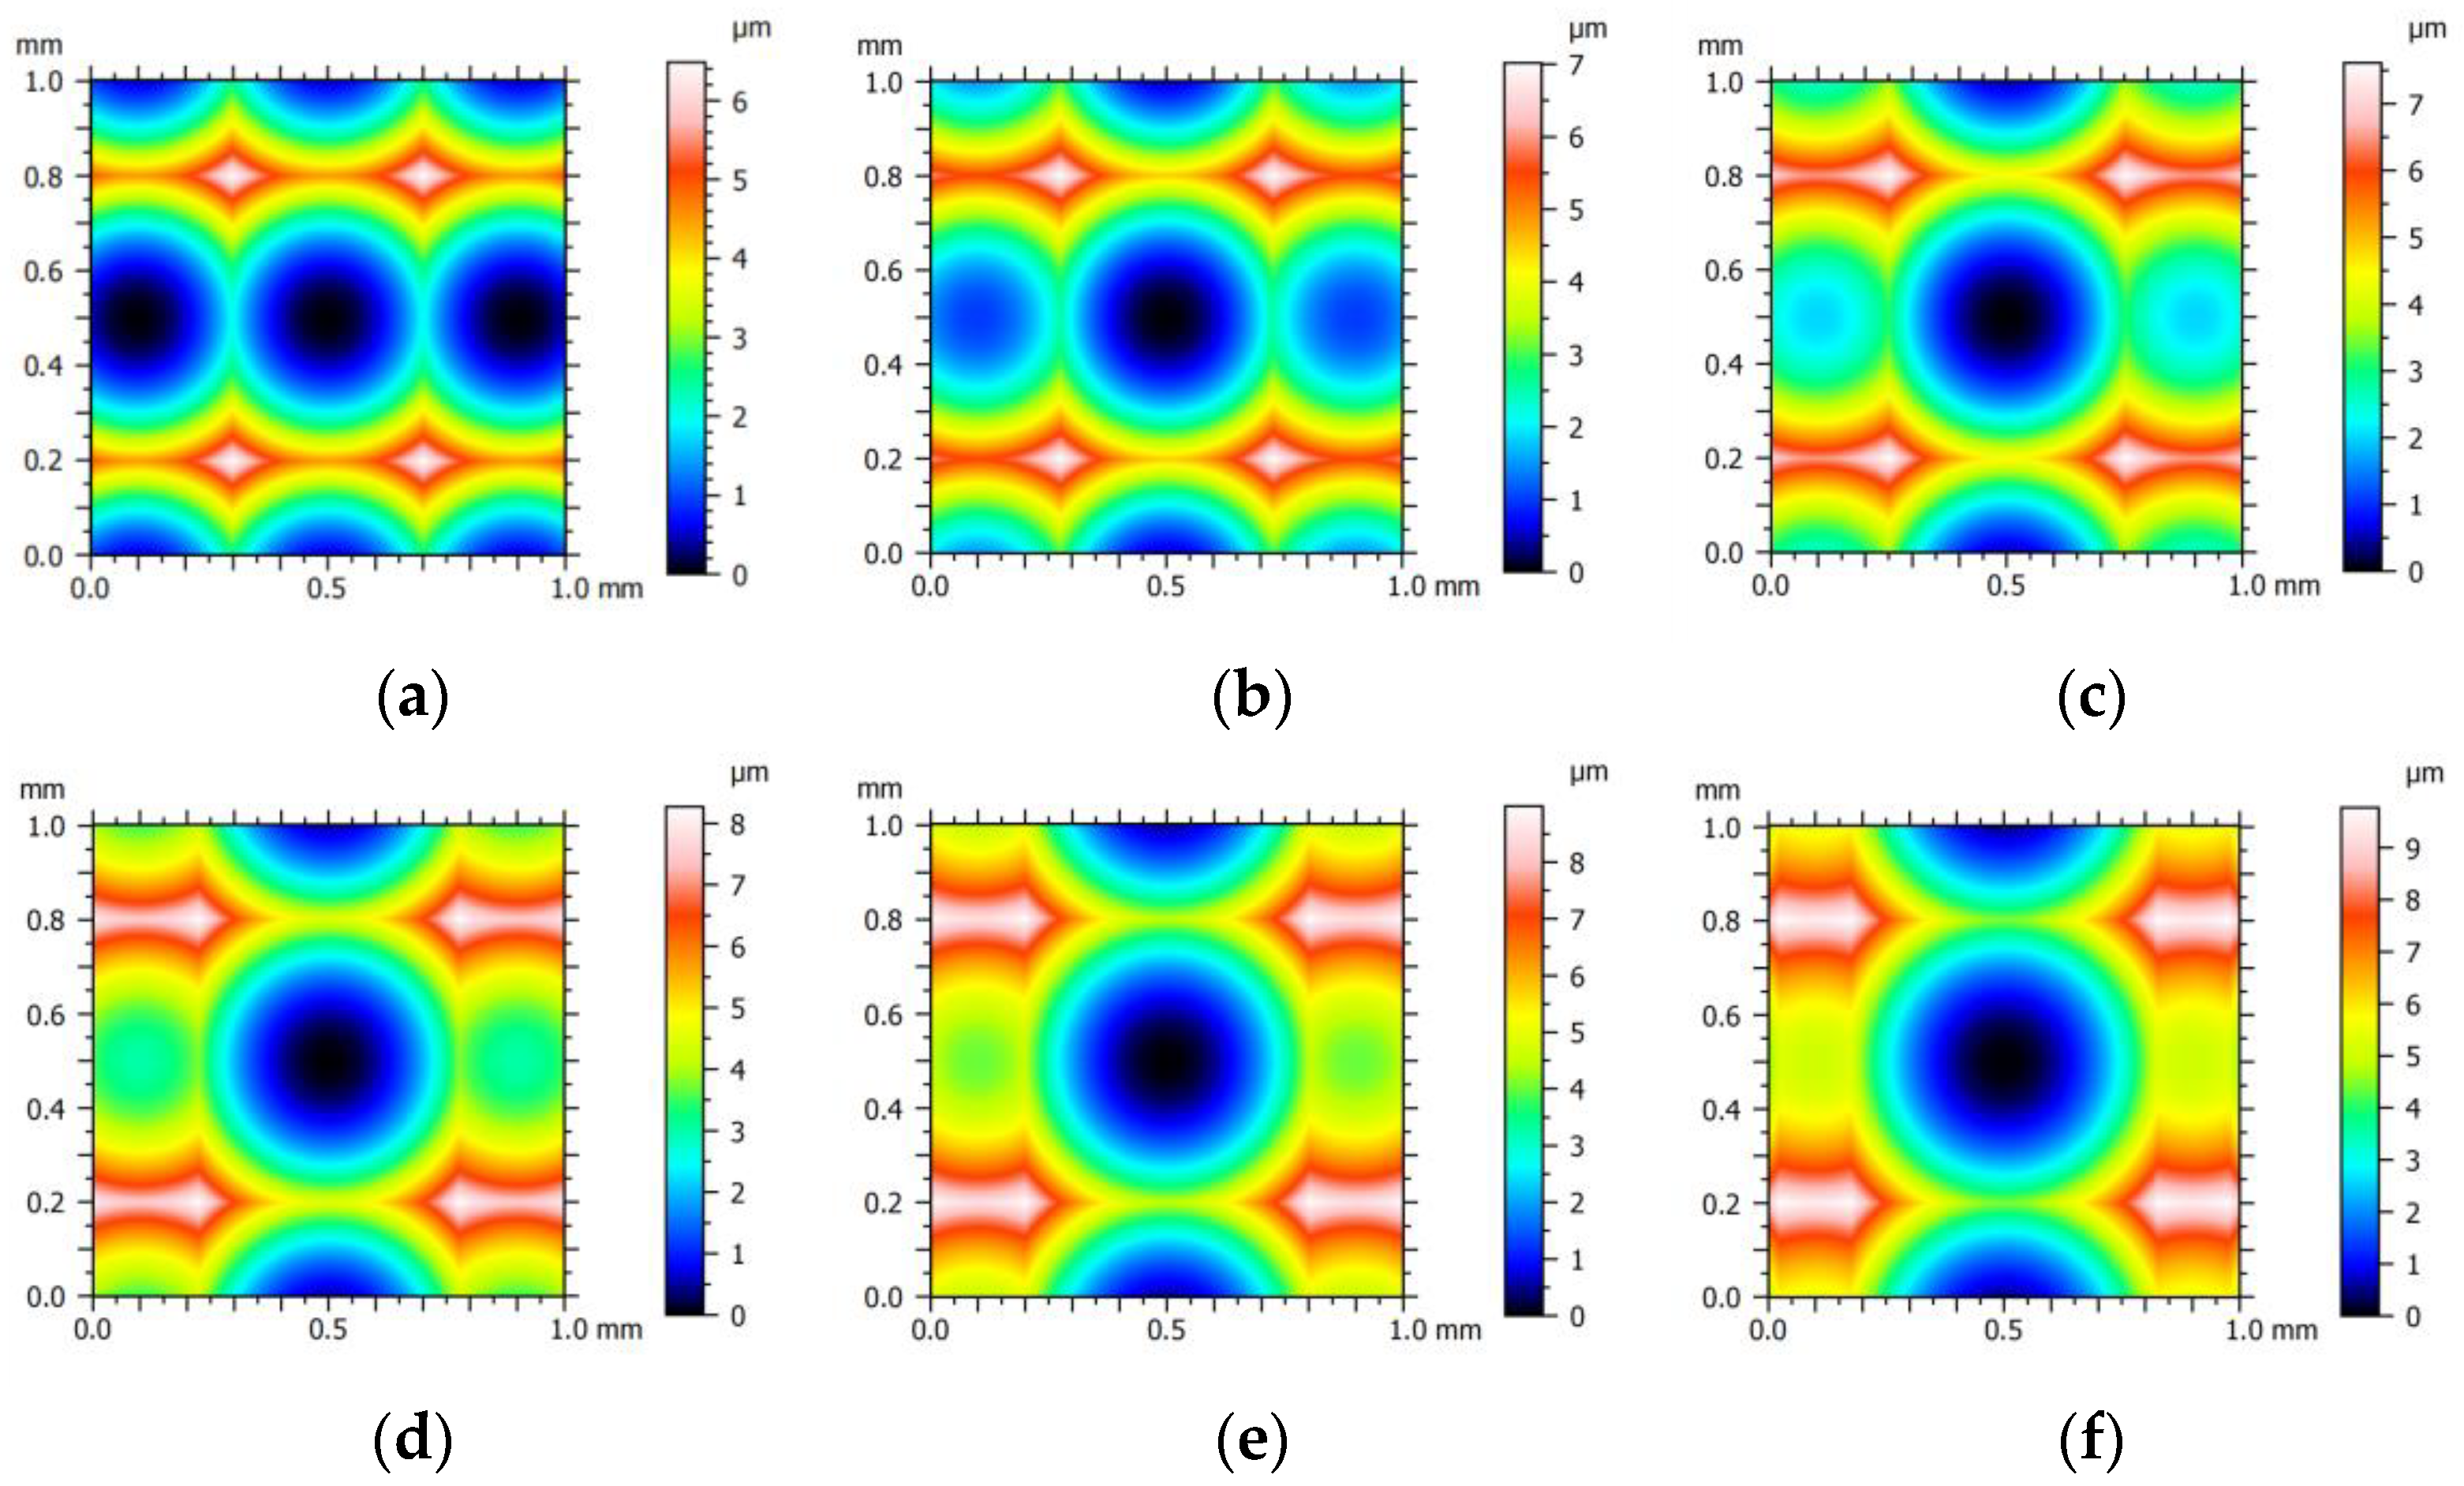
2.1. Three-Dimensional Simulation Model of Surface Topography

During the ball-end milling process, due to the influence of the coupled cutting action of adjacent machining paths, the surface topography presents polygonal crater-like topographic features [19], as shown in Figure 1.
Cutting vibration is an important influence on the machined surface topography; especially when the cutting vibration of the neighbouring teeth is not the same, the machined surface topography may change in the three directions of fz (X-direction), ae (Y-direction) and ap (Z-direction). When the tool vibration occurs in the direction of fz and ae, the width and length of the surface profile of the ball-end milling process will be changed, and the size of the change is the same as the vibration size. If the tool vibration occurs in the ap direction, the centre of the cutter teeth will be shifted in the ap direction during machining, and the dimensions of the surface profile will be changed accordingly.
In the process of ball-end milling, due to the influence of vibration difference between adjacent teeth, the topography of the machined surface will be changed, this paper establishes a three-dimensional simulation model of the surface topography of ball-end milling based on the Z-map method.
The Z-map method discretises the workpiece and the tool into a series of grids to simulate the sweeping path of the tool movement and determines the cutting state based on the size of the relationship between the height of the workpiece and the swept value of the tool at different moments. During the tool sweeping process, the height value of the workpiece is continuously updated, and the simulation model of the surface topography is established based on the residual height of the workpiece surface [20]. In this paper, based on the Z-map method, Matlab software (2020) was used to establish a simulation model of the surface topography of two-tooth milling cutter ball-end milling machining, in which fz = 0.4 mm, ae = 0.6 mm, and t is the vibration difference in the neighbouring teeth, and its specific parameters are shown in Table 1.
Based on the idea of reverse engineering, the point cloud data of 3D surface topography is extracted and the point cloud map of surface topography is generated, as shown in Figure 2.
From Figure 2, it can be seen that along with the gradual increase in the vibration difference (t) between neighbouring cutter teeth, the surface still shows quadrilateral pit-like topography, but the depth of the pit and the width of the fz direction are changed, i.e., the surface topography is not the same at different t values.

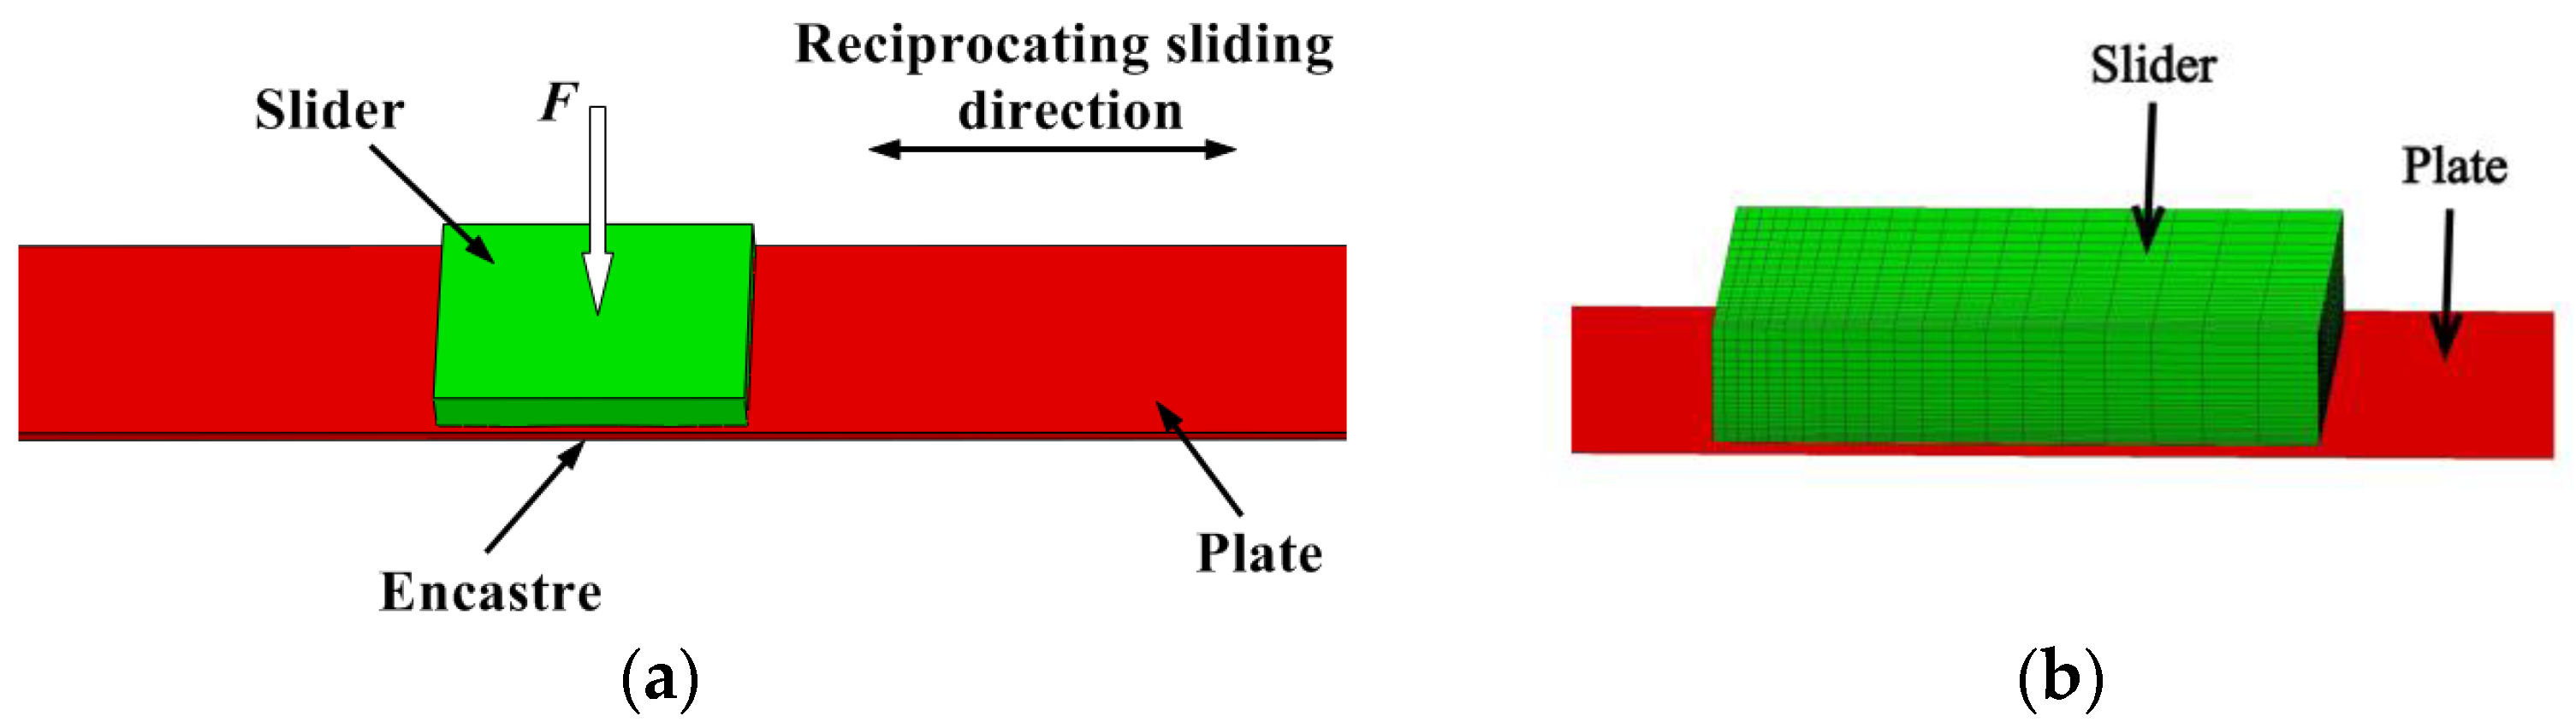
2.2. Finite Element Simulation of Sliding Wear Process

The basic idea of the sliding friction wear simulation process is to establish a parametric equilibrium equation based on the contact characteristics of the motion process and then solve the equation to complete the calculation of wear. At present, the most commonly used theoretical calculation model in the sliding wear process is the Archard wear model, which was proposed by J.F. Archard, a famous tribologist, in 1953, and it is mainly used for calculating and analysing the amount of wear in the sliding process [21]. In 1980, Archard extended the model to adhesive wear, abrasive wear, corrosive wear, and other wear mechanisms [22], and to this day Archard’s model is still the most commonly used model for calculating wear. The material removal V in the model is denoted as
V = K P s H
where K is the wear coefficient, P represents the normal load, s represents the sliding distance, and H is the hardness of the material.
In the simulation analysis of the sliding wear process based on the finite element idea, the parameter balance equation is established based on the nodes and units divided. Thus, according to the basic idea of the finite element method, the Archard wear model can be rewritten as follows:
d h i = K H p i d s i
where dhi is the wear height of the material at node i, pi is the normal load acting at node i of the contact surface, and dsi is the sliding distance increment at node i of the contact surface.
Based on Equation (2), the establishment of parametric equations in the sliding wear process can be completed by combining the specific data in the finite element simulation analysis, thus realising the finite element simulation analysis of the sliding wear process. Accompanied by the gradual increase in the sliding distance, the peak region of the surface topography is gradually smoothed, the contact area gradually increases, and the contact pressure of the nodes decreases, but the number of contact nodes increases, and the wear characteristics of the nodes change. The specific steps of the sliding wear finite element simulation are to input the contact pressure CPRESS and sliding distance CSLIP as real-time variables into the Archard formula to calculate the wear amount and accordingly calculate the real-time offset of the contact nodes in the direction of wear. After that, the Lagrangian Eulerian (ALE) adaptive meshing technique is used to re-mesh the finite element model after the change in node migration to realise the finite element simulation and analysis of sliding wear process in ABAQUS.
This paper establishes a finite element simulation model of the sliding wear process through the relative motion between the slider and the flat plate, and the surface topography of the ball-end milling process is designed on the slider, and the simulation model is shown in Figure 3.
The length of the slider is 1 mm, the width is 1 mm, and the height is 0.2 mm, and the length of the plate is 52 mm, the width is 1.2 mm, and the height is 0.1 mm. In the finite element simulation of the sliding wear process, the materials used in the slider is hardened mould steel Cr12MoV with a hardness of 60 HRC, and the flat plate is a rigid body. The slider material parameters during simulation are shown in Table 2.
The purpose of the finite element simulation analysis is to investigate the influence law of surface topography on the wear characteristics, so the simulation analysis is carried out under dry friction conditions and the influence of wear debris, temperature, and other factors are not considered. The normal load of the slider is 10 MP, the average sliding speed is 50 mm/s, the frequency is 0.5 Hz, and the wear coefficient is 1 × 10⁻⁵ [23].

3. Correlation Analysis and Predictive Models

Grey system theory is from the “small sample, poor information, uncertainty” information data. It involves mining the known information to extract more valuable information, thus enabling the evolution of the information system process and providing a more accurate description of the behaviour.

3.1. Improved Relational Grade

Grey correlation analysis is a commonly used method of correlation analysis to determine the correlation using the similarity degree of data sequences [24,25,26]. In correlation analysis, the changing characteristics of the data sequence are often more meaningful for correlation evaluation. For this reason, this paper proposes an improved correlation analysis method based on data change characteristics. The calculation steps are as follows:
Step (1). Non-dimension Processing
Different data sequences often have different dimension and different values. Firstly, the data are non-dimensionless, and all of them are to the same [0,1] interval, so that the data sequences have the same dimension in order to lay the foundation for the subsequent correlation analysis.
Let Xi = (xi(1), xi(2),…, xi(n)) be the behavioural sequence of factor Xi. The non-dimensional calculation is shown in the following equation:
x ¯ i = x i ( k ) min k x i ( k ) max k x i ( k ) min k x i ( k )   k = 1 , 2 , , n
Step (2). Calculate the change rate of the data sequences
The change characteristics of the data sequences can better reflect the overall change rule of the data, and on the basis of the non-dimension processing of the data sequences, the change rate of the data sequences in the interval of [0,1] is calculated. The calculation is as shown in Equation (4):
Δ x ¯ i = d x ¯ i ( k ) Δ k   k = 1 , 2 , , n
The computed data sequence is Δ X ¯ i = ( Δ x ¯ i ( 1 ) , Δ x ¯ i ( 2 ) , , Δ x ¯ i ( n ) ) .
Step (3). Compute the zero-stating point images
The starting points of the change rate data are often different; in order to better complete the correlation analysis, the data sequences are shifted to zero point as a whole so that they have the same starting point. The two data sequences after translation are Δ X ¯ 1 0 and Δ X ¯ 2 0 , and the computation of the zeroing of the starting point is shown in Equations (5) and (6):
Δ X ¯ 1 0 = ( Δ x ¯ 1 0 ( 1 ) , Δ x ¯ 1 0 ( 2 ) , , Δ x ¯ 1 0 ( n ) )
Δ X ¯ 2 0 = ( Δ x ¯ 2 0 ( 1 ) , Δ x ¯ 2 0 ( 2 ) , , Δ x ¯ 2 0 ( n ) )
Step (4). Calculation of correlation parameters
Based on grey system theory, parameter si is defined as
s 1 = 1 n | Δ X ¯ 1 0 | d t
s 2 = 1 n | Δ X ¯ 2 0 | d t
s 2 s 1 = 1 n | Δ X ¯ 1 0 Δ X ¯ 2 0 | d t
Step (5). Calculating the improved relational grade
ε 12 = | s 1 | + | s 2 | | s 1 | + | s 2 | + | s 1 s 2 |
The improved correlation analysis method is proposed in this paper is based on the basic idea of grey correlation analysis, which calculates the relational degree between data sequences based on the changes characteristics. The relational degree all lies between (0, 1], and the closer its value is to 1, the higher the relational degree between the data sequences.

3.2. Grey Prediction Model

Parameter selection is the basis for studying the correlation between surface topography features and wear resistance, and after determining the study parameters based on the correlation analysis, it is possible to realise the wear resistance prediction study based on the surface texture parameters. The zero-order multi-parameter GM (0,N) model is a multi-variate data prediction model, but it focuses on the characteristics of the data itself and does not account for the effects of different dimension on the predicted values. The surface texture parameters and wear feature parameters do not have exactly the same magnitude, and the direct prediction using the GM (0,N) model will cause confusion in the meaning of the parameters, which will lead to errors in the predicted values. Therefore, an improved GM (0,N) model is developed in this paper.
Let the system data sequence be Y 0 = ( y 0 ( 1 ) , y 0 ( 2 ) , , y 0 ( m ) ) . The relevant factor data sequence is Y i = ( y i ( 1 ) , y i ( 2 ) , , y i ( m ) ) i = 1 , 2 , , m .
Step (1) Non-dimension processing
Data sequence usually have different dimension between them, so all data are non-dimensional.
y ¯ i ( k ) = y i ( k ) y i ( 1 ) ,   y i ( 1 ) 0 ,   k = 1 , 2 , , m
Step (2) Generating an accumulated data sequence
y ¯ i ( 1 ) ( k ) = 1 k y ¯ i ( k ) ,   k = 2 , 3 , , m
Then, the data sequence is transformed into
Y ¯ 0 ( 1 ) ( k ) = ( 1 , y ¯ 0 ( 1 ) ( 2 ) , y ¯ 0 ( 1 ) ( 3 ) , , y ¯ 0 ( 1 ) ( m ) )
Y ¯ i ( 1 ) ( k ) = ( 1 , y ¯ i ( 1 ) ( 2 ) , y ¯ i ( 1 ) ( 3 ) , , y ¯ i ( 1 ) ( m ) ) , i = 1 , 2 , , m
Step (3) Build the data sequence matrix
Establishment of a data matrix of relevant factors
B = [ y ¯ 1 ( 1 ) ( 2 ) y ¯ 2 ( 1 ) ( 2 ) y ¯ M ( 1 ) ( 2 ) y ¯ 1 ( 1 ) ( 3 ) y ¯ 2 ( 1 ) ( 3 ) y ¯ M ( 1 ) ( 3 ) y ¯ 1 ( 1 ) ( m ) y ¯ 2 ( 1 ) ( m ) y ¯ M ( 1 ) ( m ) ]
The system data sequence matrix is Y = [ y ¯ 0 ( 1 ) ( 2 ) y ¯ 0 ( 1 ) ( 3 ) y ¯ 0 ( 1 ) ( m ) ] T .
Step (4) Estimation of parameter values using least squares
b ^ = [ b 1 , b 2 , , b m , a ] = ( B T B ) 1 B T Y 0
Step (5) Establishment of the GM (0,N) predictive model.
y ¯ 0 ( 1 ) ( k ) = b 1 y ¯ 1 ( 1 ) ( k ) + b 2 y ¯ 2 ( 1 ) ( k ) + + b m y ¯ m ( 1 ) ( k ) + a
Finally, the computed predictions are cumulatively subtraction restored and multiplied by the initial values to obtain the final predictions of the data. The improved GM (0,N) model avoids the influence of different dimension on the prediction results through the non-dimension processing, the physical meaning of the established prediction model is clearer, and the prediction results are more reliable.

4. Results and Discussion

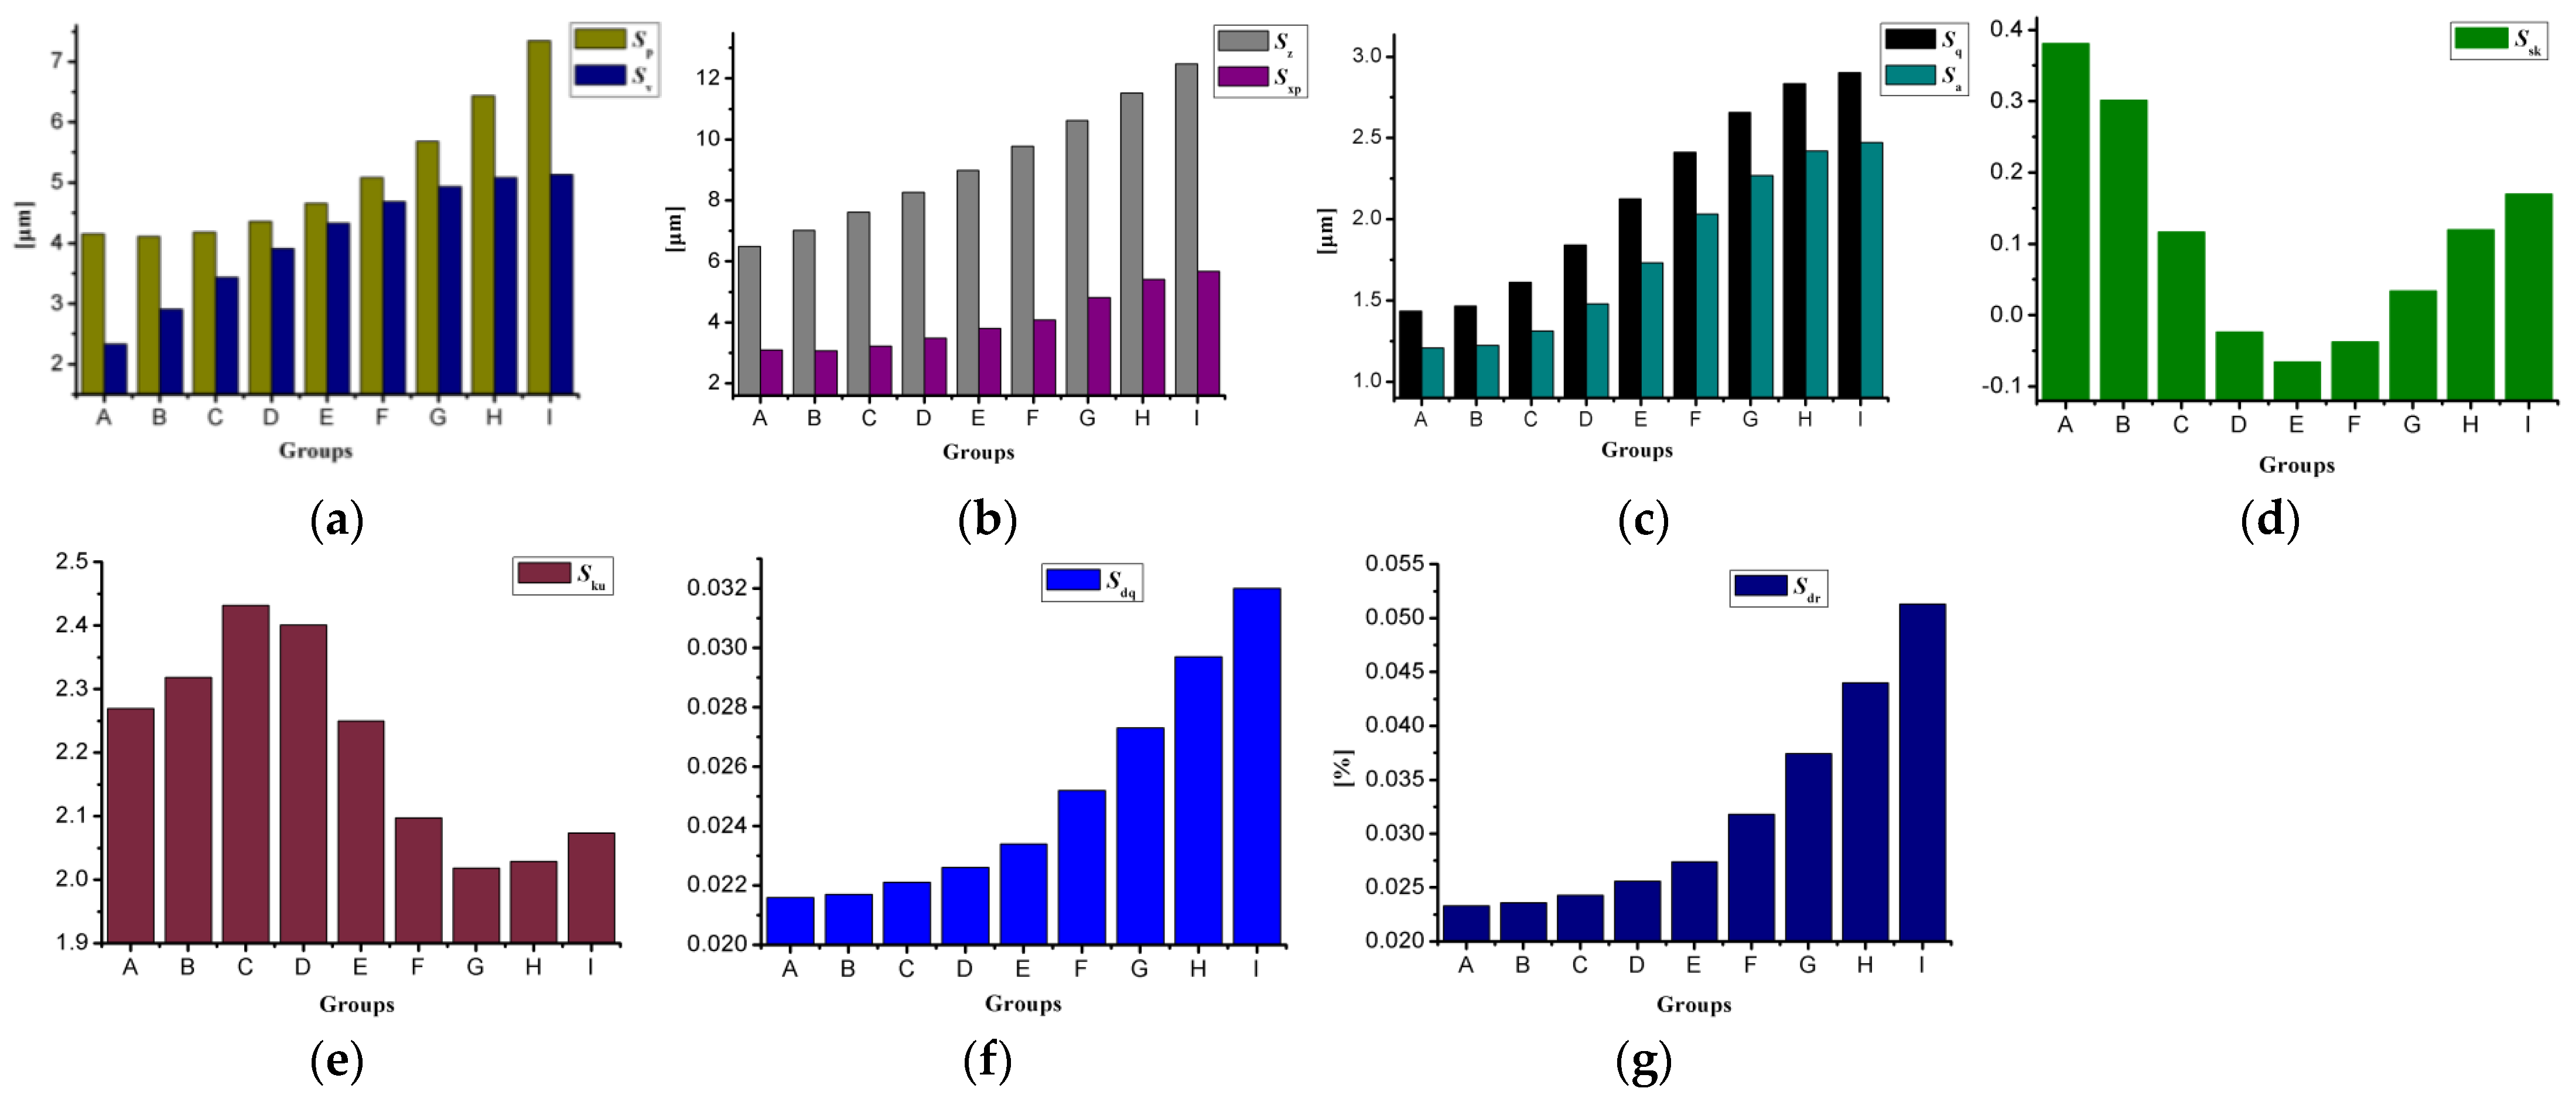
4.1. Surface Texture Parameters

According to the established three-dimensional surface model, extract the point cloud data of the surface topography. According to the ISO25178-2 standard [27], calculate the surface texture parameters under different topographic features. Its value is shown in Table 3, and the change rule of the surface texture parameters is shown in Figure 4.
The height parameters Sp, Sv, and Sz are used to characterise the maximum peak, the maximum valley depth, and the maximum height in the surface topography. From Figure 4a,b, it can be seen that along with the gradual increase in the cutting vibration difference in neighbouring cutter teeth, Sp, Sv and Sz all increase. It shows that along with the increase in t-value, the peaks of the surface topography are higher, the valleys are deeper, the peaks and valleys are more distinctive, and the overall height of the topography is higher. Sxp is the difference in height between 2.5% and 50% of the surface topography and is used to characterise the height of the surface peak after the removal of the top peak. As shown in Figure 4b, along with the gradual increase in t-value, the value of Sxp increases, and the topographical peak section characteristic becomes more significant.
Sq and Sa are the two most widely used parameters in the study of surface texture parameters, which are defined as the root mean square height and the arithmetic mean height of the points in the surface topography, respectively. From Figure 4c, it can be seen that along with the gradual increase in t-value, the values of Sq and Sa also increase, indicating that the peaks and valleys characteristics of the surface are more significant, which is consistent with the previous analyses of Sp, Sv, Sz, and Sxp.
Ssk is defined as the skewness of the surface topography and is used to characterise the degree of inclination of the surface topography. Figure 4d reflects the change characteristics of Ssk under the influence of the t-value, and it can be seen that along with the gradual significant peak and valley characteristics, the value of Ssk decreases and then increases, and its minimum value is less than zero, which indicates that the dominant characteristic of the surface topography feature, i.e., the degree of concavity and convexity, is not constant, and it is changed with the significant peak and valley characteristics of the surface topography.
Sku is the kurtosis in the surface texture parameter used to characterise the sharpness of the surface topography. From Figure 4e, it can be seen that, along with the gradual significant peaks and valleys of the topography, the value of Sku shows a trend in increasing, then decreasing, and then increasing, and its value is always less than 3, and the surface topography does not show the characteristics of the spikes.
Sdq is characterised as the root mean square of the slopes at all points on the surface topography and is a holistic metric parameter of the surface slopes, and Sdr is the extended area rate of the surface topography. From Figure 4f,g, it can be seen that when the peak and valley characteristics of the surface are gradually significant, the values of Sdq and Sdr subsequently increase, indicating that both the overall slope and the extended area of the surface topography are subsequently increased.
Based on the above analysis, it can be seen that when the surface topography changes, different surface texture parameters will show different change rules; in order to explore the intrinsic variation rules of the surface topography features, it is necessary to analyse the correlation characteristics between the surface texture parameters.

4.2. Correlation Analysis between Surface Texture Parameters
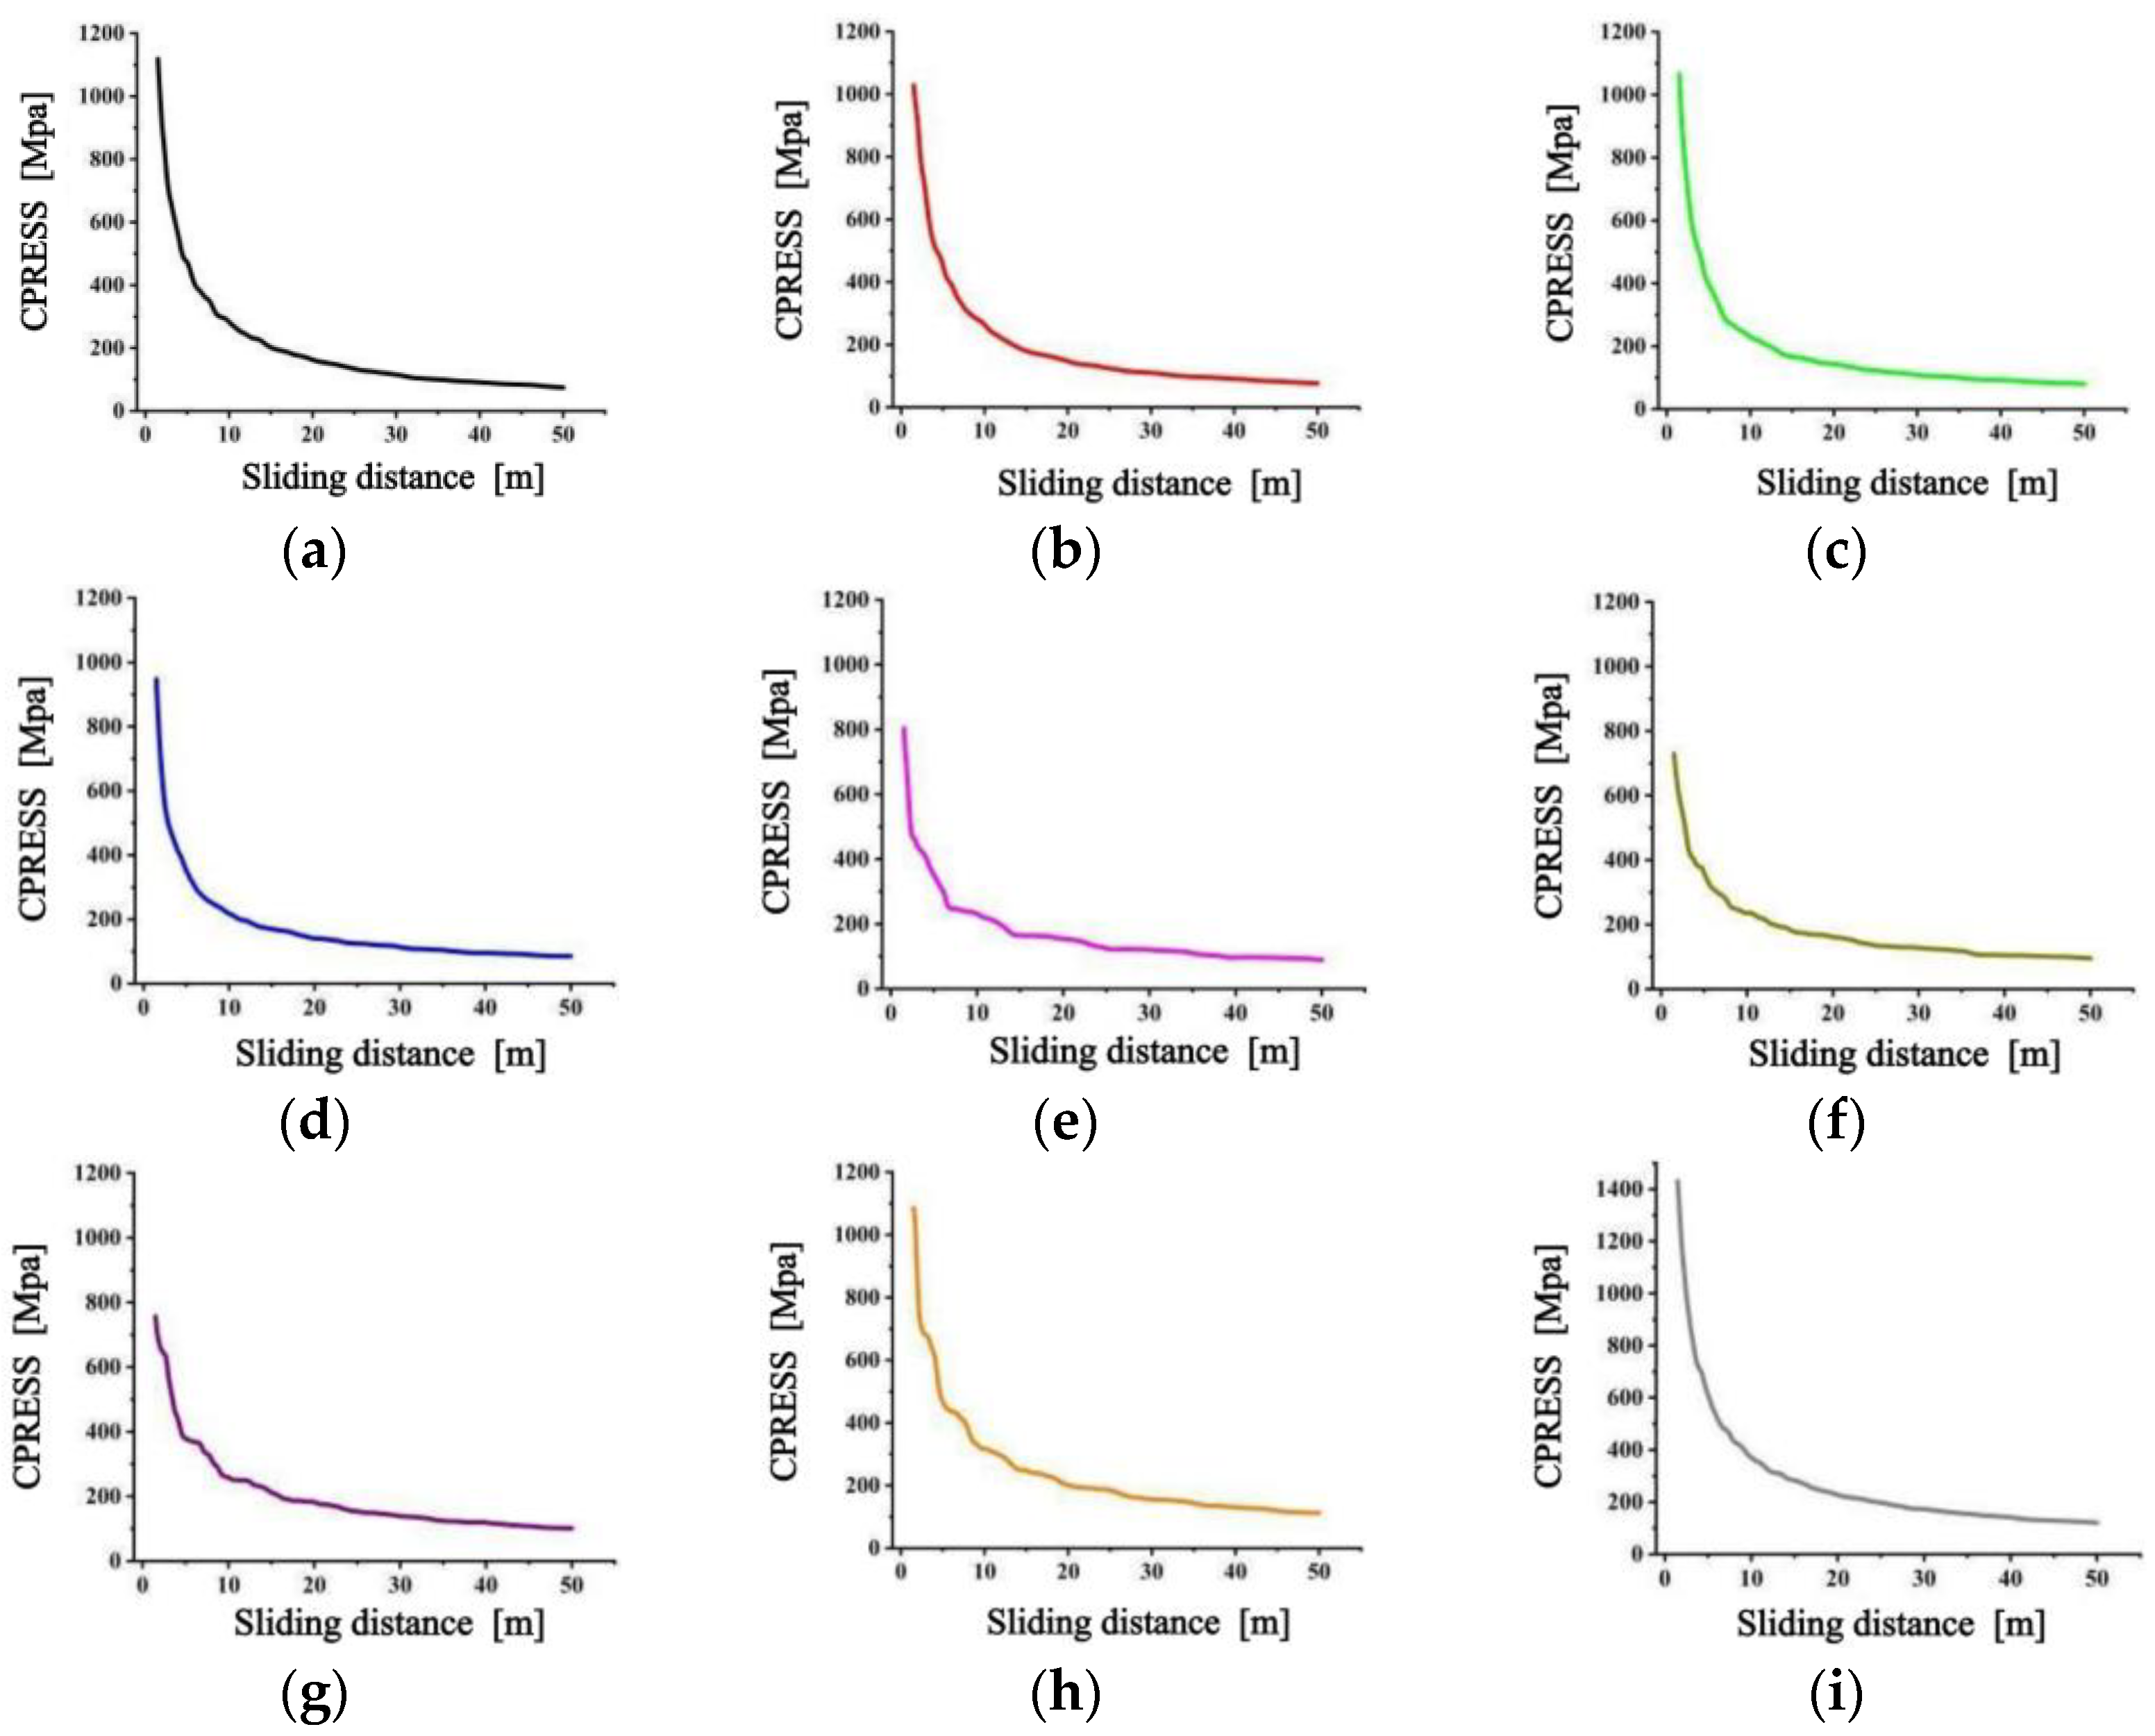
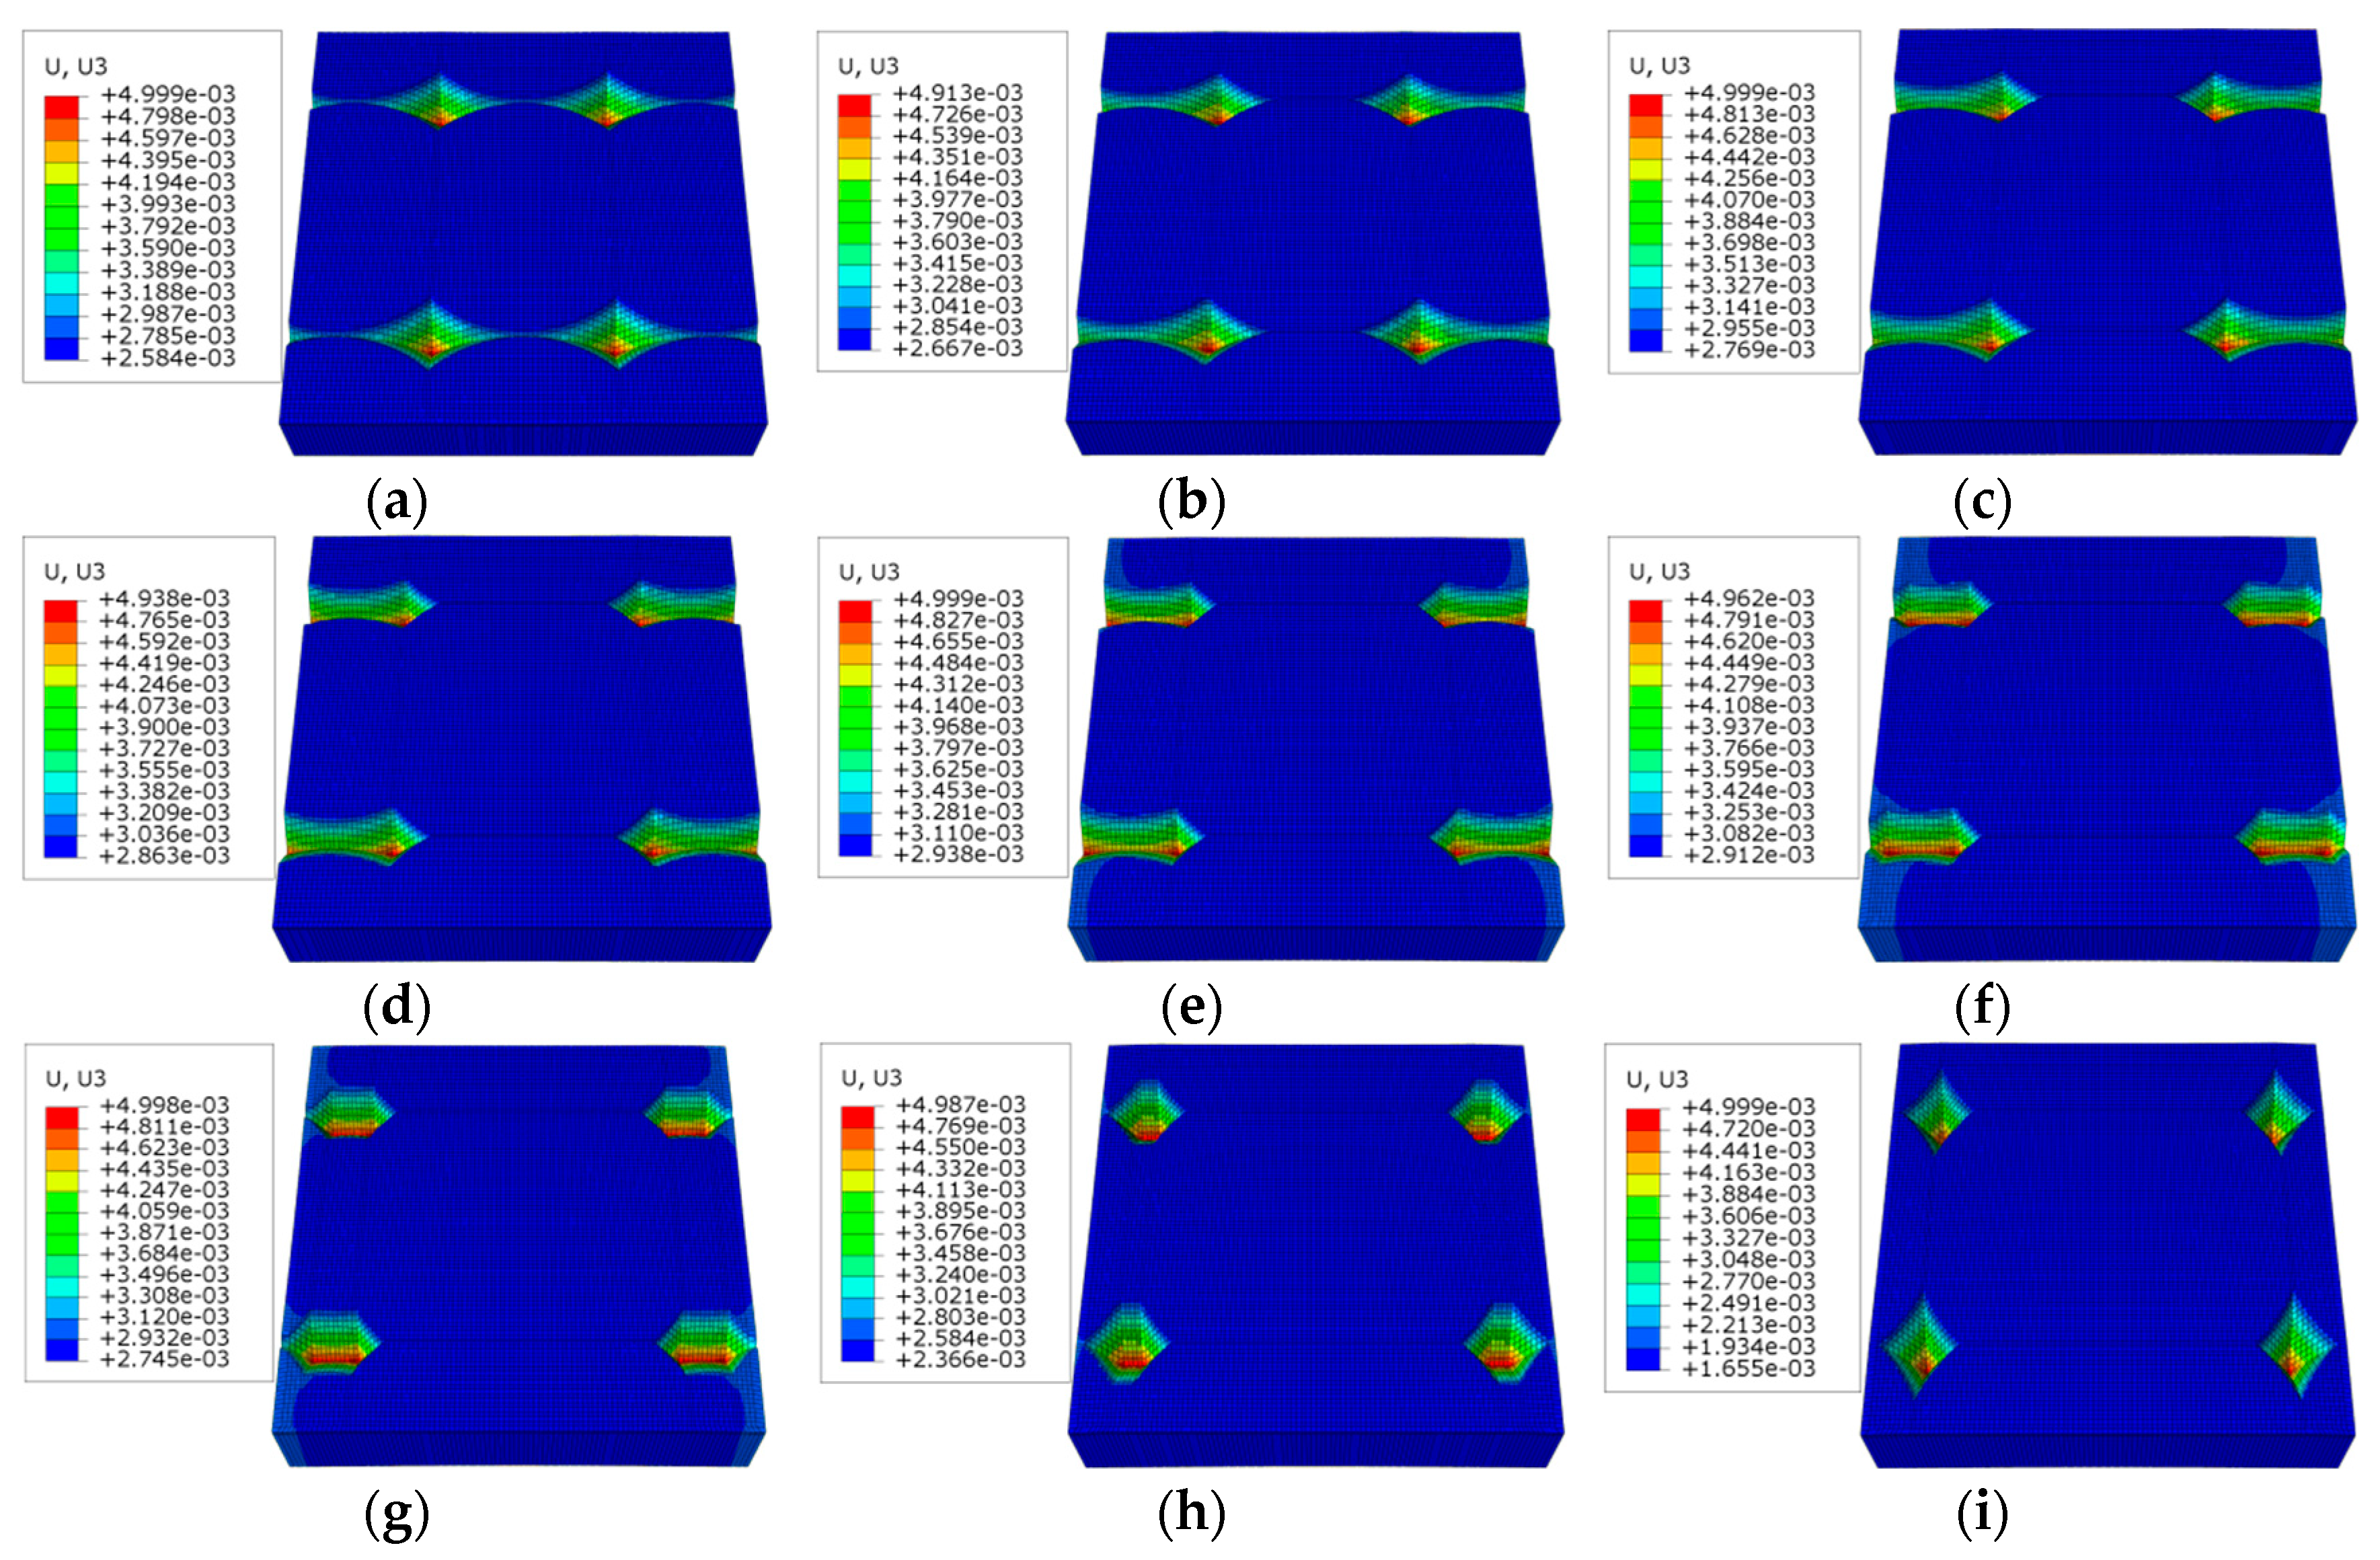
The 3D surface texture parameters reflect the true surface topographic characteristics and are the most commonly used way to characterise the surface topography. Based on the ISO25178-2 standard, it can be seen that there is a wide variety of surface texture parameters, and the definition of each parameter is different, but all of them are derived from the texture characteristics of the surface topography, so there must be a correlation between each parameter. Exploring the correlation between surface texture parameters is of great significance to clarify the intrinsic correlation between surface topographic parameters and revealing the mechanism of the influence of surface topographic features on functional features.
In this paper, based on the proposed improved correlation analysis model, the degree of correlation between surface texture parameters was calculated using Equations (3)–(10) in conjunction with the texture parameters of the nine groups of surface topographies, as shown in Table 4.
It can be seen from Table 4 that the degree of correlation between the surface texture parameters varies, with the maximum value of correlation being 0.9516 and the minimum value of correlation being 0.5629. When the correlation is greater than 0.9, it indicates an extremely strong correlation between the two parameters. From Table 4, there are four pairs of surface texture parameters with correlations greater than 0.9, and they are Sdq and Sdr, Sq and Sa, Sp and Sdq, and Sp and Sdr.
Based on the ISO25178-2 standard, it can be seen that both Sq and Sa are the characterisation parameters of the surface topography’s overall features. As can be seen from Figure 4c, when the peaks and valleys of the surface topography are gradually significant, the parameters Sq and Sa both show a gradual increase in the trend of change. The variation laws of Sq and Sa are similar, and the correlation degree between them is 0.9241, which is an extremely strong correlation with each other.
Based on the ISO25178-2 standard, it can be seen that both Sq and Sa are the characterisation parameters of the surface topography overall features. As can be seen from Figure 4c, when the peaks and valleys of the surface topography are gradually significant, the parameters Sq and Sa both show a gradual increase in the trend of change. The variation laws of Sq and Sa are similar, and the correlation degree between them is 0.9241, which is an extremely strong correlation with each other.
The degree of correlation between the parameters Sp, Sdq, and Sdr are all greater than 0.9, indicating a very strong correlation between the three parameters. This is due to the fact that as the value of t gradually increases, the peaks of the surface topography are higher, which also leads to an increase in the slope and an extended area ratio of the surface topography; hence, there is an extremely strong correlation between the three parameters.
As can be seen from Table 4, the correlation between the surface topography holistic characterisation parameters Sq, Sa, Sdq, Sdr, and the maximum peak height Sp is stronger than the maximum valley depth Sv, which indicates that the surface topography features are more influenced by the peaks.

4.3. Sliding Wear

During sliding wear, the contact area varies from surface to surface, which results in different contact pressures. According to the Archard model, it is known that the amount of material removal in the sliding wear process is directly proportional to the contact pressure, so the contact pressure is an important evaluation parameter of the surface friction and wear performance. According to Hertz theory, when the external normal load is the same, the contact pressure is different under different contact areas, so the contact pressure is closely related to the surface topography. The variation characteristics of contact pressure at different t values are shown in Figure 5.
It can be seen from Figure 5 that the variation trends in the contact pressures on the nine groups surfaces during sliding wear are approximately the same. The contact pressure is high at the initial stage and decreases rapidly as the sliding wear distance increases when the surface is in the abrasive wear stage. When the sliding wear enters into the stable wear stage, the surface contact pressure gradually smooths out, and the contact pressure of different surfaces varies under the same sliding distance.
Based on the Archard model, it can be seen that different contact pressures will lead to different wear amounts; in order to more clearly reflect the variation trend in the wear characteristics under different surface topography, the deformation scale factor in the ABAQUS finite element simulation analysis is set to 50, and the wear deformation characteristics of nine groups surfaces in the process of sliding wear are shown in Figure 6.
From Figure 6, it can be seen that the wear deformation characteristics of different surfaces are not the same when the conditions such as normal load and sliding distance are exactly the same. In order to better evaluate the wear variation characteristics of the different surfaces, the relative wear rate of per unit sliding distance ∆V is defined, where s denotes the sliding wear distance, V(A) is the wear volume of group A, vs. denotes the wear rate per unit sliding distance, and KV is the relative wear rate of per unit sliding distance.
V s ( j ) = V ( j ) s , j = A , B , , I
K V ( j ) = V s ( j ) K V s ( A ) , j = A , B , , I
The introduction of the K can more fully reflect the variability of the wear characteristics of different surfaces, and the K will change when external conditions such as external load and sliding distance are changed. KV is the difference in wear rate per unit sliding distance compared to group A, which gives a better response to the variability of the wear characteristics on different surfaces. Its value being greater than 1 indicates that the wear rate is greater than group A, and it being less than 1 indicates that its wear rate is less than group A. The smaller the value of KV is, the smaller its wear rate is, and the better the wear resistance is. The specific values of KV are shown in Table 5. Based on Table 5, in this paper, K is taken as 1.658 × 10⁻⁹ mm2.
As can be seen from Table 5, along with the gradual increase in t, the peaks and valleys of the surface topography are more significant, the overall topography characteristics are changed, the surface texture parameters are subsequently changed, and their wear characteristics are also different. It can be seen that the wear characteristics are properties of the contact surfaces themselves and are related to the topographical characteristics of the surfaces.

4.4. Predictive Analysis of Wear Characteristics

From the above analysis, it can be seen that the wear characteristics of the surface are closely related to the topographical features; for this reason, this paper investigates the correlation between KV and the surface texture parameters by using an improved correlation analysis model, as shown in Table 6.
As can be seen from Table 6, the correlation between surface texture parameters and wear characteristics varies. The maximum value of the degree of correlation is only 0.7172, and there is no surface texture parameter that has a very strong correlation with KV, which also indicates that the wear characteristics of the surface are an overall property of the surface, an overall reflection of the surface’s topographical features, and are not affected by a single one only. Therefore, it is inaccurate to study the wear characteristics of a surface based only on a single parameter.
The correlation between the wear characterisation evaluation parameter KV and the surface texture parameters is in order from strongest to weakest: Sku, Sa, Sq, Sxp, Sp, Sdq, Ssk, Sdr, Sv, Sz. From the previous analyses, it is clear that Sdq and Sdr, Sq and Sa, Sp and Sdq, and Sp and Sdr are extremely correlated and can be substituted with each other. In this paper, the surface texture parameters with a correlation degree greater than 0.6 are selected for evaluating the wear characteristics of the surface, i.e., Sku, Sa, Sxp, Sp, and Ssk, and the wear prediction model based on the surface texture parameters is established.
A GM (0,5) prediction model for the relative wear rate of per unit sliding distance KV was developed based on Equations (11)–(15).
Let the GM (0,5) model after the dimensionless treatment be K V ( 1 ) = b 1 S k u ( 1 ) + b 2 S a ( 1 ) + b 3 S x p ( 1 ) + b 4 S p ( 1 ) + b 5 S s k ( 1 ) + a , then
B = [ 2.0215 2.0137 1.9929 1.9900 1.7904 1 3.0929 3.1011 3.0333 2.9968 2.0965 1 4.1508 4.3271 4.1602 4.0468 2.0352 1 5.1424 5.7619 5.3891 5.1677 1.8631 1 6.0664 7.4448 6.7096 6.3925 1.7647 1 6.9558 9.3265 8.2677 7.7604 1.8536 1 7.8496 11.3326 10.0168 9.3102 2.1679 1 8.7634 13.3810 11.8486 11.0791 2.6128 1 ]
Y ¯ = [ 2.0529 3.1731 4.3846 5.7644 6.6827 7.6058 8.6016 9.6779 ] T
This yields least squares estimates of the model coefficients
b ^ = [ b 1 b 2 b 3 b 4 b 5 a ] = ( B T B ) 1 B T Y ¯ = [ 0.6753 1.6615 1.8153 0.5273 0.8935 0.9772 ]
Then, the dimensionless coefficient of the KV is predicted as
K V ( 1 ) = 0.6753 S k u ( 1 ) 1.6615 S a ( 1 ) + 1.8153 S x p ( 1 ) + 0.5273 S p ( 1 ) 0.8935 S s k ( 1 ) + 0.9772
From this, the predicted values of the KV can be obtained, as shown in Table 7.
As can be seen from Table 7, the average error in the prediction of KV is 2.18%, which indicates that the prediction model has a high degree of accuracy and is able to accurately reflect the basic characteristics of the data. Surface wear resistance is closely related to topographic features, and KV is a quantitative evaluation parameter of wear resistance, so the establishment of a KV prediction model based on surface texture parameters is of great significance for evaluating surface wear resistance.
Establishing a prediction model for wear resistance based on surface texture parameters is of great significance in revealing the wear resistance mechanism of surface morphology and guiding the functional manufacturing of surfaces.

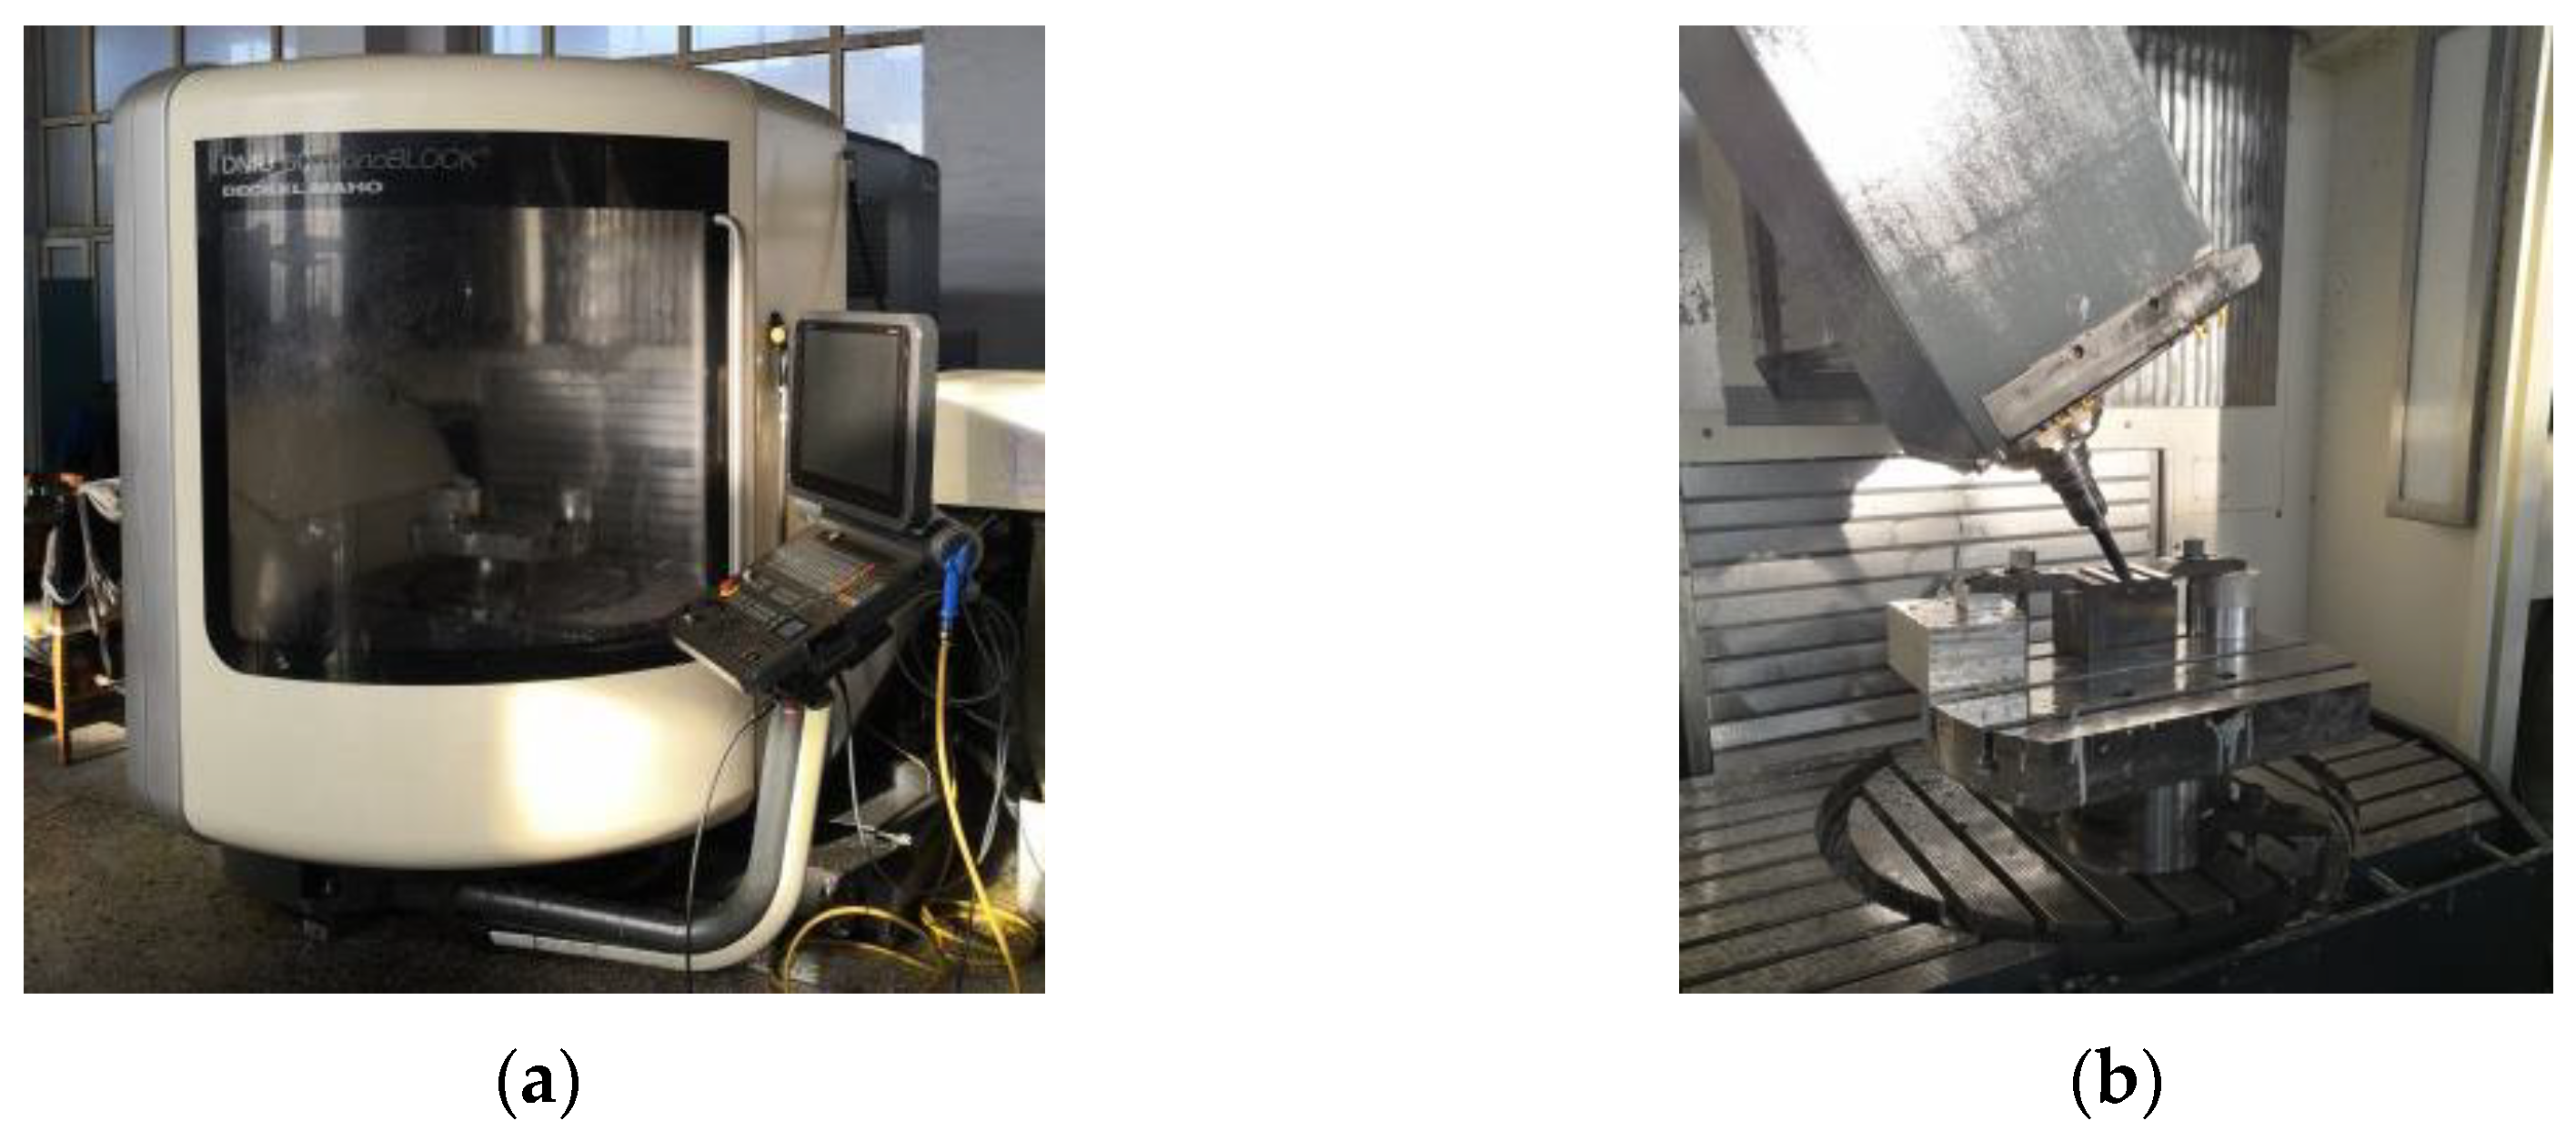
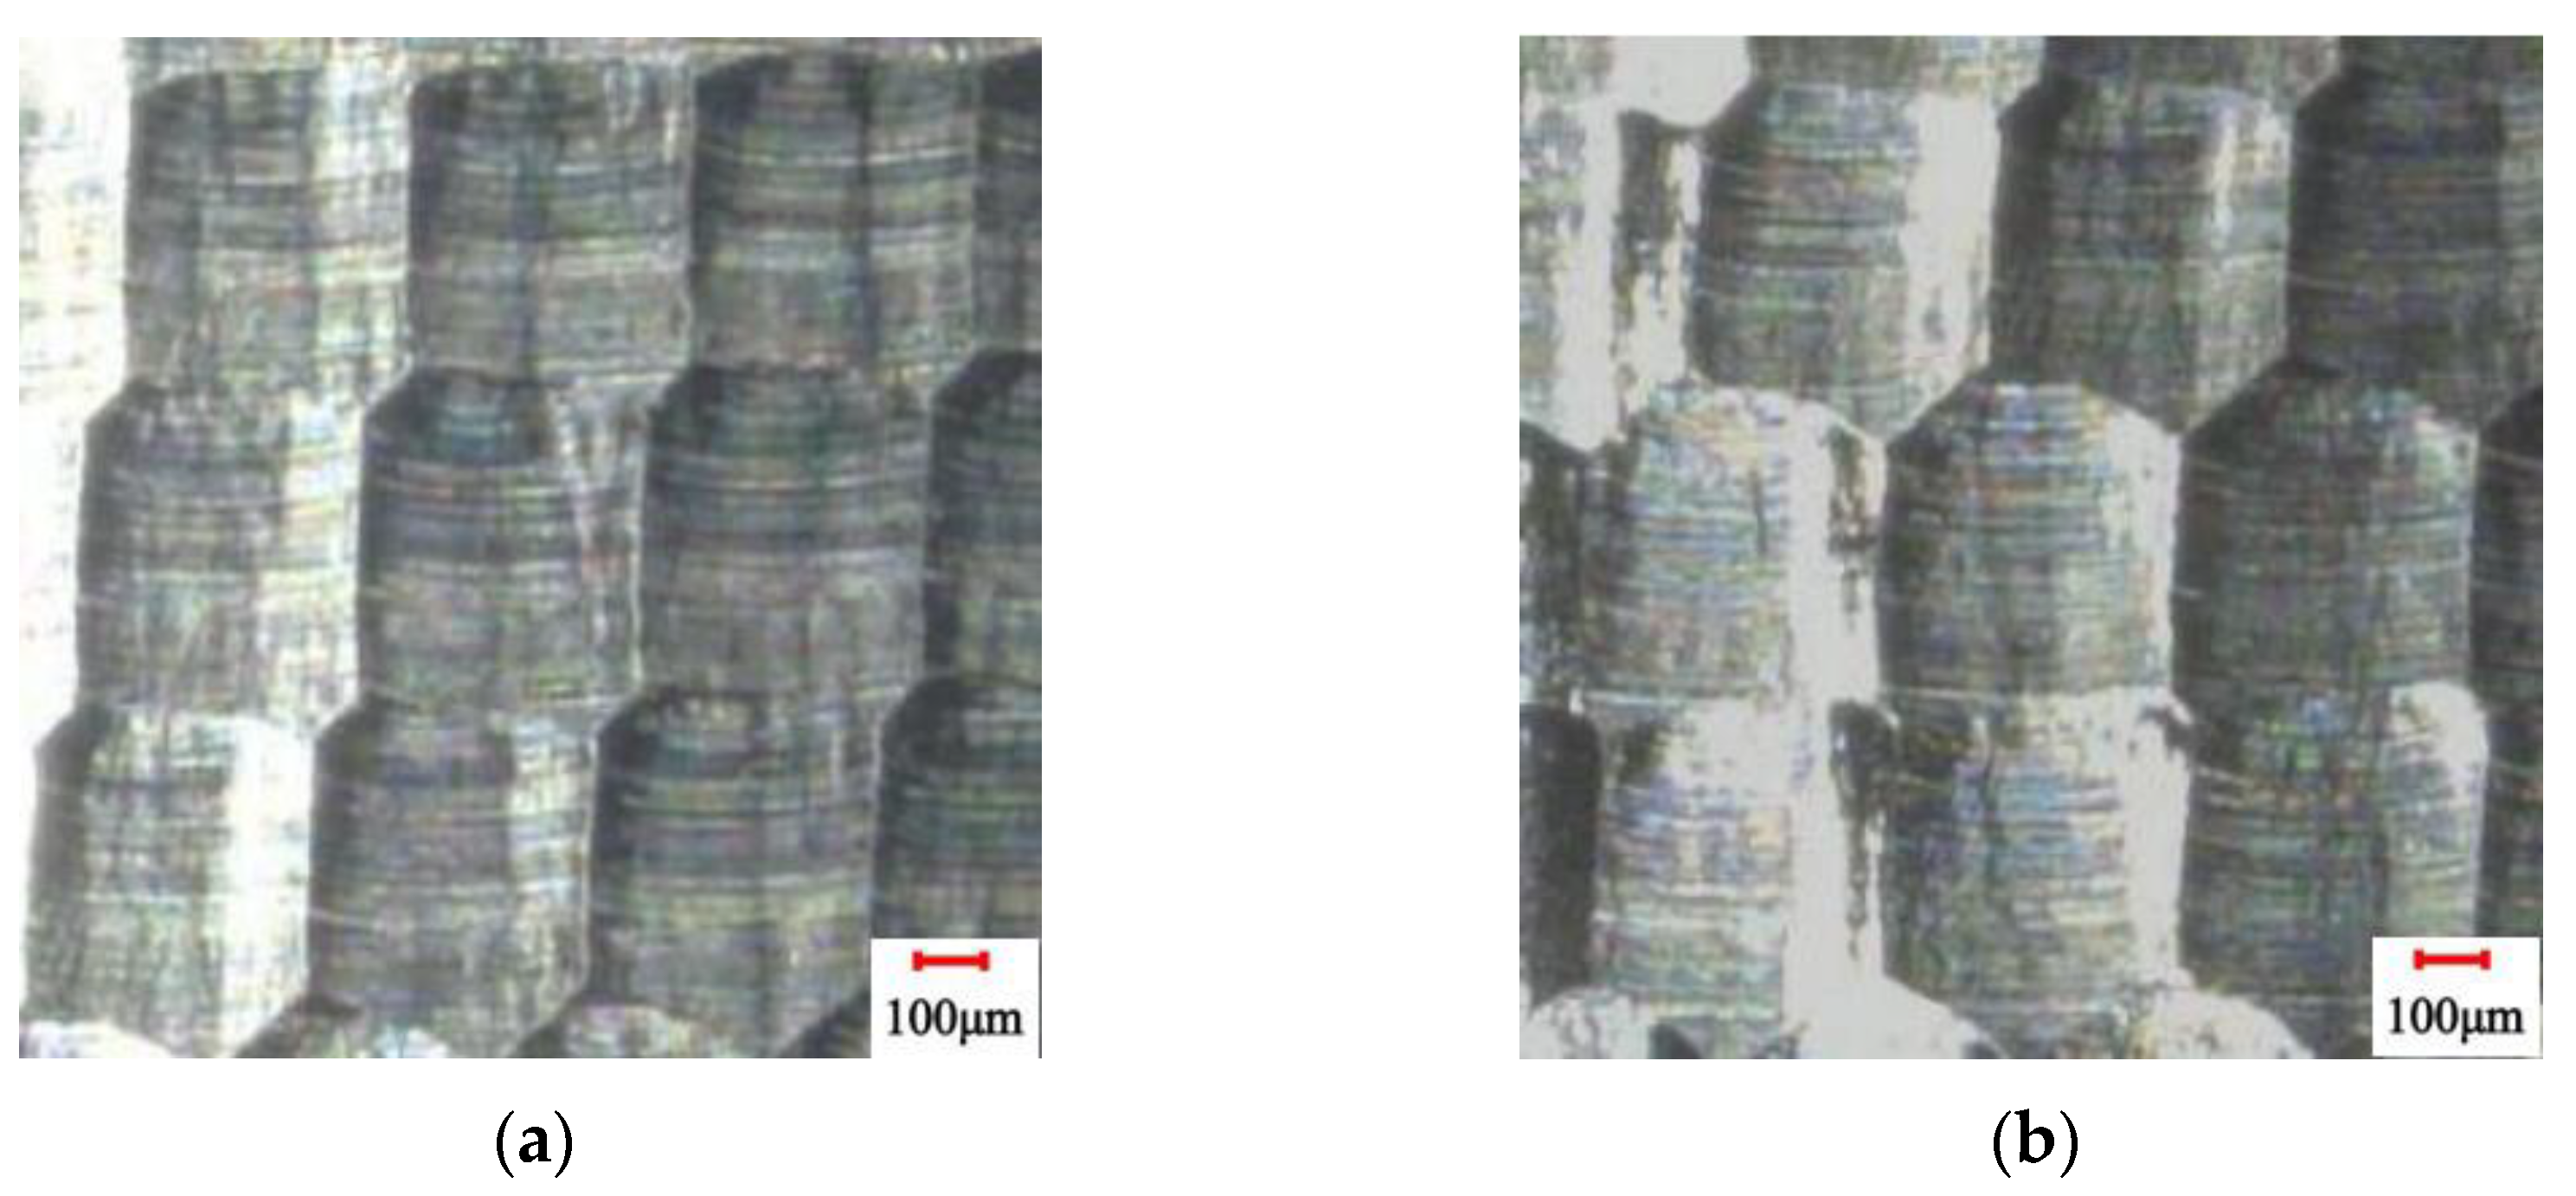
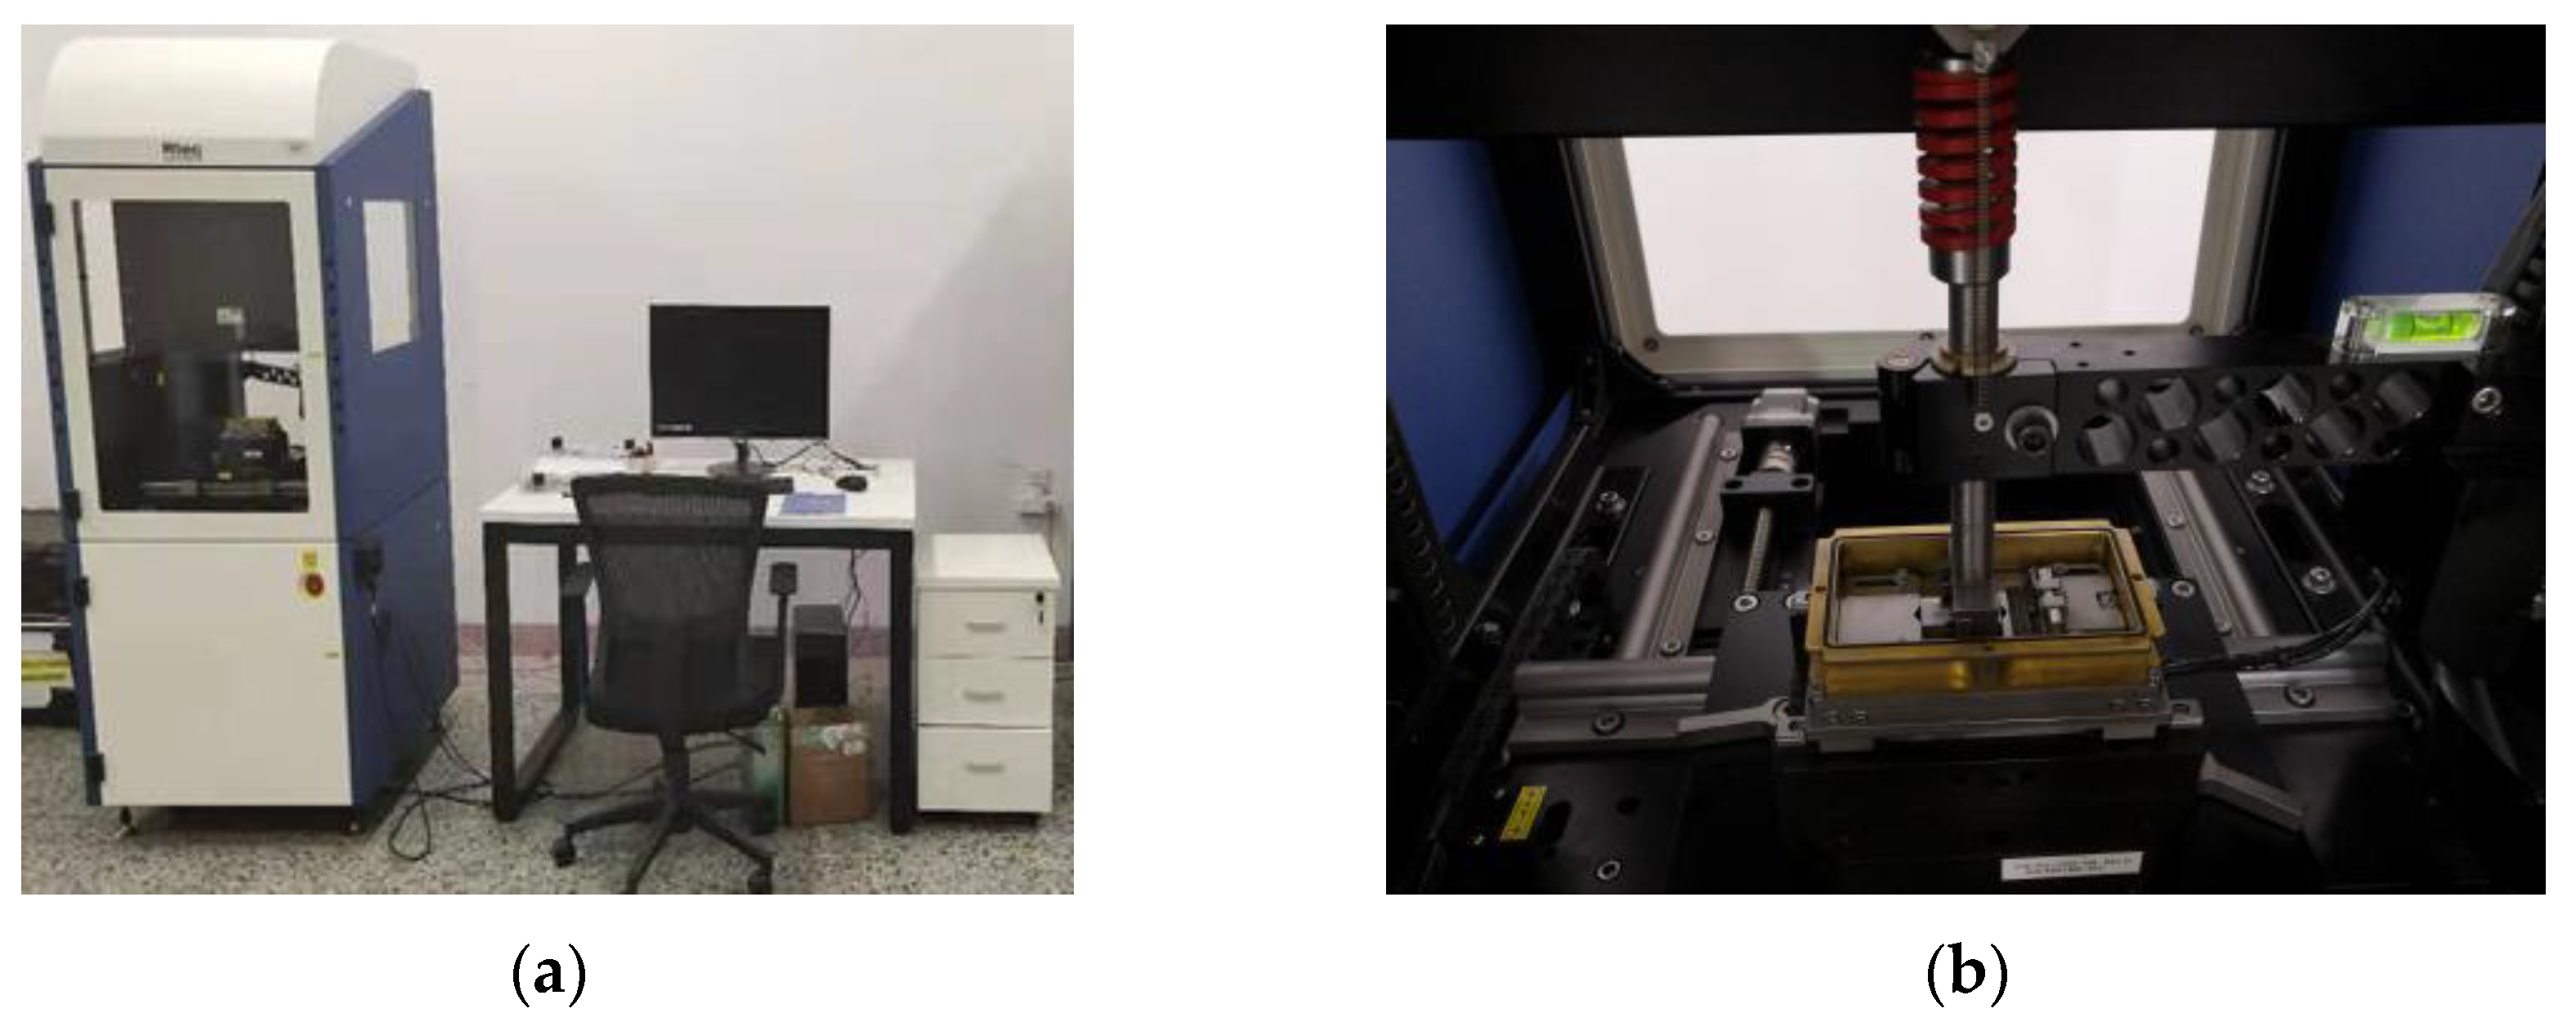
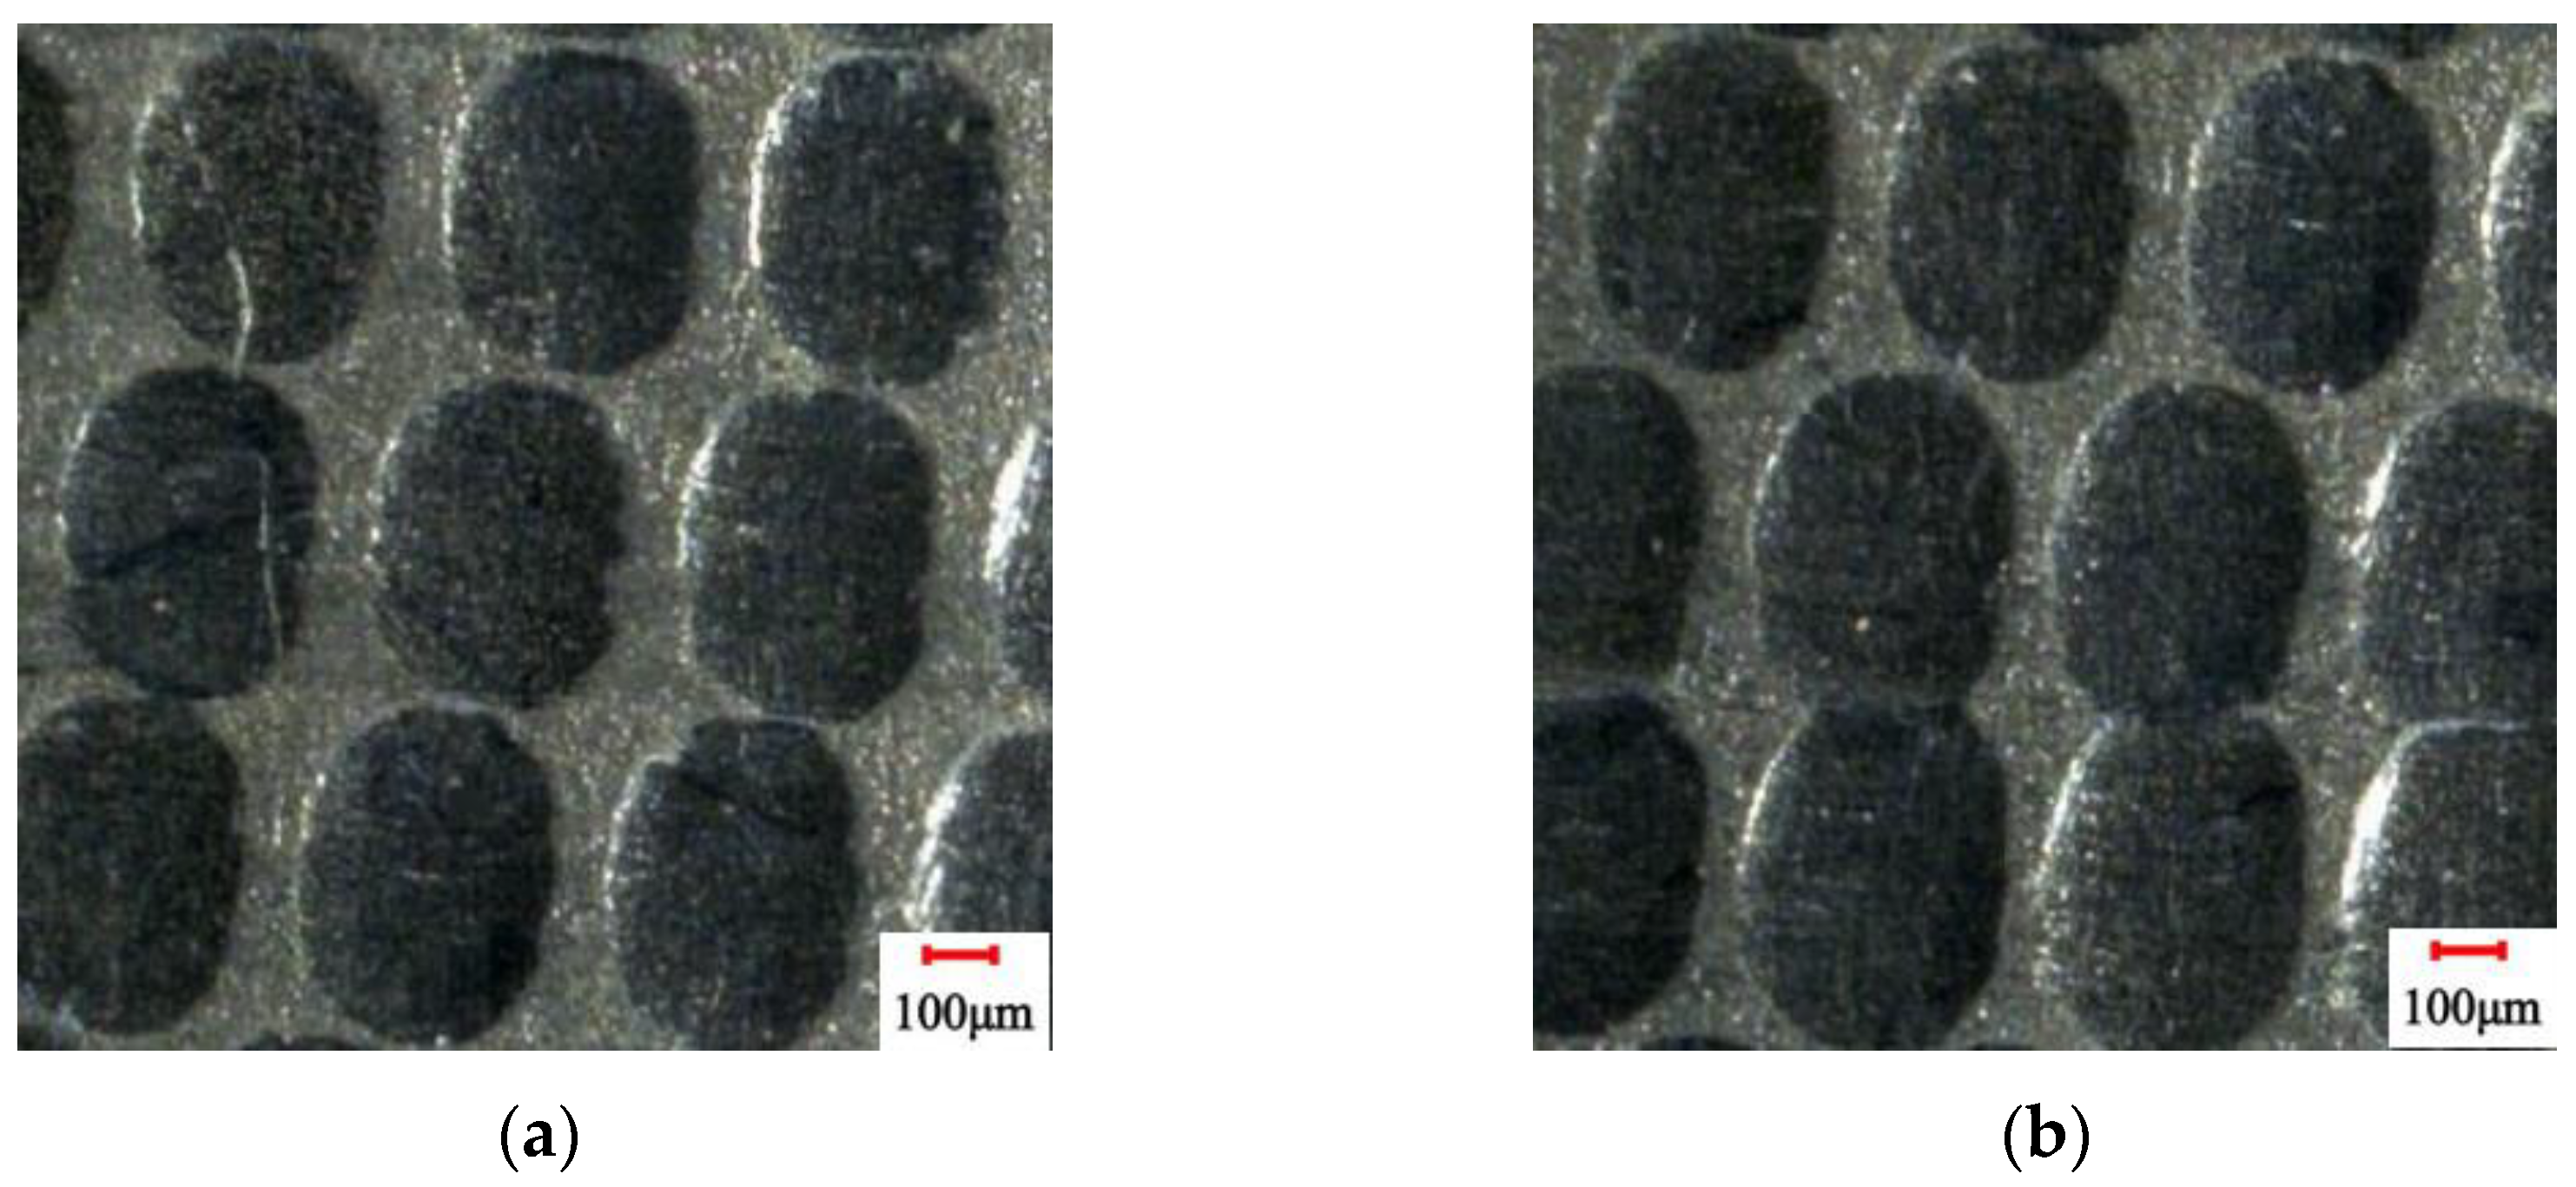
5. Experimental Verification

In order to investigate the correlation between surface topographical features and functional properties under the influence of multiple factors, a set of high-speed ball-end milling experiments were designed in this paper, as shown in Table 8. Here, S is the spindle speed, ae is the depth of cut, fz is the feed per tooth, and ap is the depth of cut.
The material of the workpiece in the ball-end milling experiment is hardened mould steel Cr12MoV, the hardness after quenching is 60HRC, the ball-end milling machining equipment is a 5-axis vertical machining centre DMU60monoBLOCK (Bielefeld, Germany), as shown in Figure 7. The shank is BNMM-200075S-S20 ball-end milling shank, the blade is two-tooth ball-end milling cutter, the diameter of the blade is 20 mm, and the material model is JC6102, as shown in Figure 8.
The surface after high speed milling is shown in Figure 9. And then the 3D surface texture parameters of the machined surface topography were measured using CCI Map Taylor Hobson non-contact white light interferometer, as shown in Figure 10. Its filtering technology is specified by ISO/TS 16610, and the related basic parameters are as follows: the vertical resolution is 0.01 nm, the optical resolution (X, Y) is 0.4–0.6 μm, the maximum data points is 1,048,576, and the noise floor is less than 0.08 nm [18].
The surface texture parameters were extracted for the two groups of surface topography, as shown in Table 9.
Based on the data in Table 9, the wear resistance of the two groups surfaces can be predicted based on Equations (11)–(15). The KV values of group M and group N are 1.3402 and 1.9867, respectively. The KV value of group M is smaller, indicating that under the same conditions, it has less wear and better wear resistance.
It should be noted that the wear characteristics prediction model established in this paper is completed under a specific load, sliding distance, and other conditions. When the wear conditions change, its value will produce differences, but according to this, determineing the strength of the surface wear resistance is still feasible.
The workpiece was prepared as a rectangular piece with a length of 30 mm, a width of 16 mm and a height of 6 mm, and was subjected to reciprocating sliding friction and wear experiments with the MFT-5000 multifunctional friction and wear tester (San Jose, CA, USA), as shown in Figure 11.
The surface after sliding wear is shown in Figure 12.
An electronic balance with an accuracy of 1 × 10⁻⁴ g was used to measure the wear amount of the two groups workpieces. The specific data are shown in Table 10.
Comparing the ΔV values of the two groups of workpieces in Table 10, it can be seen that group M is smaller than group N, which indicates that the surface wear resistance of the workpieces in group M is better, which is consistent with the prediction results, and this also shows the correctness of the GM (0,5) prediction model established in this paper.
Studying the tribological properties of surfaces based on surface texture parameters is of great significance to investigate the tribological mechanism of surfaces and guide the functional manufacturing of surfaces. However, there are many kinds of surface texture parameters, so it is necessary to further standardise the surface texture parameters and establish a more reasonable set of characterisation parameters to investigate the functional properties of surfaces.

6. Conclusions

In this paper, based on the different vibration difference in adjacent cutter teeth in the ball-end milling process, nine groups topographic features of the machined surface were established. According to this, the characterisation and analysis of the surface topography and wear performance research were completed, and the specific conclusions are as follows:
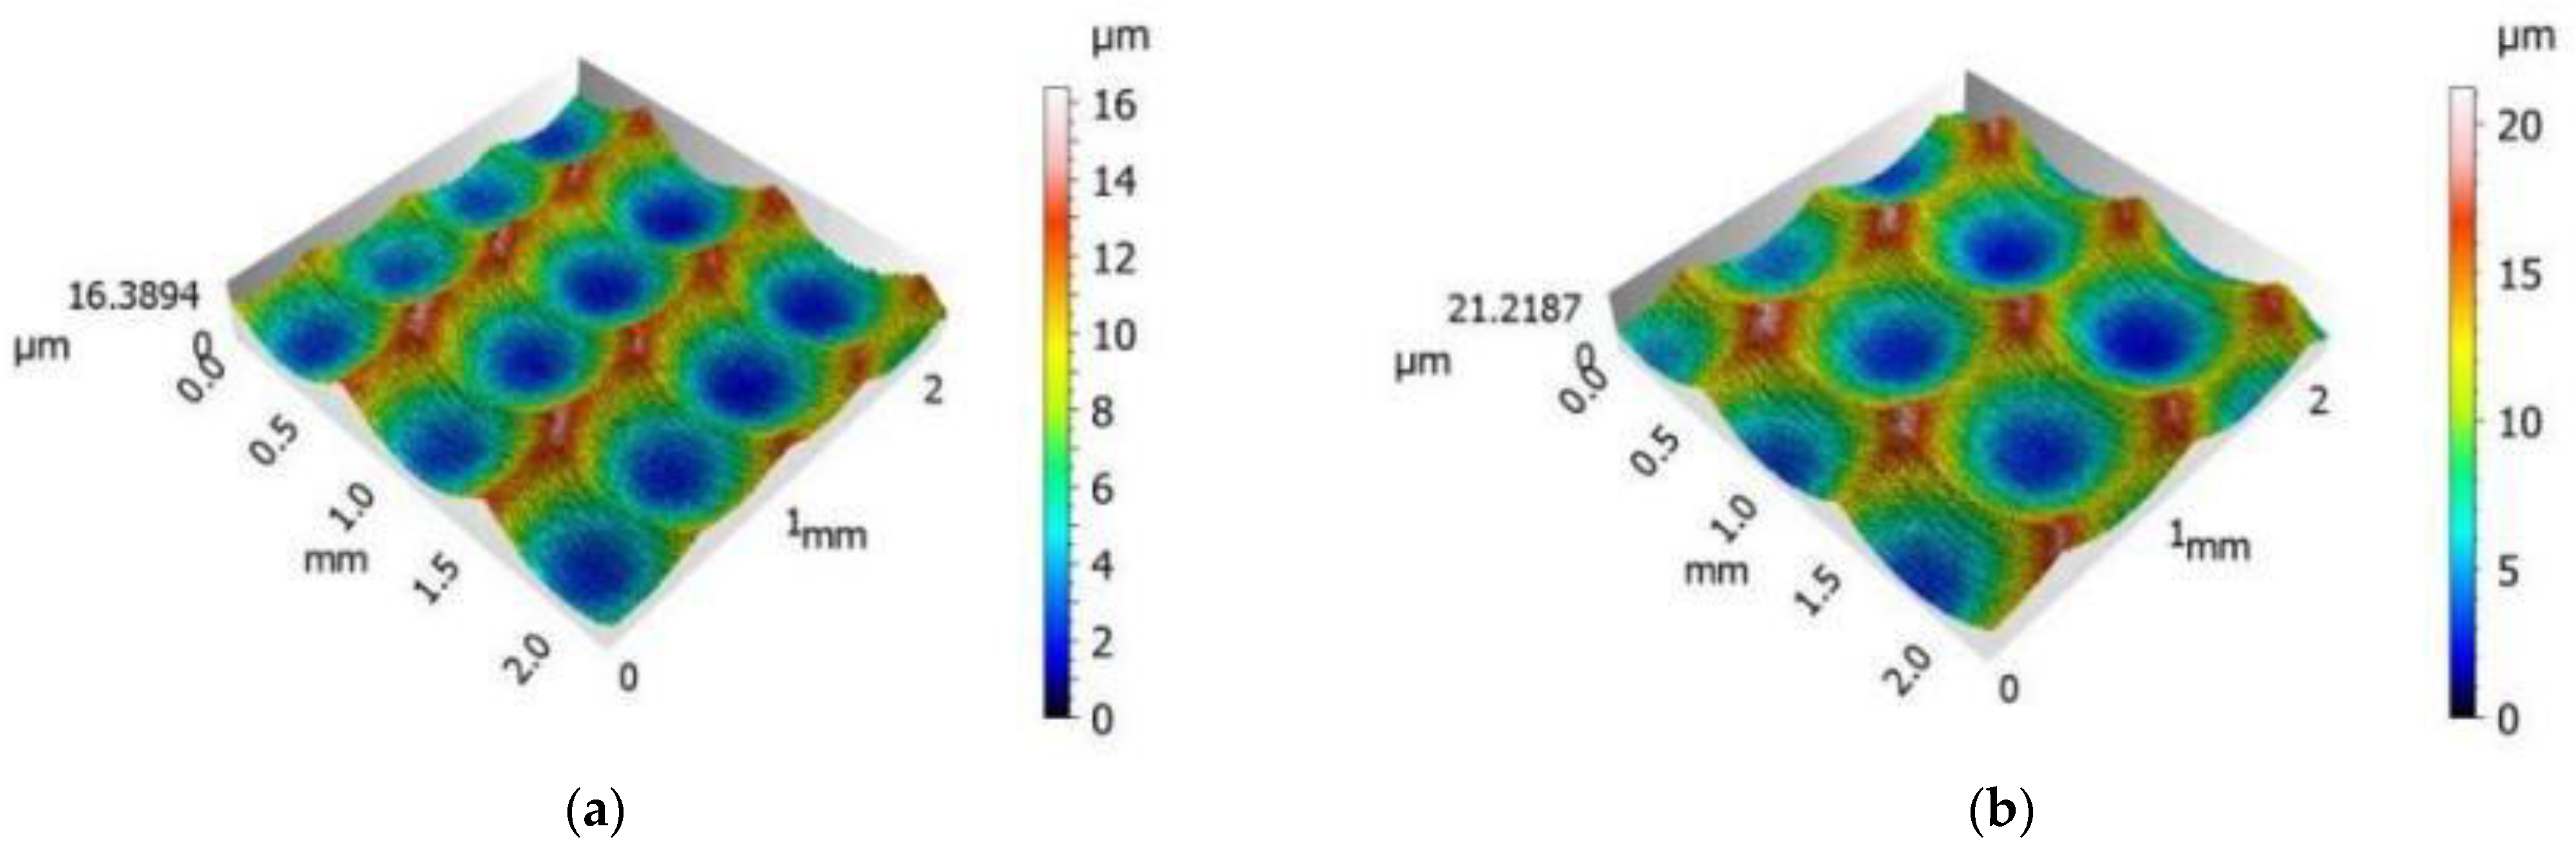
  • It is found that the peaks and valleys of the surface topography are more and more significant along with the gradual increase in the t-value, and the surface texture parameters Sp, Sv, Sz, Sxp, Sa, Sq, Sdq, and Sdr are gradually increased.
  • An improved correlation analysis model is developed, and the correlations between surface texture parameters are analysed. Extremely strong correlations are found between the parameters Sq and Sa and between Sp, Sdq, and Sdr.
  • The evaluation parameter KV for surface wear characteristics was proposed, and it was found that the correlation between the surface texture parameters and KV was in order from strongest to weakest: Sku, Sa, Sq, Sxp, Sp, Sdq, Ssk, Sdr, Sv, Sz.
  • A prediction model for the wear feature evaluation parameter KV was established based on Sku, Sa, Sxp, Sp, and Ssk, and the wear resistance prediction analysis based on the surface texture parameter was realised. The correctness of the model was verified by experiments.

Author Contributions

Conceptualization, B.W. and W.Z.; methodology, B.W.; validation, B.W., Z.L. and W.Z.; formal analysis, B.W.; investigation, B.W.; resources, B.W.; data curation, Z.L.; writing—original draft preparation, B.W.; writing—review and editing, B.W.; visualisation, B.W.; supervision, B.W.; project administration, B.W.; funding acquisition, B.W. and W.Z. All authors have read and agreed to the published version of the manuscript.

Funding

This research was funded by the Scientific and Technological Research Projects of Henan Province, grant number 242102220085; the key project of colleges and universities of Henan Province, grant number 24B460013; and the National Natural Science Foundation of China, grant number 51775151.

Institutional Review Board Statement

Not applicable.

Informed Consent Statement

Not applicable.

Data Availability Statement

Data are contained within the article.

Conflicts of Interest

The authors declare no conflicts of interest.

Nomenclature

tVibration difference of adjacent teeth during ball-end milling.
SaArithmetical mean height.
SqRoot mean square height.
SpLargest peak height.
SvLargest pit height.
SzLargest height.
SskSkewness.
SkuKurtosis.
SxpDifference in height between the 2.5% and 50% material ratio.
SdqRoot mean square gradient.
SdrDeveloped interfacial area ratio.

References

  1. Zhang, N.; Zhan, X.; Li, Z.; Liu, Y.; Ma, J.; Gao, J. Effect of squamous textured SiC on the dry-sliding tribological properties of graphite asperities. Wear 2024, 544, 205297. [Google Scholar] [CrossRef]
  2. Kang, J.; Lu, Y.; Yang, X.; Zhao, X.; Zhang, Y.; Xing, Z. Modeling and experimental investigation of wear and roughness for honed cylinder liner during running-in process. Tribol. Int. 2022, 171, 107531. [Google Scholar] [CrossRef]
  3. Lu, G.; Lu, W.; Shi, X.; Zhang, J.; Yang, Z.; Chen, W. Effects of Ni3Al matrix bio-inspired shell-like composite surface structure on interfacial tribological behaviors. Tribol. Int. 2022, 170, 107522. [Google Scholar] [CrossRef]
  4. Kaya, S.; Yılan, F.; Urtekin, L. Influences of Cr on the microstructural, wear and mechanical performance of high-chromium white cast iron grinding balls. J. Mater. Manuf. 2022, 1, 23–30. [Google Scholar] [CrossRef]
  5. Chen, H.; Xu, C.; Xiao, G.; Chen, Z.; Yi, M. Ultralow friction between steel surfaces achieved by lubricating with liquid crystal after a running-in process with acetylacetone. Tribol. Lett. 2018, 66, 68. [Google Scholar] [CrossRef]
  6. Chen, H.; Xu, C.; Xiao, G.; Yi, M.; Chen, Z.; Zhang, J. Analysis of the relationship between roughness parameters of wear surface and tribology performance of 5CB liquid crystal. J. Mol. Liq. 2022, 352, 118711. [Google Scholar] [CrossRef]
  7. Dzierwa, A.; Pawlus, P.; Zelasko, W. The influence of disc surface topography after vapor blasting on wear of sliding pairs under dry sliding conditions. Coatings 2020, 10, 102. [Google Scholar] [CrossRef]
  8. Duo, Y.; Tang, J.; Zhao, Z.; You, S.; Li, G.; Zhu, G. Discrimination of wear performance based on surface roughness parameters arithmetic mean height (Sa) and skewness (Ssk). Wear 2024, 548, 205397. [Google Scholar] [CrossRef]
  9. Dzierwa, A. Influence of surface preparation on surface topography and tribological behaviours. Arch. Civ. Mech. Eng. 2017, 17, 502–510. [Google Scholar] [CrossRef]
  10. Grabon, W.; Pawlus, P.; Woś, S.; Koszela, W.; Wieczorowski, M. Effects of honed cylinder liner surface texture on tribological properties of piston ring-liner assembly in short time tests. Tribol. Int. 2017, 113, 137–148. [Google Scholar] [CrossRef]
  11. Kaplan, M. A Study of Erosion Wear Behavior of Inconel-718 Nickel Based Superalloy at Different Impingement Angles. J. Mater. Manuf. 2023, 2, 10–19. [Google Scholar]
  12. Pawlus, P.; Reizer, R.; Wieczorowski, M. Functional importance of surface texture parameters. Materials 2021, 14, 5326. [Google Scholar] [CrossRef] [PubMed]
  13. Pawlus, P.; Reizer, R.; Wieczorowski, M.; Królczyk, G. Parametric description of one-process surface texture. Measurement 2022, 204, 112066. [Google Scholar] [CrossRef]
  14. Duo, Y.; Tang, J.; Fujia, X.; Wei, Z. Surface roughness characterization and inversion of ultrasonic grinding parameters based on support vector machine. J. Tribol. 2022, 144, 094501. [Google Scholar] [CrossRef]
  15. Korzynski, M.; Dudek, K.; Palczak, A.; Kruczek, B.; Kocurek, P. Experimental models and correlations between surface parameters after slide diamond burnishing. Meas. Sci. Rev. 2018, 18, 123–129. [Google Scholar] [CrossRef]
  16. Ding, Y.; Wang, J.; Zhao, H.; Feng, G.; Zhang, Y.; Kong, M.; Liu, E. Study on the Ball-End Milling Cutter Design and the Performance of Milling SiCp/Al. Integr. Ferroelectr. 2023, 235, 106–125. [Google Scholar] [CrossRef]
  17. Yang, S.; Liu, L.; He, C. Study on milling behavior of TiAlN coated tool with variable distribution density micro-texture. Machining Science and Technology 2024, 28, 74–97. [Google Scholar] [CrossRef]
  18. Zheng, M.; Wang, B.; Zhang, W.; Cui, Y.; Zhang, L.; Zhao, S. Analysis and prediction of surface wear resistance of ball-end milling topography. Surf. Topogr. Metrol. Prop. 2020, 8, 025032. [Google Scholar] [CrossRef]
  19. Wang, B.; Zheng, M.; Zhang, W. Analysis and prediction of wear performance of different topography surface. Materials 2020, 13, 5056. [Google Scholar] [CrossRef]
  20. Li, S.; Dong, Y.; Li, Y.; Li, P.; Yang, Z.; Landers, R.G. Geometrical simulation and analysis of ball-end milling surface topography. Int. J. Adv. Manuf. Technol. 2019, 102, 1885–1900. [Google Scholar] [CrossRef]
  21. Archard, J.F. Contact and rubbing of flat surfaces. J. Appl. Phys. 1953, 24, 981–988. [Google Scholar] [CrossRef]
  22. Archard, J.F. Wear Theory and Mechanisms. In Wear Control Handbook; Peterson MB & Winer WO, The American Society of Mechanical Engineers, United Engineering Center: New York, NY, USA, 1980; pp. 35–80. [Google Scholar]
  23. Chen, H.; Jin, L.; Li, X. Grey Systems: Theory and Application. Grey Syst. Theory Appl. 2011, 4883, 44–45. [Google Scholar] [CrossRef]
  24. Akkus, H. Experimental and statistical investigations of surface roughness, vibration, and energy consumption values of titanium alloy during machining using response surface method and grey relational analysis. Sci. Iran. 2022, 29, 109–119. [Google Scholar] [CrossRef]
  25. Marakini, V.; Pai, S.; Bhat, U.; Singh, D.; Achar, B. High speed machining for enhancing the AZ91 magnesium alloy surface characteristics: Influence and optimisation of machining parameters. Def. Sci. J. 2022, 72, 105–113. [Google Scholar] [CrossRef]
  26. Liu, S.; Forrest, J. Grey Systems: Theory and Applications; Springer Science & Business Media: Berlin/Heidelberg, Germany, 2010. [Google Scholar] [CrossRef]
  27. PN-EN 25178-2:2012; Geometrical Product Specifications (GPS)—Surface Texture: Areal—Part 2: Terms, Definitions and Surface Texture Parameters. ISO: Geneva, Switzerland, 2012.
Figure 1. Surface topography after ball-end milling machining.
Coatings 14 01128 g001
Figure 2. Surface topography of ball-end milling at different z-values: (a) Group A; (b) Group B; (c) Group C; (d) Group D; (e) Group E; (f) Group F; (g) Group G; (h) Group H; (i) Group I.
Coatings 14 01128 g002aCoatings 14 01128 g002b
Figure 3. Finite element simulation model of sliding wear process: (a) geometrical modelling of the sliding wear process; (b) meshing of the contact area.
Coatings 14 01128 g003
Figure 4. Characteristics of variation of surface texture parameters: (a) Sp and Sv; (b) Sz and Sxp; (c) Sq and Sa; (d) Ssk ; (e) Sku ; (f) Sdq ; (g) Sdr.
Coatings 14 01128 g004
Figure 5. Change characteristics of contact pressure during sliding wear: (a) Group A; (b) Group B; (c) Group C; (d) Group D; (e) Group E; (f) Group F; (g) Group G; (h) Group H; (i) Group I.
Coatings 14 01128 g005
Figure 6. Variation characteristics of wear deformation: (a) Group A; (b) Group B; (c) Group C; (d) Group D; (e) Group E; (f) Group F; (g) Group G; (h) Group H; (i) Group I.
Coatings 14 01128 g006
Figure 7. Ball-end milling experiment equipment: (a) 5-axis vertical machining centre; (b) ball-end milling machining process.
Coatings 14 01128 g007
Figure 8. Cutting tools for ball-end milling: (a) cutting tool shank; (b) blade.
Coatings 14 01128 g008
Figure 9. Surface after ball-end milling: (a) Groups M; (b) Groups N.
Coatings 14 01128 g009
Figure 10. Surface topography after ball-end milling process: (a) Groups M; (b) Groups N.
Coatings 14 01128 g010
Figure 11. Reciprocating sliding friction and wear test instrument: (a) MFT-5000 multifunctional friction and wear tester; (b) reciprocating sliding friction wear test.
Coatings 14 01128 g011
Figure 12. Surface after sliding wear: (a) Groups M; (b) Groups N.
Coatings 14 01128 g012
Table 1. Surface modelling parameters for ball-end milling machining.
GroupsABCDEFGHI
t (μm)012345678
Table 2. Material parameters in finite element simulation.
Material Density (g/mm3)Elastic Modulus (GPa)Poisson’s Ratio
Cr12MoV7700 × 10−62180.28
Table 3. Surface texture parameters for different surfaces.
ABCDEFGHI
Sp (μm)4.15294.11124.18144.36064.6555.08645.68056.43657.3459
Sv (μm)2.33142.90683.43253.9084.33384.68424.93505.08595.1374
Sz (μm)6.48437.01797.61398.26868.98889.770610.615411.522412.4833
Sxp (μm)3.09373.07183.21873.48623.80194.08534.82015.41145.667
Sq (μm)1.43441.46631.61121.84242.12642.41322.65842.83452.9042
Sa (μm)1.20641.22291.31191.4791.73092.03032.27012.42012.4712
Ssk0.38120.30130.1167−0.0234−0.0656−0.03750.03390.11980.1696
Sku2.26932.3182.43152.40072.25022.09682.01822.02842.0737
Sal (mm)0.12600.13030.15140.18730.22120.23610.24080.24310.2441
Sdq0.02160.02170.02210.02260.02340.02520.02730.02970.0320
Sdr (%)0.02330.02360.02430.02560.02740.03180.03740.04400.0513
Table 4. The degree of correlation between surface texture parameters.
SpSvSzSxpSqSaSskSkuSdqSdr
Sp10.79370.63230.83620.74020.75030.81040.65010.90900.9192
Sv 10.72520.74620.70490.69780.68890.60270.84690.8471
Sz 10.63620.63930.63010.58510.56290.65620.6577
Sxp 10.79070.79540.79100.70730.81940.8016
Sq 10.92410.70700.72940.73980.7124
Sa 10.72090.74530.75080.7237
Ssk 10.71420.77230.7697
Sku 10.64360.6285
Sdq 10.9516
Sdr 1
Table 5. Wear characteristics of nine groups surfaces.
ABCDEFGHI
V (×10−5 mm3)8.292088.292198.292338.292528.292878.291918.291928.292098.29222
Vs (×10−9 mm2)1.6584161.6584381.6584661.6585041.6585741.6583821.6583841.6584181.658444
KV (×10−9 mm2)11.0528851.1201921.2115381.3798080.9182690.9230771.0048081.067308
Table 6. Correlation between KV and surface texture parameters.
SpSvSzSxpSqSaSskSkuSdqSdr
ε0.6210 0.5968 0.5693 0.6263 0.6753 0.6924 0.6149 0.7172 0.6154 0.6021
Table 7. Simulation prediction value and error of KV.
GroupsReal Data Accumulated   Simulated   Value   K V ( 1 ) Simulated Value KVRelative Error (%)
B1.052885 2.0639011.0639011.05
C1.120192 3.1267011.0738164.14
D1.211538 4.4582961.2852196.08
E1.379808 5.7197171.3351023.24
F0.918269 6.6783470.9139240.47
G0.923077 7.6225640.9398721.82
H1.004808 8.6048380.9990690.57
I1.067308 9.6789361.0683590.10
Table 8. Experimental parameters of ball-end milling.
Groupsfz (μm)ae (μm)ap (μm)S (r/min)
M0.40.60.38000
N0.40.60.310,000
Table 9. Surface texture parameters of workpieces machined by ball-end milling.
GroupsSkuSaSxpSpSsk
M2.38292.49336.828410.03320.5191
N2.43973.10248.019812.22340.3095
Table 10. Characteristic parameters of wear on two groups of surfaces.
Groupsm0 (g)m1 (g)T (s)s (mm)ΔV (×10−3 mm3/mm)
M22.141022.0856180072,0000.2803
N22.687222.4635180072,0000.4035
Disclaimer/Publisher’s Note: The statements, opinions and data contained in all publications are solely those of the individual author(s) and contributor(s) and not of MDPI and/or the editor(s). MDPI and/or the editor(s) disclaim responsibility for any injury to people or property resulting from any ideas, methods, instructions or products referred to in the content.

