Article

Microstructure and Properties of CoCrFeNiTix High-Entropy Alloys Fabricated by Laser Additive Manufacturing

1
Guangdong Provincial Key Laboratory of Industrial Intelligent Inspection Technology, School of Mechatronic Engineering and Automation, Foshan University, Foshan 528225, China
2
Guangdong Provincial Key Laboratory of Material Joining and Advanced Manufacturing, China-Ukraine Institute of Welding, Guangdong Academy of Sciences, Guangzhou 510650, China
3
Datang Boiler and Pressure Vessel Inspection Center Co., Ltd., Hefei 231200, China
4
College of Materials and Advanced-Manufacturing, Hunan University of Technology, Zhuzhou 412007, China
*
Author to whom correspondence should be addressed.
Coatings 2024, 14(9), 1171; https://doi.org/10.3390/coatings14091171
Submission received: 31 July 2024 / Revised: 23 August 2024 / Accepted: 6 September 2024 / Published: 11 September 2024
(This article belongs to the Special Issue Manufacturing and Surface Engineering IV)

Abstract

:
CoCrFeNi HEAs have better ductility, while the strength and corrosion resistance need to be further improved, while metal materials for deep-sea operations put forward the requirement of excellent mechanical properties and very high corrosion resistance; however, CoCrFeNi HEAs have been less studied for the trade-off between mechanical properties and corrosion resistance. Therefore, the present study utilized the laser melting deposition (LMD) technique to fabricate a series of (CoCrFeNi)Tix (x = 0.2, 0.4, 0.6, 0.8, 1.0 at.%) HEAs and systematically investigated the influence of Ti content on the alloy’s microstructure, phase composition, mechanical properties, and electrochemical performance. The research findings revealed that as the Ti content increased, the alloy gradually transformed from a single face-centered cubic (FCC) phase to an FCC and body-centered cubic (BCC) dual-phase structure. The addition of Ti induced a transition in the alloy’s microstructure from an equiaxed to a dendritic morphology, accompanied by grain refinement. Energy dispersive spectroscopy analysis confirmed the uniform distribution of Ti within the alloy. The hardness of the alloy increased significantly with the increase in Ti content, reaching 804.5 HV when the Ti content was 1.0 at.%, which was 4.13 times higher than the Ti-free alloy. The tensile and compression test results showed that the (CoCrFeNi)Tix alloy with a Ti content of 0.4 at.% exhibited the best overall mechanical performance. The electrochemical test results indicated that the addition of Ti effectively enhanced the corrosion resistance of the alloy, with the 0.4 at.% Ti-containing alloy exhibiting the optimal corrosion resistance. This study provides a strong theoretical and experimental foundation for the design of high-performance CoCrFeNi-based HEAs.

1. Introduction

Since Yeh et al. proposed the concept of alloys containing five or more principal elements in near-equiatomic proportions, High-Entropy Alloys (HEAs) have garnered considerable attention [1,2,3]. In contrast to conventional binary or ternary alloys, HEAs exhibited the capacity to form simple solid solution structures, such as body-centered cubic (BCC), face-centered cubic (FCC), and hexagonal close-packed (HCP) structures, owing to their elevated configurational mixing entropy [4,5,6,7,8,9]. In recent years, numerous HEA systems were developed, demonstrating exceptional properties, including high hardness [10], a balance between strength and ductility [11], as well as excellent corrosion resistance [12] and wear resistance [13].
Among the current high-entropy alloy systems, the CoCrFeNi system has been the most widely studied. However, the CoCrFeNi HEAs fail to attain the desired strength and ductility levels necessary for components requiring high strength and ductility in various industrial applications. Hence, scholars have applied solid solution strengthening, fine grain strengthening, dislocation strengthening, and precipitation strengthening [14] to enhance the properties of CoCrFeNi HEAs. He et al. [15] discovered that incorporating the strategic inclusion of trace elements into the alloy formulation promotes solid solution strengthening or dispersion strengthening, thus harmonizing the dichotomy between strength and ductility in the CoCrFeNiNb0.25 high-entropy alloy. The strength–ductility trade-off of Ni0.6CoFe1.4 medium-entropy alloys (MEAs) was tackled by Wu et al. [16] via introducing a body-centered cubic (BCC) + FCC dual-phase microstructure. Recently, precipitation hardening has been widely used to strengthen several HEAs, such as the FeCoNiCr-based HEA, by adding precipitate-forming elements, like Mo, Nb, Al, and Ti [17,18,19]. Furthermore, the role of Ti in HEAs was multifaceted. Not only did it improve the alloy strength through precipitation strengthening and solid solution strengthening at the microstructural level, but it also optimized the overall mechanical performance and application potential of the alloy through strain hardening and phase structure stabilization at the macro scale. Chen et al. [20]. reported that by adding a small amount of Ti, they were able to design and achieve the co-coherent precipitation of L12-type Ni3Ti nano-clusters and nano-particles within the FeCoNi medium-entropy alloy matrix. Furthermore, the addition of Ti was found to promote the formation of uniformly distributed (Ni,Co)3(Al,Ti) type nano-precipitates, which significantly strengthened the microstructure of the NiCoCr-based high-entropy alloy [21].
A comprehensive literature review [22,23,24,25,26,27] indicated that previous research on novel HEA development rarely achieved a balance between corrosion resistance and mechanical properties. For instance, AlxCoCrFeNi (x = 0.3, 0.5, and 0.7) exhibited good corrosion resistance in 3.5 wt.% NaCl [27], but demonstrated poor ductility due to the brittle BCC eutectic phase. Similar observations were reported in Mo-doped FeNiCoCr alloys [25]. Furthermore, in the FeCoNiCrCux system (x = 0, 0.5, and 1), Cu alloying not only accelerated localized corrosion but also deteriorated plasticity due to the formation of Cu-rich interdendritic phases [26]. Titanium is renowned for its high corrosion resistance in various environments, attributed to the spontaneous formation of a stable and dense oxide film on its surface. Zhou et al. significantly enhanced the corrosion resistance of FeCrCoNi high-entropy alloy by adding Ti, which formed a bilayer passive film structure primarily composed of TiO2 and Cr2O3. This bilayer passive film structure, being more compact and stable, effectively impeded corrosive media and served as a key mechanism for improving the alloy’s corrosion resistance [28]. Studies have shown that the FCC phase exhibits superior corrosion resistance compared to the BCC phase in a 3.5 wt.% NaCl solution [29]. Simultaneously, as a lightweight metallic element with a large atomic radius, Ti also provided good strengthening effects when in solid solution, contributing to enhanced mechanical properties. This dual role of Ti in improving both corrosion resistance and mechanical strength makes it a promising alloying element for developing HEAs with balanced properties.
Different processing techniques significantly influence the microstructure of HEAs [30,31,32,33,34]. Furthermore, the inherent complexity of HEAs renders the production of homogeneous alloy components challenging through conventional methods such as arc melting or induction melting followed by casting, particularly on a large scale. These manufacturing techniques necessitate multiple remelting cycles and physical inversions to ensure the homogeneity of HEAs [35]. High solidification rates are also essential to mitigate elemental segregation during the solidification process. The generally high hardness exhibited by these alloys makes it difficult to machine them into components with complex geometries. Compared to traditional manufacturing methods, additive manufacturing (AM) offers numerous advantages, including the capability to produce complex geometries, high material utilization efficiency, and elevated solidification rates due to localized melting processes [36]. Laser melting deposition (LMD), as a type of AM technology, can achieve precise printing of various complex shapes, and it can also manufacture components with a density close to 100%, whose performance meets or even exceeds that of castings and forgings, effectively solving the production problems of complex structural components. Laser additive manufacturing technology features rapid melting, quick cooling, and solidification, also characterized by a high cooling rate [37]. The LMD technique enables precise control over the microstructure of the Al0.5CoCrFeNiTi0.5 high-entropy alloy by adjusting the laser energy density (LED). A lower LED has been found to facilitate the homogenization of the FCC phase distribution within the BCC phase, reducing elemental concentration gradients, which in turn significantly enhances the corrosion resistance and oxidation performance of the alloy [38]. Subsequently, Zhang et al. [39] investigated the effects of different laser cladding speeds on the properties of the CoCrFeNi HEA cladding layer. The results showed that the performance of cladding layers produced at higher laser cladding speeds surpassed those fabricated at standard speeds. Wang et al. [40] controlled the laser energy density during the laser cladding process to prepare a (CoCrFeNi)95Nb5 cladding layer and measured its corrosion resistance, The study indicated that different laser energy densities could alter the corrosion resistance of the coating.
These studies highlight the potential of LMD methods for designing the microstructure and properties of high-entropy alloy materials. In addition, the positive effects of titanium on the mechanical properties and corrosion resistance of HEAs have been well documented, respectively, but its simultaneous effects on mechanical properties and corrosion resistance have rarely been explored, and no one has yet fabricated a series of (CoCrFeNi)Tix high-entropy alloys with varying titanium content using LMD technology to investigate how high-entropy alloys with different titanium contents can achieve a better balance between excellent mechanical properties and very high corrosion resistance. Therefore, in this study, a series of (CoCrFeNi)Tix HEAs with different titanium contents were prepared using the LMD method to investigate the effects of different titanium contents on the mechanical properties and corrosion resistance of (CoCrFeNi)Tix HEAs. This work aims to provide theoretical and experimental basis for the future research and application of CoCrFeNi.

2. Materials and Methods

In order to directly feed powder into the laser cladding process, CoCrFeNi HEA powder and pure Ti powder (both with a purity ≥ 99.99 wt.% and produced by Shandong Lianhong New Materials Technology, Ltd., Tengzhou, China) were mixed using a mechanical ball milling method. The grinding ball was an alumina ball with a diameter of Φ10 mm, and the ball-to-powder ratio was 3/5. The morphologies of CoCrFeNi HEA powder and pure Ti powder are presented in Figure 1a,b and the morphology of the CoCrFeNiTi hybrid powder is shown in Figure 1c. Both powders exhibited good sphericity with the particle size of 53–105 μm. The two powders were mixed together in an argon atmosphere for 12 h and then placed in a vacuum oven for 12 h of vacuum drying at 110 °C. Subsequently, the CoCrFeNiTix (x = 0.2, 0.4, 0.6, 0.8, 1.0 at.%) HEAs were fabricated on an H13 steel substrate using the laser melting deposition (LMD) technique. The LMD equipment was the H320 integrated additive manufacturing system provided by Guangdong Zeng Jian Technology (Foshan, China). The schematic diagram of the LMD equipment and nozzle is shown in Figure 1d,e. During the LMD process, the powder feeder rotation speed was 1.2 r/min, and the laser scanning speed was set at 600 mm/min. The focus diameter of the laser beam was 2 mm and the defocusing amount was 14 mm. Pure argon gas was used as the shielding gas, with a flow rate of 15 L/min, The laser deposition path is shown in Figure 1f. The overlap between adjacent cladding layers was 40%.
In order to study the microstructure and the chemical composition of the CoCrFeNiTix HEAs samples, specimens measuring 15 mm × 10 mm × 6 mm were cut. Their surfaces were ground, polished, and etched in Kroll’s reagent (HNO3:HCl = 1:3, volume ratio) for 30 s. The phase compositions of the samples were analyzed using X-ray diffraction (XRD, Panalytical X’Pert Pro, PANalytical B.V., Almelo, The Netherlands) with a voltage of 60 kV, and current of 160 mA, accelerating voltage 40 kV, scanning range of 20° to 100°, and scanning rate 4°/min. The experimental data were analyzed using the HighScore Plus software (Version 3.0.5). The macrostructure were observed using an optical microscope (OM, ZEISS Axio Imager, M2m, Jena, Germany), and the microstructural observations were conducted using a scanning electron microscope (SEM, FEI QUANTA 250, Hillsboro, OR, USA) operated at 15–20 kV with a beam current of 5.0 and a working distance of 10 mm. The chemical composition was analyzed using an energy-dispersive X-ray spectrometer (EDS, Thermo Fisher Scientific, Noran System 7, Waltham, MA, USA) attached to the SEM. Electron backscatter diffraction (EBSD) analysis was performed using an Oxford Instruments EBSD system equipped with a NordlysMax3 high-speed detector. The EBSD measurements achieved a data acquisition rate of 1580 points/s with a calibration rate above 95% and a resolution of 4096 × 4096 pixels. Vickers microhardness (HV) measurements were carried out using a BUEHLER Wilson VH 1102 hardness tester with a load of 300 g and a dwell time of 10 s. The specimens were prepared in accordance with the c8M-13a Standard Test Method for Tensile Testing of Metallic Materials [41]. Tensile and compressive tests were performed on an MTS CMT5105 universal testing machine at a strain rate of 0.5 mm/min. The electrochemical tests were performed using an electrochemical workstation (Metrohm Autolab PGSTAT302N) (Eden Prairie, MN, USA). The electrolyte was a 3.5 wt.% NaCl solution, and the tests were conducted at a constant temperature of 25 °C and a humidity lower than 20%. The electrochemical experiments included open-circuit potential (OCP) measurement, potentiodynamic polarization (PP) tests, and electrochemical impedance spectroscopy (EIS) analysis. In this case, the platinum wire and saturated calomel electrode (SCE) were used as counter electrode and reference electrode, respectively. The OCP was monitored until a stable value was reached, and then the PP and EIS tests were initiated. The PP tests were conducted with a scan rate of 1 mV/min over a potential range from −0.5 V (vs. OCP) to 0.5 V (vs. SCE). The test was terminated when the current exceeded 1 mA. The polarization curves were fitted using the Tafel extrapolation method to obtain the corrosion potential (Ecorr) and corrosion current density (Icorr). The EIS measurements were performed over a frequency range from 1 × 10⁵ Hz to 0.01 Hz with an AC amplitude of 10 mV. The EIS data were analyzed using ZView and Origin2018 software(Version 9.0 PRO).

3. Results and Discussion

3.1. Microstructural and Phase Analysis of CoCrFeNiTix HEAs

3.1.1. Phase Composition Analysis

The XRD patterns of the CoCrFeNiTix (x = 0.2, 0.4, 0.6, 0.8, 1.0 at.%) HEAs are shown in Figure 2a,b. When the Ti content was x = 0.2, the CoCrFeNiTi0.2 HEAs still retained the single FCC phase. This result indicated that at lower Ti additions, Ti atoms could be readily absorbed and dissolved into the FCC solid solution based on the CoCrFeNi HEA’s matrix. However, as the Ti content was increased, the HEA began to transition into a dual-phase microstructure consisting of FCC and BCC phases. This was attributed to the fact that at higher Ti concentrations, only a portion of the Ti atoms could be incorporated into the FCC solid solution, while the remaining Ti atoms formed a separate BCC solid solution phase [42,43,44,45].
As the Ti content increased, the main diffraction peaks shifted towards lower angles, as shown in Figure 2a. From the data in Table 1, the interplanar spacing increased from 0.2076 to 0.2093, and the lattice parameter expanded from 0.3596 to 0.3625. This was attributed to the large residual stresses generated during the cooling process, which led to an expansion of the crystal lattice. Furthermore, the addition of large Ti particles to the CoCrFeNi HEAs resulted in the Ti atoms preferentially being released from the FCC phase and redissolving in the interdendritic regions [46], causing lattice distortion and further increasing the interplanar spacing [47]. According to Bragg’s law, the increase in interplanar spacing led to a shift of the main diffraction peaks towards lower angles [48,49], consistent with the observation in Figure 2b. The experimental results indicated that as the Ti content increased, the CoCrFeNiTix HEAs began to transition from a single FCC phase to a dual-phase FCC + BCC structure.

3.1.2. Microstructure and Element Distribution

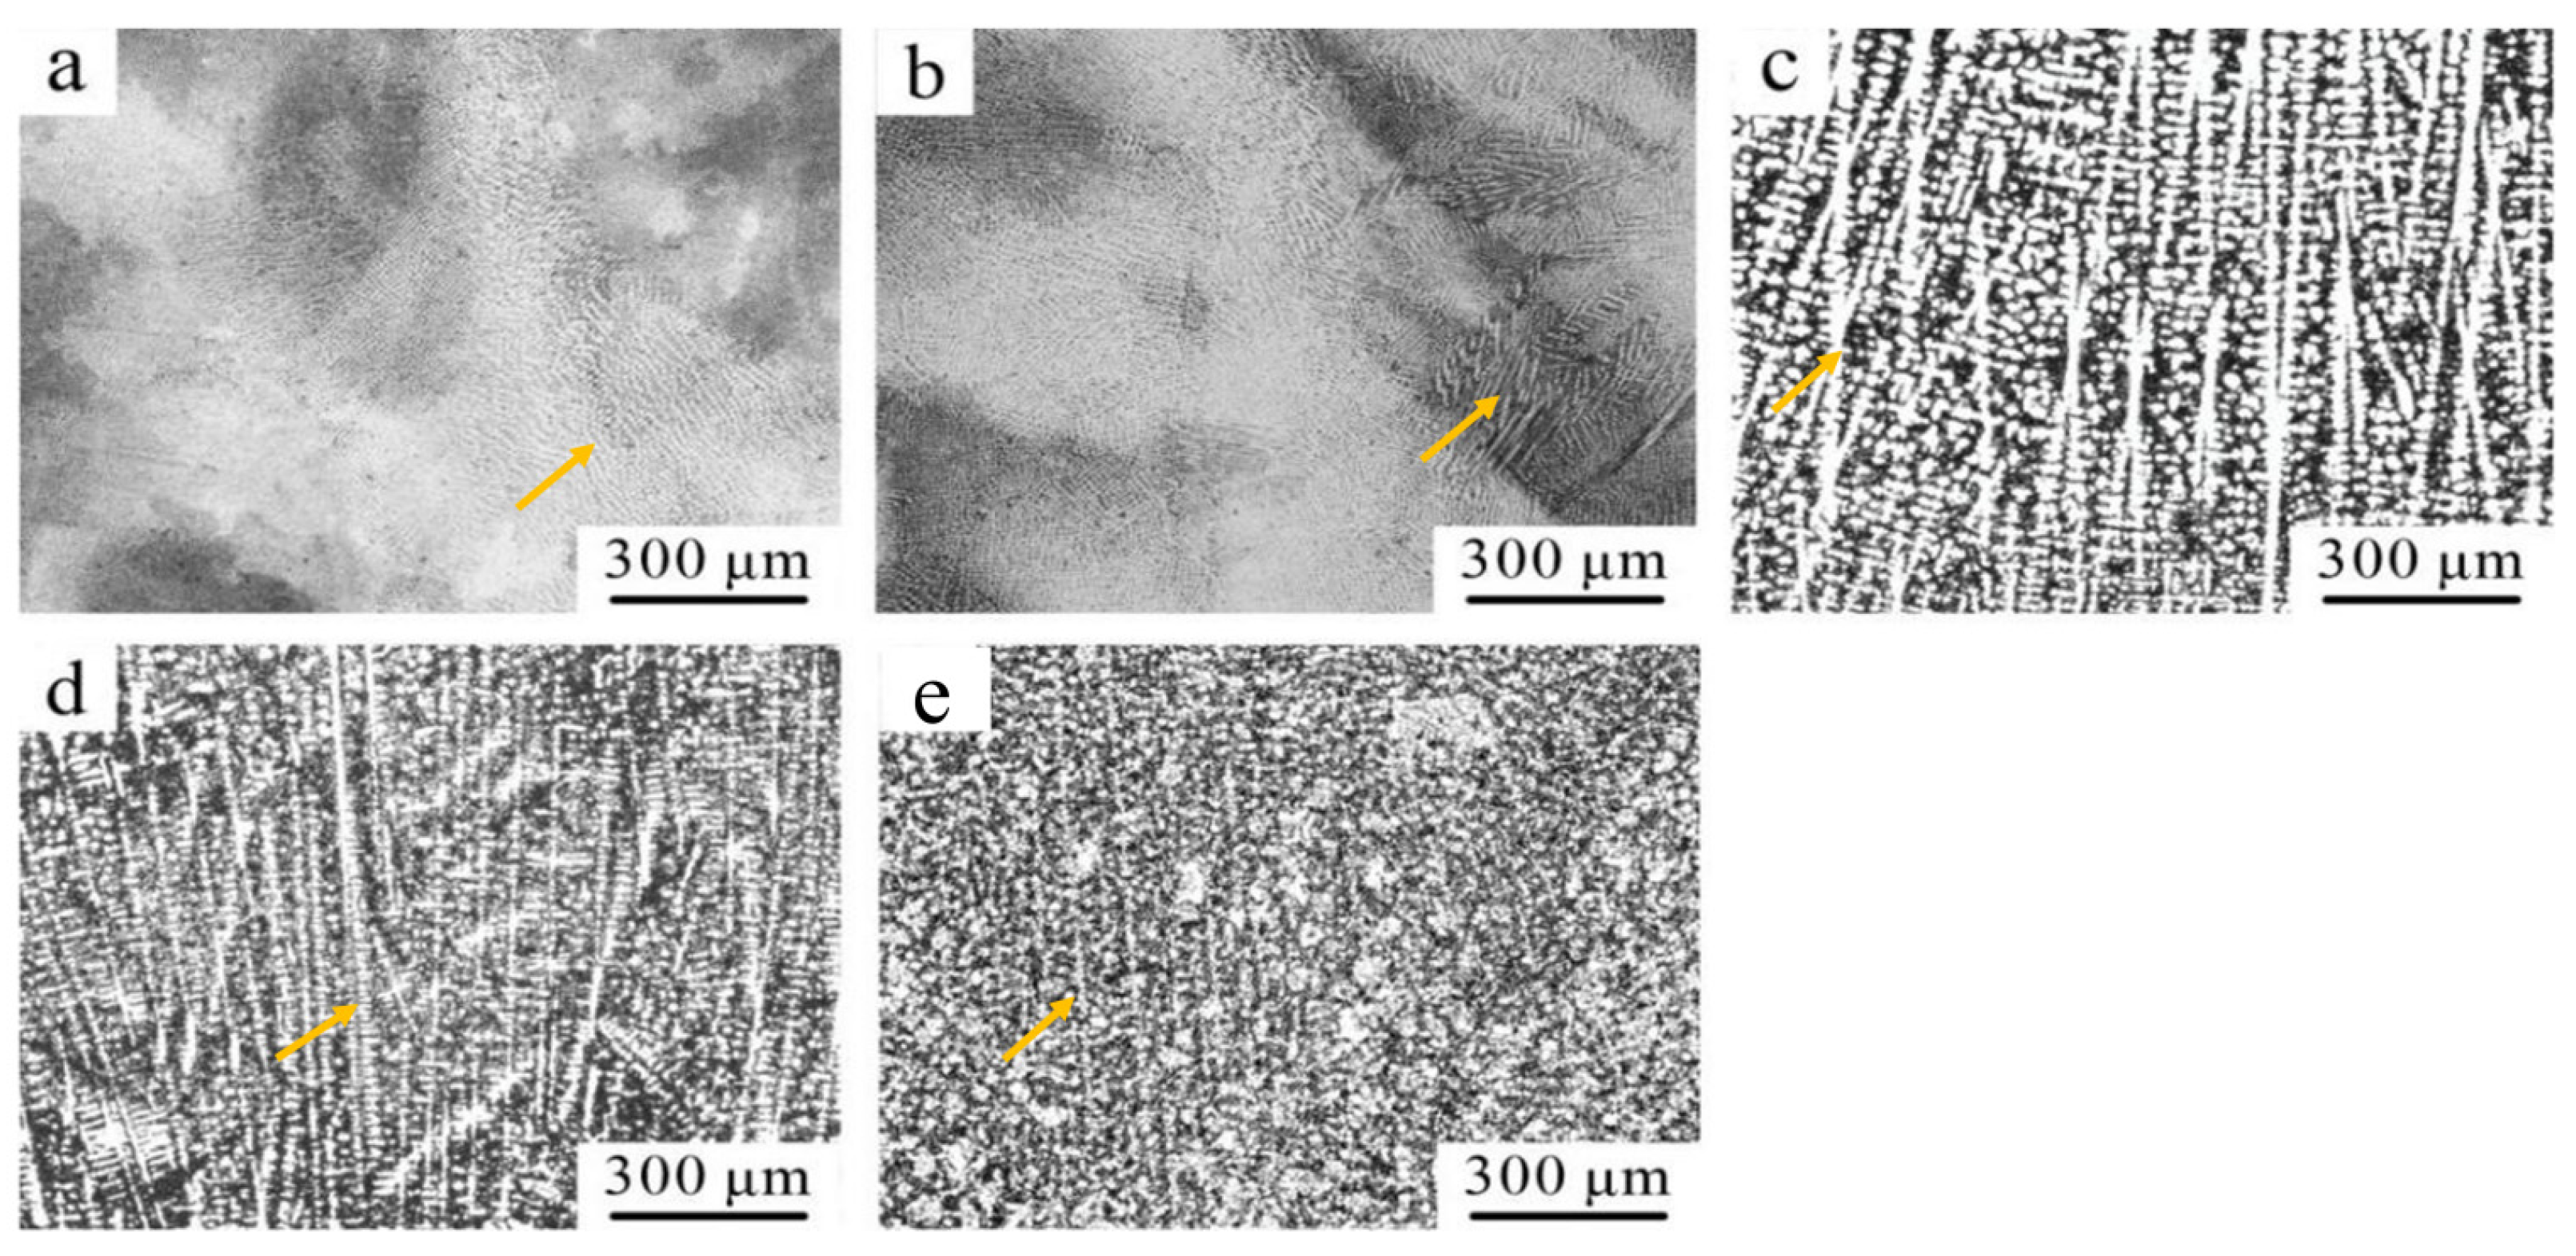
Figure 3 illustrates the OM microstructural images of CoCrFeNiTix HEAs with different titanium atom ratios. The observed results show that the microstructure of the CoCrFeNiTi0.2 HEA consists of equiaxed grains as shown in Figure 3a, whereas the CoCrFeNiTi0.4 HEA starts to show some long needle-like crystals as shown in Figure 3b, and from Figure 3c–e, it is possible to observe the OM microstructures of CoCrFeNiTi0.6 HEA, CoCrFeNiTi0.8 HEA, CoCrFeNiTi0.8 HEA, and CoCrFeNiTi0.8 HEA with different titanium atom ratios. The microstructures of CoCrFeNiTi0.6 HEA, CoCrFeNiTi0.8 HEA, and CoCrFeNiTi1.0 HEA are characterized by a large number of long needles with a dendritic crystal structure.
The CoCrFeNiTi0.2 HEA and CoCrFeNiTi0.4 HEAs consisted of equiaxed grains. For the CoCrFeNiTi0.4 HEA, a slight transformation of the microstructure from equiaxed grains to a dendritic structure was observed in Figure 3. Typically, materials with an equiaxed grain structure exhibit greater ductility, while those with a dendritic structure tend to have higher strength but lower ductility, The CoCrFeNiTi0.4 HEA achieved a better balance between ductility and strength. Therefore, the CoCrFeNiTi0.4 HEA has higher strength due to the formation of a dendritic structure.
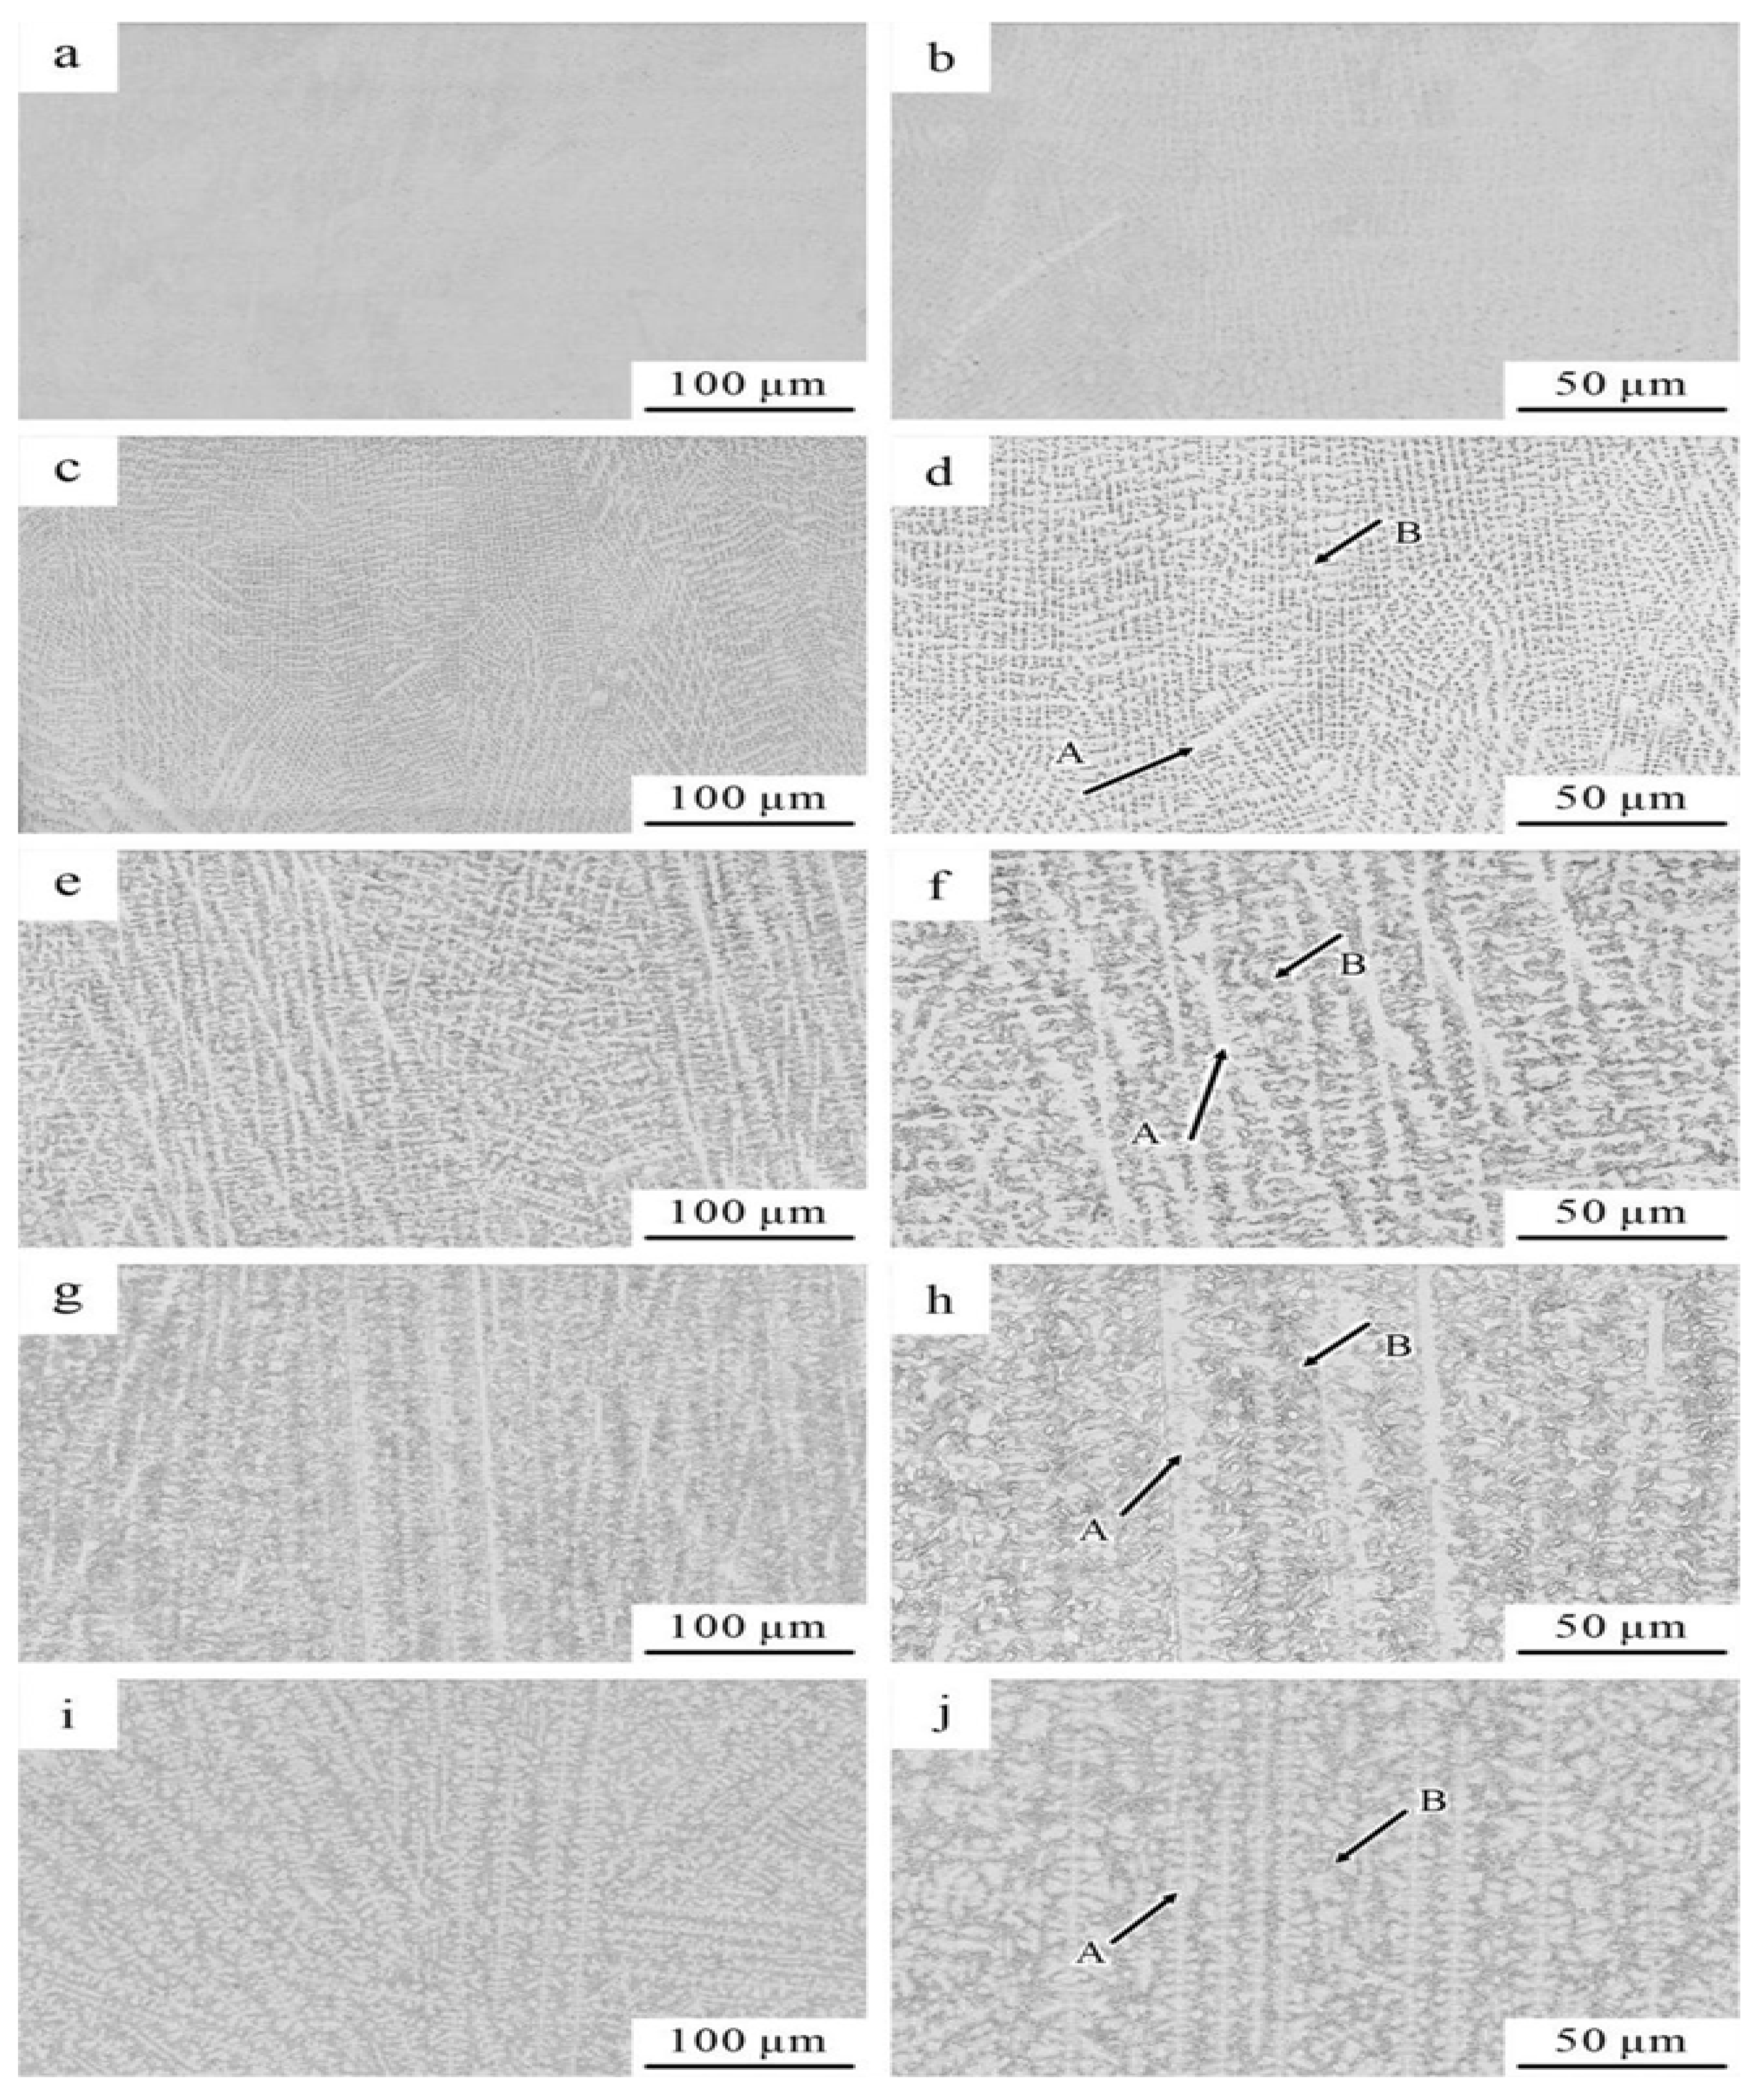
The SEM images of the CoCrFeNiTix HEAs (Figure 4) revealed that the crystals in the CoCrFeNiTix HEAs grew in a perpendicular direction. When x = 0.4 at.%, the alloy began to exhibit a fishbone-like crystal structure, and this fishbone-like morphology became more pronounced as the Ti content increased. This phenomenon was also verified by the XRD results. Specifically, as the Ti content was gradually increased, the Ti atoms that were not dissolved in the CoCrFeNi HEA matrix formed a separate BCC phase. The formation of this independent phase was the primary reason for the appearance of the fishbone-like crystal structure. Further analysis suggested that the formation of this fishbone-like morphology was likely related to the stress concentration and grain boundary energy distribution within the alloy. The introduction of Ti atoms not only changed the chemical composition of the alloy but also significantly influenced its microstructure and mechanical properties. At low Ti contents, the Ti atoms were mainly distributed in the solid solution, with a relatively small impact on the overall crystal structure. However, when the Ti content reached a certain level, the Ti atoms exceeded the solubility limit of the solid solution and began to precipitate, forming an independent BCC structured phase. The formation of this new phase led to stress concentration in the matrix, which in turn promoted the growth of the crystals along a specific direction (the perpendicular direction), ultimately resulting in the fishbone-like morphology. Through the combined analysis of SEM and XRD, it was concluded that the microstructure of the CoCrFeNiTix HEAs underwent significant changes with increasing Ti, particularly the emergence of the fishbone-like crystal structure.
EDS spot analysis was conducted to determine the chemical compositions of the CoCrFeNiTix HEA series, and the results are summarized in Table 2. The data showed that for all the HEA compositions, the actual Ti contents were slightly lower than the nominal Ti contents. In region A, the relatively lower Ti content resulted in a primarily FCC structure. In region B, the higher Ti content led to the formation of a predominant BCC phase, as the excess Ti atoms could not be fully dissolved and precipitated as a separate BCC solid solution phase.
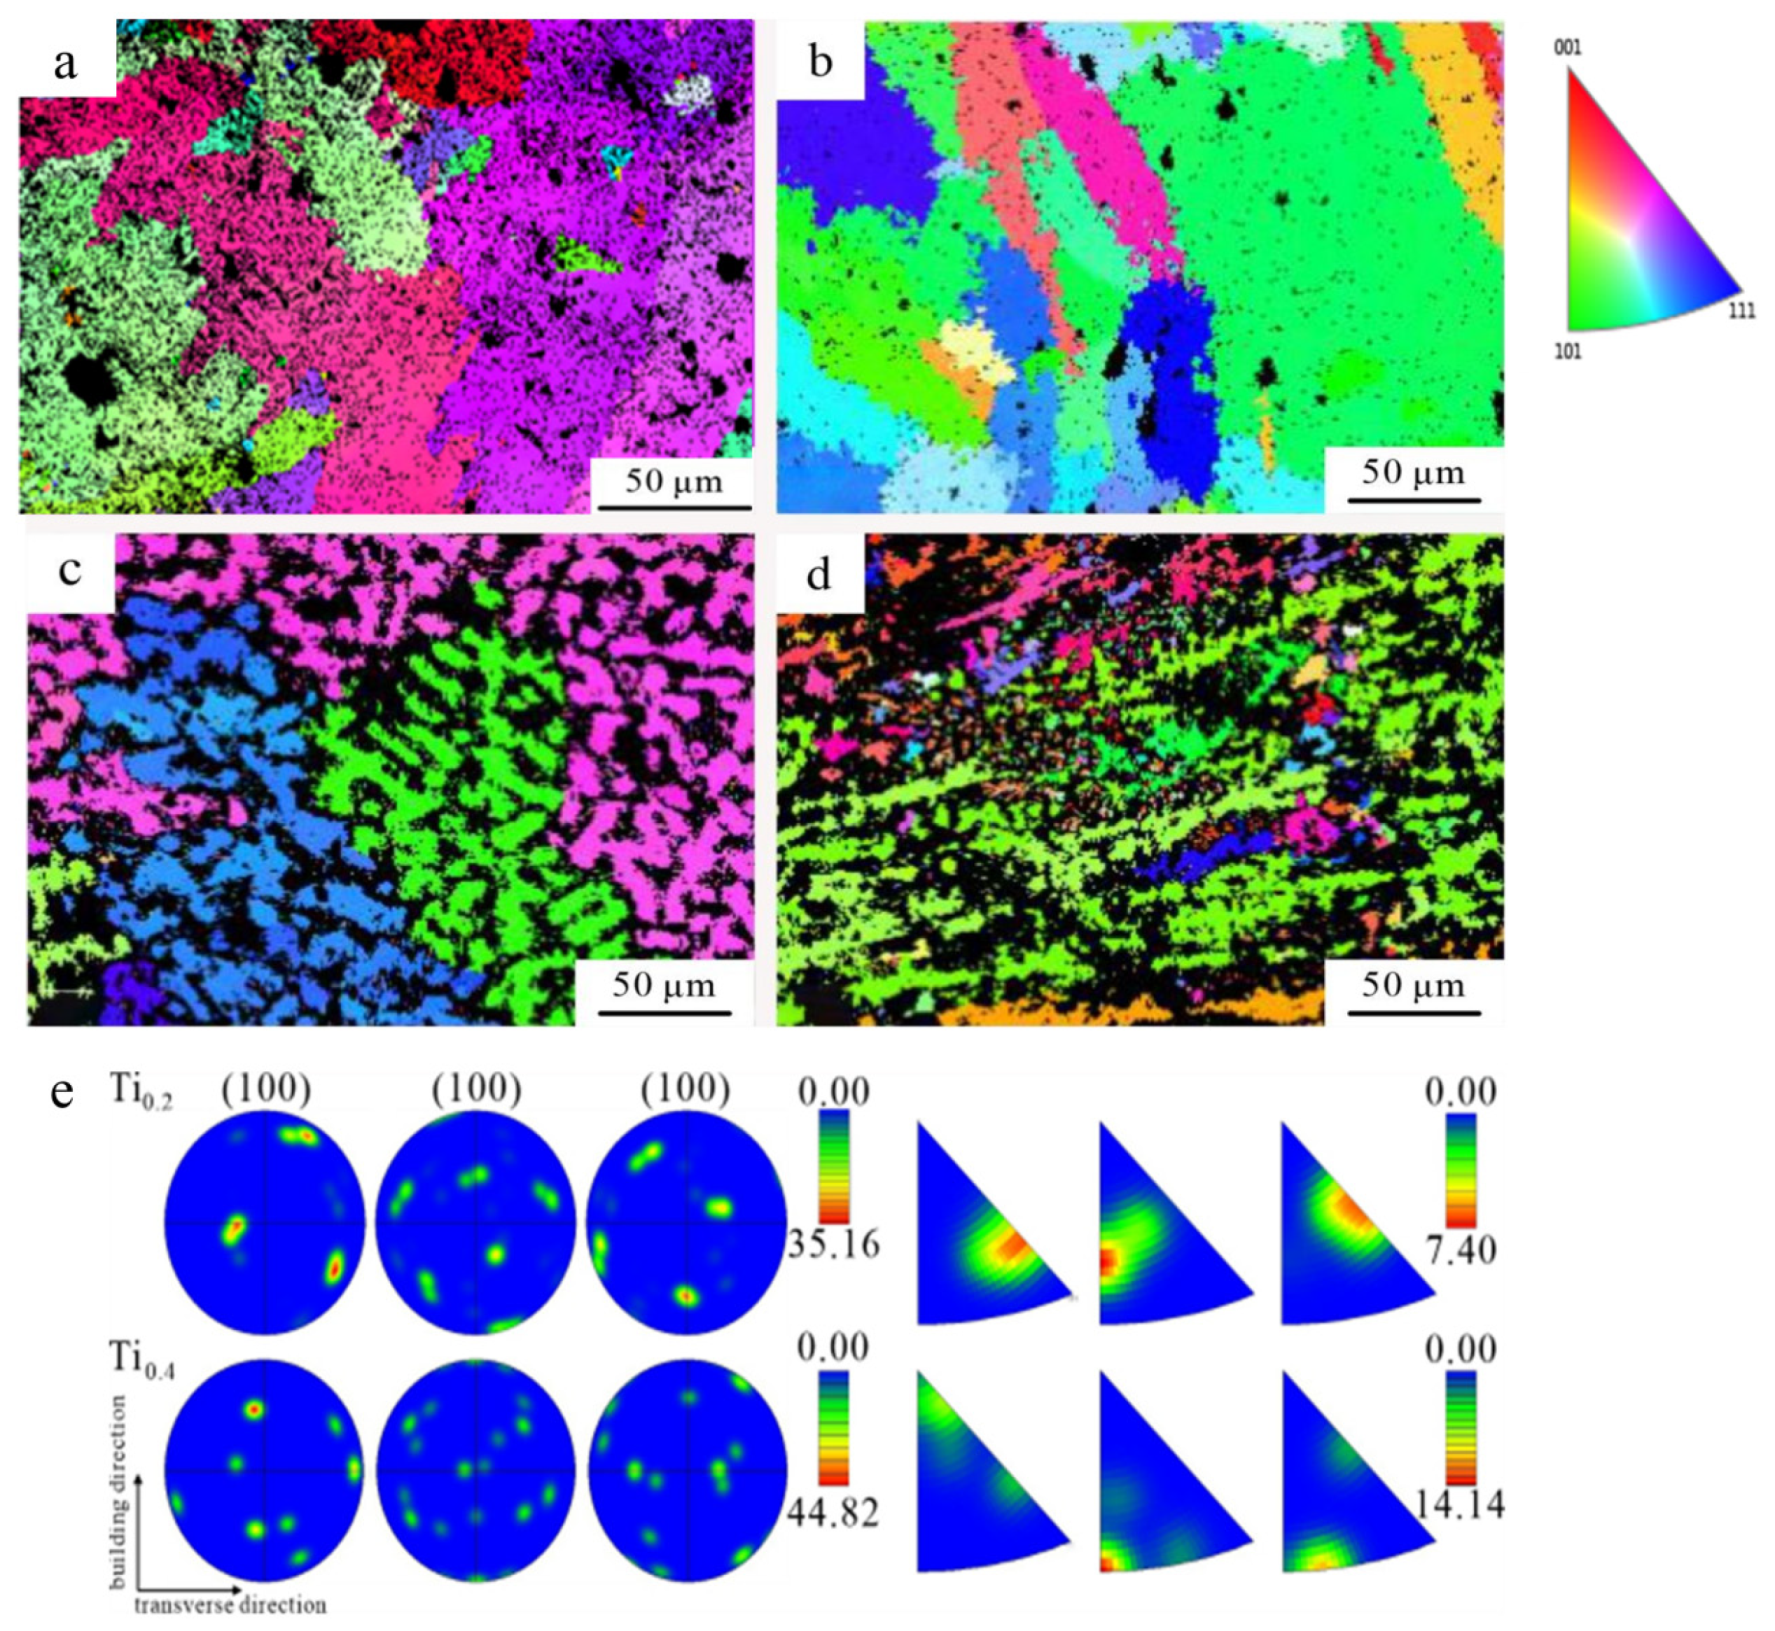
The EBSD analysis of the CoCrFeNiTix HEAs, as shown in Figure 5a–d, was consistent with the SEM observations: the microstructure transitioned from columnar grains to a dendritic structure. Laser deposition is a typical non-equilibrium solidification process; the temperature gradient and solidification rate are two critical factors determining the crystal structure of HEAs. Due to the high melting point of Ti and the rapid cooling during laser melting deposition, a wide range of “constitutional supercooling” occurred, leading to the formation of the dendritic structure. This was also consistent with the observed grain refinement phenomenon.
The EBSD-IPF analysis of the CoCrFeNiTix HEAs, as shown in Figure 5e, revealed that the FCC phase exhibited a preference for growth along the (100) direction. In the laser melting deposition process, the FCC phase was readily influenced by the heat flux and grew in the direction of maximum heat extraction. During the laser melting deposition, the highest temperature gradient was perpendicular to the melt pool. However, the growth direction of the columnar face-centered cubic grains was not entirely parallel to the deposition direction. This was attributed to the oscillating scanning pattern used in the laser melting deposition process, which altered the local heat transfer direction and led to a tilted grain growth orientation.
Table 3 summarizes the grain sizes of the CoCrFeNiTix HEAs calculated based on the EBSD data. The data in Figure 3e show that as the Ti content increased, the grain size of the CoCrFeNiTix HEA increased from 6.56 μm to 12.6 μm.
The EDS maps (Figure 6) revealed a uniform distribution of all the alloying elements, without any evidence of elemental segregation or localized depletion. This homogeneous distribution was attributed to the high laser energy input, which led to a rapid solidification of the metallic powders, preventing long-range diffusion of the various elements within the alloy during the short time frame. Further analysis suggested that the high laser energy input and rapid solidification process had a significant influence on the formation of the alloy microstructure. During the laser cladding process, the high-energy laser provided a high energy density, rapidly melting the metallic powders and completing the solidification within an extremely short time. This rapid solidification process restricted the diffusion behavior of the elements, ensuring their uniform distribution within the alloy. Therefore, the EDS elemental mapping analysis demonstrated that the high laser energy input and rapid solidification process had a remarkable effect in preventing elemental segregation and maintaining compositional homogeneity.

3.2. Mechanical Properties of CoCrFeNiTix HEAs

3.2.1. Vickers Microhardness

The Vickers microhardness distribution and average values for the CoCrFeNiTix HEAs are presented in Figure 7. The hardness values at different locations within the same sample were closely clustered, indicating a uniform microstructure and hardness distribution in the HEAs produced. The data showed that the hardness increased with increasing Ti content. When the Ti content was increased from 0.2 at.% to 1.0 at.%, the hardness increased from 261.5 to 804.5 HV, representing an enhancement of 207.65%. This was attributed to the larger atomic radius of Ti (146 pm) compared to the other elements in the CoCrFeNi HEA, which resulted in lattice distortion upon the addition of Ti. Furthermore, the SEM observations in Figure 4 reveal that as the Ti content increased, grain refinement occurred in the HEA. Considering the XRD pattern results, When the Ti content was 0.2 at.%, solid solution strengthening and grain refinement were the dominant strengthening mechanisms. As the Ti content increased to 0.4 at.%, the precipitation of a BCC-structured Ti-based solid solution began, and second-phase strengthening also played a role. When the combined effects of solid solution strengthening, grain refinement, and second-phase strengthening acted on the CoCrFeNiTix HEA, the Vickers microhardness reached 804.5 HV, while the hardness of the HEA without Ti addition was 194.9 HV [50]. This indicated that the addition of Ti increased the hardness of the CoCrFeNiTi1.0 HEA by a factor of 4.13. The experimental results demonstrated that the addition of Ti significantly enhanced the surface hardness of the HEA.

3.2.2. Analysis of Tensile and Compressive Mechanical Properties and Fracture Morphology

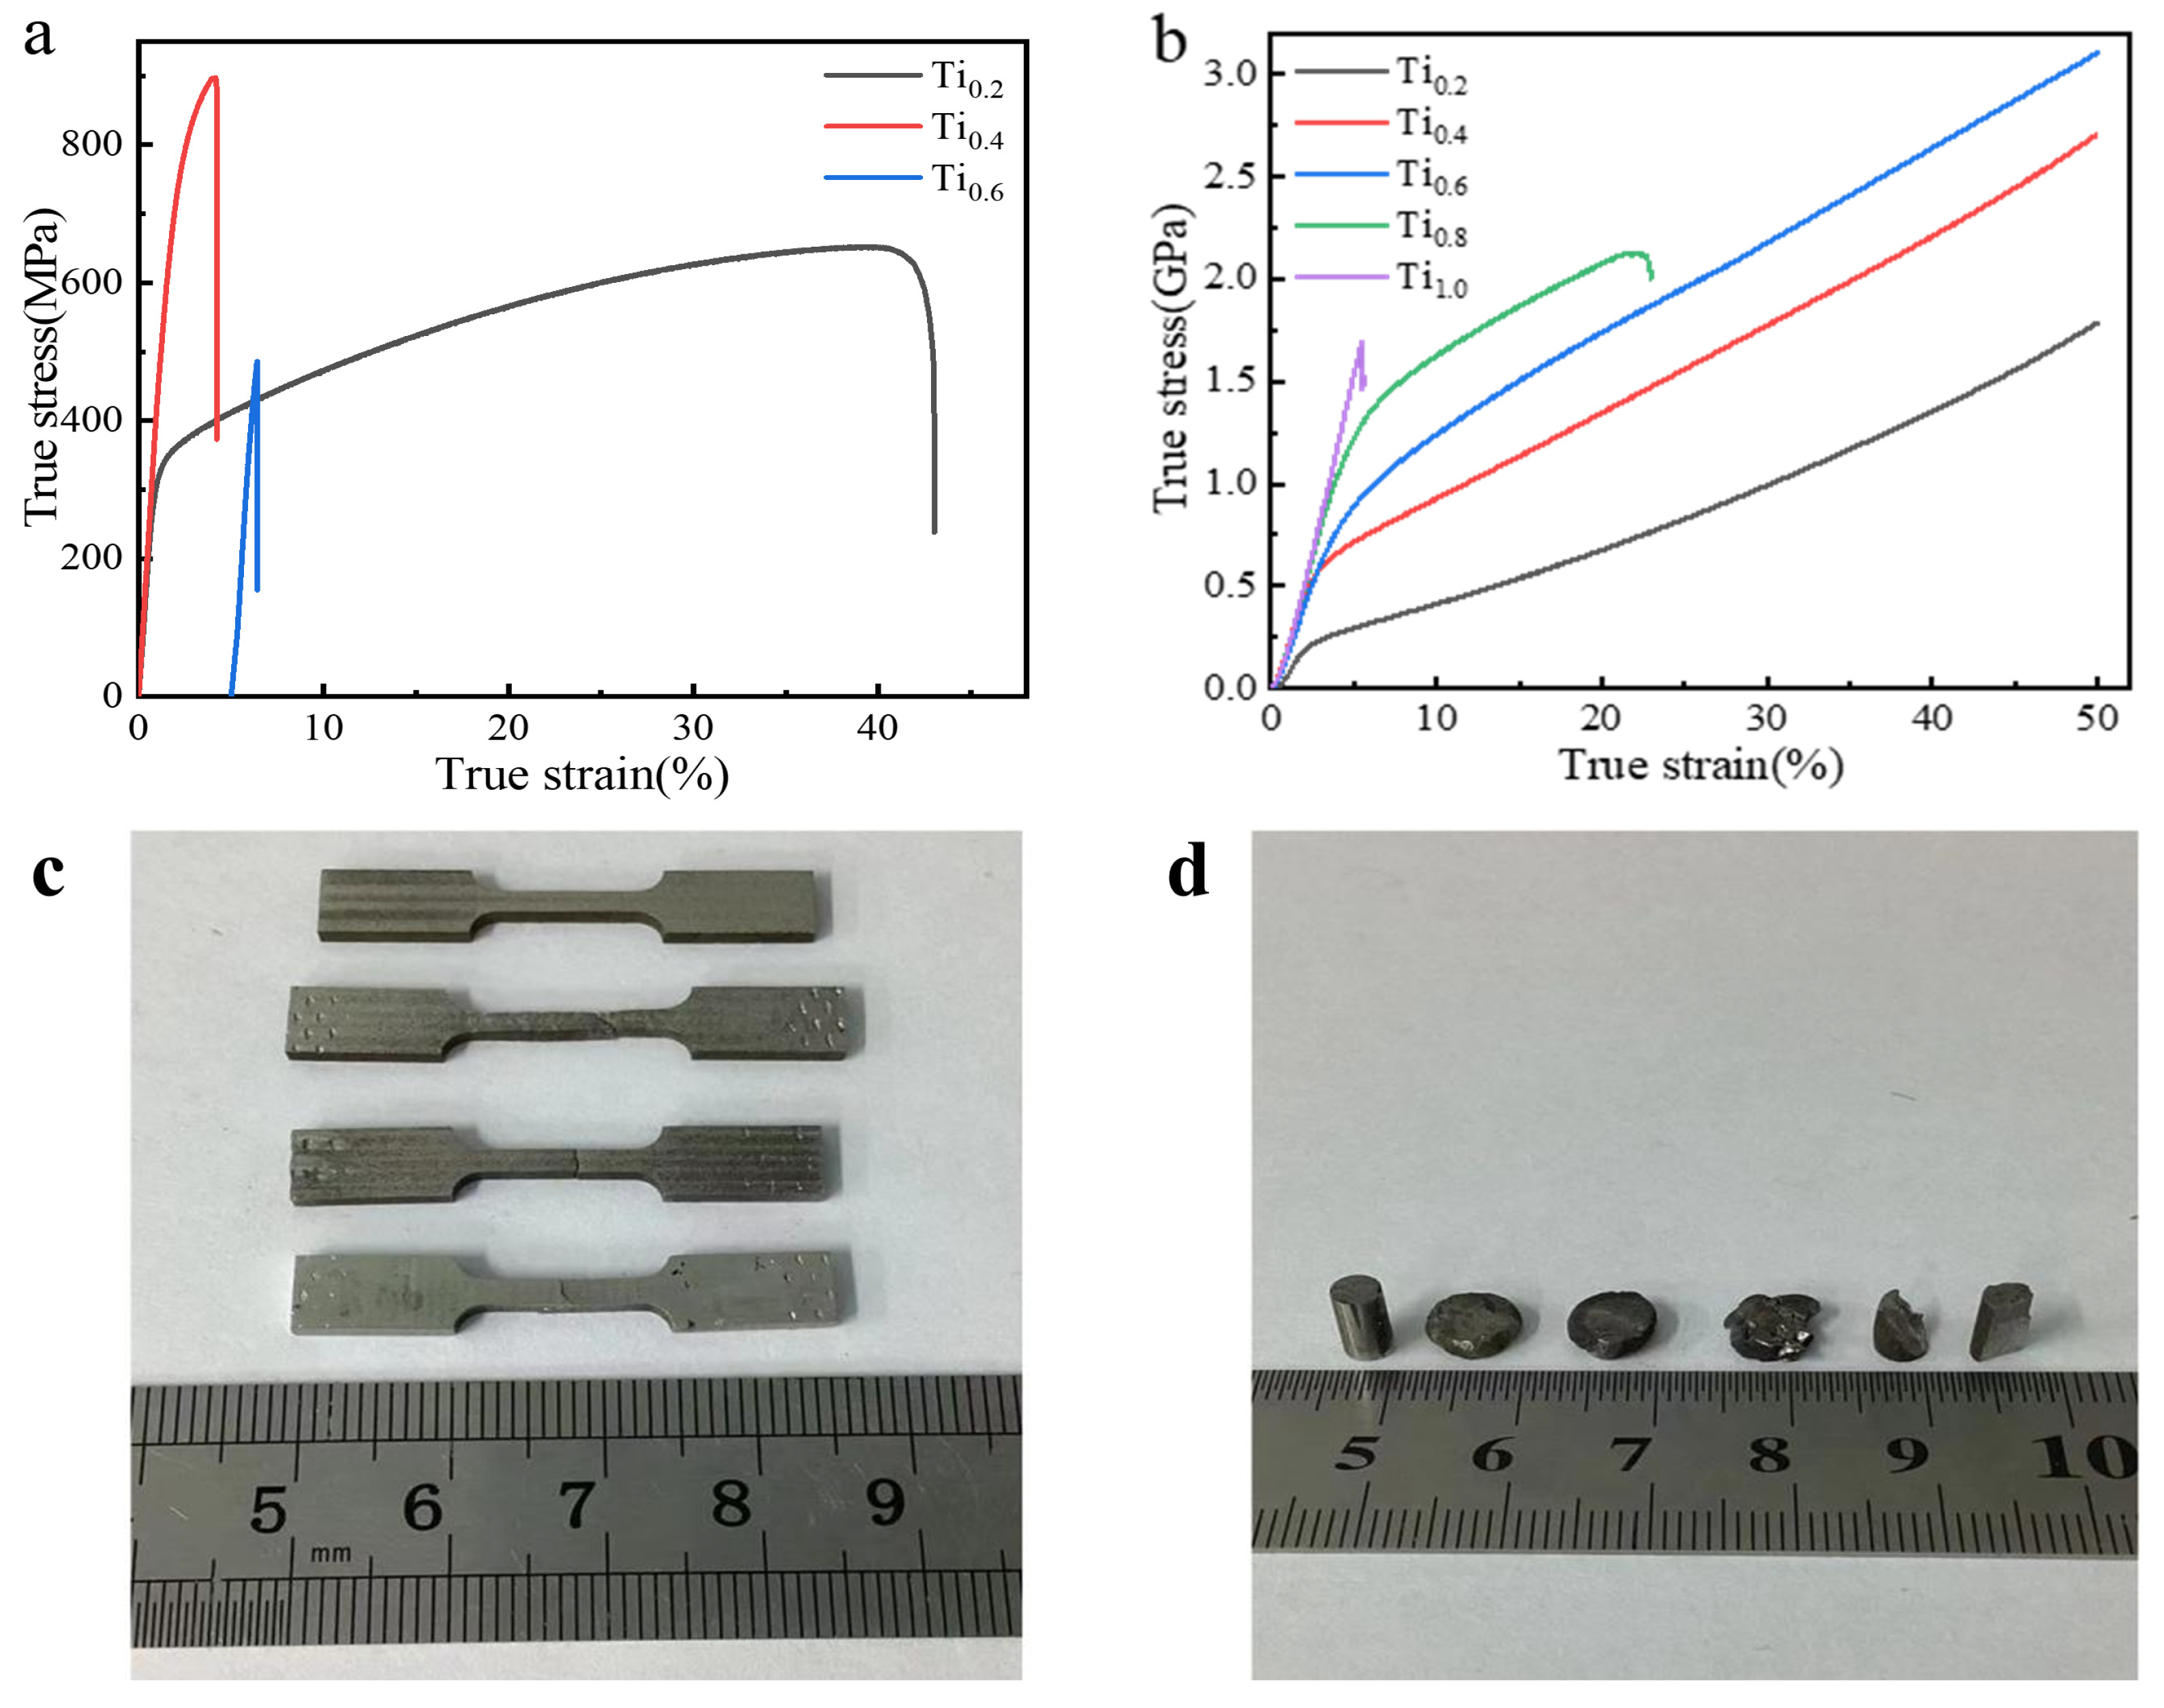
The tensile and compressive stress–strain curves for the CoCrFeNiTix HEAs are shown in Figure 8. Table 4 lists the yield strength, ultimate tensile strength, and elongation values for the HEAs. The data revealed that when x was increased from 0.2 to 0.4, the yield strength, ultimate tensile strength, and elongation of the samples exhibited an increasing trend. Specifically, the tensile yield strength increased by 109.52%, the compressive yield strength increased by 52.19%, and the ultimate tensile strength increased by 37.51%. This indicated that the addition of an appropriate amount of Ti could significantly improve both the strength and ductility of the alloy. Compared to the CoCrFeNiTi0.2 HEA, the CoCrFeNiTi0.4 HEA contained a larger volume fraction of the BCC precipitates within the FCC matrix, which would more effectively impede dislocation slip through a shear strengthening mechanism [51]. This in turn enhanced the ultimate tensile properties of the alloy. However, when the Ti content was increased to 0.6, the alloy’s yield and fracture points occurred almost simultaneously, and the elongation was only 1.4%. This was attributed to the Ti-induced transformation from the FCC phase to the FCC + BCC dual-phase structure. While the BCC phase helped improve the mechanical properties, an excessive amount of the BCC phase made the alloy too brittle. When the Ti content exceeded 0.6, the brittleness became dominant, and the alloy could not be fabricated into standard tensile specimens [52]. When the Ti content was higher than 0.8, it was no longer possible to produce tensile specimens. The tensile and compressive testing demonstrated that among the different Ti contents investigated, the CoCrFeNiTi0.4 HEA exhibited the most favorable overall mechanical performance.
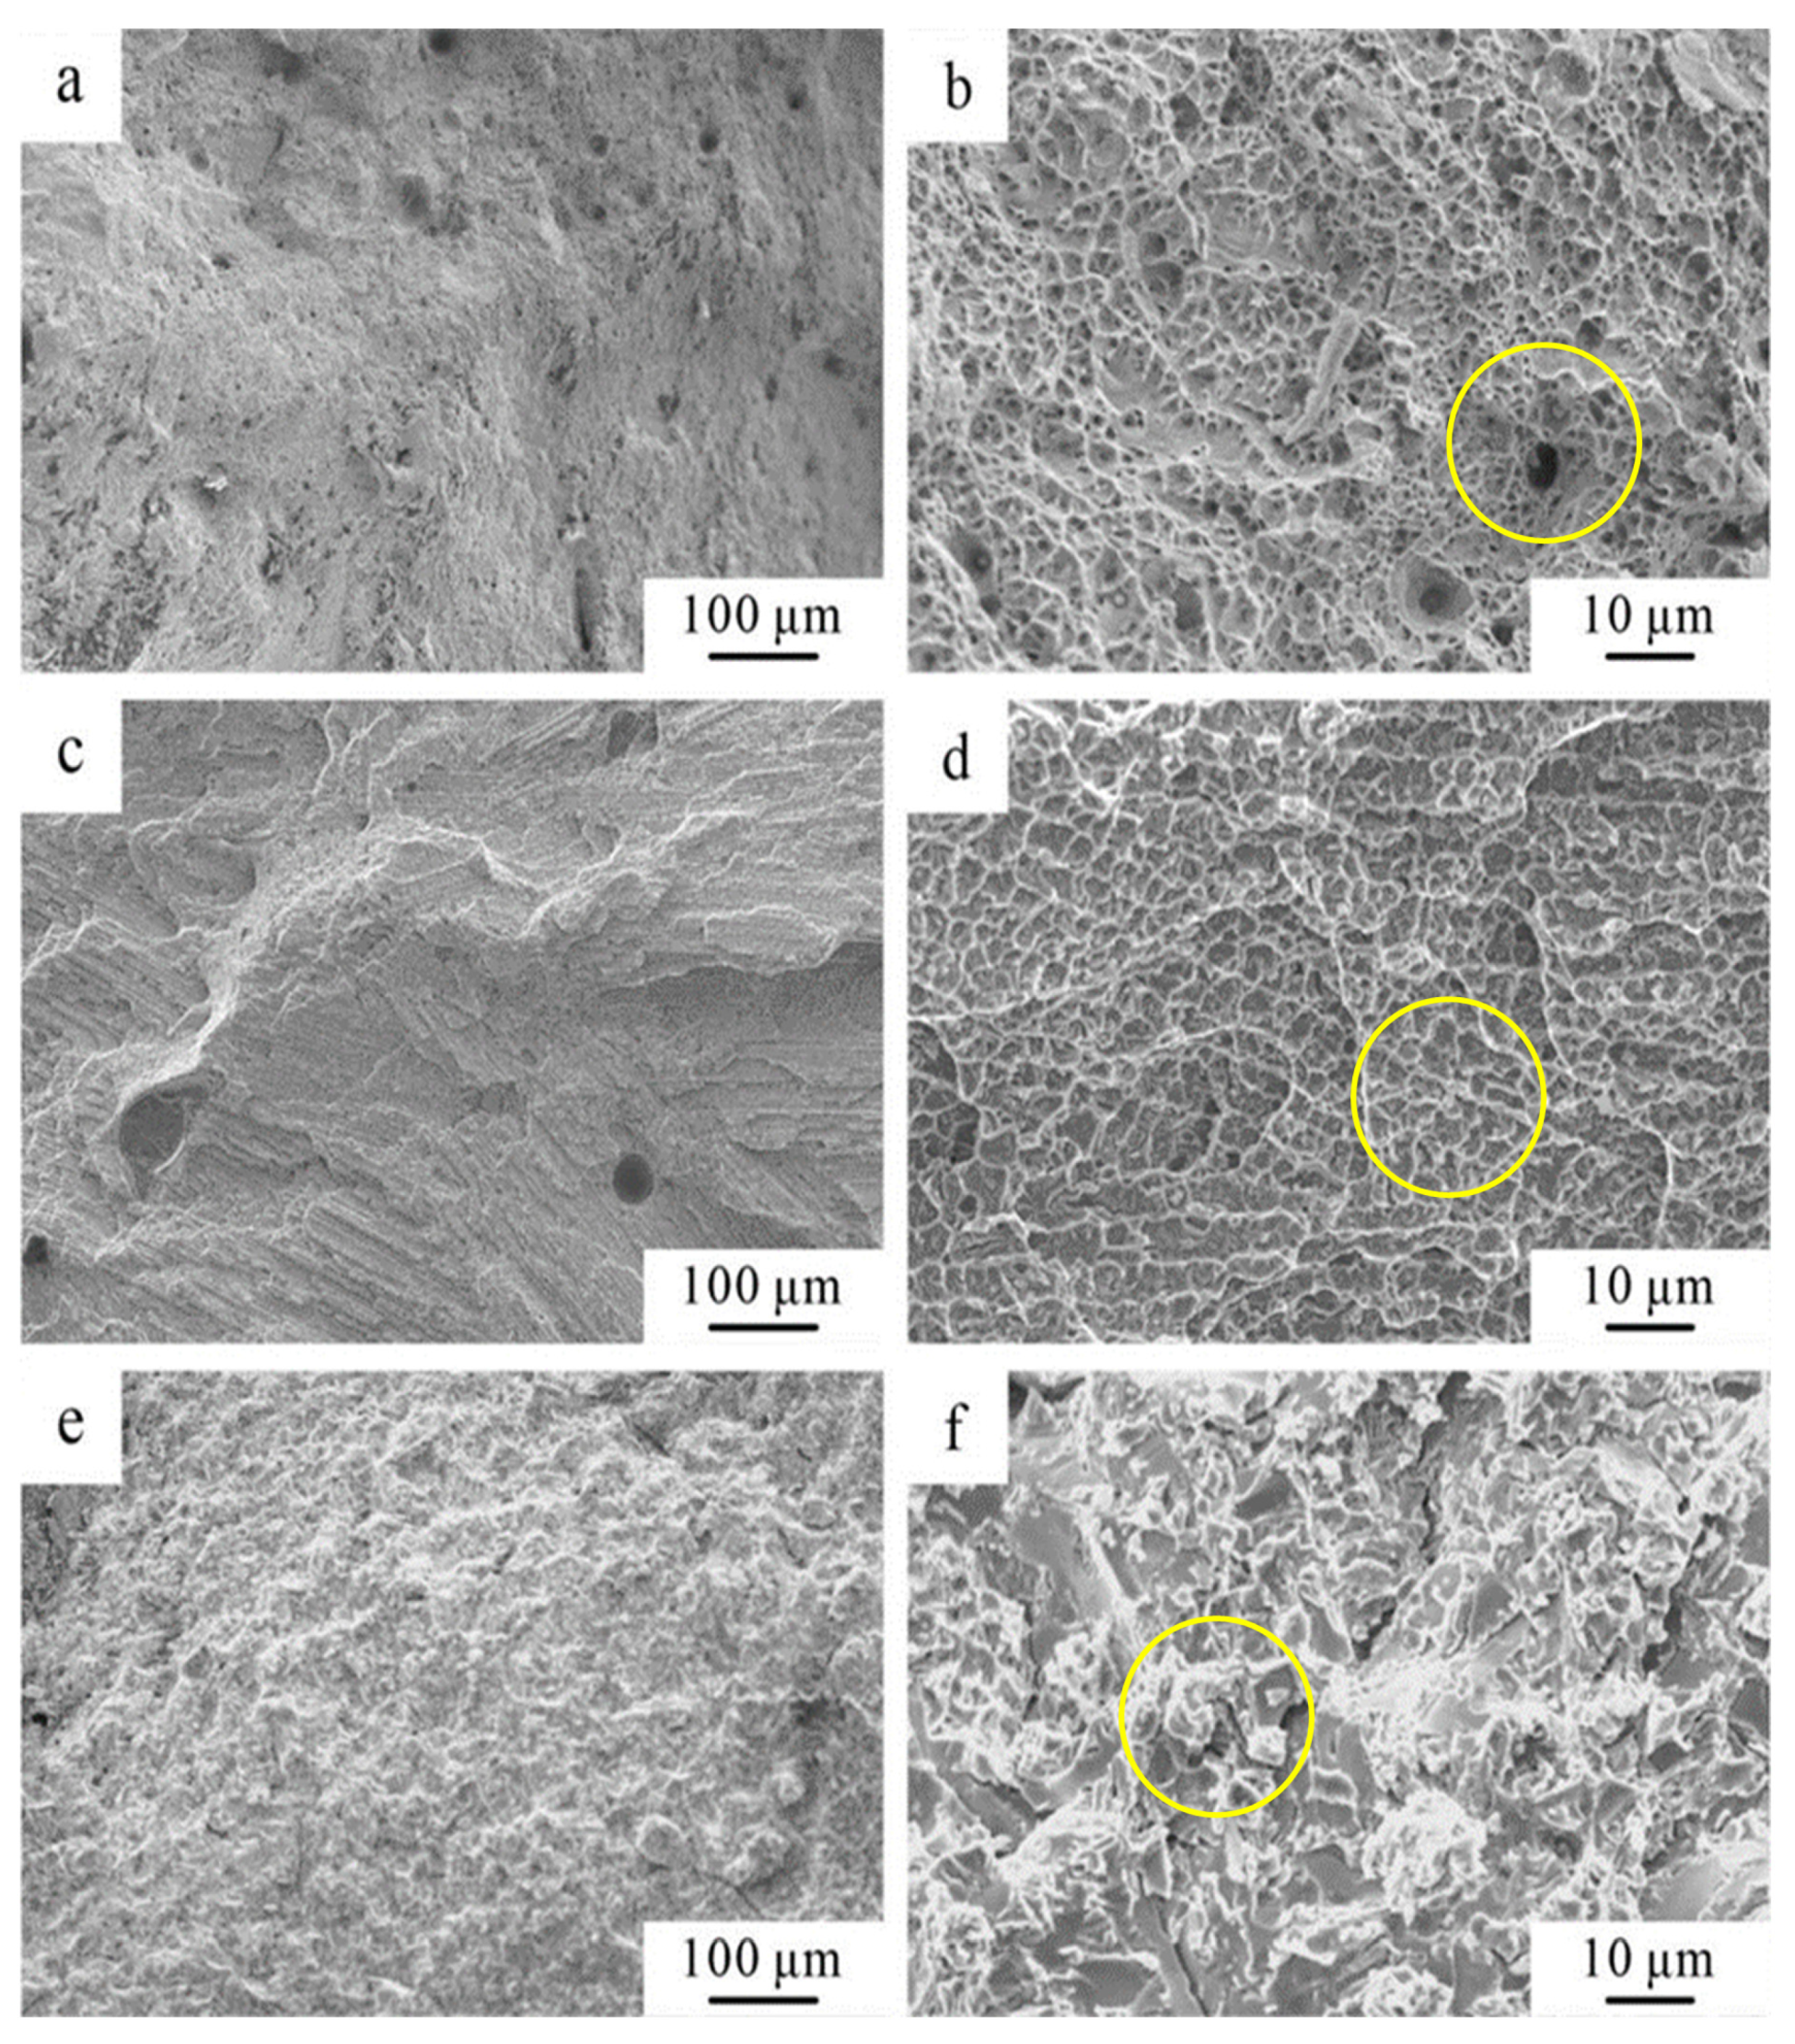
To further elucidate the influence of Ti addition on the fracture mechanisms of the laser-melted CoCrFeNiTix HEAs, SEM observations were conducted on the fracture surfaces of the tensile specimens, as shown in Figure 9. As the Ti content increased from 0.2 to 0.6 at.%, the fracture morphology transitioned from a ductile to a brittle fracture. When the Ti content was 0.2 at.%, the fracture surface exhibited a ductile dimpled morphology. Compared to the pure CoCrFeNi HEAs, the dimples on the fracture surface were larger and more loosely distributed, which was attributed to the lattice distortion caused by the addition of Ti. As the Ti content increased to 0.4 at.%, the BCC phase began to appear at the grain boundaries and dendrite boundaries. The plastic deformation characteristics of the tensile fracture surface started to diminish, as evidenced by the network-like microstructure consisting of both FCC and BCC phases. When the Ti content was further increased to 0.6 at.%, the tensile fracture surface exhibited a pronounced brittle fracture morphology, with numerous polygonal dimples and distinct cleavage facets. The brittle transgranular fracture features, characterized by river-like patterns, could be clearly observed at the bottom of the dimples, while sharp knife-edge fracture surfaces were visible at the top of the dimples. These fracture surface morphologies indicated that during the tensile deformation, the FCC phase yielded first, leading to plastic deformation. As the tensile stress increased, the role of the BCC phase’s lattice resistance diminished, and the BCC phase began to yield. With further increase in the tensile stress, cracks originated within the BCC phase, ultimately resulting in a rapid brittle fracture.

3.3. Analysis of the Corrosion Resistance of CoCrFeNiTix HEAs

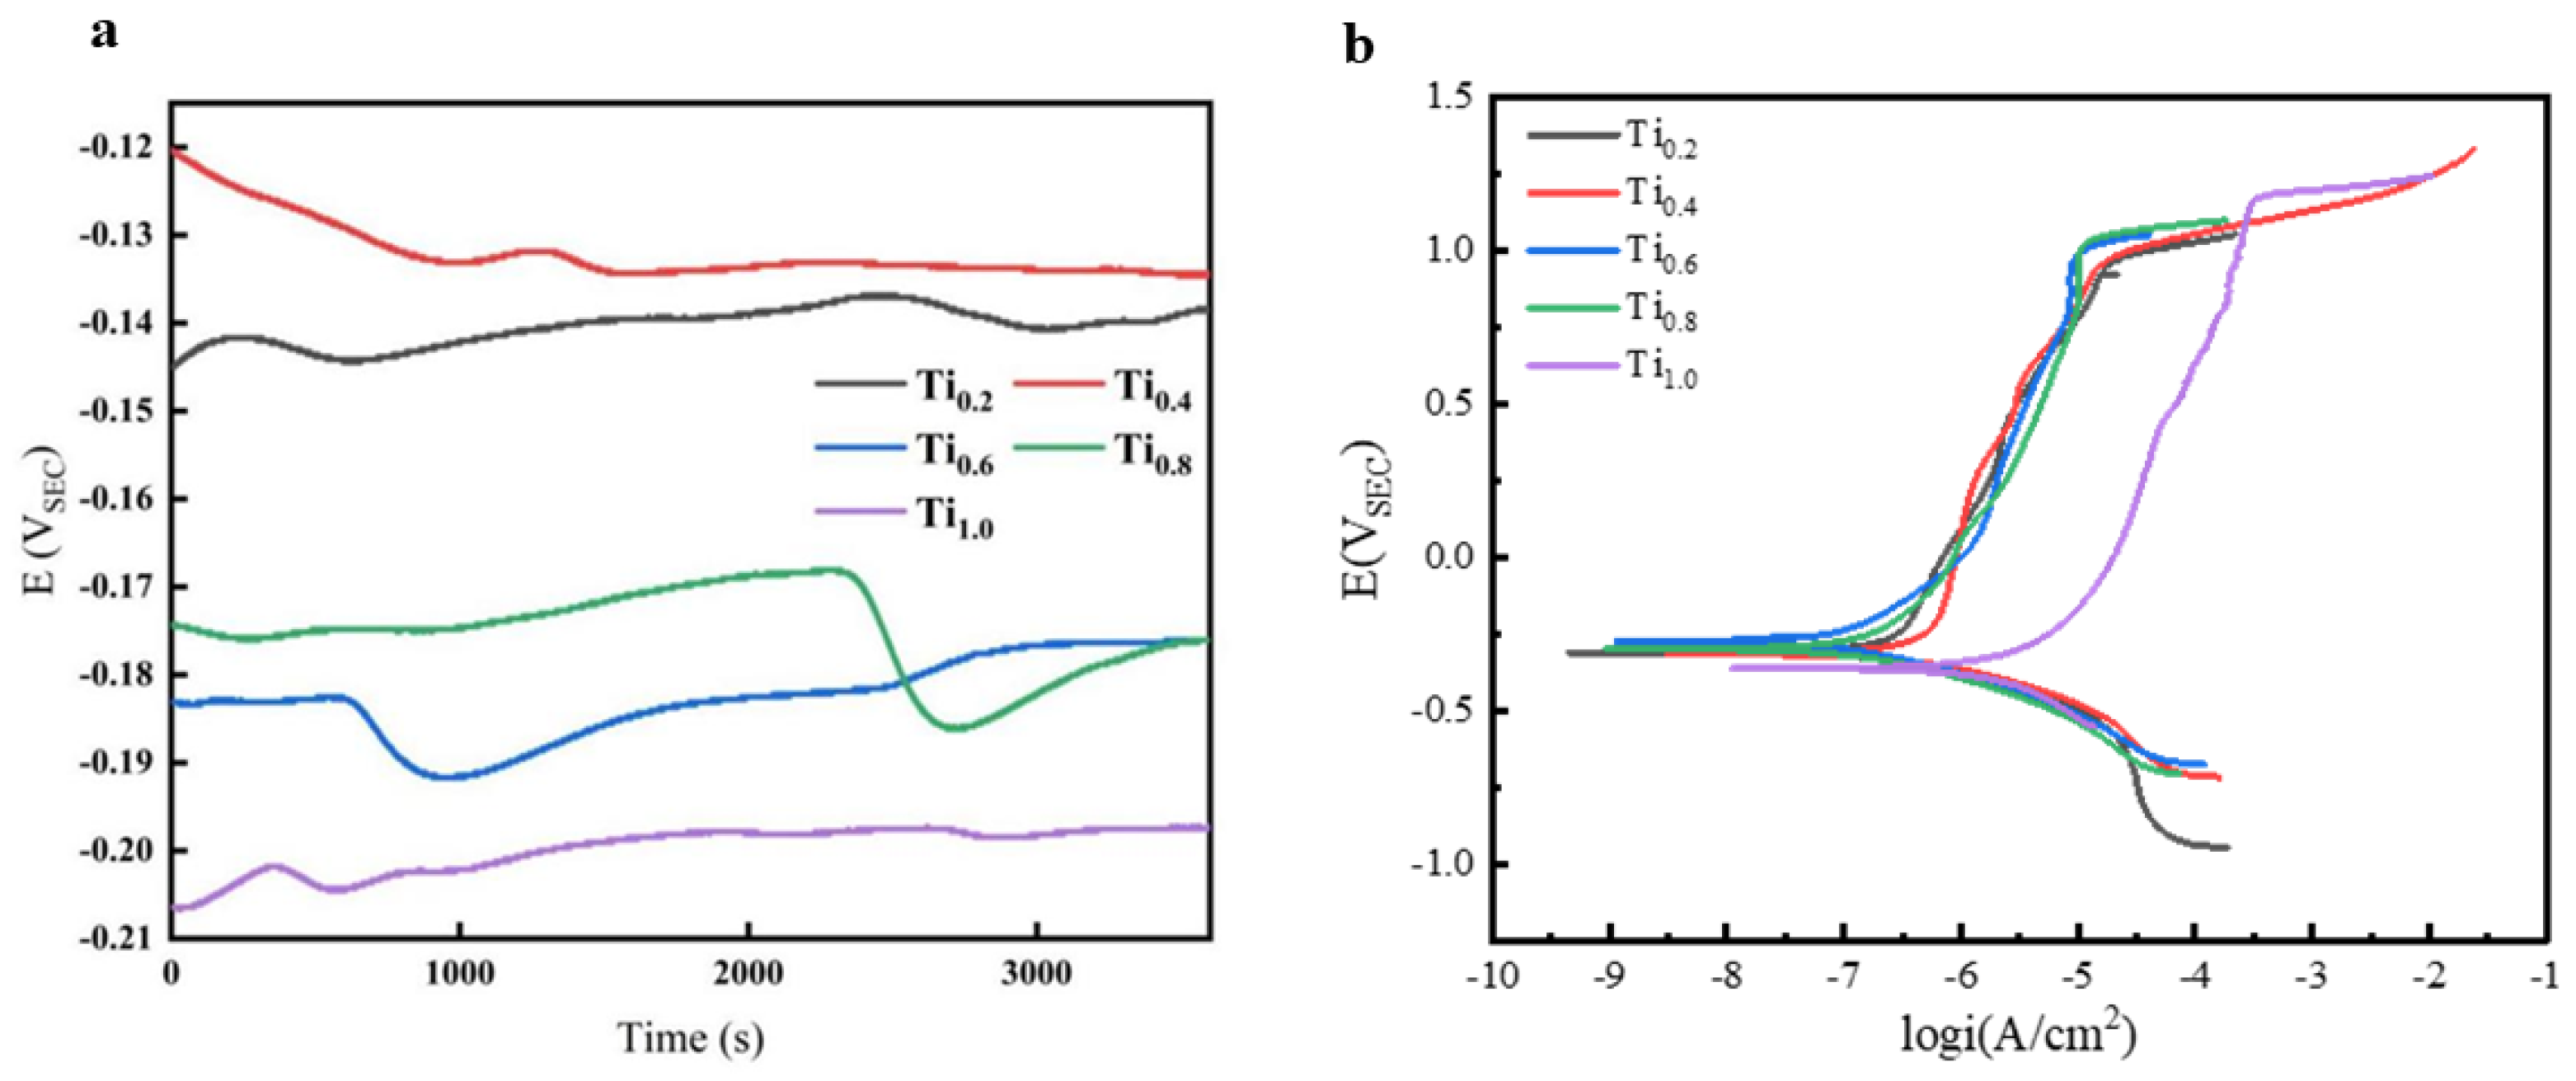
Figure 10a shows the OCP of the HEAs with different Ti contents in a 3.5 wt.% NaCl solution. Generally, the more positive the OCP, the more difficult it is for the surface material to lose electrons and undergo corrosion. Conversely, a more negative OCP indicates a greater tendency for corrosion, suggesting higher surface activity of the material. The OCP can, to some extent, reflect the corrosion tendency of the high-entropy alloy samples in the solution.
The data showed that the OCP of the Ti0.2-containing alloy sample fluctuated between −0.14 V and −0.145 V after 3600 s of immersion in the NaCl solution. The order of OCP from highest to lowest was: 0.4 > 0.2 > 0.8 > 0.6 > 1.0 (Ti atomic ratio, at.%). The OCP was the highest when the Ti atomic ratio was 0.4, indicating a lower tendency for corrosion. When the Ti atomic ratio was 0.2, the OCP was −0.14 V. For Ti atomic ratios of 0.6 and 0.8, the OCP fluctuated around −0.185 V and −0.20 V, respectively, suggesting poorer corrosion resistance in the NaCl solution.
The OCP provided insights into the corrosion tendency of the HEAs in the NaCl solution, but it did not reflect the corrosion rate. The OCP will be further analyzed in conjunction with the AC impedance and polarization curves to understand the specific reasons for the corrosion resistance performance.
Figure 10b shows the polarization curves of the HEAs with different Ti contents in a 3.5% NaCl solution, and the corresponding corrosion potentials, corrosion current densities, and passive current densities are listed in Table 5. HEAs with different Ti contents exhibited relatively long passivation regions in the 3.5% NaCl solution, demonstrating distinct passivation characteristics.
An analysis of the corrosion kinetic parameters revealed that the corrosion potentials of the HEAs with different Ti contents were not significantly different, ranging from −0.269 to −0.300 V. The sample with a Ti atomic ratio of 0.2 had the highest corrosion potential of −0.269 V. Regarding the corrosion current density (icorr), the order from lowest to highest was: 0.4 < 1.0 < 0.2 < 0.6 < 0.8. The passive current density (ipass) is the current density required for the HEAs to maintain passivation, and a lower ipass indicates better corrosion resistance. The data showed that the HEA with a Ti atomic ratio of 0.4 had the lowest passive current density of 3.441 × 10⁻⁵ A/cm2, suggesting that CoCrFeNiTi0.4 HEAs exhibited the best corrosion resistance in the 3.5 wt.% NaCl solution.
The oxide film on the HEA surface underwent a breakdown at the pitting or breakdown potential (Epit) as the potential increased, resulting in a sharp increase in the corrosion current. Based on the HEA characteristics, the Epit in this study is likely associated with the passivation film breakdown mechanism. The HEAs with Ti atomic ratios of 0.2, 0.8, and 1.0 had relatively higher Epit values. In summary, considering the combined factors of impedance, corrosion potential, and corrosion current density, the HEAs with Ti atomic ratios of 0.2 and 0.4 exhibited the best corrosion resistance.
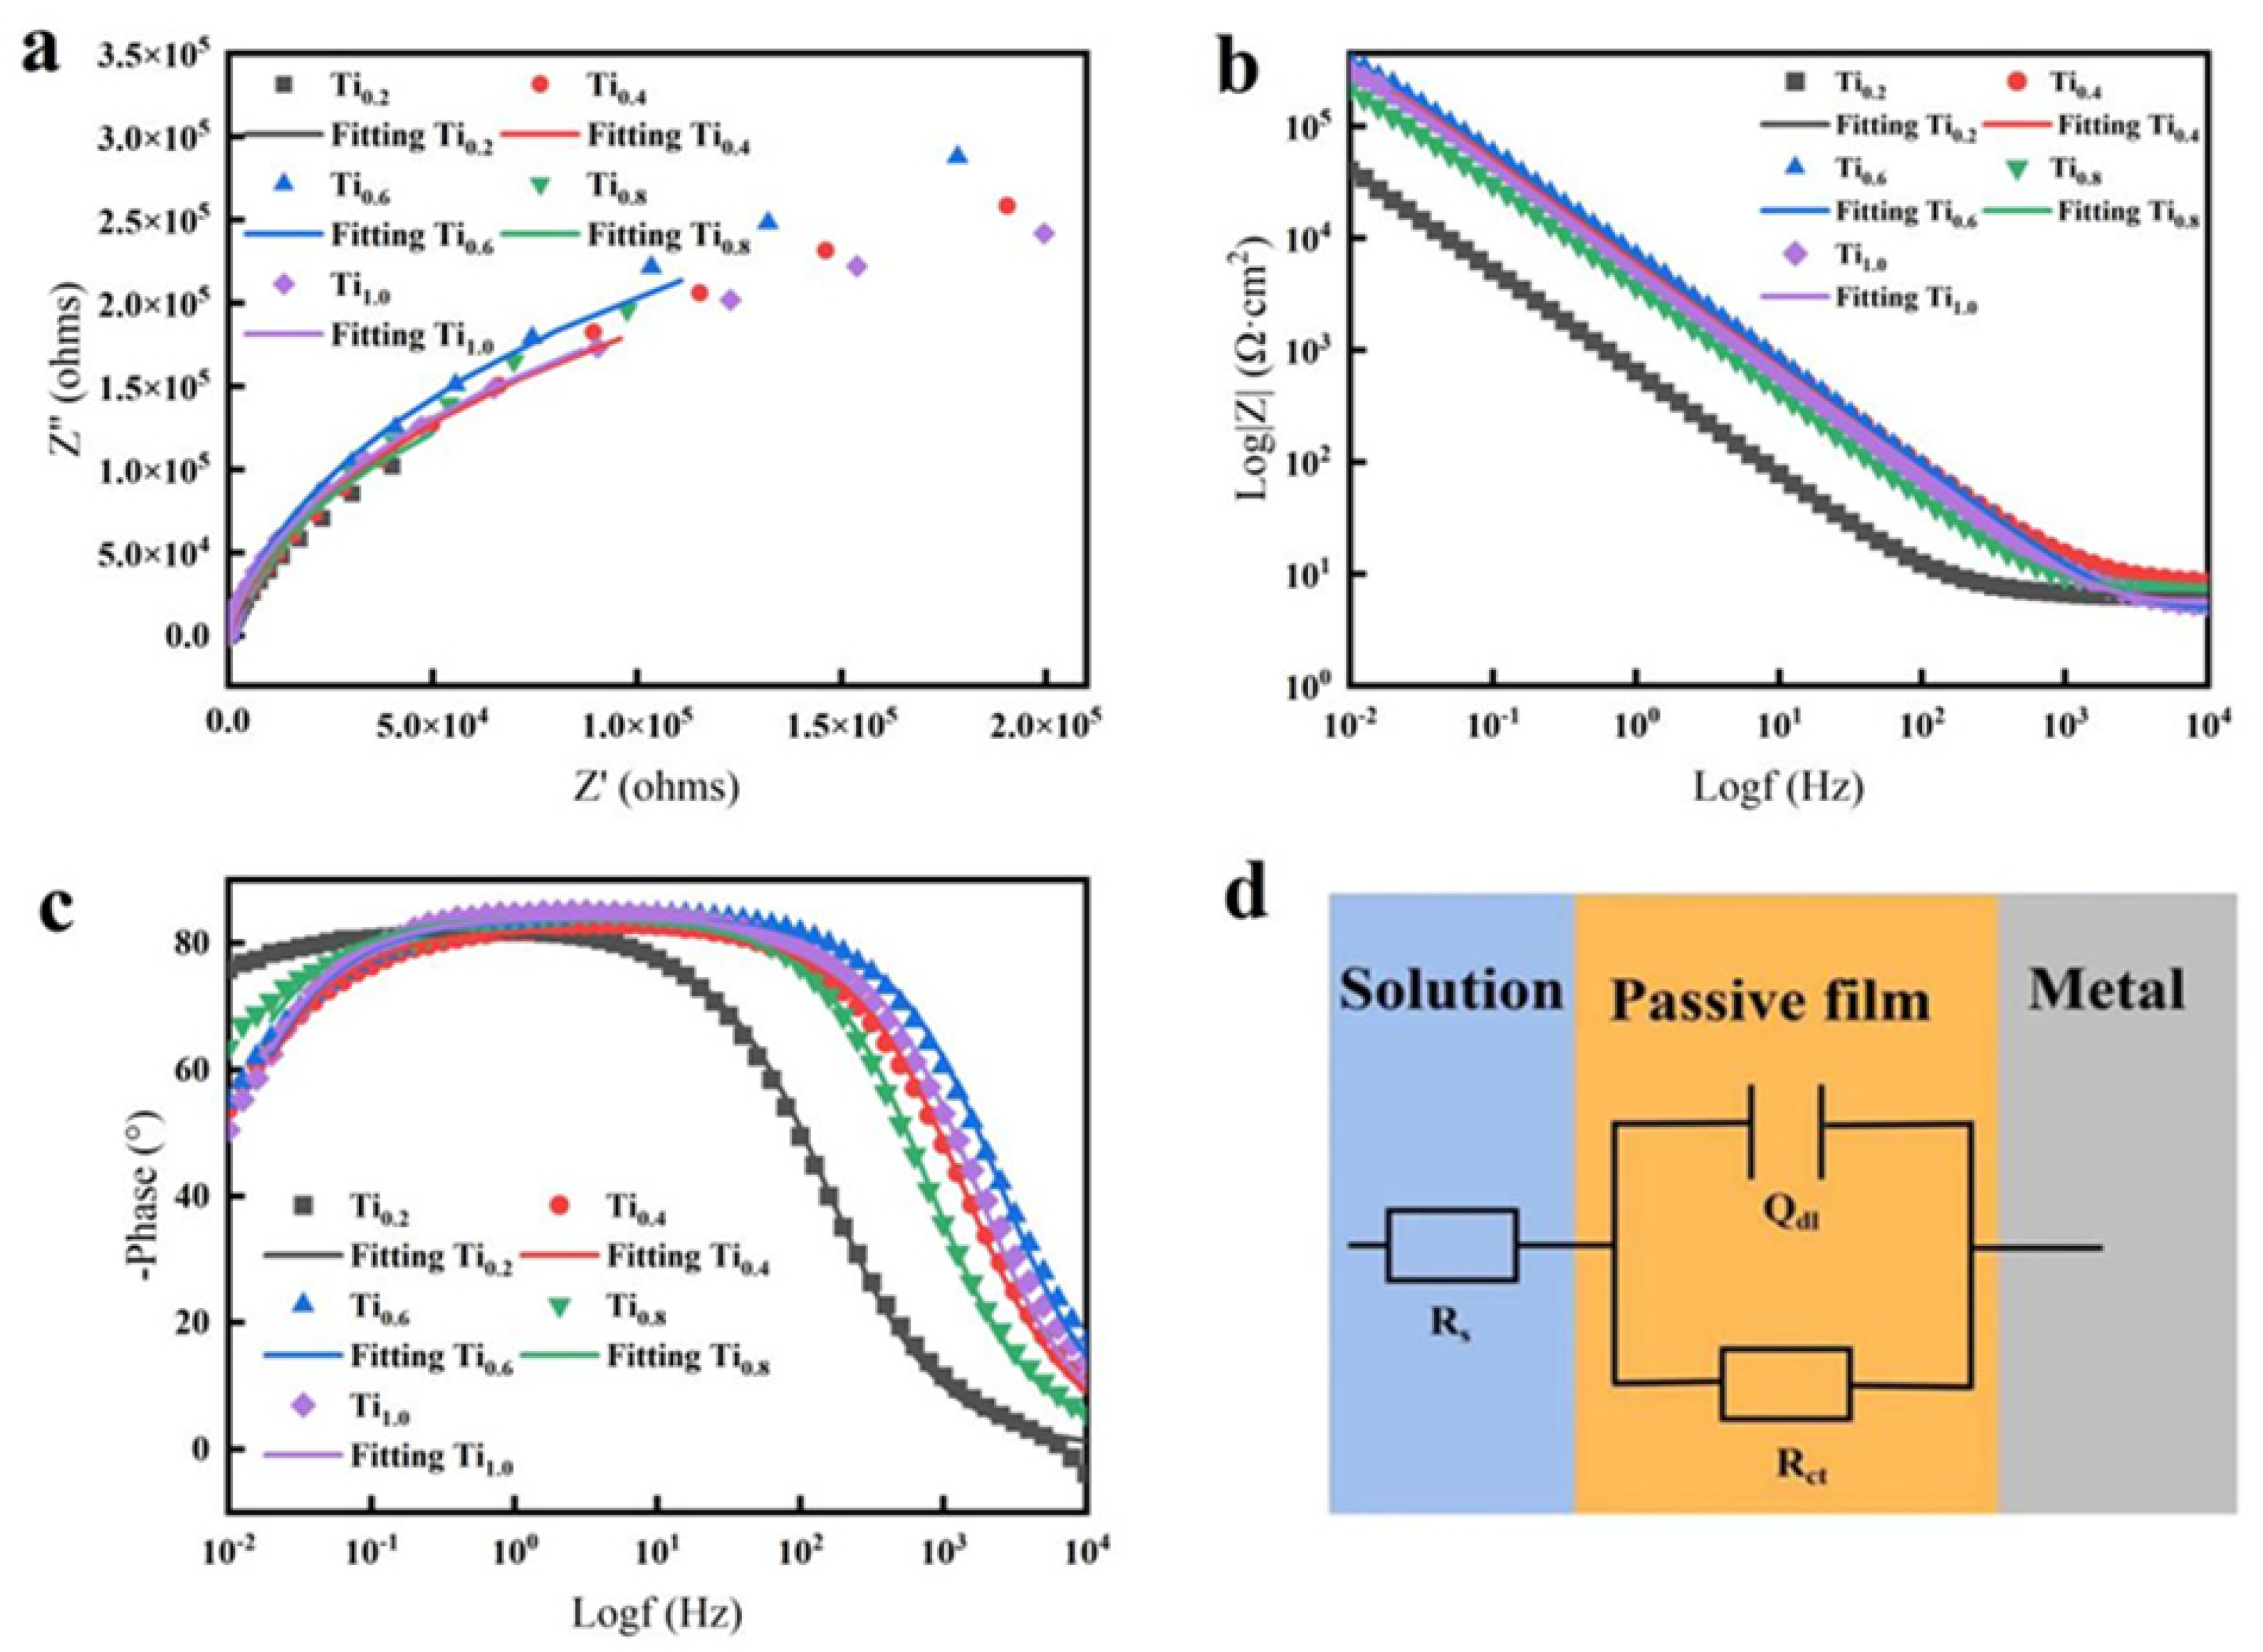
The EIS method provided insights into the changes in the oxide film layer on the HEA sample surfaces, which enabled the investigation of the corrosion resistance performance of the HEAs with different Ti contents. Figure 11a shows the EIS results of the HEAs with different Ti contents in the 3.5 wt.% NaCl solution. The Nyquist plots for the HEA samples exhibited capacitive characteristics. The HEAs with Ti atomic ratios of 0.2, 0.4, and 0.8 had larger capacitive arc radii, indicating the formation of a dense oxide film on the HEA surfaces, which conferred strong corrosion resistance. When the Ti atomic ratio was 1.0, the capacitive arc radius was the smallest, suggesting that the HEA displayed the poorest corrosion resistance at this Ti content.
Figure 11b shows the Bode plots, where the impedance at the lowest frequency further elucidated the electrochemical behavior of the samples. The sample with a 0.4 Ti content had the highest impedance at the lowest frequency, suggesting the best corrosion resistance, consistent with the Nyquist plot results. As shown in Figure 11c, all the samples exhibited a step in the phase angle curve in the mid-frequency range of 101~102 Hz. According to the principles of conventional EIS, the maximum phase angle close to 80° indicates that the formation and growth of the passive film in the mid-frequency range resulted in a near-ideal capacitive response, thereby enhancing the corrosion resistance of the HEA samples.
The impedance data were fitted using the equivalent circuit Rs (Qdl Rct) shown in Figure 11d, and the fitting results are listed in Table 5. The charge transfer resistance (Rct) is the resistance value between the electrode and solution interface, and a lower Rct indicates lower resistance to the electrochemical processes on the sample surface, implying a higher susceptibility to corrosion.
The data in Table 6 show that the Rct values for the samples with Ti atomic ratios of 0.2 and 0.4 were relatively high, at 1.1497 × 10⁶ and 1.0333 × 10⁶ Ω·cm2, respectively. The sample with a Ti atomic ratio of 1.0 had the lowest Rct of 5.3498 × 10⁵ Ω·cm2. Therefore, the impedance analysis indicated that the HEAs with Ti atomic ratios of 0.2 and 0.4 exhibited better corrosion resistance.
In summary, the analysis of the open-circuit potential, electrochemical impedance spectra, and polarization curves showed that the laser melted and deposited CoCrFeNiTix HEA exhibited the best electrochemical corrosion resistance in the 3.5 wt.% NaCl solution when the Ti atomic ratio was 0.4. Further increases in the Ti atomic ratio beyond this content were not beneficial for improving the corrosion resistance of the high-entropy alloy and, in fact, led to a decrease in performance.
The corrosion resistance of the CoCrFeNiTix HEAs was the result of the synergistic effects of the microstructure, phase composition, and the formation of a protective passive film. With the increase in Ti content, the corrosion resistance of the alloys was significantly improved, but this enhancement was not monotonic. The highest corrosion resistance was achieved when the Ti content reached 0.4 at.%. In the CoCrFeNiTi0.4 HEA, the ratio of the FCC and BCC phases likely reached a critical point, resulting in a unique dual-phase microstructure. The FCC phase inherently possessed excellent corrosion resistance, and the small addition of the BCC phase not only did not diminish this property, but also further enhanced the alloy’s ability to resist corrosion through interfacial effects. Additionally, the CoCrFeNiTi0.4 HEA may have formed a more stable and compact passive film. As the Ti content was increased further, the increased volume fraction of the BCC phase not only improved the strength, but also introduced more grain boundaries. While this microstructure was beneficial for mechanical properties, it likely became the preferential site for corrosion initiation, leading to a decline in the corrosion resistance.
When the Ti content was 0.2 at.%, the HEAs exhibited a single FCC phase, as shown in Figure 12a. This phase had relatively good ductility but lower strength. With the increase in Ti content, a small amount of BCC phase began to form, and the resulting FCC + BCC dual-phase structure significantly enhanced the mechanical properties. The phase boundaries in this dual-phase structure impeded dislocation motion, thereby increasing the strength. The difference in the elastic modulus and yield strength between the FCC and BCC phases resulted in a non-uniform stress distribution, which likely facilitated stress redistribution and suppressed rapid crack propagation, improving the fracture toughness. Furthermore, the formation of the BCC phase promoted heterogeneous nucleation and refined the grain structure. According to the Hall–Petch relationship, a smaller average grain diameter corresponds to a higher yield strength. This dual-phase structure greatly improved the mechanical performance of the HEAs. When the Ti content increased to 0.4 at.%, as shown in Figure 12b, the dual-phase structure achieved a good synergistic effect, balancing the strength and toughness. As the Ti content was further increased, the proportion of the BCC phase gradually increased, and a fishbone-like grain structure emerged, as shown in Figure 12c–e. The fishbone-like grains further enhanced the strength of the alloy. This explained why the hardness of the alloy increased significantly with increasing Ti content, reaching a maximum value at a Ti content of 1.0 at.%.
In this study, by adding Ti elements to the CoCrFeNi HEA, the mechanical properties of the CoCrFeNiTix HEA have been improved on the basis of basically maintaining the excellent corrosion resistance of the CoCrFeNi HEA [50], but the excessive Ti elements have reduced its mechanical properties and corrosion resistance. This provides an additional choice of metallic material for deep-sea applications and other fields, as well as providing researchers with a reference for the microstructure and properties of CoCrFeNiTix HEAs. In tensile test specimen preparation, it was found that when the Ti content exceeded 0.6 at.%, the overly brittle alloy could not be prepared as a standard tensile part because brittleness dominated [52]. Furthermore, it has been shown that an appropriate ratio of Ti and Al elements (Ti/Al ratio between 0.7 and 2) in CoCrFeNi(TixAly) 0.2 HEAs can promote the formation of a desirable FCC/L12 duplex structure. This synergy can serve to balance the role of Ti in promoting the formation of the L12 phase and Al in stabilizing the L12 phase, while inhibiting the formation of other intermetallic compounds [53]. Therefore, in subsequent studies, the contradiction between strength and ductility will be resolved by introducing both Ti and Al elements into CoCrFeNi HEAs and further exploring the promotion of L12 phase formation by varying the total amount of both elements added.

4. Conclusions

The present study employed the LMD technique to fabricate a series of CoCrFeNiTix HEA bulk samples with Ti contents of 0.2, 0.4, 0.6, 0.8, and 1.0 at.%. The influence of varying Ti content on the microstructure, phase composition, mechanical properties, and corrosion resistance of this HEA series was investigated. The relationships between the microstructural evolution and the mechanical/corrosion performance were established, leading to the following conclusions:
(1)
When the Ti content was 0.2 at.%, the CoCrFeNiTi0.2 HEA consisted of a single FCC phase. As the Ti content increased, the CoCrFeNiTix HEAs transitioned from a single FCC phase to a dual-phase FCC and BCC structure. With the increase in Ti content, the microstructure of the CoCrFeNiTix HEAs underwent a transformation from an equiaxed to a dendritic morphology, accompanied by grain refinement;
(2)
The hardness of the HEA gradually increased with the addition of Ti. The CoCrFeNiTi1.0 HEA exhibited the highest Vickers hardness of 804.5 HV, which was 4.13 times higher than the Vickers hardness of the Ti-free CoCrFeNi HEA (191 HV). This was attributed to solid solution strengthening, grain refinement, and secondary phase strengthening mechanisms. When the Ti content was 0.4 at.%, the CoCrFeNiTix HEA exhibited the optimal mechanical performance, with a yield strength of 412.5 MPa (104.4 MPa higher than CoCrFeNi) and an ultimate tensile strength of 711.2 MPa (136.9 MPa higher than CoCrFeNi). The addition of titanium enhanced the solid solution strengthening, grain refinement strengthening, and secondary phase strengthening capabilities of the alloy, leading to a substantial increase in the microhardness. When the titanium content reached 1.0 at.%, the hardness increased by 4.13 times;
(3)
The CoCrFeNiTi0.4 HEA demonstrated the best corrosion resistance in a 3.5 wt.% NaCl solution, which was likely related to the promotion of the BCC phase formation by the addition of Ti;
(4)
The study of the relationship between the microstructural evolution and the mechanical and corrosion performance of the CoCrFeNiTix HEAs revealed that the alloy properties were primarily influenced by the phase composition (FCC/BCC ratio). When x = 0.4 at.%, the CoCrFeNiTi0.4 HEA with a dual FCC and BCC phase structure likely achieved the optimal FCC-to-BCC ratio.
In summary, by the LMD process, the proportion of the BCC phase in the CoCrFeNiTix HEA system increased with the increase in titanium content. For the mechanical performance, an excessive amount of the BCC phase would lead to embrittlement of the alloy, while for the corrosion resistance, the BCC phase was beneficial for improving the alloy’s corrosion resistance. Therefore, controlling the titanium content to achieve the optimal FCC/BCC ratio was particularly important.

Author Contributions

Software, D.S. and C.L.; Validation, H.H.; Investigation, L.L., D.S., K.W. and P.T.; Resources, G.S.; Data curation, L.L., Y.M. and C.L.; Writing—review and editing, D.S., H.H. and K.W.; Funding acquisition, G.S. All authors have read and agreed to the published version of the manuscript.

Funding

This work was supported by Guangdong Basic and Applied Basic Research (2022A1515010761, 2022A1515140028), Foshan Technology Project (1920001000409), and the Key Laboratory of Guangdong Regular Higher Education (2017KSYS012).

Institutional Review Board Statement

Not applicable.

Informed Consent Statement

Not applicable.

Data Availability Statement

Data are contained within the article.

Acknowledgments

The authors are grateful to the Guangdong Provincial Key Laboratory of Industrial Intelligent Inspection Technology for its support.

Conflicts of Interest

Author Shao Guanghui was employed by the company Datang Boiler and Pressure Vessel Inspection Center Co., Ltd. The remaining authors declare that the research was conducted in the absence of any commercial or financial relationships that could be construed as a potential conflict of interest.

References

  1. Yeh, J.W.; Chang, S.Y.; Hong, Y.D.; Chen, S.K.; Lin, S.J. Anomalous decrease in X-ray diffraction intensities of Cu–Ni–Al–Co–Cr–Fe–Si alloy systems with multi-principal elements. Mater. Chem. Phys. 2007, 103, 41–46. [Google Scholar] [CrossRef]
  2. Cantor, B.; Chang, I.T.; Knight, P.; Vincent, A.J. Microstructural development in equiatomic multicomponent alloys. Mater. Sci. Eng. A 2004, 375–377, 213–218. [Google Scholar] [CrossRef]
  3. Zhang, Y.; Zuo, T.T.; Tang, Z.; Gao, M.C.; Dahmen, K.A.; Liaw, P.K.; Lu, Z.P. Microstructures and properties of high-entropy alloys. Prog. Mater. Sci. 2014, 61, 1–93. [Google Scholar] [CrossRef]
  4. Bracq, G.; Laurent-Brocq, M.; Perrière, L.; Pirès, R.; Joubert, J.M.; Guillot, I. The fcc solid solution stability in the Co-Cr-Fe-Mn-Ni multi-component system. Acta Mater. 2017, 128, 327–336. [Google Scholar] [CrossRef]
  5. Gwalani, B.; Choudhuri, D.; Soni, V.; Ren, Y.; Styles, M.; Hwang, J.; Nam, S.; Ryu, H.; Hong, S.H.; Banerjee, R. Cu assisted stabilization and nucleation of L12 precipitates in Al0.3CuFeCrNi2 fcc-based high entropy alloy. Acta Mater. 2017, 129, 170–182. [Google Scholar] [CrossRef]
  6. King, D.J.; Middleburgh, S.C.; McGregor, A.G.; Cortie, M.B. Predicting the formation and stability of single phase high-entropy alloys. Acta Mater. 2016, 104, 172–179. [Google Scholar] [CrossRef]
  7. Rao, J.C.; Diao, H.Y.; Ocelík, V.; Vainchtein, D.; Zhang, C.; Kuo, C.; Tang, Z.; Guo, W.; Poplawsky, J.D.; Zhou, Y.; et al. Secondary phases in AlxCoCrFeNi high-entropy alloys: An in-situ TEM heating study and thermodynamic appraisal. Acta Mater. 2017, 131, 206–220. [Google Scholar] [CrossRef]
  8. Butler, T.M.; Weaver, M.L. Investigation of the phase stabilities in AlNiCoCrFe high entropy alloys. J. Alloys Compd. 2017, 691, 119–129. [Google Scholar] [CrossRef]
  9. Chen, M.; Lan, L.; Shi, X.; Yang, H.; Zhang, M.; Qiao, J. The tribological properties of Al0.6CoCrFeNi high-entropy alloy with the σ phase precipitation at elevated temperature. J. Alloys Compd. 2019, 777, 180–189. [Google Scholar] [CrossRef]
  10. Jiang, H.; Han, K.; Qiao, D.; Lu, Y.; Cao, Z.; Li, T. Effects of Ta addition on the microstructures and mechanical properties of CoCrFeNi high entropy alloy. Mater. Chem. Phys. 2018, 210, 43–48. [Google Scholar] [CrossRef]
  11. Fujieda, T.; Shiratori, H.; Kuwabara, K.; Hirota, M.; Kato, T.; Yamanaka, K.; Koizumi, Y.; Chiba, A.; Watanabe, S. CoCrFeNiTi-based high-entropy alloy with superior tensile strength and corrosion resistance achieved by a combination of additive manufacturing using selective electron beam melting and solution treatment. Mater. Lett. 2017, 189, 148–151. [Google Scholar] [CrossRef]
  12. Luo, H.; Li, Z.; Mingers, A.M.; Raabe, D. Corrosion behavior of an equiatomic CoCrFeMnNi high-entropy alloy compared with 304 stainless steel in sulfuric acid solution. Corros. Sci. 2018, 134, 131–139. [Google Scholar] [CrossRef]
  13. Liu, H.; Sun, S.; Zhang, T.; Zhang, G.; Yang, H.; Hao, J. Effect of Si addition on microstructure and wear behavior of AlCoCrFeNi high-entropy alloy coatings prepared by laser cladding. Surf. Coat. Technol. 2021, 405, 126522. [Google Scholar] [CrossRef]
  14. Ali, N.; Zhang, L.; Liu, D.; Zhou, H.; Sanaullah, K.; Zhang, C.; Chu, J.; Nian, Y.; Cheng, J. Strengthening mechanisms in high entropy alloys: A review. Mater. Today Commun. 2022, 33, 104686. [Google Scholar] [CrossRef]
  15. He, F.; Wang, Z.; Niu, S.; Wu, Q.; Li, J.; Wang, J.; Liu, C.T.; Dang, Y. Strengthening the CoCrFeNiNb0.25 high entropy alloy by FCC precipitate. J. Alloys Compd. 2016, 667, 53–57. [Google Scholar] [CrossRef]
  16. Wu, J.; Zhu, H.; Xie, Z. Strength and ductility synergy of Nb-alloyed Ni0.6CoFe1.4 alloys. Int. J. Miner. Metall. Mater. 2023, 30, 707–714. [Google Scholar] [CrossRef]
  17. Liu, W.H.; Yang, T.; Liu, C.T. Precipitation hardening in CoCrFeNi-based high entropy alloys. Mater. Chem. Phys. 2018, 210, 2–11. [Google Scholar] [CrossRef]
  18. Cai, B.; Liu, B.; Kabra, S.; Wang, Y.; Yan, K.; Lee, P.D.; Liu, Y. Deformation mechanisms of Mo alloyed FeCoCrNi high entropy alloy: In situ neutron diffraction. Acta Mater. 2017, 127, 471–480. [Google Scholar] [CrossRef]
  19. Wu, Z.; Bei, H.; Pharr, G.M.; George, E.P. Temperature dependence of the mechanical properties of equiatomic solid solution alloys with face-centered cubic crystal structures. Acta Mater. 2014, 81, 428–441. [Google Scholar] [CrossRef]
  20. Chen, Y.; Deng, H.W.; Xie, Z.M.; Wang, M.M.; Yang, J.F.; Zhang, T.; Xiong, Y.; Liu, R.; Wang, X.P.; Fang, Q.F.; et al. Tailoring microstructures and tensile properties of a precipitation-strengthened (FeCoNi)94Ti6 medium-entropy alloy. J. Alloys Compd. 2020, 828, 154457. [Google Scholar] [CrossRef]
  21. Huang, X.; Huang, L.; Peng, H.; Liu, Y.; Liu, B.; Li, S. Enhancing strength-ductility synergy in a casting non-equiatomic NiCoCr-based high-entropy alloy by Al and Ti combination addition. Scr. Mater. 2021, 200, 113898. [Google Scholar] [CrossRef]
  22. Dai, C.; Luo, H.; Li, J.; Du, C.; Liu, Z.; Yao, J. X-ray photoelectron spectroscopy and electrochemical investigation of the passive behavior of high-entropy FeCoCrNiMox alloys in sulfuric acid. Appl. Surf. Sci. 2020, 499, 143903. [Google Scholar] [CrossRef]
  23. Chen, Y.Y.; Duval, T.; Hung, U.D.; Yeh, J.W.; Shih, H.C. Microstructure and electrochemical properties of high entropy alloys—A comparison with type-304 stainless steel. Corros. Sci. 2005, 47, 2257–2279. [Google Scholar] [CrossRef]
  24. Yen, C.-C.; Lu, H.-N.; Tsai, M.-H.; Wu, B.-W.; Lo, Y.-C.; Wang, C.-C.; Chang, S.-Y.; Yen, S.-K. Corrosion mechanism of annealed equiatomic AlCoCrFeNi tri-phase high-entropy alloy in 0.5 M H2SO4 aerated aqueous solution. Corros. Sci. 2019, 157, 462–471. [Google Scholar] [CrossRef]
  25. Dai, C.; Zhao, T.; Du, C.; Liu, Z.; Zhang, D. Effect of molybdenum content on the microstructure and corrosion behavior of FeCoCrNiMox high-entropy alloys. J. Mater. Sci. Technol. 2020, 46, 64–73. [Google Scholar] [CrossRef]
  26. Hsu, Y.-J.; Chiang, W.-C.; Wu, J.-K. Corrosion behavior of FeCoNiCrCux high-entropy alloys in 3.5% sodium chloride solution. Mater. Chem. Phys. 2005, 92, 112–117. [Google Scholar] [CrossRef]
  27. Shi, Y.; Yang, B.; Xie, X.; Brechtl, J.; Dahmen, K.A.; Liaw, P.K. Corrosion of Al CoCrFeNi high-entropy alloys: Al-content and potential scan-rate dependent pitting behavior. Corros. Sci. 2017, 119, 33–45. [Google Scholar] [CrossRef]
  28. Zhou, Z.; Li, H.; Liu, Y.; Niu, T.; Li, H. Effect of Ti on the corrosion behavior of (FeCrCoNi)100−xTix alloy. Corros. Sci. 2022, 209, 110807. [Google Scholar] [CrossRef]
  29. Cui, P.; Xia, T.; Wang, J.; Wang, H.; Lai, Z.; Liu, Y.; Qu, N.; Zhu, J. Unraveling microstructure evolution during isothermal annealing treatment in dual-phase FeNiCr0.8Al0.8 high entropy alloy and its effect on corrosion behavior. Corros. Sci. 2024, 237, 112287. [Google Scholar] [CrossRef]
  30. Liang, J.-T.; Cheng, K.-C.; Chen, S.-H. Effect of heat treatment on the phase evolution and mechanical properties of atomized AlCoCrFeNi high-entropy alloy powders. J. Alloys Compd. 2019, 803, 484–490. [Google Scholar] [CrossRef]
  31. Li, X.; Feng, Y.; Liu, B.; Yi, D.; Yang, X.; Zhang, W.; Chen, G.; Liu, Y.; Bai, P. Influence of NbC particles on microstructure and mechanical properties of AlCoCrFeNi high-entropy alloy coatings prepared by laser cladding. J. Alloys Compd. 2019, 788, 485–494. [Google Scholar] [CrossRef]
  32. Shen, Q.; Kong, X.; Chen, X. Fabrication of bulk Al-Co-Cr-Fe-Ni high-entropy alloy using combined cable wire arc additive manufacturing (CCW-AAM): Microstructure and mechanical properties. J. Mater. Sci. Technol. 2021, 74, 136–142. [Google Scholar] [CrossRef]
  33. Li, Q.; Chen, X.; Zhang, J.; Jayalakshmi, S.; Arvind Singh, R. Investigation of the Effect of the Thermo-Mechanical Processing of Additively Manufactured CoCrFeNiAl0.4 High-Entropy Alloy. Adv. Eng. Mater. 2022, 24, 2101628. [Google Scholar] [CrossRef]
  34. Liu, L.; Zhang, Y.; Han, J.; Wang, X.; Jiang, W.; Liu, C.T.; Zhang, Z.; Liaw, P.K. Nanoprecipitate-Strengthened High-Entropy Alloys. Adv. Sci. 2021, 8, 2100870. [Google Scholar] [CrossRef] [PubMed]
  35. Senkov, O.N.; Scott, J.M.; Senkova, S.V.; Miracle, D.B.; Woodward, C.F. Microstructure and room temperature properties of a high-entropy TaNbHfZrTi alloy. J. Alloys Compd. 2011, 509, 6043–6048. [Google Scholar] [CrossRef]
  36. Fujieda, T.; Chen, M.; Shiratori, H.; Kuwabara, K.; Yamanaka, K.; Koizumi, Y.; Chiba, A.; Watanabe, S. Mechanical and corrosion properties of CoCrFeNiTi-based high-entropy alloy additive manufactured using selective laser melting. Addit. Manuf. 2019, 25, 412–420. [Google Scholar] [CrossRef]
  37. Krishna, S.A.; Noble, N.; Radhika, N.; Saleh, B. A comprehensive review on advances in high entropy alloys: Fabrication and surface modification methods, properties, applications, and future prospects. J. Manuf. Process. 2024, 109, 583–606. [Google Scholar] [CrossRef]
  38. Zhou, Z.; Cui, T.; Guo, H.; Lv, W.; Wang, J.; Peng, X. Laser additively manufacturing of Al0.5CoCrFeNiTi0.5 high-entropy alloys with increased resistances to corrosion 3.5% NaCl and oxidation at 1000 °C. J. Mater. Sci. 2023, 58, 10148–10165. [Google Scholar] [CrossRef]
  39. Zhang, Q.; Han, B.; Li, M.; Chen, Z.; Hu, C.; Jia, C. Comparison of CoCrFeNi coatings prepared via high-speed laser cladding and normal laser cladding on microstructure and properties. Intermetallics 2023, 153, 107795. [Google Scholar] [CrossRef]
  40. Wang, W.R.; Qi, W.; Zhang, X.L.; Yang, X.; Xie, L.; Li, D.Y.; Xiang, Y.H. Superior corrosion resistance-dependent laser energy density in (CoCrFeNi)95Nb5 high entropy alloy coating fabricated by laser cladding. Int. J. Miner. Metall. Mater. 2021, 28, 888–897. [Google Scholar] [CrossRef]
  41. ASTM E8; Standard Test Methods for Tension Testing of Metallic Materials. ASTM International: West Conshohocken, PA, USA, 2013.
  42. Li, X.; Li, Z.; Wu, Z.; Zhao, S.; Zhang, W.; Bei, H.; Gao, Y. Strengthening in Al-, Mo- or Ti-doped CoCrFeNi high entropy alloys: A parallel comparison. J. Mater. Sci. Technol. 2021, 94, 264–274. [Google Scholar] [CrossRef]
  43. Dong, Y.; Chen, Q.S.; Lu, Y.P.; Zhang, P.C.; Li, T.J. Effect of aging temperature on microstructure and hardness of CoCrFeNiTi0.5 high entropy alloy. Mater. Sci. Forum 2014, 789, 48–53. [Google Scholar] [CrossRef]
  44. Liu, S.Y.; Corbin, M.; Yung, C. High throughput synthesis of CoCrFeNiTi high entropy alloys via directed energy deposition. J. Alloys Compd. 2022, 916, 165469. [Google Scholar] [CrossRef]
  45. Lu, Q.; Chen, X.; Tian, W.; Wang, H.; Liu, P.; Zhou, H.; Fu, S.; Gao, Y.; Wan, M.; Wang, X. Corrosion behavior of a non-equiatomic CoCrFeNiTi high-entropy alloy: A comparison with 304 stainless steel in simulated body fluids. J. Alloys Compd. 2022, 897, 163036. [Google Scholar] [CrossRef]
  46. Gu, X.; Huang, D.; Zhuang, Y. Significant evolutions of microstructure and mechanical properties of Al0.3CoCrFeNiTix high-entropy alloys under annealing treatment. Vacuum 2022, 204, 111350. [Google Scholar] [CrossRef]
  47. Li, Y.T.; Fu, H.G.; Ma, T.J.; Wang, K.M.; Yang, X.J.; Lin, J. Microstructure and wear resistance of AlCoCrFeNi-WC/TiC composite coating by laser cladding. Mater. Charact. 2022, 194, 112479. [Google Scholar] [CrossRef]
  48. Jiang, C.; Zhang, J.; Chen, Y.; Hou, Z.; Zhao, Q.; Li, Y.; Zhu, L.; Zhang, F.; Zhao, Y. On enhancing wear resistance of titanium alloys by laser cladded WC-Co composite coatings. Int. J. Refract. Met. Hard Mater. 2022, 107, 105902. [Google Scholar] [CrossRef]
  49. Zhen, G.; Sheng, Q.X.; Sun, C.F. Microstructure and properties of laser cladding and CoCr2.5FeNi2Tix high-entropy alloy composite coatings. J. Alloys Compd. 2020, 819, 152986. [Google Scholar]
  50. Shao, G.; Lei, J.; Zhang, F.; Wang, S.; Hu, H.; Wang, K.; Tan, P.; Yi, J. A Study of the Microstructure and Mechanical and Electrochemical Properties of CoCrFeNi High-Entropy Alloys Additive-Manufactured Using Laser Metal Deposition. Coating 2023, 13, 1583. [Google Scholar] [CrossRef]
  51. Ma, Y.; Wang, Q.; Jiang, B.; Li, C.; Hao, J.; Li, X.; Dong, C.; Nieh, T. Controlled formation of coherent cuboidal nanoprecipitates in body-centered cubic high-entropy alloys based on Al2(Ni,Co,Fe,Cr)14 compositions. Acta Mater. 2018, 147, 213–225. [Google Scholar] [CrossRef]
  52. Shen, Q.; Xue, J.; Yu, X.; Zheng, Z.; Ou, N. Powder plasma arc additive manufacturing of CoCrFeNiWx high-entropy alloys: Microstructure evolution and mechanical properties. J. Alloys Compd. 2022, 922, 166245. [Google Scholar] [CrossRef]
  53. Chen, D.; He, F.; Han, B.; Wu, Q.; Tong, Y.; Zhao, Y.; Wang, Z.; Wang, J.; Kai, J.J. Synergistic effect of Ti and Al on L12-phase design in CoCrFeNi-based high entropy alloys. Intermetallics 2019, 110, 106476. [Google Scholar] [CrossRef]
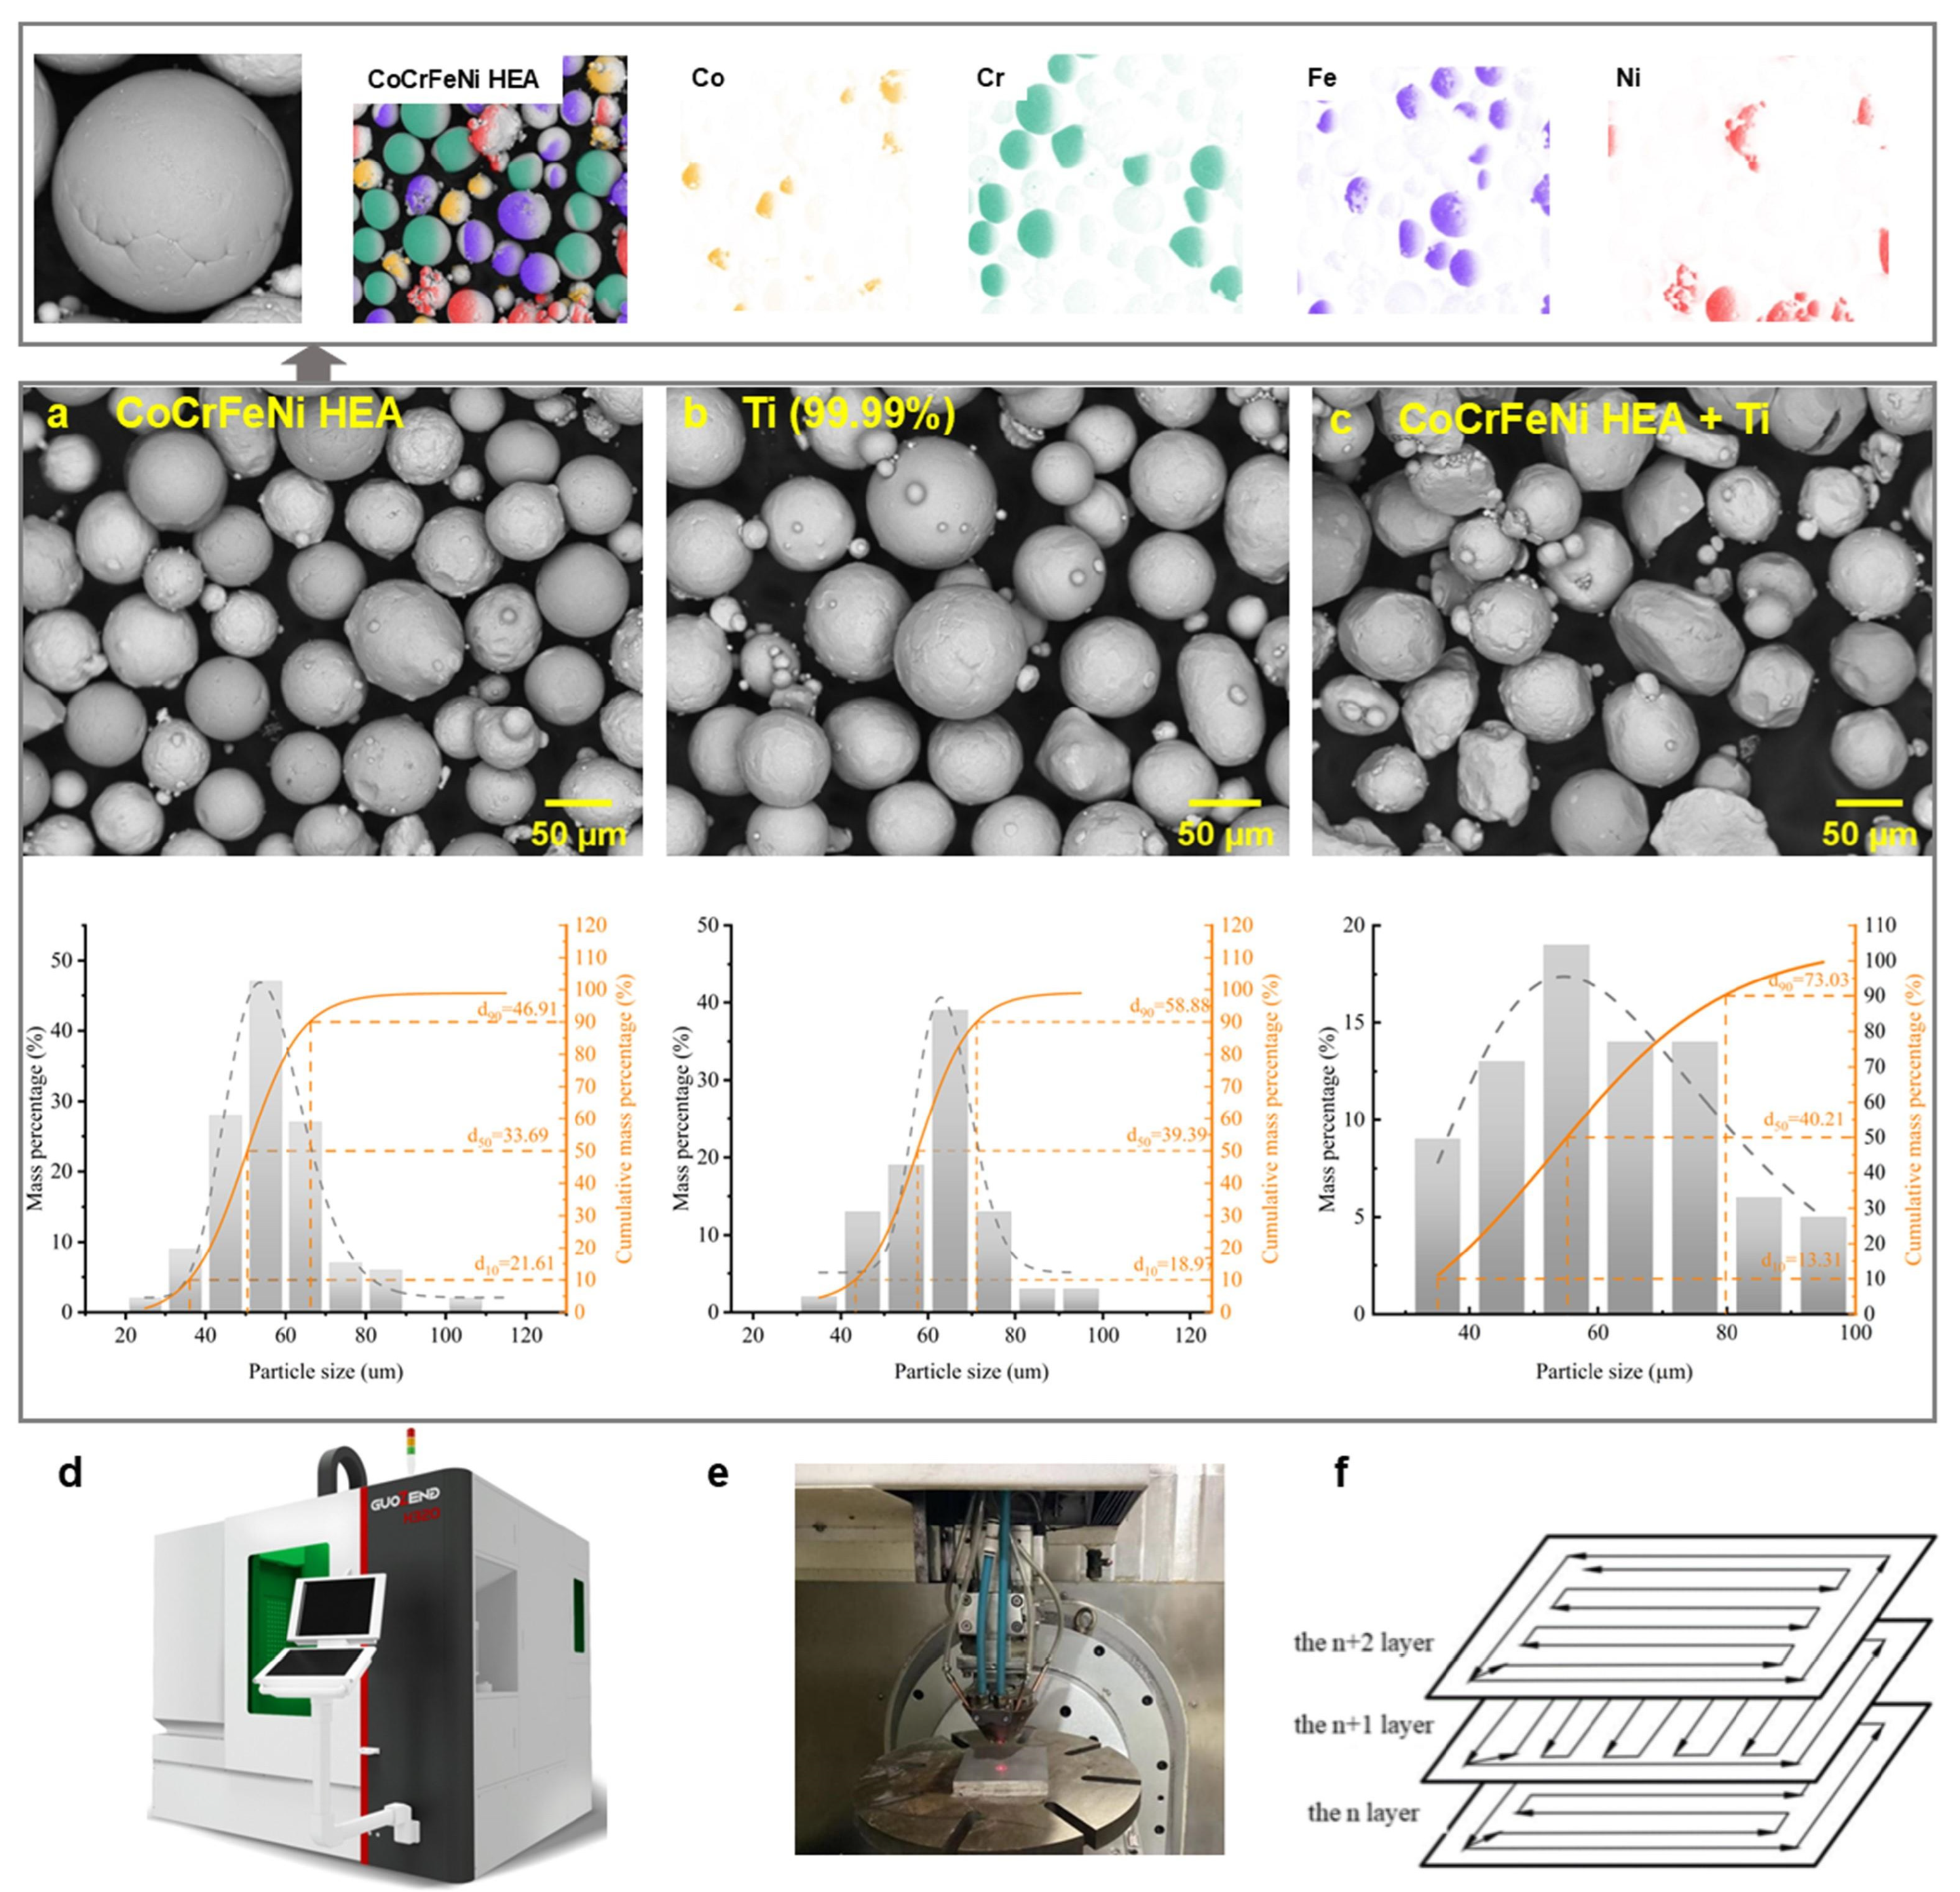
Figure 1. Preparation and microstructure of CoCrFeNiTi powder: (a) CoCrFeNi powder; (b) pure Ti powder; (c) CoCrFeNiTi powder; (d) laser deposition equipment; (e) laser melting head; (f) laser scanning path diagram.
Coatings 14 01171 g001
Figure 2. XRD results of CoCrFeNiTix HEA samples: (a,b) XRD patterns.
Coatings 14 01171 g002
Figure 3. OM diagrams of CoCrFeNiTix HEA: (a) Ti0.2; (b) Ti0.4; (c) Ti0.6; (d) Ti0.8; (e) Ti1.0.
Coatings 14 01171 g003
Figure 4. SEM images of CoCrFeNiTix HEAs: (a,b) Ti0.2; (c,d) Ti0.4; (e,f) Ti0.6; (g,h) Ti0.8; (i,j) Ti1.0.
Coatings 14 01171 g004
Figure 5. EBSD diagram of CoCrFeNiTix HEAs: (a) Ti0.2; (b) Ti0.4; (c) Ti0.6; (d) Ti0.8; (e) IPF diagram.
Coatings 14 01171 g005
Figure 6. Surface scanning EDS of CoCrFeNiTix HEAs: (a) Ti0.2; (b) Ti0.4; (c) Ti0.6; (d) Ti0.8; (e) Ti1.0.
Coatings 14 01171 g006
Figure 7. (a) Microhardness distribution diagram of CoCrFeNiTix HEAs; (b) CoCrFeNiTix HEA average microhardness histogram.
Coatings 14 01171 g007
Figure 8. (a,b) Tension and compression stress–strain curves of CoCrFeNiTix HEA; (c) comparison of samples before and after tensile strength testing; (d) samples before and after compression.
Coatings 14 01171 g008
Figure 9. SEM fracture morphology of CoCrFeNiTix high-entropy alloy tensile parts: (a,b) Ti0.2; (c,d) Ti0.4; (e,f) Ti0.6.
Coatings 14 01171 g009
Figure 10. OCP and polarization results of AlCoCrFeNi HEAs in a 3.5 wt% NaCl solution: (a) open circuit; (b) polarization curves.
Coatings 14 01171 g010
Figure 11. EIS results of AlCoCrFeNi HEAs in a 3.5 wt% NaCl solution: (a) Nyquist plots; (b) Bode plots; (c) phase angle curves; and (d) equivalent circuit employed for fitting the EIS data.
Coatings 14 01171 g011
Figure 12. CoCrFeNiTix HEA microevolutionary relationships for different Ti elemental ratios. (a) A single FCC phase; (b) Formation of small amounts of BCC phase; (c) Initial formation of sub-fishbone grains on the basis of the FCC + BCC dual-phase; (d) Initial formation of fishbone grains; (e) Formation of more fishbone grains on the basis of FCC + BCC dual-phase.
Coatings 14 01171 g012
Table 1. Crystal plane spacing and lattice constant of CoCrFeNiTix HEAs’ (111) surface.
HEACoCrFeNiTi0.2CoCrFeNiTi0.4CoCrFeNiTi0.6CoCrFeNiTi0.8CoCrFeNiTi1.0
Crystal plane spacing/nm0.20760.20790.20810.20890.2093
lattice constant/nm0.35960.36010.36040.36190.3625
Table 2. EDS analysis results of CoCrFeNiTix HEAs.
HEAAreaCoCrFeNiTi
CoCrFeNiTi0.2nominal23.8123.8123.8123.814.76
21.5122.5424.9722.293.72
CoCrFeNiTi0.4nominal22.7222.7222.7222.729.12
20.9321.8321.9821.537.84
CoCrFeNiTi0.6nominal21.7421.7421.7421.7413.04
A18.1322.1223.3921.639.25
B19.6319.0919.3723.4313.81
CoCrFeNiTi0.8nominal20.8320.8320.8320.8316.68
A18.9625.4926.7916.697.24
B18.5126.6319.3519.2713.11
CoCrFeNiTi1.0nominal2020202020
A19.0625.0623.6413.3713.59
B18.307.8310.6237.3619.89
Table 3. EBSD grain size of CoCrFeNi HEA Tix.
HEACoCrFeNiTi0.2CoCrFeNiTi0.4
grain size/μm6.56 ± 2.1012.60 ± 5.38
Table 4. CoCrFeNiTix HEAs’ tensile properties at room temperature.
HEAMeasuring MethodYield Strength
(MPa)
Strength of Extension
(MPa)
Extend Rate
(%)
CoCrFeNiTi0.2stretch308.9652.743.09
compress337.6->50
CoCrFeNiTi0.4stretch647.2897.54.2
compress513.8->50
CoCrFeNiTi0.6stretch486.2486.21.4
compress702.2->50
CoCrFeNiTi0.8stretch---
compress1045.42125.522.9
CoCrFeNiTi1.0stretch---
compress1696.61696.65.5
Table 5. Corrosion kinetics parameters of CoCrFeNiTix HEAs.
HEACoCrFeNiTi0.2CoCrFeNiTi0.4CoCrFeNiTi0.6CoCrFeNiTi0.8CoCrFeNiTi1.0
icorr/A/cm22.3246 × 10−72.1933 × 10−70.8348 × 10−71.1543 × 10−71.5367 × 10−6
Ecorr/V−0.3081−0.3010−0.2732−0.2957−0.3653
ipass/A/cm21.4825 × 10−51.3173 × 10−50.9027 × 10−51.0402 × 10−52.9367 × 10−4
Epit/V−0.9047−0.9203−0.9654−0.9995−1.1444
Table 6. Electrochemical impedance spectrum parameters of CoCrFeNiTix HEAs.
HEARs (Ω·cm2) CPE (Ω−1·cm2·Sn)nRct (Ω·cm2)
CoCrFeNiTi0.26.4093.6696 × 10−70.908584.3627 × 105
CoCrFeNiTi0.48.3672.9600 × 10−50.914046.1911 × 105
CoCrFeNiTi0.64.7102.5983 × 10−50.932637.3187 × 105
CoCrFeNiTi0.87.0825.0146 × 10−50.933255.4944 × 105
CoCrFeNiTi1.05.3283.2603 × 10−50.936455.4619 × 105
Disclaimer/Publisher’s Note: The statements, opinions and data contained in all publications are solely those of the individual author(s) and contributor(s) and not of MDPI and/or the editor(s). MDPI and/or the editor(s) disclaim responsibility for any injury to people or property resulting from any ideas, methods, instructions or products referred to in the content.