Abstract
To address the growing demand for sustainable construction and efficient recycling of waste concrete resources, this study investigates the interfacial performance and mechanical property prediction of recycled aggregate concrete (RAC) under varying recycled aggregate (RA) replacement ratios (r = 0%, 30%, 60%, 100%). A comprehensive experimental program was implemented, including uniaxial compression tests and microscopic characterization using scanning electron microscopy (SEM), to evaluate the macro- and microscale damage evolution and interfacial transition zone (ITZ) properties of RAC. Based on Weibull’s statistical strength theory, a constitutive model for RAC under compression was developed, and a two-dimensional random aggregate model was implemented in Abaqus to simulate the damage initiation and propagation processes at different replacement ratios. The results demonstrate that the compressive strength of RAC decreases as the RA replacement ratio increases, while the optimal interfacial and mechanical performance is achieved at a 30% replacement ratio. The study reveals that failure in RAC initiates at the ITZ between the recycled aggregates and cement matrix, subsequently propagating to complete structural failure. The proposed constitutive model accurately predicts the stress–strain behavior of RAC across different replacement ratios, showing excellent agreement with experimental data. These findings provide valuable insights into the interfacial performance and failure mechanisms of RAC, offering a theoretical foundation for optimizing the design and application of recycled aggregate concrete in sustainable engineering projects.
1. Introduction
Construction waste has become a critical issue within sustainable development strategies, attracting significant attention in recent years. Recycled aggregate concrete (RAC), as a novel material capable of recycling waste concrete, has garnered widespread interest from various sectors. Due to the high production costs of natural aggregates (NAs) and the increasing ecological impact associated with its extraction, society’s development has led to the generation of vast quantities of waste concrete from building demolitions and renovations. The use of recycled aggregates (RAs) not only reduces the consumption of natural resources but also alleviates the environmental pressures associated with waste concrete disposal. Thus, the partial or complete replacement of natural aggregates with RAs effectively lessens environmental burdens and drives the concrete industry toward transformation, upgrades, and green sustainable development, aligning with the goals of “carbon neutrality and carbon peaking” [,,].
The mechanical properties of recycled concrete are the most critical and direct indicators of its macroscopic performance. However, due to internal microcracks and adhered old cement mortar generated during the recycling process of the aggregate, the mechanical and durability properties of recycled concrete may be inferior to those of natural concrete []. A substantial body of research has explored methods to enhance the performance of recycled aggregates through physical or chemical means, such as controlling the water-to-cement ratio, applying nanomaterial modifications, and using carbonation treatments [,]. Nevertheless, detailed studies on recycled concrete’s damage characteristics and evolution patterns are still required.
To better understand the damage evolution patterns of recycled concrete, developing a reasonable constitutive model has become a key focus for further research []. Guo et al. [] conducted experimental studies on the basic mechanical properties of steel fiber recycled brick aggregate concrete, establishing a statistical damage constitutive model and exploring the physical significance and determination methods of distribution parameters. Ma [] found that the inclusion of recycled coarse brick aggregates reduced the mechanical properties of concrete, and the established constitutive model adequately represented the stress–strain relationship of recycled concrete under different conditions. Belén et al. [] proposed constitutive models for RAC with varying aggregate replacement rates through their research. Ji et al. [] developed a macroscopic damage model for recycled brick concrete under uniaxial compression, fitting the constitutive model to experimental results using Abaqus software, which showed a high degree of correlation between the predicted and observed stress–strain relationships. Li et al. [] studied the stress–strain behavior of concrete after freeze–thaw cycles and established a uniaxial compression damage constitutive model, which effectively described the stress–strain relationship of both ordinary concrete and self-compacting concrete under uniaxial compression after freeze–thaw cycles. Wan et al. [] investigated the fatigue damage constitutive relationship of SCC in various service environments, developing a corresponding fatigue damage constitutive model and discussing the effects of water and dynamic loads on SCC fatigue damage. Zhang et al. [] derived a damage constitutive model for polypropylene fiber recycled concrete under uniaxial compression through theoretical and experimental analysis, finding good agreement between the model and experimental results. Zheng et al. [] conducted research on the mechanical properties of basalt fiber recycled aggregate concrete, establishing damage models for concrete compression and split tension. Comparative analysis revealed a high degree of agreement between the numerical simulations and experimental results.
Existing studies have shown that the failure of recycled concrete primarily occurs in the interfacial transition zone (ITZ), which is the weak link in the mechanical properties of recycled concrete. Jalilifar et al. [] utilized SEM experiments to observe the microstructure of RAC, as well as relevant experiments to more accurately explore the changes in the concrete’s microstructure, and enhanced the weak areas of the concrete, namely the ITZ, by employing techniques such as Surface Treatment and Modification Approach (TSMA) for aggregate modification. Bao et al. [] investigated the impact of carbonated RAs on the properties of recycled aggregate concrete and found that carbonation treatment effectively increased the microhardness of the ITZ. Wang et al. [] studied the influence of different aggregate treatment methods on the properties of recycled aggregates and recycled aggregate concrete, discovering that carbonization had a greater impact on the ITZ. Mahmood et al. [] researched the use of different proportions of construction and demolition waste as partial substitutes for coarse aggregates, finding that when the replacement rate was 30%, the mechanical and durability properties of the concrete were essentially consistent. Gao et al. [] investigated the influence of adding cementitious materials on the ITZ characteristics of recycled concrete from a microscopic perspective, revealing that adding cementitious materials could enhance the compressive strength of recycled concrete and improve the pore structure of the ITZ. Zheng et al. [,] discovered that damage in fully recycled concrete primarily occurs at the ITZ and reviewed strategies to enhance the durability of recycled aggregate concrete. Furthermore, they provided an outlook on future research directions for recycled aggregate concrete. Zhang et al. [] summarized the research progress on the mechanical and durability properties of geopolymer recycled aggregate concrete, a novel green material. They explored its potential applications in the field of building materials and strategies for optimizing its performance, concluding with a prospective outlook for future RA research.
The innovation of this study lies in the systematic investigation of the mechanical properties and damage evolution process of recycled concrete through experiments designed with varying replacement rates of recycled coarse aggregates. Compared to previous studies, this research further reveals the relationship between changes in the replacement rate and the damage characteristics of the internal structure of concrete. In addition, the uniaxial compressive damage constitutive model proposed in this paper integrates a macroscopic statistical damage model validated through experimental data fitting, enabling a more comprehensive simulation of the damage evolution process of recycled concrete and providing a new theoretical framework. In summary, this study not only examines the impact of recycled aggregate replacement rates on recycled concrete but also deeply analyzes its damage mechanisms, offering new theoretical support for the engineering application of recycled concrete.
2. Materials and Methods
2.1. Introduction to the Test
2.1.1. Constituents and Properties
The raw materials of ordinary concrete were cement, sand, coarse aggregates, and water. In this experiment, waste concrete aggregates partially or completely replaced coarse aggregates to produce recycled concrete.
Cement: Swan brand P·O42.5 ordinary Portland cement was used, sourced locally from Harbin. It has a 28-day compressive strength ≥ 42.5 MPa, and a specific surface area of 300–350 m2/kg. The initial setting time was 45 min.
Sand: Natural river sand was selected, with a fineness modulus of 2.92.
Natural coarse aggregates: Natural gravel was selected, with particle sizes ranging from 5 mm to 10 mm and 10 mm to 20 mm.
Recycled coarse aggregates: Waste concrete was crushed and screened to obtain recycled coarse aggregates, with particle sizes ranging from 5 mm to 10 mm and 10 mm to 20 mm. (Figure 1) The recycled aggregates used in this study were sourced from plain concrete specimens subjected to compression tests in the Building Materials Laboratory at Northeast Forestry University (Harbin, China). The waste concrete used in the experiments had the same mix proportion, was not exposed to any special environmental conditions, and had a compressive strength ranging from 30 to 40 MPa.
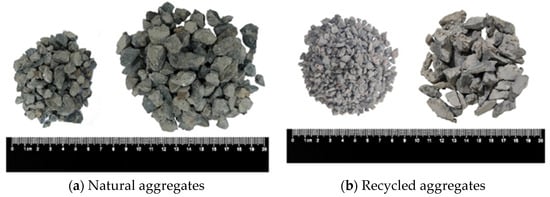
Figure 1.
Coarse aggregates (left 5 mm–10 mm, right 10 mm–20 mm).
Fly ash: Microbead fly ash was added to replace 5% of the cement; the excess cement can be saved and the solid waste can be reused.
Water: Harbin local tap water was used. According to the “Hygienic Standard for Drinking Water” and “Water Standard for Concrete” [], the water used in the test meets the concrete water standard.
Water reducer: A naphthalene-based water reducer, in the form of a yellow-brown powder, with a water reduction rate of 16% to 22% and a pH value ranging from 1 to 9, was used. (Figure 2). The addition of water reducer can change the workability of concrete.
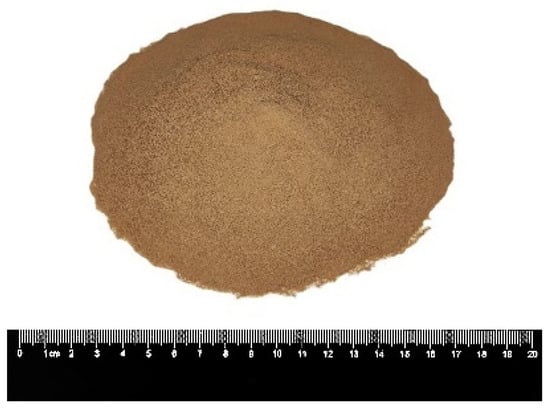
Figure 2.
Naphthalene water-reducing agent.
The fundamental performance indicators of natural and recycled aggregates can be obtained, with specific values presented in Table 1. The grading curves of the aggregates are shown in Figure 3. In this study, the aggregate categories were determined based on the crushing value, water absorption rate, and apparent density, all of which comply with the requirements for Class III aggregates [,].

Table 1.
Aggregate basic performance index.
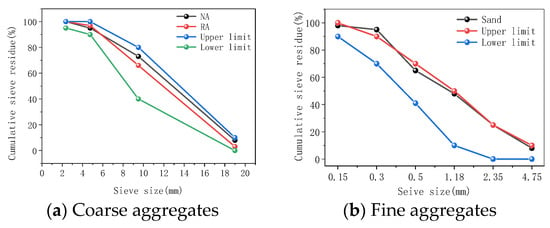
Figure 3.
Grading curves.
Four sets of concrete mix proportions were designed, with the replacement rates of recycled coarse aggregates categorized into four groups: 0%, 30%, 60%, and 100%. The detailed mix proportions for the experiments are provided in Table 2. In this study, Rx represents the replacement rate of recycled aggregates in RAC. R0 represents a 0% replacement rate of recycled aggregates, R30 represents a 30% replacement rate of recycled aggregates, R60 represents a 60% replacement rate of recycled aggregates, and R100 represents a 100% replacement rate of recycled aggregates.
Table 2.
Concrete mix design.
Due to the high water absorption of RAs, they tend to absorb residual moisture from the mix, reducing its workability. To mitigate this, the Ras were subjected to cleaning, sieving, pre-wetting, and drying treatments to prevent excessive water absorption during mixing and ensure the accuracy of the water-to-cement ratio. Additionally, a water-reducing agent was added to improve the workability of the RAC mix. The higher porosity of RAs results in a reduced density of RAC; to address this, fly ash was incorporated to enhance its density. Preliminary tests were conducted prior to the formal preparation of concrete specimens. Results showed that concrete with an added water-reducing agent demonstrated improved workability and an approximate 3 MPa increase in compressive strength. Furthermore, concrete with added fly ash achieved an average compressive strength approximately 6 MPa higher than concrete without fly ash. This improvement is attributed to the densification effect of fly ash, which contributes to overall concrete density. Fly ash engages in pozzolanic reactions, producing secondary hydration products such as C-S-H gel that fill the microvoids within the ITZ between the recycled aggregate and cement matrix. Additionally, the active silica and alumina in fly ash help mitigate the risk of alkali–silica reactions, thus enhancing recycled aggregate concrete’s chemical stability and durability.
The production process of RAC is similar to that of ordinary concrete. In this experiment, concrete specimens were made using 100 mm × 100 mm × 100 mm concrete molds. After curing, the concrete specimens underwent compression tests to analyze their mechanical properties. The results of the compression tests were converted into strength values according to the specifications outlined in “Code for Acceptance of Constructional Quality of Concrete Structures” (GB50204-2019) [,].
The slump test in this study was conducted in accordance with the “Standard for the Performance Test Methods of Ordinary Concrete Mixtures” (GB/T 50080-2016) []. A standard slump cone was used, with an upper diameter of 100 mm, a lower diameter of 200 mm, and a height of 300 mm. The concrete mixture was added in three layers, each compacted with 25 strokes of a tamping rod to ensure uniform density. After filling and leveling the top surface, the slump cone was lifted vertically over 5–10 s to avoid disturbing the concrete structure. A steel ruler was then used to measure the slump, defined as the vertical distance the concrete subsided, reflecting its workability and flowability. This metric is crucial for evaluating the concrete mixture’s applicability. Slump test data are presented in Figure 4.
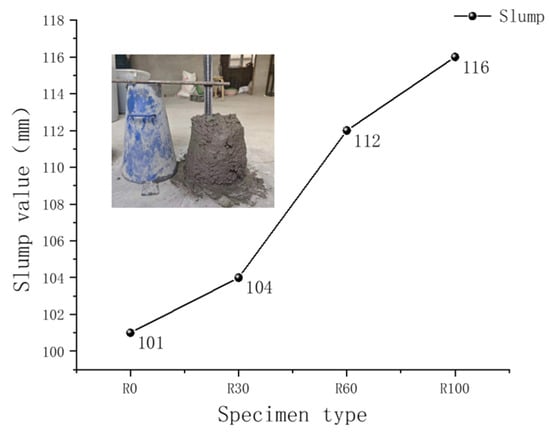
Figure 4.
Slump test results.
2.1.2. Test Methods
The compression test on concrete specimens was conducted according to the “Standard Test Method for Mechanical Properties of Ordinary Concrete” (GB/T 50081-2019) []. A universal testing machine with a capacity of 2000 KN was used for the test. The loading process was continuous and uniform, with a loading rate of 0.3 MPa/s. Figure 5 illustrates the compression test using the universal testing machine. On the left side of Figure 5 are the components of the universal testing machine, including the computer operating system, control panel, and pressure testing platform. On the right side of Figure 5, the states of the concrete cubic specimens before and after the compression test are shown. It should be noted that the center of the concrete cubic specimens and the center of the upper and lower pressure plates on the pressure testing platform are aligned along the same vertical line.
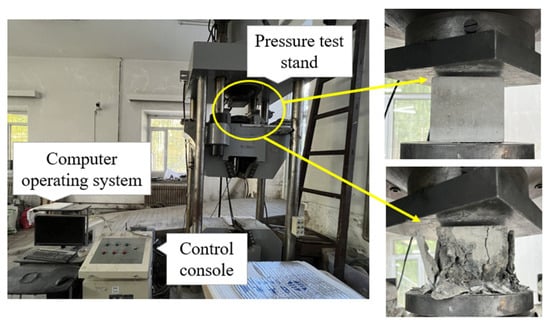
Figure 5.
Compression test.
2.2. Test Results
2.2.1. Destructive Form
The compression test was carried out by using the universal servo press shown in Figure 5. The cured concrete specimens were subjected to compression tests, and the damage morphology of the resulting RAC is shown in Figure 6. When the concrete specimens were subjected to uniaxial compression on the press machine, they experienced vertical shortening and lateral expansion. The upper and lower surfaces of the specimen were constrained by the platen, controlling the lateral displacement of the concrete. Therefore, the failure morphology of the concrete approximated two opposing cone shapes, resembling an “X” pattern of failure; see Figure 7.
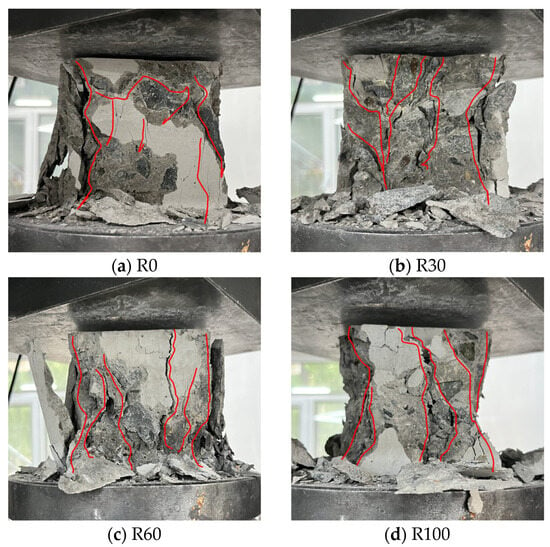
Figure 6.
Compression damage diagram of the specimens.
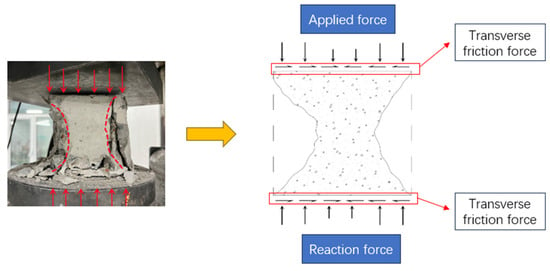
Figure 7.
Damage of concrete cube specimen.
It can be observed from Figure 6 that as the replacement rate of recycled concrete increases, the degree of concrete crushing becomes more complete, the integrity of the concrete specimens upon failure decreases, and the occurrence of through-cracks increases with the replacement rate. Initially, cracks appear on the surface of the concrete specimens as the pressure increases. With continued pressure, these cracks gradually penetrate through the specimens, and the surface mortar progressively flakes off until failure occurs. The high water absorption and porosity of RAs result in more significant shrinkage deformation in RAC during the early curing process compared to NAC, leading to greater internal shrinkage stress in RAC. This makes it more prone to cracking under external pressure. Additionally, the old mortar on the surfaces of RAs weakens the mortar–aggregate transition zone within the concrete matrix, making it more susceptible to failure. Observational analysis during the tests indicates that the sides of the concrete perpendicular to the platen are the first to fail under compression, resulting in an “X”-shaped failure pattern across the surface.
2.2.2. Mechanical Property Analysis
According to the test results, the higher the RA replacement rate, the greater the degree of specimen crushing and the lower the specimen integrity. As shown in Figure 8, the compressive strength of RAC decreases with an increase in the RA replacement rate. Specifically, R30 exhibits a strength reduction of 6.09 MPa compared to R0, with a strength loss rate of 15.78%; R60 shows a strength reduction of 8.19 MPa compared to R0, with a strength loss rate of 21.23%; and R100 displays a strength reduction of 10.26 MPa compared to R0, with a strength loss rate of 26.60%. Furthermore, the inherently reduced strength of the RAs, coupled with the elevated residual cement mortar content, lower density, heightened porosity, and roughened surface, notably influences the mechanical properties of RAC.
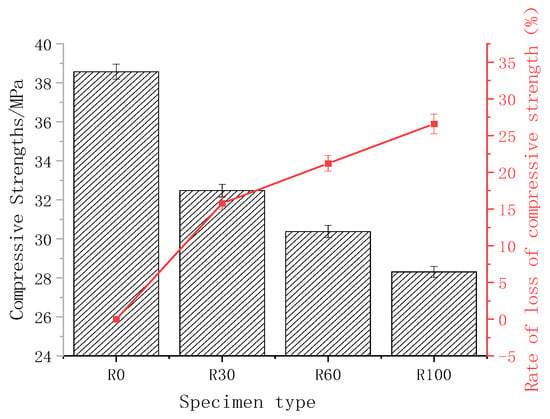
Figure 8.
Compressive strength and its loss rate.
As depicted in Figure 8, the compressive strength of concrete diminishes upon the incorporation of RAs. The inclusion of RAs introduces a more intricate internal structure in concrete, rendering it more susceptible to failure. As the replacement rate escalates, the rate of compressive strength loss starts to diminish, signifying that the performance of RAC attains a relatively stable state. At this juncture, the augmentation in RA proportion ceases to be the primary contributor to the decline in RAC strength. Notably, when the RA content is 30%, the compressive strength of RAC stands at 32.48 MPa, exemplifying commendable performance. This state effectively harnesses the RAs while maintaining the performance of the concrete. Deresa’s study [] mentions that, compared to composite beams based on NAC, the load-bearing capacity of composite beams with 30% replacement of RAC is reduced by less than 3%. However, as the RA content reaches 60%, the performance of RAC undergoes a rapid deterioration. Notably, at a 100% RA content, the strength loss surpasses 10 MPa, accompanied by a strength loss rate of 26.60%.
The one-way analysis of variance results indicate that recycled aggregate replacement rates have a significant effect on the compressive strength of concrete, with an F = 495.093 and a P = 2×10⁻⁹, as shown in Table 3. Four replacement levels—0%, 30%, 60%, and 100%—were examined in this study, and the analysis revealed significant differences in mean compressive strength across groups. As the replacement rate of recycled aggregates increased, the compressive strength of concrete showed a statistically significant decreasing trend, with higher replacement rates leading to greater reductions. These findings suggest that incorporating recycled aggregates markedly reduces concrete compressive strength.
Table 3.
One-way ANOVA results for compressive strength.
2.2.3. Analysis of Internal Structure of Concrete
The mesoscopic scale helps identify subtle details without the need for significant magnification, as it focuses on how aggregates influence the overall structure of concrete. At this scale, concrete is typically viewed as a three-phase composite material composed of the aggregates, matrix, and ITZ [].
Figure 9 represents an intuitive model illustrating the relationships among various materials within RAC. The microscopic model visually reflects the impact of factors such as aggregate shape, gradation, distribution, and the ITZ on the macroscopic mechanical properties of recycled concrete. The left side of Figure 9 simulates a cross-sectional view of concrete, showing the random distribution of aggregates within the concrete. In contrast, the right side introduces the distribution of the ITZ [,].
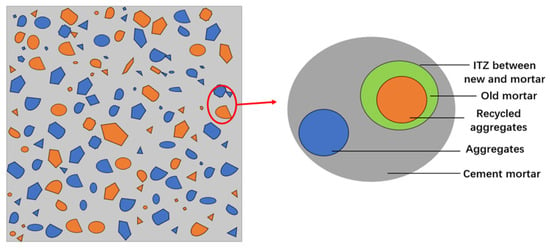
Figure 9.
Interface Transition area Model Diagram.
Figure 10 shows the microscopic results of RAC. Figure 10a shows the instruments used for microscope observation, with a microscope on the left and a computer on the right. Fractured samples of RAC were examined under a microscope to analyze surface morphology characteristics after the concrete compression test. Figure 10 illustrates the typical failure modes of RAC observed from a mesoscopic perspective. It shows that the ITZ is a weak region within the concrete, with cracks primarily forming for the following reasons: First, the old mortar adhered to the surfaces of the RAs, along with its high water absorption and rough, porous structure, increases friction with the new mortar, obstructing paste flow and reducing ITZ compactness. Second, residual old mortar makes the ITZ more prone to forming microcracks. Under external loading, these microcracks tend to propagate first, leading to ITZ failure and consequently lowering the concrete’s overall strength [,,]. The crack positions shown in Figure 10 show that there are two standard failure modes in RAC under compressive stress. The first mode is the failure at the ITZ, where cracks appear at the interface between the NAs and the cement matrix; see Figure 10c []. The second mode is at the interface between new and old mortar, where the RAs contain a significant amount of residual old mortar, and cracks first appear at the junction of the old and new mortar; see Figure 10d []. Under uniaxial compression, cracks initially form at the ITZ in RAC, and as the pressure increases, these cracks continue to propagate and extend, forming interconnected pores until failure occurs. Another major factor contributing to the weakness of the concrete transition zone is the presence of microcracks. The quantity of microcracks is influenced by various factors, including but not limited to the size and grading of the aggregate, the amount of cement, the water-to-cement ratio, the degree of concrete compaction, curing conditions, ambient humidity, and the temperature development of the concrete [,]. Additionally, during the acquisition process of RAs, many irreversible damages—microcracks or cracks—are generated on its surface or within it [].
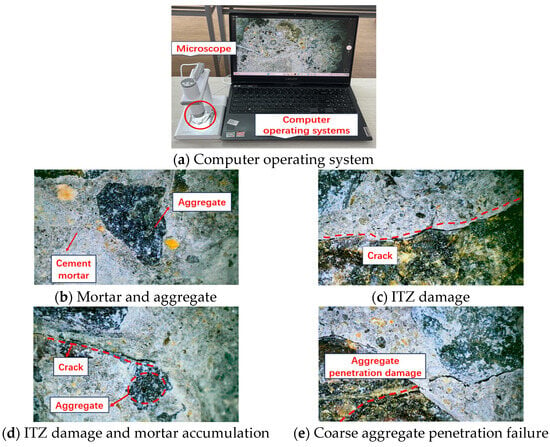
Figure 10.
Microscopic images of RAC.
The second type involves partial penetration of RAs during failure, as shown in Figure 10e. The crushing index of NAs is 6.7, with an apparent density of 2.66 g/cm3, while the crushing index of RAs is 15.3, with an apparent density of 2.41 g/cm3. The crushing index of RAs is 228.36% higher than that of NAs, and their apparent density is lower than that of NAs, indicating that the porosity of RAs is higher than that of NAs, and their maximum load-bearing capacity is lower than that of NAs. Therefore, the occurrence of partial penetration of RAs during failure is reasonable.
Through the analysis of Figure 10, we observe that the failure of RAC primarily occurs in the ITZ between the recycled aggregates and the cement paste. Although this characteristic has been widely discussed in existing research, the contribution of this study lies in further revealing the effect of different recycled aggregate replacement ratios (r = 0, 30%, 60%, and 100%) on crack evolution within the ITZ. Specifically, we found that at higher replacement ratios, the crack density within the ITZ significantly increases, with cracks more readily developing to form connected paths. This finding deepens the understanding of how replacement ratios influence the mechanical performance of RAC, providing valuable insights for optimizing RAC applications in practical engineering. Additionally, a minor form of failure is observed, characterized by the partial penetration of RAs [].
3. Damage Ontology Model
Concrete strength and stress–strain behavior under uniaxial loading conditions serve as the foundation and crucial parameters for composite stress states. Furthermore, Xu et al. [] established a prediction model for RAC using the Mohr–Coulomb failure criterion, enabling concrete failure prediction under uniaxial and triaxial compression. They developed a unified model capable of predicting the compressive properties of concrete containing NAs and RCAs, providing a valuable reference for NAC and RAC’s material and structural design. Therefore, it is essential to establish a damage constitutive model for concrete.
3.1. Applied Theory
A damage constitutive model for recycled concrete is established based on Lemaitre’s strain equivalence principle. According to Lemaitre’s strain equivalence principle, the nominal stress acting on a material with initial damage is equivalent to the effective stress acting on an undamaged material. Utilizing this principle, the transition from an undamaged state to a damaged state under elastic conditions can be realized.
Lemaitre’s strain equivalence hypothesis can be expressed under one-dimensional stress conditions by Equation (1).
is the nominal stress, and is the initial modulus of elasticity.
A cumulative damage variable D is introduced to represent the damage in RAC. The damage development process in RAC is divided into two stages: the initial damage Dr caused by the addition of RAs and the damage Dc induced by external loads.
Stage 1—initial damage variables:
Stage 2—impairment variables:
This leads to the damage eigenstructure equation:
: effective stress.
According to the theory of damage mechanics, changes in the macroscopic mechanical properties of concrete materials directly reflect the degree of internal damage and deterioration.
The Weibull strength statistical theory, based on the weakest link model, posits that the strength of a material is determined by the failure strength of its weakest link. The probability distribution of concrete uniaxial compressive strength conforms to the Weibull strength theory [], and its distribution function can be expressed as follows:
a: Shape parameter.
m: Scale parameter.
Damage variable:
The constitutive model of concrete, described using a microscale statistical damage model, can be represented as follows:
The uniaxial compressive constitutive σ-ε curve of concrete exhibits a unique peak stress and the corresponding peak strain . Before this peak point, the curve is incrementally increasing, while after the peak point, the curve monotonically decreases.
The peak stress point corresponds to the unique non-zero solution of . The coordinates of this point correspond to the peak stress and peak strain . Consequently, we can determine that , and substituting the coordinates of the peak stress point yields the following:
Coupling results can be determined as follows:
Combining the stress–strain curve obtained from compression tests on concrete specimens, we can determine the elastic modulus , peak stress , and peak strain of the concrete specimen. Substituting these values into the equation, we can calculate the shape parameter a and scale parameter m. Specific numerical values are presented in Table 4.
Table 4.
Parameters of the intrinsic model.
3.2. Parameter Fitting
Based on the experimental data, the study investigates the relationship between the parameters a, m, and Er with the variable replacement rate r of recycled coarse aggregates. The constitutive relationship is equivalent to establishing the relationship between σ and r, as shown in Figure 11. The shape parameter a increases with the increase in r, while the scale parameter m decreases with the increase in r. Similarly, Er decreases with the increase in r, demonstrating certain regularity.
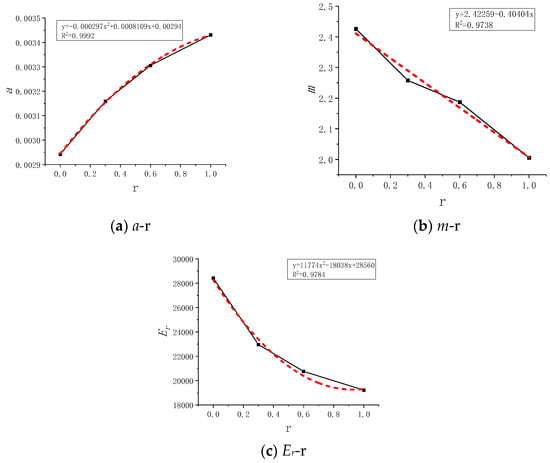
Figure 11.
Parameter fitting curves.
The final Equation (10), used to determine the damaged material’s eigenstructure, is obtained by incorporating the relational equations for a-r, m-r, and Er-r. The damage constitutive equation established in this manner allows for the determination of the peak stress and peak strain under uniaxial compression damage for different r recycled concrete. Fitting the experimental data yields the following relationship:
Substituting the experimental results from Figure 8 into the damage constitutive Equation (10), the fitted stress–strain curve is obtained. A comparison between the fitted curve and the experimental curve is presented in Figure 12 below.
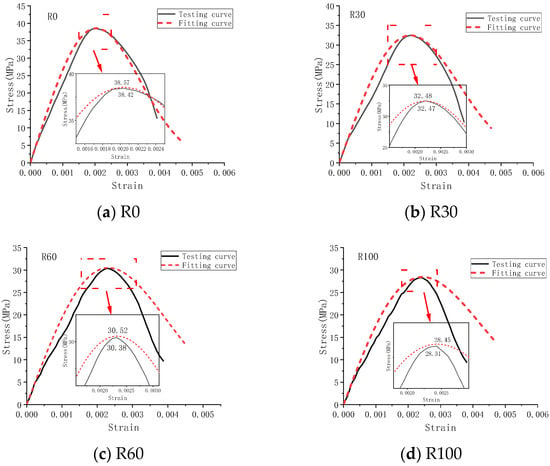
Figure 12.
Stress–strain curves.
As depicted in Figure 12, both the experimental curve and the constitutive characteristic curve exhibit certain deviations. These deviations become more pronounced after reaching the peak stress point, and they vary in magnitude with the increase in r. Considering the actual scenario, there are variations in the thickness of old and new mortar on the surfaces of RAs. This results in inadequate contact between the mortar and RAs during the mixing and forming processes of concrete, leading to a certain degree of deviation from the theoretical failure data. Various influencing factors during the experimental process also contribute to differing degrees of impact on the experimental results. It is noteworthy that in their article, Xie [] specifically analyzes the initial damage caused by the addition of RAs in concrete. Furthermore, based on the consideration of the physical properties of RAs, they propose a predictive model for compressive strength that incorporates supplementary cementitious materials. This contribution significantly advances the application of RAs.
By substituting concrete strain into the formula for the damage variable D, the variation in concrete strain and damage variable D is depicted in Figure 13. When the strain is 0, the initial damage variable for R0 is 0, R30 is 0.192, R60 is 0.270, and R100 is 0.324. From Figure 13, it is evident that the addition of RCAs introduces varying degrees of initial damage to RAC, with the initial damage increasing with the increase in r. As the strain begins to increase, RAC specimens with different RCA contents start to increase at different rates of damage growth. When the strain reaches around 0.00325, all concrete specimens reach the same damage value of 0.718. With further strain increase, RAC specimens with different RA contents continue to increase at different rates of damage growth until complete specimen failure, where the damage variables of all RAC samples tend towards 1. Figure 13 intuitively demonstrates the process of concrete damage and failure through the development of cracks in a specimen.
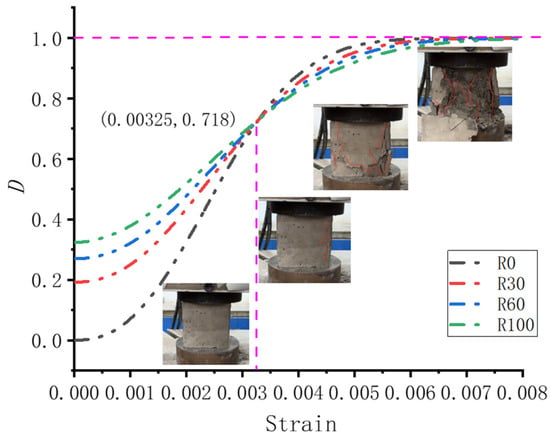
Figure 13.
Curve of damage variable.
4. Stochastic Aggregate Distribution Model
This study employed numerical analysis methods to examine the constitutive relationship of recycled concrete []. Scholars have validated the computational micro-models of concrete and confirmed their feasibility []. Additionally, the three-phase model proposed by Krishnya has been shown to accurately predict mechanical properties [].
Using the Abaqus finite element software (Abaqus 2020), a two-dimensional plane model of recycled concrete was established to simulate the stress performance of concrete cube specimens under compression tests. Najafi [] employed the finite element method to simulate crack initiation and propagation in concrete specimens at the mesoscale level. The developed random aggregate distribution model visually represents the distribution of RAs within the concrete [], depicting the randomness of aggregate shape, spatial distribution, and performance parameters, closely approximating the actual internal distribution of concrete. The two-dimensional stochastic model established in this study builds upon a solid foundation of previous research [,,,].
The model is set up so that the recycled coarse aggregates are randomly distributed within the concrete, without any specific distribution pattern, better simulating the real-world packing distribution of aggregates within concrete, as shown in Figure 14.
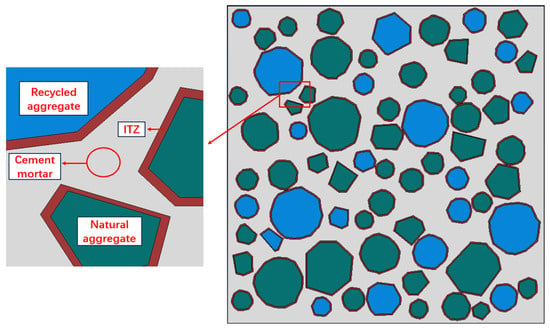
Figure 14.
Interface transition area.
4.1. Parameter Setting
The model employs a two-dimensional plane for finite element simulation to better illustrate the distribution of aggregates within the concrete. The cross-sectional dimensions are set to 150 mm × 150 mm for the compression test simulation, with the simulated results converted using a scaling factor []. The mesh is divided using current triangular plane strain elements, ensuring consistent precision across all mesh elements []. The approximate global size is set to 1.5 mm and 26,370 grid cells are generated globally. According to the literature, ITZ size in concrete is between 10 μm and 50 μm []. In numerical calculation, if the size of the ITZ is set too small, the mesh partition size is also too small to bear and transfer loads. In fact, when the Abaqus model was established, the thickness of the ITZ was set at 0.5 mm.
Using Abaqus finite element software, four two-dimensional models with different r values were established to simulate the random distribution of aggregates for various r values. The simulation results were compared with the experimental results to verify the reliability of the model []. The material parameters are shown in Table 5 below; each parameter is derived from the following studies [,,].
Table 5.
Material properties.
This study employed a random aggregate model for fine-scale modeling of RAC and used Abaqus software for numerical simulation, resulting in a random aggregate distribution model of concrete cubes. The constitutive relationship of the concrete follows Equation (3).
4.2. Building the Model
Figure 15 shows the random aggregate model of concrete, where green represents natural aggregates, blue represents recycled aggregates, and red represents the ITZ.
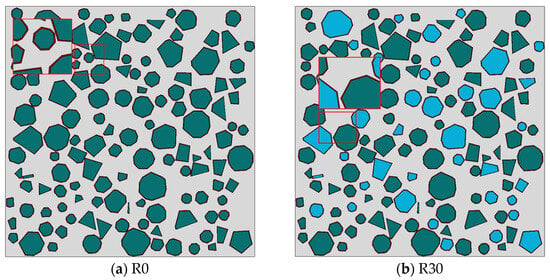
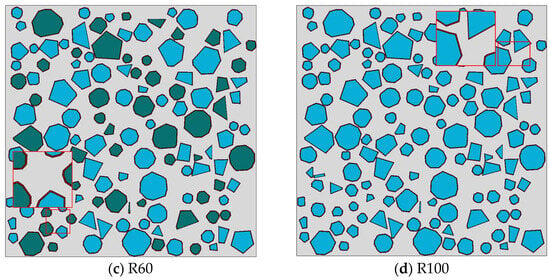
Figure 15.
Stochastic aggregate model.
Figure 15 illustrates that as r increases, the proportion of recycled coarse aggregates occupying the entire space also increases until they completely dominate the space. Figure 15 shows that the distribution of aggregates is random, with their size and shape defined by the model settings. The aggregate size is set to a continuous gradation of 5 mm–20 mm, and the aggregate shapes are automatically generated by the model. To enhance computational efficiency, the number of edges is set between three and nine. This model can be viewed as a cross-section of a concrete specimen or as an orthogonal projection in a specific coordinate direction.
The randomness of aggregate distribution also results in variable area proportions of aggregates across the entire interface. After setting the aggregate size and the number of edges, the model allocates aggregates to occupy 0.45 of the entire interface, which is consistent with the 0.45–0.5 range of coarse and fine aggregates in the experimental mix proportion.
4.3. Computational Results and Analyses
As shown in Figure 16, the boundary conditions of the specimen were set, the bottom was set to be completely fixed, the top was coupled with the central point RP-1, and the load was applied at the point RP-1. The model was submitted for final computation, yielding the following results.
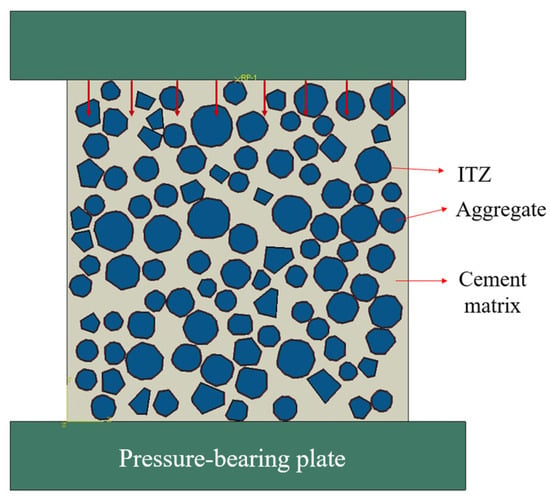
Figure 16.
Uniaxial compression model diagram.
Under the same load conditions, the number of cracks within the concrete increases correspondingly with the increase in r. This indicates that exceeding a certain replacement rate of RAs significantly affects the mechanical performance of concrete. The shape of the cracks and the failure trend in the tensile damage distribution diagram suggest that the “X” diagonal cone-shaped failure pattern is more likely to occur in concrete with a higher r value.
The random aggregate model of RAC has been established. Figure 17 illustrates the damage effect cloud map of RAC under a uniform time frame. Different colors and sizes of geometric shapes, each with varying edge conditions, represent distinct stress levels or degrees of damage. The red areas denote regions of high damage, while the blue-green regions indicate comparatively lower stress or damage. Notably, the coarse aggregate sections exhibit minimal stress levels owing to their inherent robustness and three-dimensional skeletal structure, enabling them to withstand external loads to a significant extent. Consequently, aggregates generally maintain their structural integrity throughout the concrete failure process. Concrete, comprising cement, sand, coarse aggregates, and other constituents, forms a composite material. The cementitious mortar matrix, composed of cement and sand, serves as the primary binding material in concrete, encapsulating coarse aggregates and filling voids. The strength of this cementitious mortar matrix directly impacts the mechanical performance of concrete. Conversely, the ITZ, characterized by notable structural and property discrepancies from the overall concrete, exhibits weaker mechanical properties due to factors such as high porosity, crystalline orientation, and size characteristics [].
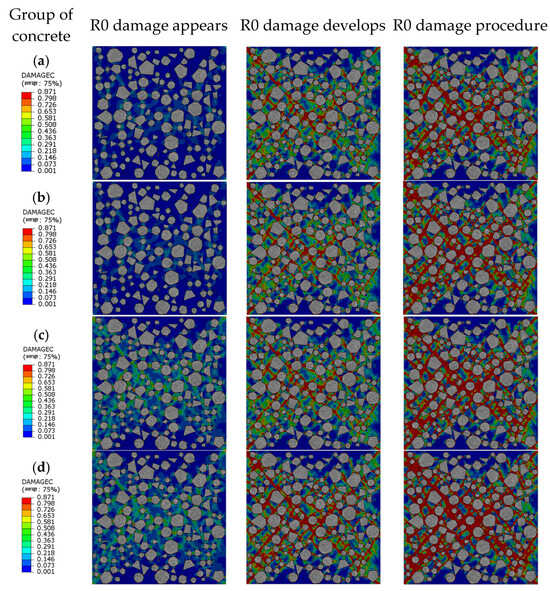
Figure 17.
Pressure damage cloud: (a) R0; (b) R30; (c) R60; (d) R100.
Figure 17 captures the stress damage cloud map of the test specimen, extracted at the point of occurrence, development, and failure of damage for R0. Using the onset of damage in R0 as a reference point, it is notable that at this stage, R30, R60, and R100 exhibit varying degrees of damage. Clearly, as the replacement rate of RAs increases, the damage becomes more pronounced. The observation from Figure 17 indicates that under the same time frame, the damage in RAC increases with the increase in RAs. Upon failure of R0, initial damage occurs primarily at the ITZ, which intensifies with increasing pressure until cracks form at various ITZs of coarse aggregates, leading to continuous failure. The initial appearance of damage is notable at the four corners, followed by damage communication with the ITZ, resulting in a penetrating failure, resembling an approximate “X” shape, consistent with phenomena observed during concrete compression tests. Upon failure of R0, the damage in R30, R60, and R100 exceeds that of R0. Furthermore, analysis reveals that the damage in R100 extends beyond the ITZ to include the internal cementitious mortar matrix of concrete.
At the same time interval, the deformation due to damage becomes increasingly pronounced with the increase in r. It is evident from Figure 18 damage initially occurs at the ITZ, and with increasing pressure, cracks continue to propagate until complete failure. Upon reaching failure, internal damage within the concrete gradually emerges, culminating in a continuous penetrating failure mode, consistent with experimental observations.
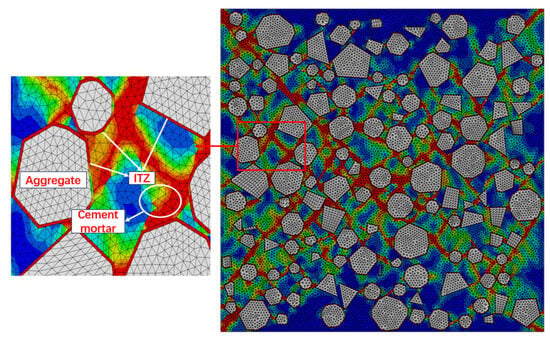
Figure 18.
Interfacial transition zone under damage condition.
After conducting numerical simulations using Abaqus finite element software, the stress–strain curve for concrete cubic specimens under uniaxial compression can be obtained, as depicted in Figure 19.
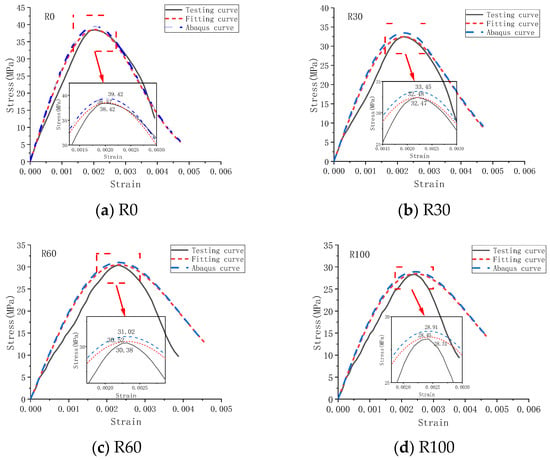
Figure 19.
Stress–strain curve.
Figure 19 reveals a certain degree of discrepancy between the constitutive model established in this study and the simulation results obtained from Abaqus. Compared to experimental data, the curve obtained from the constitutive model generally exhibits slightly higher stress–strain values. However, the deviation between the curve obtained from Abaqus simulation and the one from the constitutive model is relatively small. Additionally, the compressive strength gradually decreases with the addition of recycled aggregates.
Abaqus finite element simulations reduce deformation by decreasing object degrees of freedom, with deformation levels determined by given numerical values and functional relationships. While this method can yield standard answers, it restricts displacement modes, leading to increased object stiffness and reduced displacement fields. Therefore, a certain level of deviation between the data obtained from Abaqus calculations and actual experimental data is reasonable [].
Figure 20 represents a comparative summary of the experimental stress, constitutive stress, and Abaqus-simulated stress for different concrete mix proportions. Based on the calculations from Figure 20, the maximum difference between the experimental stress of RAC and the stress fitted by Abaqus is 1.03 MPa, with differences ranging from 2.11% to 2.98%. These errors fall within an acceptable range, indicating a high level of fit by Abaqus.
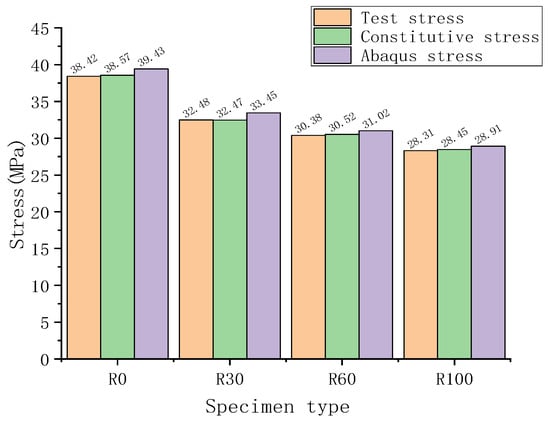
Figure 20.
Stress summary diagram.
5. Conclusions
This study investigates the mechanical properties of RAC through a combination of experimental testing, numerical analysis, and finite element simulation. It analyzes the damage deterioration mechanisms from macroscopic and microscopic perspectives and establishes a damage constitutive equation for RAC while creating a random aggregate model in Abaqus software. The main conclusions are as follows:
(1) Macroscopic Mechanical Properties: The parametric study reveals that different replacement rates of recycled aggregates significantly affect the compressive strength of RAC. When r = 60%, the compressive strength loss rate of R60 compared to R0 is 21.23%. The concrete exhibits optimal performance at a replacement rate of 30%, effectively utilizing recycled aggregates while ensuring concrete performance. This study shows that r within a certain range can effectively balance compressive strength and resource reuse.
(2) Microscopic Damage Mechanism: From a mesoscale perspective, cracks in the concrete were primarily observed to initiate at the ITZ. As the replacement ratio r increased, aggregate-bridging fractures began to appear, revealing the evolution of RAC’s internal damage mechanisms at different replacement levels. Unlike previous studies, this research further confirms the transition in RAC’s failure mode from ITZ cracking to aggregate-bridging fractures, providing a deeper understanding of the internal damage mechanisms in recycled aggregate concrete.
(3) Model Construction and Validation: The damage constitutive model for RAC is based on experimental data. Compared with constitutive equations from previous studies, this model features a simpler structure and fewer parameters, accurately capturing the stress–strain relationship of RAC across different replacement rates. The random aggregate model constructed in Abaqus, a key tool in this study, shows a deviation of 2% to 8% from experimental data, validating the model’s accuracy and applicability for future research and practical applications.
(4) Research Issues and Future Perspectives: In this study, a single concrete mix ratio was used to analyze RAC with different replacement rates, and the influence of different water-to-cement ratios or environmental factors was not fully considered. In the future, the model will be further expanded to enhance the universality of the model to support the superior performance of RAC in a wider range of engineering applications.
Author Contributions
Conceptualization, Y.J. and X.H.; data curation, S.Z. and Y.J.; funding acquisition, Y.J. and X.H.; methodology, Y.J. and X.H.; software, S.Z. and Y.J.; validation, S.Z.; visualization, S.Z.; writing—original draft, S.Z.; writing—review and editing, Y.J. and X.H. All authors have read and agreed to the published version of the manuscript.
Funding
The research was supported by the research on key technologies for intelligent monitoring and quality improvement of high-pier and long-span bridges in the Yellow River Basin (Ningxia section) (2024FRD05109).
Data Availability Statement
The authors confirm that the data supporting the findings of this study are available within the article.
Acknowledgments
Thanks to all the members of the research team for their help in the successful completion of this study.
Conflicts of Interest
The authors declare that they have no known competing financial interests or personal relationships that could have appeared to influence the work reported in this paper.
References
- Akça, K.R.; Çakır, Ö.; İpek, M. Properties of polypropylene fiber reinforced concrete using recycled aggregates. Constr. Build. Mater. 2015, 98, 620–630. [Google Scholar] [CrossRef]
- Blazy, J.; Blazy, R. Polypropylene fiber reinforced concrete and its application in creating architectural forms of public spaces. Case Stud. Constr. Mater. 2021, 14, e00549. [Google Scholar] [CrossRef]
- Yoo, D.-Y.; Banthia, N. Impact resistance of fiber-reinforced concrete—A review. Cem. Concr. Compos. 2019, 104, 103389. [Google Scholar] [CrossRef]
- Bai, G.; Zhu, C.; Liu, C.; Liu, B. An evaluation of the recycled aggregate characteristics and the recycled aggregate concrete mechanical properties. Constr. Build. Mater. 2020, 240, 117978. [Google Scholar] [CrossRef]
- Zheng, Y.; Zhang, Y.; Zhuo, J.; Zhang, P.; Kong, W. Mechanical properties and microstructure of nano-strengthened recycled aggregate concrete. Nanotechnol. Reviews. 2022, 11, 1499–1510. [Google Scholar] [CrossRef]
- Shi, D.; Shi, Q. Study on Mechanical Properties and Mesoscopic Numerical Simulation of Recycled Concrete. Sustainability 2022, 14, 12125. [Google Scholar] [CrossRef]
- Moradi, M.; Bagherieh, A.R.; Esfahani, M.R. Constitutive modeling of steel fiber-reinforced concrete. Int. J. Damage Mech. 2020, 29, 388–412. [Google Scholar] [CrossRef]
- Guo, S.; Zheng, D.; Zhao, L.; Lu, Q.; Liu, X. Mechanical test and constitutive model of recycled plastic fiber reinforced recycled concrete. Constr. Build. Mater. 2022, 348, 128578. [Google Scholar] [CrossRef]
- Ma, K.; Huang, X.Y.; Hu, M. Damage constitutive relationship of brick-concrete regenerated coarse aggregate. J. Build. Mater. 2022, 25, 131–141. [Google Scholar]
- Belén, G.-F.; Fernando, M.-A.; Diego, C.L.; Sindy, S.-P. Stress–strain relationship in axial compression for concrete using recycled saturated coarse aggregate. Constr. Build. Mater. 2011, 25, 2335–2342. [Google Scholar] [CrossRef]
- Ji, Y.; Wang, D.; Wang, L. Numerical and Experimental Investigation of Recycled Brick Coarse Aggregate Concrete. Appl. Sci. 2022, 12, 9035. [Google Scholar] [CrossRef]
- Li, Y.; Guo, H.; Zhou, H.; Li, Y.; Chen, J. Damage characteristics and constitutive model of concrete under uniaxial compression after Freeze-Thaw damage. Constr. Build. Mater. 2022, 345, 128171. [Google Scholar]
- Wan, Z.; Ma, K.L.; Long, G. Fatigue damage constitutive model of SCC based on Weibull distribution and residual strain. Mater. Rev. 2019, 33, 634–638. [Google Scholar]
- Zhang, T.; Huang, W.; Rong, C. Research of polypropylene fiber recycled concrete damage constitutive model. Mater. Rev. 2015, 29, 150–155. [Google Scholar]
- Zheng, Y.; Zhuo, J.; Zhang, P.; Ma, M. Mechanical properties and meso-microscopic mechanism of basalt fiber-reinforced recycled aggregate concrete. J. Clean. Prod. 2022, 370, 133555. [Google Scholar] [CrossRef]
- Jalilifar, H.; Sajedi, F. Micro-structural analysis of recycled concretes made with recycled coarse concrete aggregates. Constr. Build. Mater. 2021, 267, 121041. [Google Scholar]
- Lu, B.; Shi, C.; Cao, Z.; Guo, M.; Zheng, J. Effect of carbonated coarse recycled concrete aggregate on the properties and microstructure of recycled concrete. J. Clean. Prod. 2019, 233, 421–428. [Google Scholar]
- Wang, J.; Zhang, J.; Cao, D.; Dang, H.; Ding, B. Comparison of recycled aggregate treatment methods on the performance for recycled concrete. Constr. Build. Mater. 2020, 234, 117366. [Google Scholar]
- Mahmood, W.; Khan, A.-U.-R.; Ayub, T. Mechanical and Durability Properties of Concrete Containing Recycled Concrete Aggregates. Iran. J. Sci. Technol. Trans. Civ. Eng. 2022, 46, 2111–2130. [Google Scholar] [CrossRef]
- Gao, S.; Guo, X.; Ban, S.; Ma, Y.; Yu, Q.; Sui, S. Influence of supplementary cementitious materials on ITZ characteristics of recycled concrete. Constr. Build. Mater. 2023, 363, 129736. [Google Scholar]
- Zheng, Y.; Xi, X.; Zhang, Y.; Zhang, P.; Du, C. Review of mechanical properties and strengthening mechanism of fully recycled aggregate concrete under high temperature. Constr. Build. Mater. 2023, 394, 132221. [Google Scholar]
- Zheng, Y.; Zhang, Y.; Zhang, P. Methods for improving the durability of recycled aggregate concrete: A review. J. Mater. Res. Technol. 2021, 15, 6367–6386. [Google Scholar]
- Zhang, P.; Sun, X.; Wang, F.; Wang, J. Mechanical Properties and Durability of Geopolymer Recycled Aggregate Concrete: A Review. Polymers 2023, 15, 615. [Google Scholar] [CrossRef]
- JGJ63-2006; Standard for Concrete Water Use. Ministry of Construction of the People’s Republic of China: Beijing, China, 2006.
- GB/T 25177-2010; Recycled Coarse Aggregate for Concrete. China Building Industry Press: Beijing, China, 2010.
- GB/T 14685-2011; Pebble and Crushed Stone for Construction. China Standards Press: Beijing, China, 2022.
- GB 50204-2002; Concrete Structure Engineering Construction Quality Acceptance Code. China Building and Construction Press: Beijing, China, 2022.
- Ji, Y.; Wang, D.; Jia, Y. Numerical simulation and size effect of PVA fiber reinforced brick aggregate recycled concrete. Mater. Rev. 2024, 39, 23100214-11. [Google Scholar]
- GB/T 50080-2016; Standard Building Code for Performance Test Methods of Ordinary Concrete Mixes. General Administration of Quality Supervision: Beijing, China, 2017.
- GB/T50081-2002; Standard Test Methods for Mechanical Properties of Ordinary Concrete. China Building and Construction Press: Beijing, China, 2019.
- Deresa, S.T.; Xu, J.; Shan, B.; Ren, H.; Xiao, Y. Experimental investigation on flexural behavior of full-scale glued laminated bamboo (glubam)-concrete composite beams: A case study of using recycled concrete aggregates. Eng. Struct. 2021, 233, 111896. [Google Scholar]
- Ollivier, J.P.; Maso, J.C.; Bourdette, B. Interfacial transition zone in concrete. Adv. Cem. Based Mater. 1995, 2, 30–38. [Google Scholar]
- Djerbi, A. Effect of recycled coarse aggregate on the new interfacial transition zone concrete. Constr. Build. Mater. 2018, 190, 1023–1033. [Google Scholar]
- Krishnya, S.; Elakneswaran, Y.; Yoda, Y. Proposing a three-phase model for predicting the mechanical properties of mortar and concrete. Mater. Today Commun. 2021, 29, 102858. [Google Scholar]
- Chen, Q.; Zhang, J.; Wang, Z.; Zhao, T.; Wang, Z. A review of the interfacial transition zones in concrete: Identification, physical characteristics, and mechanical properties. Eng. Fract. Mech. 2024, 300, 109979. [Google Scholar] [CrossRef]
- Hu, J.; Stroeven, P. Properties of the Interfacial Transition Zone in Model Concrete. Interface Sci. 2004, 12, 389–397. [Google Scholar] [CrossRef]
- Soltanabadi, R.; Behfarnia, K. Evaluation of Mechanical Properties of Concrete Containing Recycled Concrete Aggregate and Recycled Asphalt Pavement. J. Mater. Civ. Eng. 2022, 34, 04022348. [Google Scholar] [CrossRef]
- Liao, K.-Y.; Chang, P.; Peng, Y.; Yang, C. A study on characteristics of interfacial transition zone in concrete. Cem. Concr. Res. 2004, 34, 977–989. [Google Scholar] [CrossRef]
- Gao, S.; Guo, J.; Zhu, Y.; Jin, Z. Study on the influence of the properties of interfacial transition zones on the performance of recycled aggregate concrete. Constr. Build. Mater. 2023, 408, 133592. [Google Scholar] [CrossRef]
- Qiu, J.; Li, L.; Li, L.; Luan, X.; Guan, X.; Niu, G. Study on the deterioration characteristics and mechanisms of recycled brick-concrete aggregate concrete under load-freeze-thaw coupling. Constr. Build. Mater. 2024, 413, 134817. [Google Scholar] [CrossRef]
- Yang, L.; Li, K.; Hu, X.; Peng, Z.; Liu, Q.; Shi, C. Mesoscopic discrete modeling of compression and fracture behavior of concrete: Effects of aggregate size distribution and interface transition zone. Cem. Concr. Compos. 2024, 147, 105411. [Google Scholar] [CrossRef]
- Vu, C.-C.; Ho, N.-K.; Pham, T.-A. Weibull statistical analysis and experimental investigation of size effects on the compressive strength of concrete-building materials. Case Stud. Constr. Mater. 2022, 17, e01231. [Google Scholar] [CrossRef]
- Liu, Q.; Xiao, J.; Sun, Z. Experimental study on the failure mechanism of recycled concrete. Cem. Concr. Res. 2011, 41, 1050–1057. [Google Scholar]
- Xu, J.; Chen, W.; Yu, Y.; Xu, J.; Zhao, X. Data-driven analysis on compressive behavior of unconfined and confined recycled aggregate concretes. Constr. Build. Mater. 2022, 356, 129282. [Google Scholar] [CrossRef]
- Dong, X.; Yu, T.; Zhang, Q.; Bui, T. Multiscale freezing-thaw in concrete: A numerical study. Compos. Struct. 2023, 309, 116758. [Google Scholar] [CrossRef]
- Xie, T.; Yang, G.; Zhao, X.; Xu, J.; Fang, C. A unified model for predicting the compressive strength of recycled aggregate concrete containing supplementary cementitious materials. J. Clean. Prod. 2020, 251, 119752. [Google Scholar] [CrossRef]
- Chen, J.; Wang, Y. Finite element analysis of steel-concrete-steel sandwich beams with novel interlocked angle connectors subjected to impact loading. J. Constr. Steel Res. 2023, 207, 107977. [Google Scholar] [CrossRef]
- Peng, R.-X.; Qiu, W.-L.; Jiang, M. Application of a micro-model for concrete to the simulation of crack propagation. Theor. Appl. Fract. Mech. 2021, 116, 103081. [Google Scholar]
- Najafi Koopas, R.; Rauter, N.; Lammering, R. Two-Dimensional Mesoscale Finite Element Modeling of Concrete Damage and Failure. Appl. Sci. 2023, 13, 8971. [Google Scholar] [CrossRef]
- Hu Dalin, Z.L.; Chen, D. The establishment of three-dimensional concrete mesoscopic stochastic model and finite element subdivision. J. Transp. Eng. 2018, 18, 1–11. [Google Scholar]
- Wang, J.; Jivkov, A.; Li, Q.; Engelberg, D. Experimental and numerical investigation of mortar and ITZ parameters in meso-scale models of concrete. Theor. Appl. Fract. Mech. 2020, 109, 102722. [Google Scholar]
- Xu, J.; Zhang, X. Research on modeling method of porous air bearing materials based on random particles. Mater. Today Commun. 2022, 31, 103831. [Google Scholar]
- Grondin, F.; Matallah, M. How to consider the Interfacial Transition Zones in the finite element modelling of concrete? Cem. Concr. Res. 2014, 58, 67–75. [Google Scholar] [CrossRef]
- Shuguang, L.; Qingbin, L. Method of meshing ITZ structure in 3D meso-level finite element analysis for concrete. Finite Elem. Anal. Des. 2015, 93, 96–106. [Google Scholar] [CrossRef]
- Maleki, M.; Rasoolan, I.; Khajehdezfuly, A.; Jivkov, A. On the effect of ITZ thickness in mesoscale models of concrete. Constr. Build. Mater. 2020, 258, 119639. [Google Scholar] [CrossRef]
- Ji, Y.; Wang, D. Constitutive model of waste brick concrete based on Weibull strength theory. Case Stud. Constr. Mater. 2023, 18, e01738. [Google Scholar]
- Jayasuriya, A.; Adams, M.P.; Bandelt, M.J. Generation and Numerical Analysis of Random Aggregate Structures in Recycled Concrete Aggregate Systems. J. Mater. Civ. Eng. 2020, 32, 04020044. [Google Scholar] [CrossRef]
- Ji, Y.; Pei, Z.; Xu, W.; Li, Z.; Li, Y.; Jia, Y. Deterioration performance analysis of recycled brick concrete subjected to freezing and thawing effect. Case Stud. Constr. Mater. 2024, 20, e02722. [Google Scholar] [CrossRef]
Disclaimer/Publisher’s Note: The statements, opinions and data contained in all publications are solely those of the individual author(s) and contributor(s) and not of MDPI and/or the editor(s). MDPI and/or the editor(s) disclaim responsibility for any injury to people or property resulting from any ideas, methods, instructions or products referred to in the content. |
© 2025 by the authors. Licensee MDPI, Basel, Switzerland. This article is an open access article distributed under the terms and conditions of the Creative Commons Attribution (CC BY) license (https://creativecommons.org/licenses/by/4.0/).