Article

Strengthening Mechanism of High-Temperature Compression Properties of High Nb–TiAl Alloy by Laser-Directed Energy Deposition

State Key Laboratory of High-Performance Precision Manufacturing, Dalian University of Technology, Dalian 116024, China
*
Author to whom correspondence should be addressed.
Coatings 2025, 15(4), 495; https://doi.org/10.3390/coatings15040495
Submission received: 21 March 2025 / Revised: 10 April 2025 / Accepted: 17 April 2025 / Published: 21 April 2025

Abstract

:
High Nb-TiAl alloy components fabricated by laser-directed energy deposition (LDED) exhibit promising applications in aerospace and other high-temperature (HT) fields. It is essential to elucidate the microstructure evolution under HT and high-pressure conditions. In this study, we systematically investigated the room temperature (RT) and HT compression properties of the alloy under various processing parameters, revealing the microstructure evolution during compression. A reduction in laser power (P) decreases the proportion of columnar dendrites while increasing the proportion of epitaxial dendrites, thereby facilitating the transformation of columnar dendrites into equiaxed dendrites. Additionally, lowering the P reduces the size of the α2 + γ lamellar colony (LC) and refines the microstructure of the alloy. The ultimate compressive strength (UCS) of the alloy at RT increased from 1065.5 ± 255.5 MPa at 750 W to 1240.1 ± 104.7 MPa at 450 W. The RT compression fracture is primarily characterized by cleavage surfaces and cleavage steps. The strain rate exhibits a negative correlation with the HT UCS of the alloy. Under conditions of 40% engineering strain, the UCS of the alloy at 900 °C rises from 890.7 ± 98.1 MPa at a strain rate of 0.5 mm/min to 1260.8 ± 91.0 MPa at 5 mm/min. Dislocation and stacking faults can easily occur during the compression process at RT, while dislocations and dynamic recrystallization are more prevalent during compression at 900 °C. Samples subjected to higher strain rates exhibit a lower number of dynamically recrystallized grains, resulting in a higher UCS.

1. Introduction

High Nb–TiAl alloys possess a density that is approximately half that of nickel-based superalloys and exhibit favorable HT properties [1,2]. This material system is increasingly favored for replacing nickel-based superalloys in HT applications and is widely utilized in aerospace, automotive electronics, energy power, and medical fields [3,4]. However, traditional manufacturing methods, such as casting and forging, are susceptible to producing defects like pores and cracks, which compromise the stability of component performance [1]. Additionally, the brittleness of high Nb–TiAl alloys at RT is significant [5]. Conventional machining techniques, including turning and milling, often lead to component breakage due to this high brittleness [6,7,8], making it challenging to swiftly address the manufacturing demands of aerospace components.
Additive manufacturing technology enables the direct production of complex-shaped components made from difficult-to-machine materials, overcoming the limitations of traditional farming and processing methods. This advancement significantly reduces the development and manufacturing cycle of components [9,10,11]. Notably, LDED technology offers a straightforward and efficient molding process, providing distinct advantages in the manufacturing of high Nb–TiAl alloy.
Taking aerospace high Nb–TiAl alloy components as an example, they work in extremely harsh environments and whether the mechanical properties can meet the standard is the key to service stability. Different from traditional casting, forging, and other manufacturing methods, additive manufacturing has the characteristics of rapid melting and rapid solidification, and its microstructure is different from that of traditional preparation methods. Zhang et al. [12] found that two types of long-period stacked ordered phases, 6H and 18R structures, appeared during LDED of TiAl alloys, which had never been reported by conventional methods. Schwerdtfeger et al. [13] found that, when TiAl was formed by selective electron beam melting, Al element volatilization occurred, which affected the mechanical properties. Wang et al. [14] also came to the same conclusion. In addition, Wang et al. [15] found that, when TiAl was manufactured by LDED, an obvious layer structure was produced and a serious heat accumulation problem was found to lead to obvious coarsening of the microstructure.
The unique microstructure morphology of additive manufacturing will inevitably make its mechanical properties different from the traditional shaping methods. Thomas et al. [16] found that the RT tensile properties of LDED Ti–47Al–2Cr–2Nb alloy are equivalent to those of the cast after hot isostatic pressing, but the stability of the RT tensile properties is significantly better than that of the latter. In addition, it was found that the anisotropy of the alloy was significantly improved after heat treatment. Zhang et al. [12] found that the mechanical properties of Ti–47Al–2Cr–2Nb alloys with different tensile angles differed significantly, and the elongations were all less than 1%. Huang et al. [17] found that the content of the Nb element significantly affects the microhardness of TiAl alloys. Wu et al. [18] found that the inconsistency of microstructure caused significant fluctuations in the microhardness of TiAl alloys by LDED.
At present, research on the mechanical properties of additively manufactured high Nb–TiAl alloys focuses on microhardness and RT tensile, and it is not yet known whether the compression properties satisfy the service requirements, especially whether the lack of HT compression properties will seriously hamper the practical application of high Nb–TiAl alloys.
In this study, Ti–45Al–8Nb alloy samples were prepared, and the influence of P on the microstructure and mechanical properties was analyzed. The mechanisms of microstructural evolution and compression fracture in the alloy were elucidated. This work aims to provide data support for the practical application of LDED manufacturing of Ti–45Al–8Nb alloy.

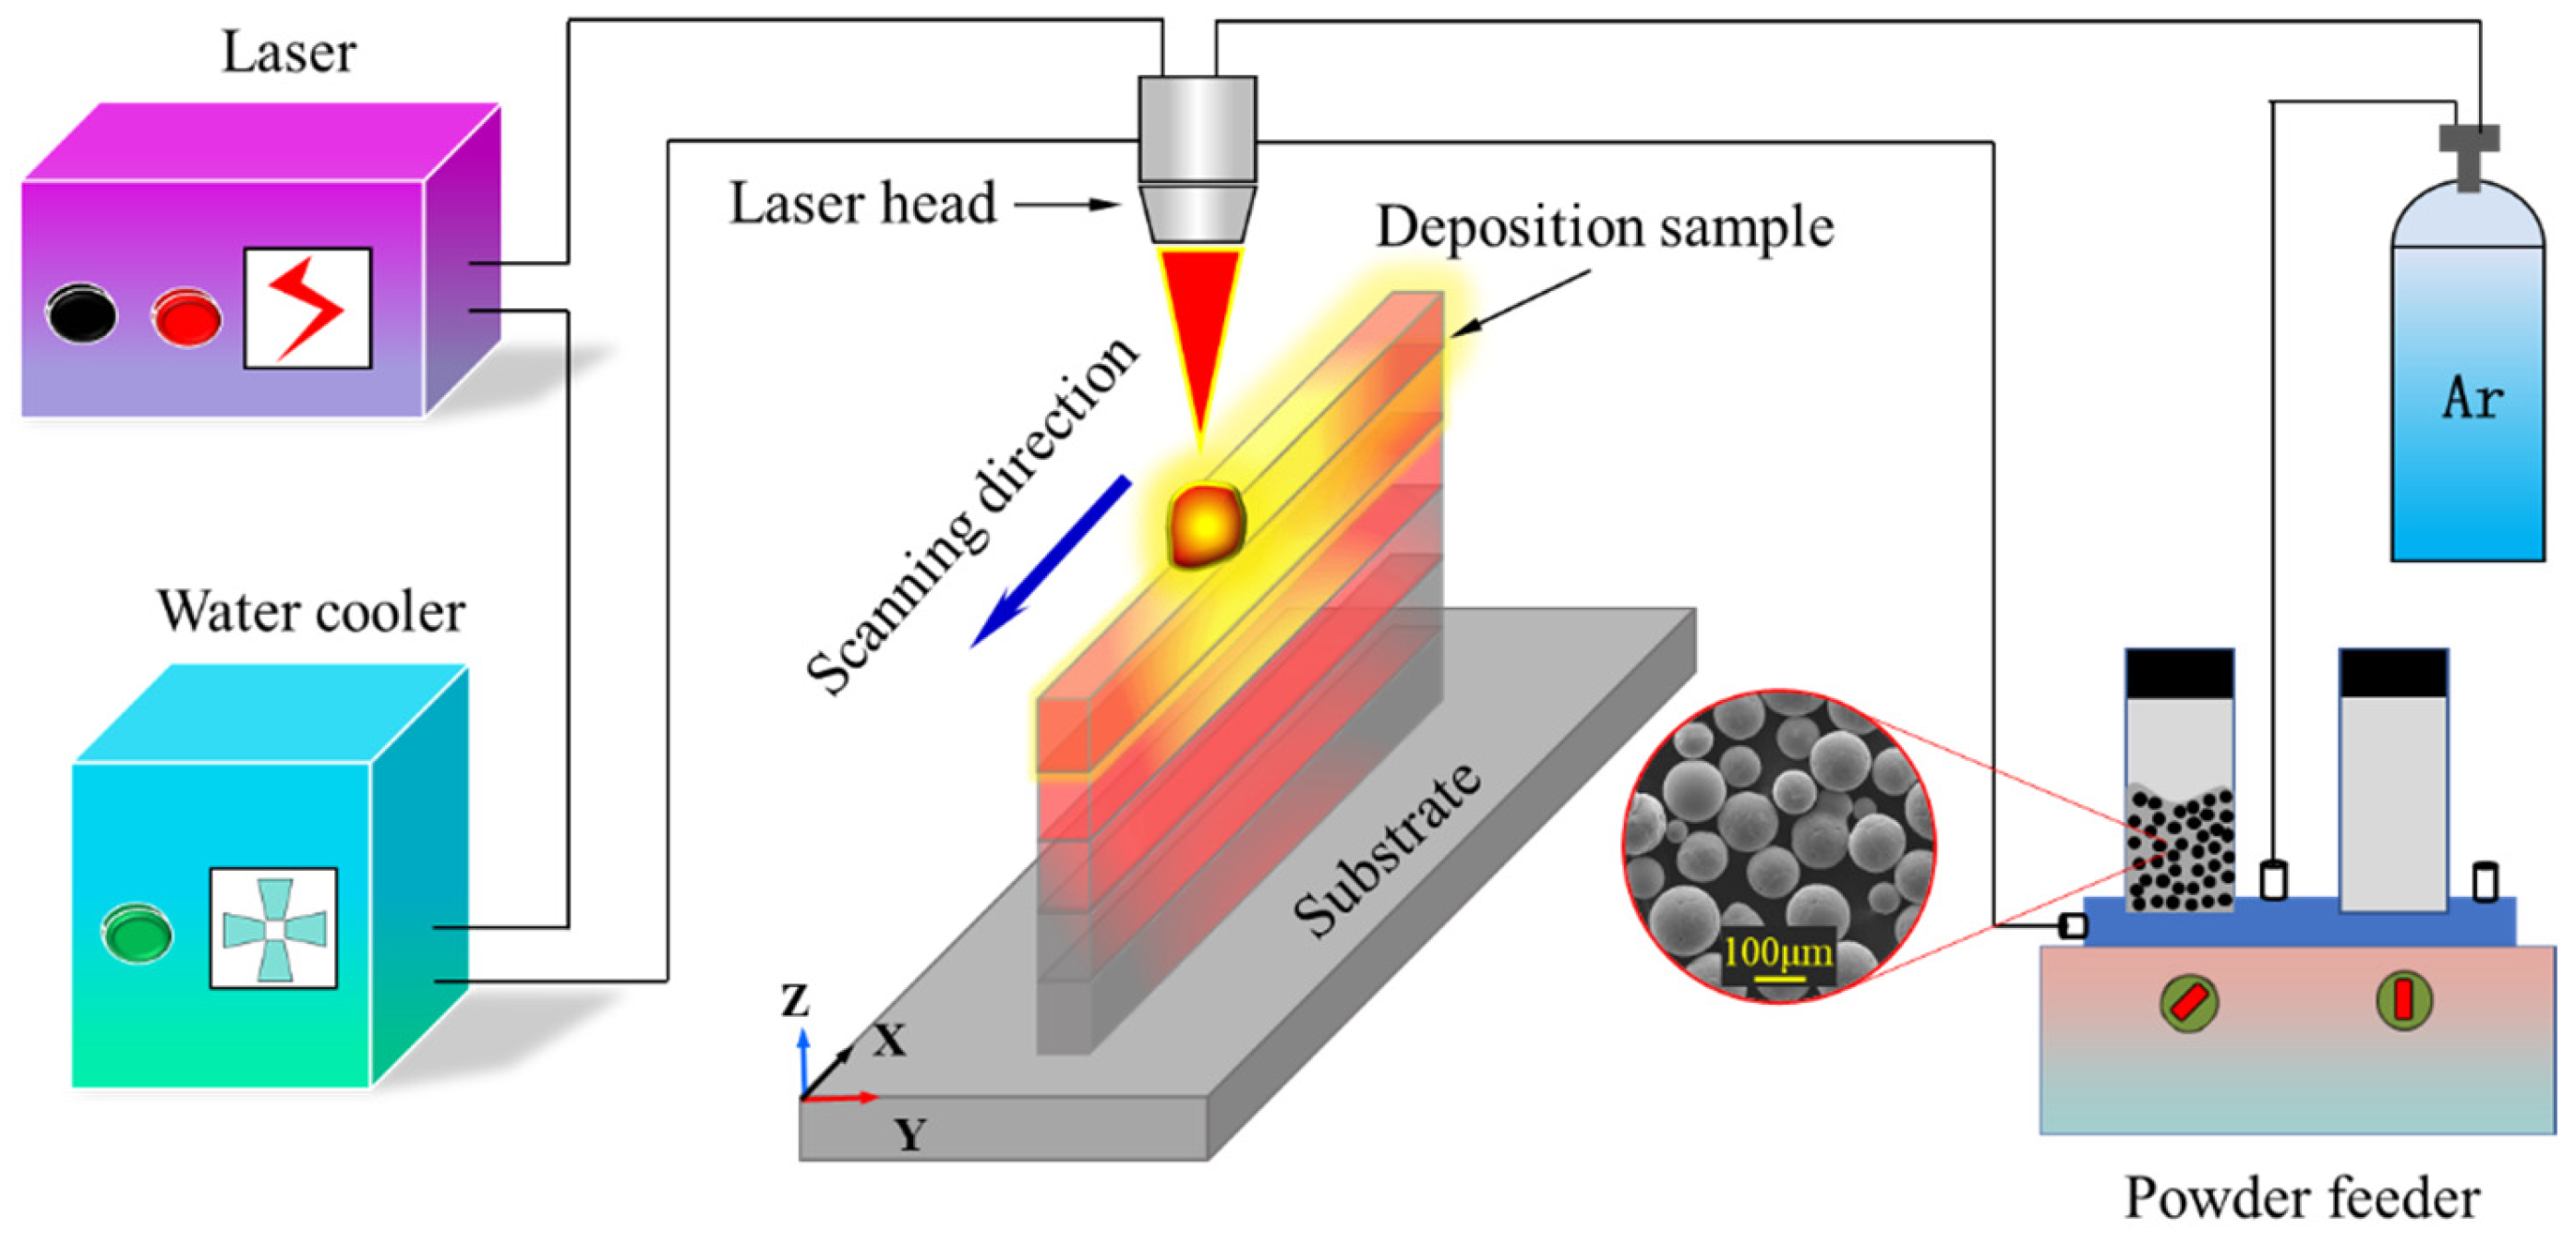
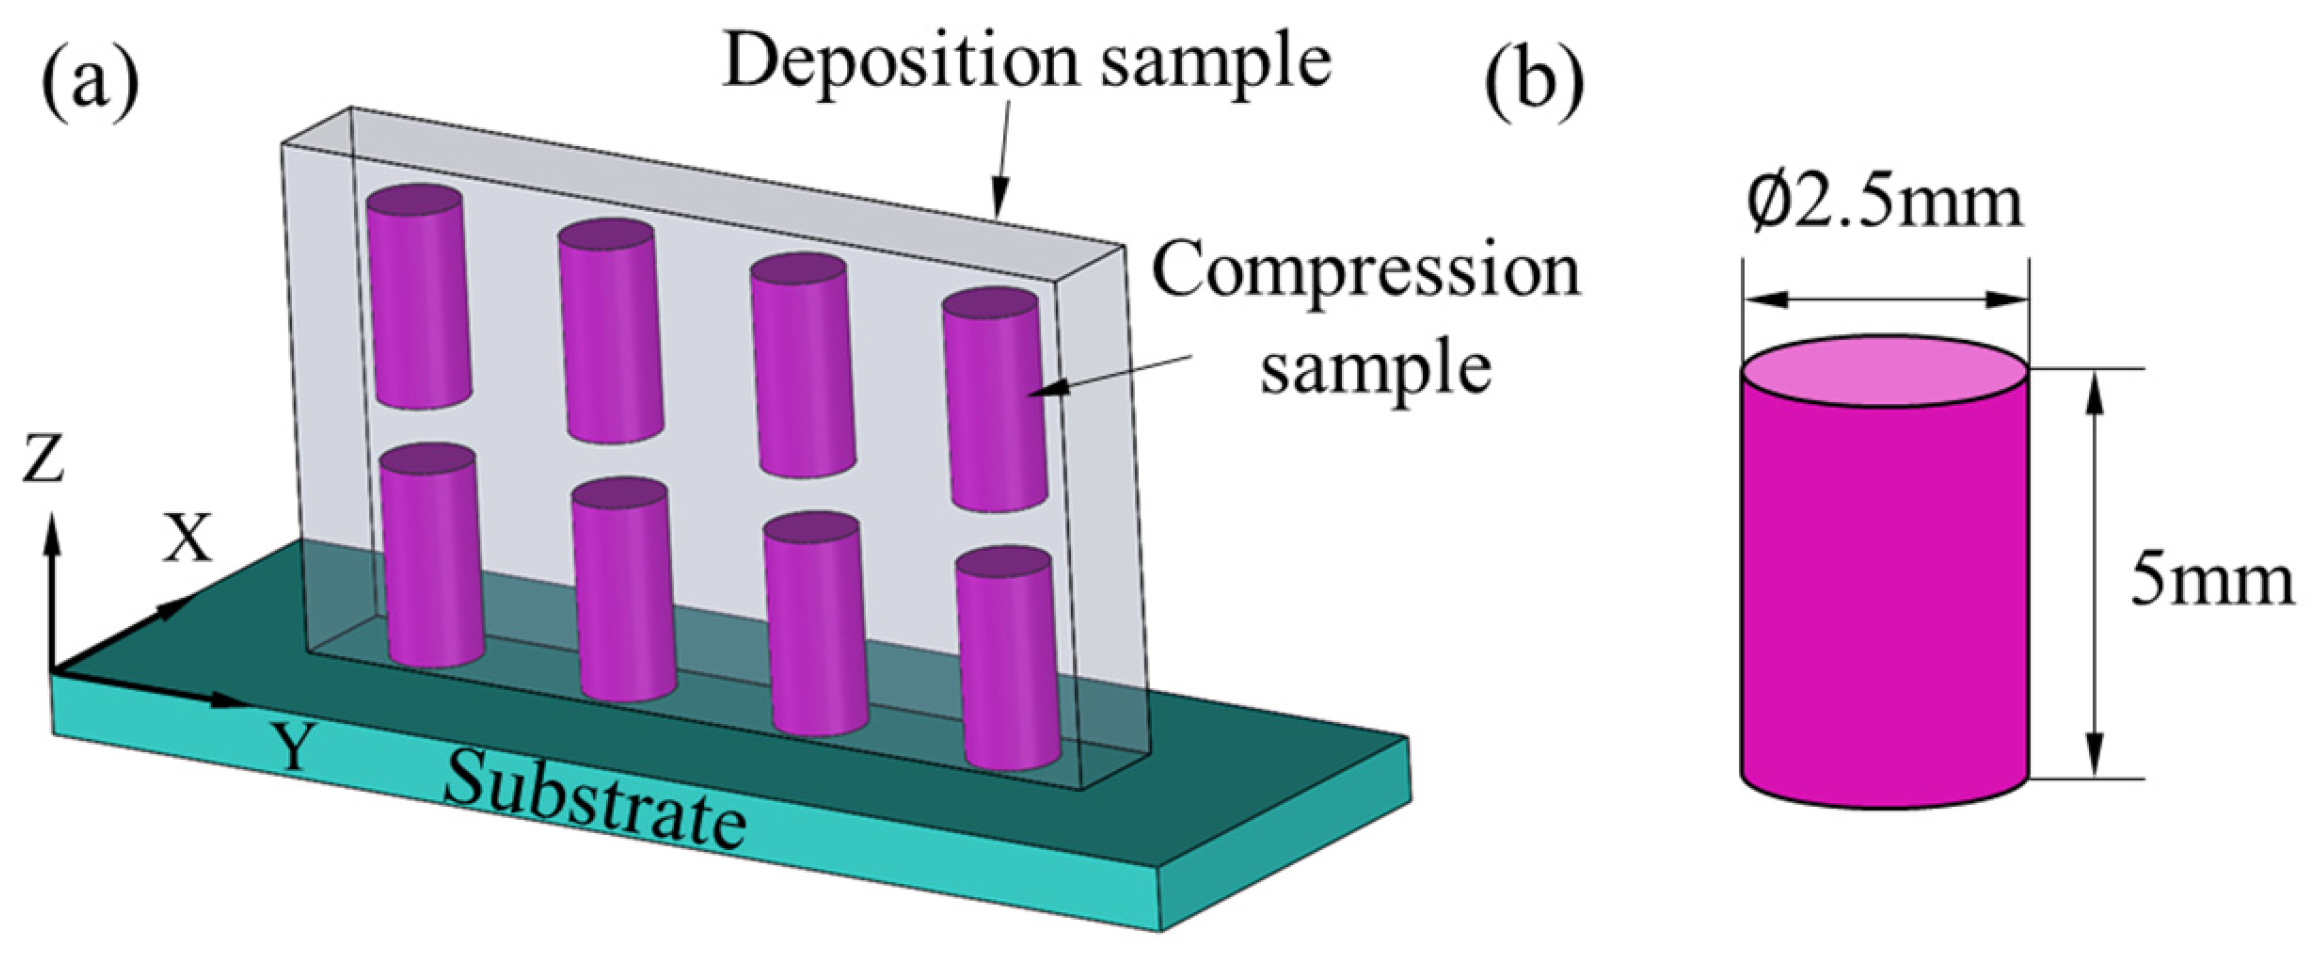
2. Experimental Condition

The shaping experiment was carried out on the directional energy deposition system of Nd: YAG continuous laser. As shown in Figure 1, during the experiment, the powder was transported to the light powder coaxial coupling nozzle through the powder feeder. Powder and substrate materials are Ti–45Al–8Nb and Ti–6Al–4V, respectively, the chemical composition is shown in Table 1, and the powder and substrate were provided by China Xi’an Sailong Metal Co., Ltd., Xi’an, China. The wire cutting was used to cut the deposition sample in a direction perpendicular to the scanning direction for microstructure observation. The surface of the sample to be detected was polished by 320 #, 600 #, 800 #, 1000 #, 1500 #, 2000 #, 3000 #, and 5000 # sandpaper. The samples after grinding and polishing were cleaned and dried by ultrasonic wave.
The cross-section morphology was analyzed by the backscattering mode of the JXA-8530F PLUS field emission electron probe microanalysis (EPMA) (Japan Electronics, Japan), and the working voltage was 15 KV. The fracture surface was analyzed by JSM-7610 Plus scanning electron microscope (Japan Electronics, Japan). Zeiss Supra 55 field emission electron microscope (Carl Zeiss, Germany) was used to image the texture of the sample by electron backscatter diffraction (EBSD, Oxford Instrument). The accelerating voltage was 20 KV, the sample inclination was 70 °, the acquisition speed was 115.93 Hz, and the scanning step was 1 μm. The EBSD sample was polished by an electron beam before shooting and then thinned by the ion beam. Helios G4 UX (Thermo Fisher Scientific, USA) is the ion beam equipment model for EBSD sample thinning. The morphology of the lamellar before and after compression was observed using a JEM-2100F-type transmission electron microscope (TEM) (Japan Electronics, Japan).
The process parameters used are shown in Table 2. RT compression tests were performed for all four sets of process parameters. Due to the large effect of strain rate on the HT compressibility of the alloy [19], one set of process parameters of a p of 450 W was used to carry out HT compression tests at different rates. The HT compression temperature was selected to be 900 °C, and the compression samples were held at 900 °C for 5 min. The strain rates were set to 0.5 mm/min, 1 mm/min, and 5 mm/min, and the HT compression samples were deformed to 40% of the engineering strain during isothermal compression. The RT and HT compression performance tests were carried out on the AG-X plus compression testing machine (Shimadzu, Japan). Both RT and HT compressed samples were cut from the deposited samples by wire electrical discharge machining and then polished to the target size. The compression sampling method and sample size are shown in Figure 2. The diameter of the compressed sample is 2.5 mm and the height is 5 mm.

3. Result Discussion
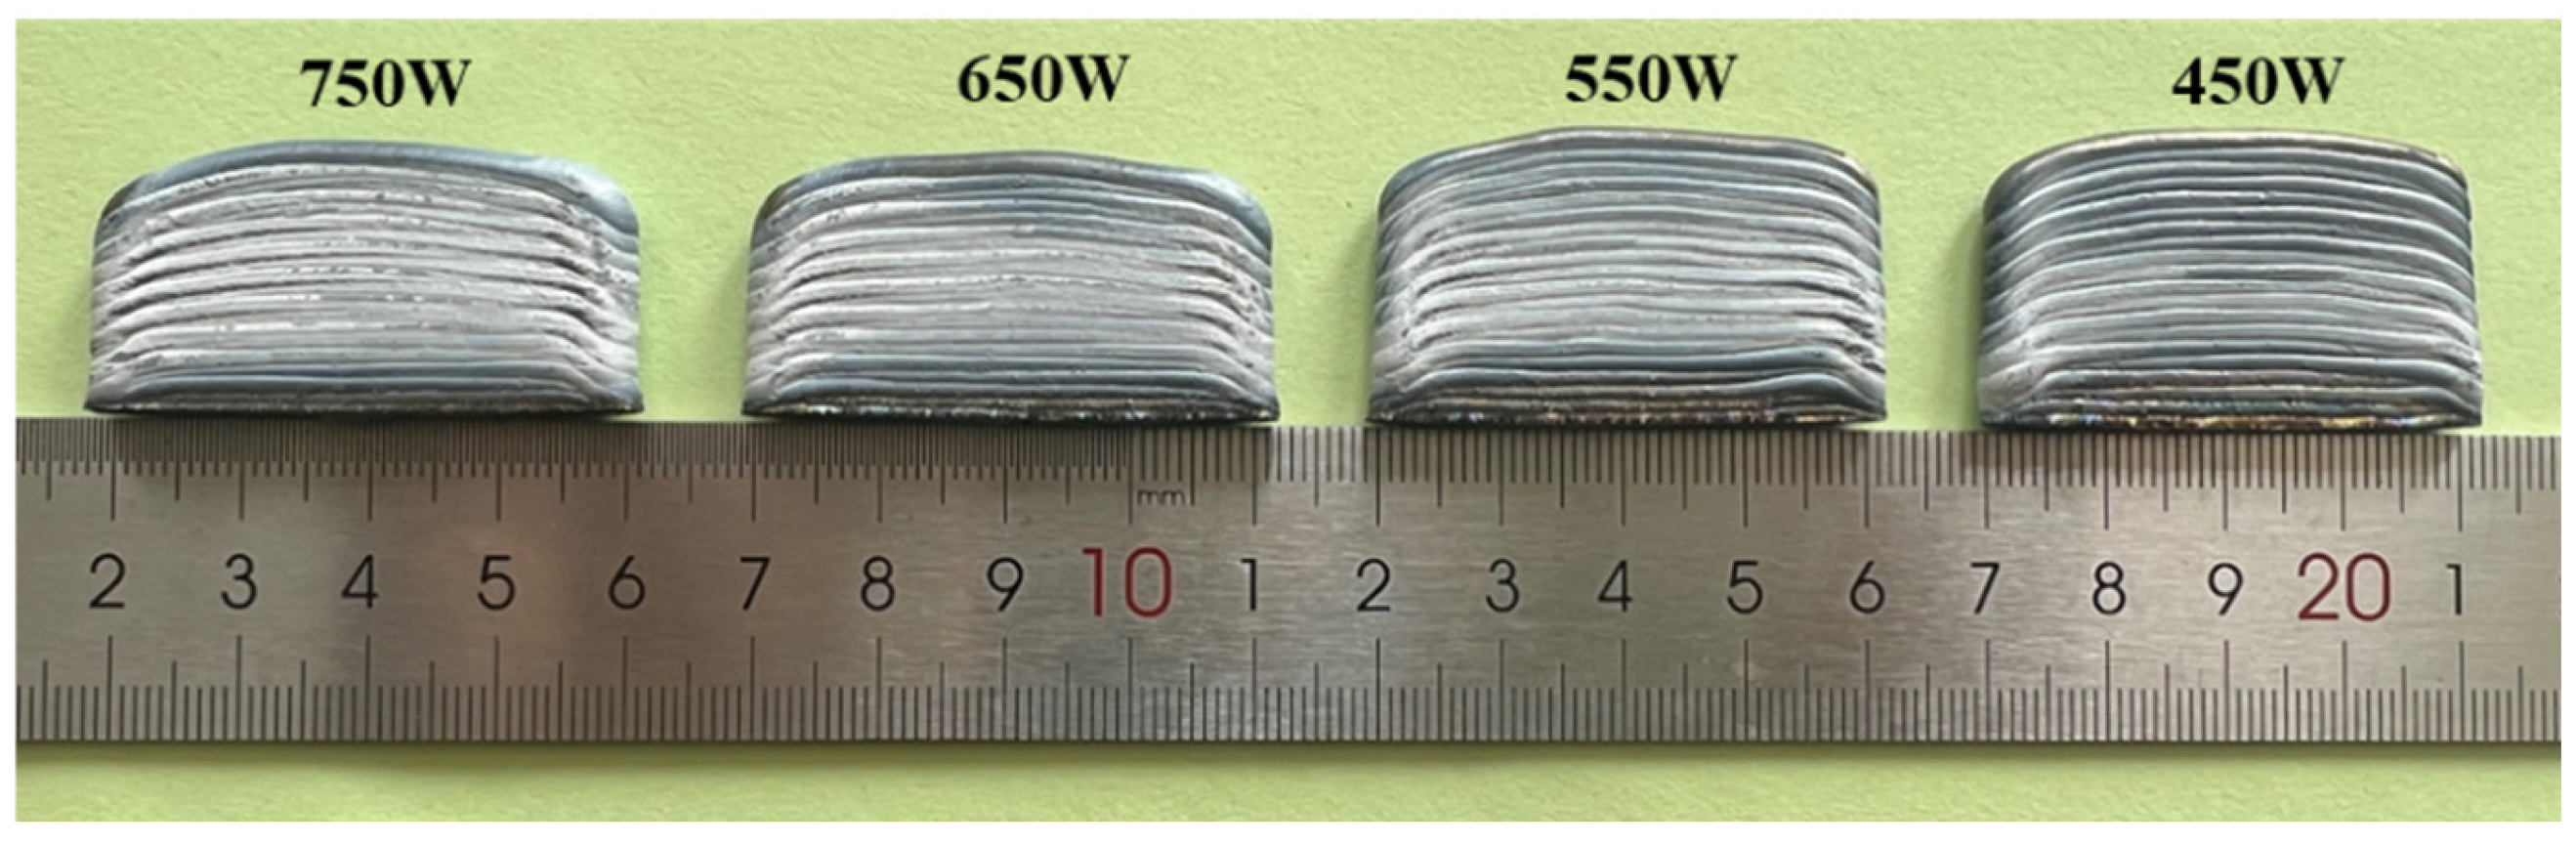
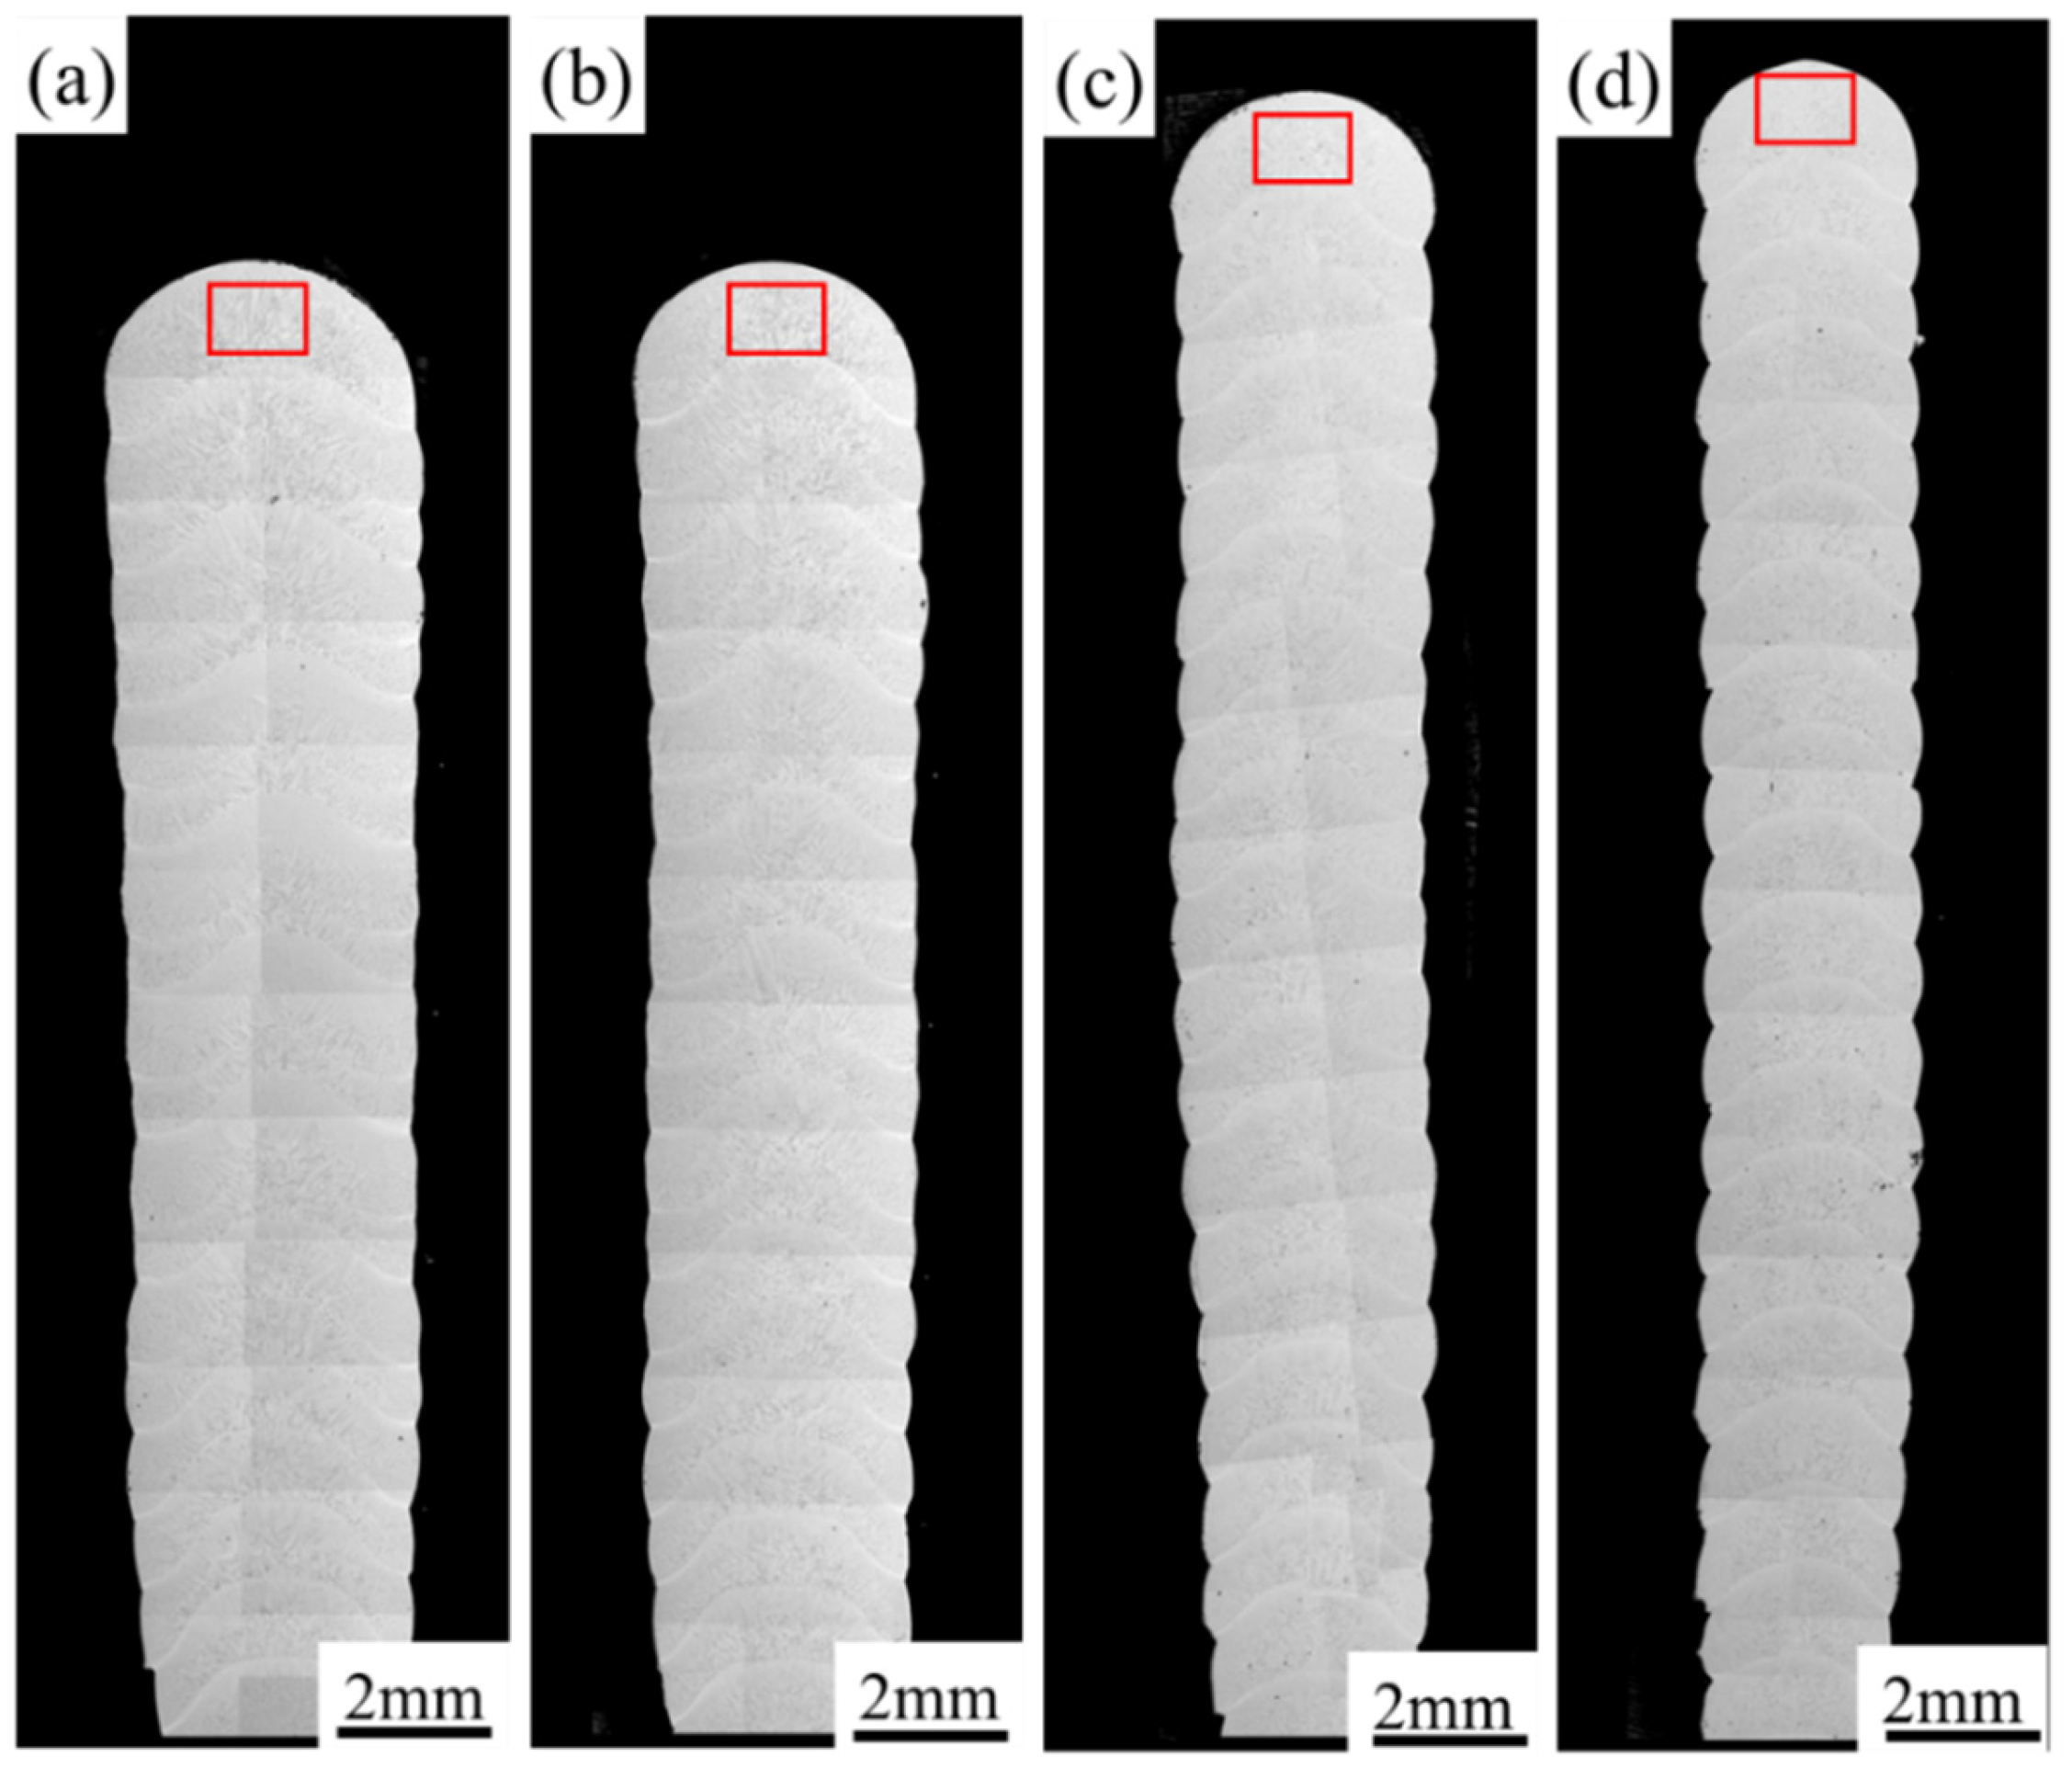
3.1. Macrostructure

The macroscopic morphology is shown in Figure 3. The samples are free of cracks and exhibit good surface integrity. Figure 4 presents the cross-sectional morphology of the samples. As the parameter p decreases, the height of the single-channel multilayer sample increases while the width decreases. When p is higher, the laser generates more energy, leading to greater heat being absorbed in the melt pool, and the melt pool exists for a longer period, resulting in a greater amount of powder that can be captured in the melt pool. The higher energy input increases the mobility of the melt pool, collapses the melt pool, and not only increases the width of the melt pool but also reduces the height of the deposited layer.

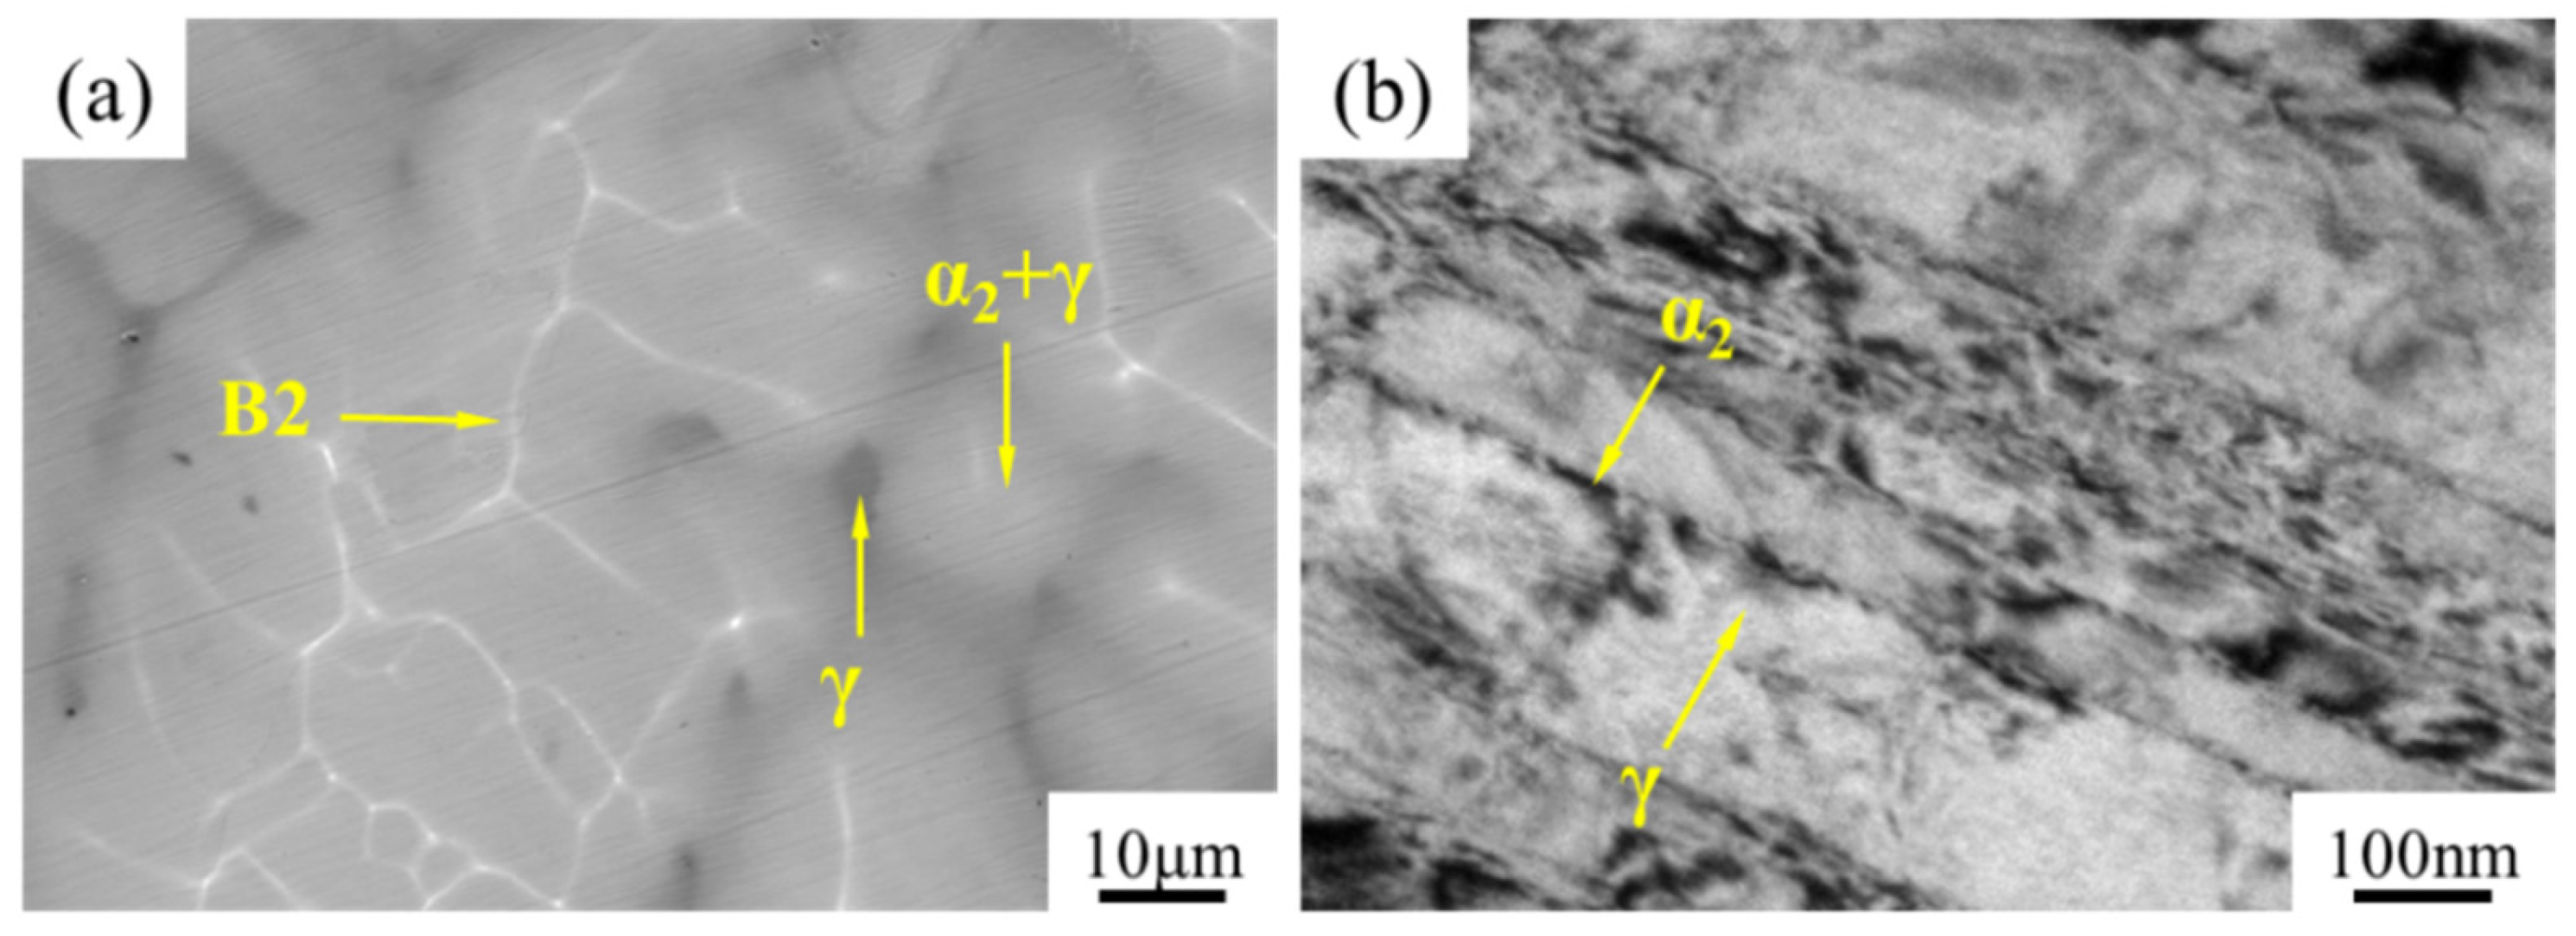
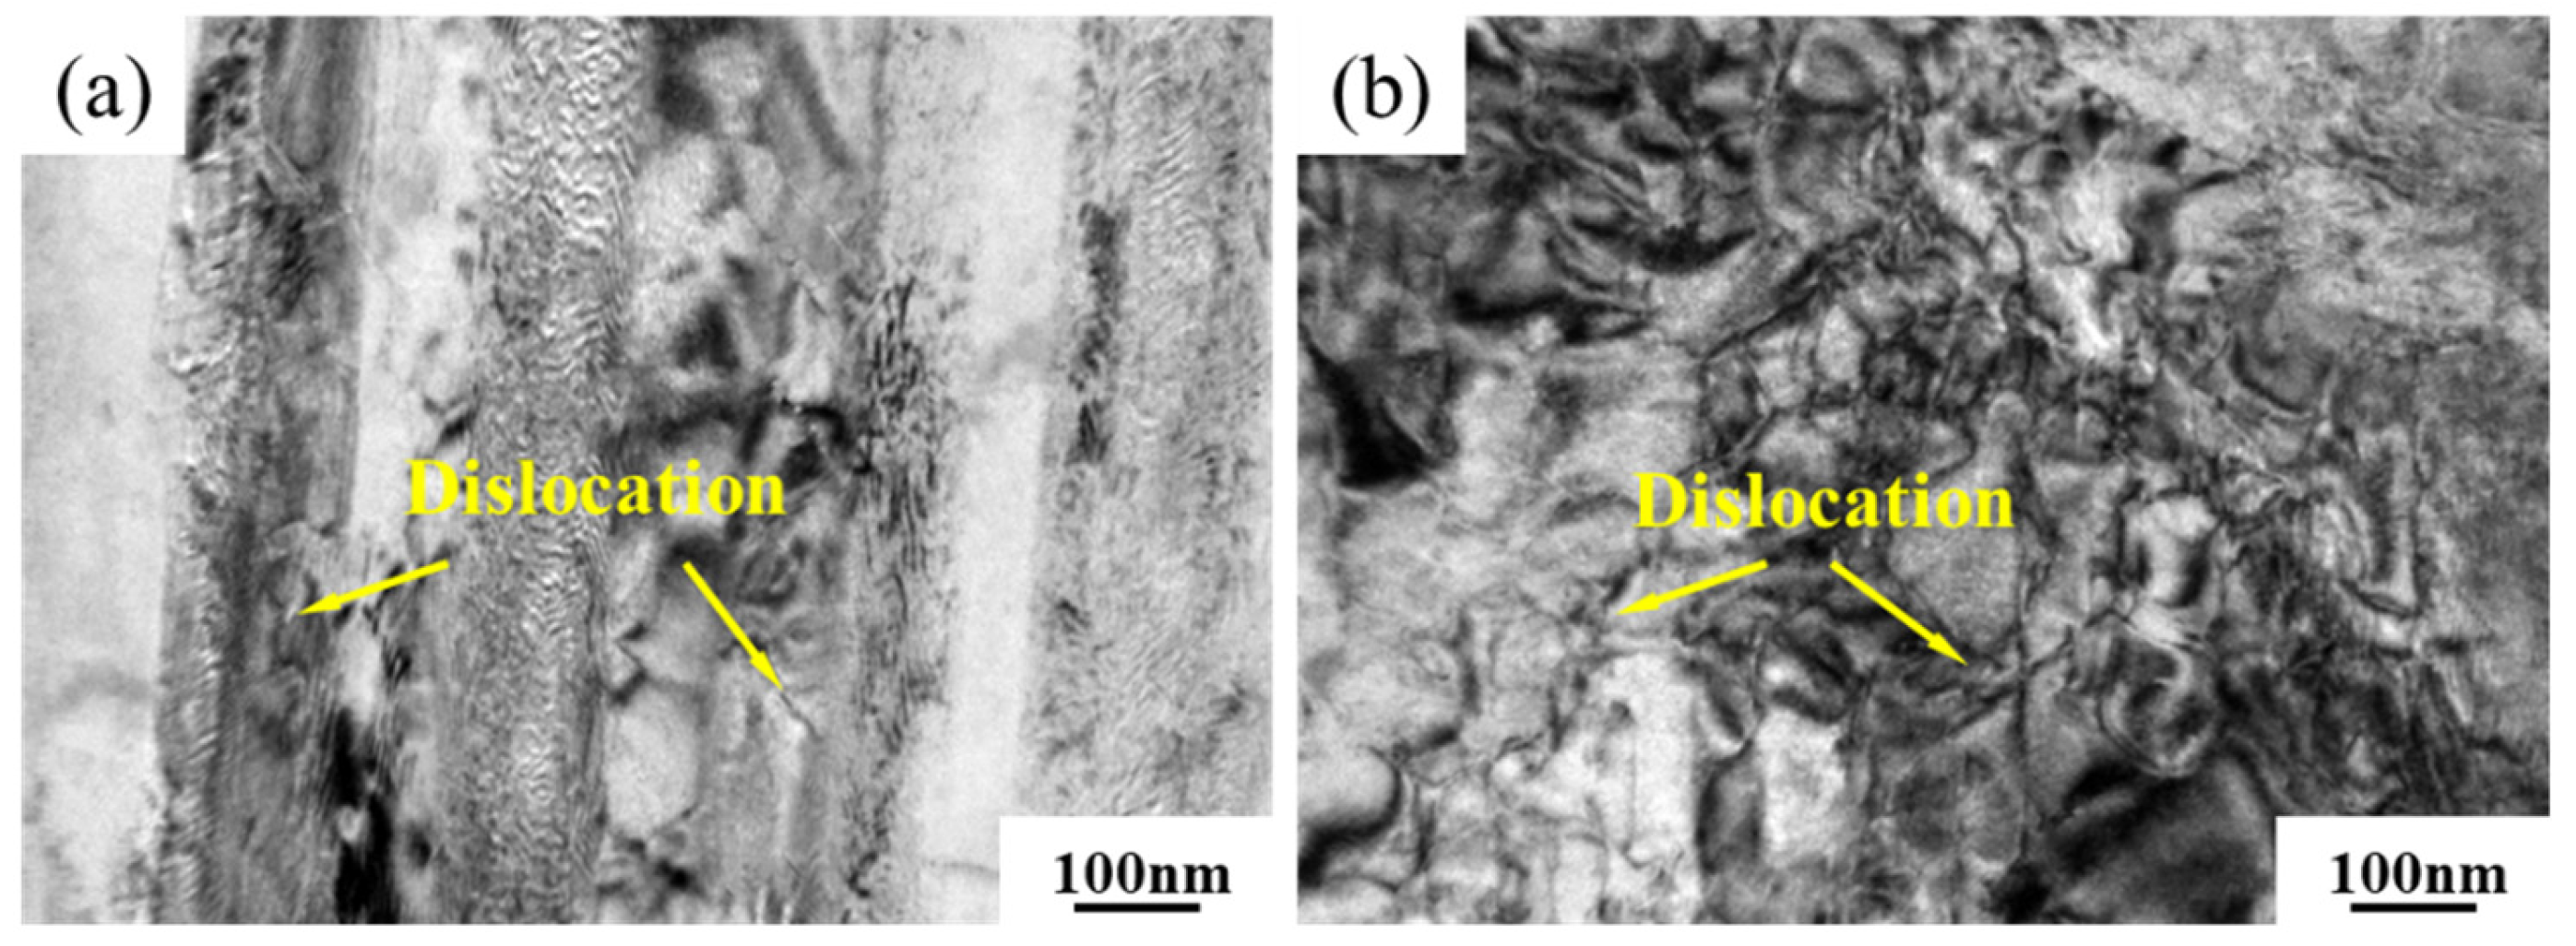
3.2. Microstructure Morphology

Figure 5 shows the dendrite morphology and α2 + γ LC morphology. The dendrite morphology is derived from the top layer of the single-channel multilayer sample, as shown in the red frame in Figure 4. At a power setting of 750 W, the microstructure of the alloy predominantly consists of columnar dendrites, with only a small number of equiaxed dendrites distributed along the edges of the molten pool. The columnar dendrites grow in alignment with the direction of heat dissipation, characterized by vertical growth in the central region, a partial tilt of the molten pool’s edges towards both sides and a gradual decrease in dendrite size, as depicted in Figure 5a. The grain morphology during the solidification process is closely linked to the cooling rate. During the shaping process, the heat source energy is Gaussian distributed, resulting in longer dendritic growth in the center of the melt pool and larger grain sizes. Larger columnar dendrites can be up to 0.8 mm in length.
The matrix of the Ti–45Al–8Nb alloy prepared by LDED consists of α2 + γ LC. At a power setting of 750 W, the morphology of the α2 + γ LC is relatively uniform, with the α2 + γ LC interconnected in a zigzag pattern. Notably, there are almost no α2 + γ LC structures smaller than 20 μm, as illustrated in Figure 5b. When the P is decreased to 650 W, the proportion of columnar dendrites in the alloy diminishes and their size also decreases significantly. Additionally, the number of equiaxed dendrites at the edge of the molten pool increases, leading to a notable reduction in the size of the α2 + γ LC within the alloy. A small amount of α2 + γ LC with a size of less than 20 μm was observed under this process parameter, as shown in Figure 5c,d.
At low P, most of the molten pool is comprised of equiaxed dendrites, as illustrated in Figure 5e,g. This phenomenon is primarily attributed to the low energy input. As depicted in Figure 5f,h, the size of the α2 + γ LC of the alloy decreases significantly at low P, with many α2 + γ LCs measuring less than 20 μm. This size reduction is associated with the high cooling rate of the molten pool under low P. At elevated cooling rates, the α2 + γ LCs do not have sufficient time to grow, resulting in the formation of smaller α2 + γ LCs.
Figure 6 shows the dendrite enlargement diagram and the microstructure of the α2 + γ lamellar structure. In Figure 6a, white filamentous phases are observed precipitating at the dendrite stems, while black phases are found between the dendrites. Based on previous research, it can be concluded that the white filamentous phase corresponds to the B2 phase, and the black phase located between the dendrites is identified as the γ phase [20]. Figure 6b presents a high-resolution image of the α2 + γ lamellar; α2 and γ are distributed in strips, exhibiting a relatively regular morphology.

3.3. Texture Characterization

Figure 7 shows the texture characteristics of the alloys at P of 650 W and 450 W. As depicted in Figure 7a, the majority of the lamellar orientations in the alloys at a P of 650 W are concentrated between the (001) and (110) directions, with only a small proportion aligned along the (010) direction. In contrast, the texture orientation of the larger-sized α2 + γ LC region of the alloy at a P of 450 W also falls between (001) and (110); however, the smaller-sized α2 + γ LC region exhibits a diverse range of texture orientations, as shown in Figure 7d.
To quantitatively analyze the effect of P on the texture orientation of the alloy, the main phase γ phase pole diagram under two P conditions was examined, as shown in Figure 7b,e. The maximum texture index is 57.6 when the P is 650 W, while the maximum texture index is 22.5 at 450 W. A comparison of the texture indices at 650 W and 450 W reveals that the texture intensity of the alloy decreases with the decrease in P. This phenomenon primarily occurs because, under high power conditions, the alloy tends to produce columnar dendrites that grow along the deposition direction, thereby enhancing the texture orientation in that direction and resulting in a higher texture intensity.
The grain boundary angle is another important index to measure the texture characteristics. We define the grain boundary larger than 15 ° as the high-angle grain boundary (HGB) and 2° to 15° as the low-angle grain boundary (LGB). The grain boundary angle distribution of the two groups of samples is shown in Figure 7c,f. The red grain boundary is the HGB and the green is the LGB. When the P is 650 W, the LGB of the alloy is 11.5%. When the P is 450 W, the LGB of the alloy is 19.4% and the LGB increases with the decrease in the P. On the one hand, the LGB is mostly distributed in the small grain aggregation area and, on the other hand, the forming characteristics of LDED are determined by the layer-by-layer forming method, so that the remelting of the previously deposited layer partially occurs, and this phenomenon is similar to the annealing of the remelted deposited layer, which leads to the recrystallization of the grain and promotes the generation of the HGB, and the remelting phenomenon of the deposited layer decreases at low P and, therefore, the proportion of the LGB increases with the decrease in the P.

4. Compression Performance Analysis

4.1. RT Compressive Properties

Figure 8 shows the stress–strain curves and UCS at RT. It can be found from Figure 8a that the compressive yield strength with different P at RT exceeds 500 MPa; however, no discernible trend related to P is observed. Conversely, the UCS at RT increases as P decreases. As shown in Figure 8b, the UCS of the alloy rises from 1065.5 ± 255.5 MPa at 750 W to 1240.1 ± 104.7 MPa at 450 W.
Figure 9 shows the RT compression fractures. The fractures are relatively flat and primarily consist of a cleavage plane and cleavage step, which are characteristic features of typical brittle fractures. The matrix of the LDED Ti–45Al–8Nb alloy comprises α2 and γ lamellar phases. Consequently, there are two primary modes of crack propagation during RT compression: expansion along the α2 and γ phase interface and expansion through the α2 and γ phase boundaries. These two modes of propagation lead to the formation of a smooth cleavage plane and cleavage step, respectively.
Figure 10 shows a schematic diagram of the crack extension during RT compression. Under stress, the α2 + γ LC will move in different directions, leading to the formation of crack sources at the boundaries of the α2 + γ LC [21], as indicated at point A1 in Figure 10. Since the crack propagation resistance of the α2 + γ lamellar structure is greater than that of the α2 + γ LC boundary [22], as strain increases, the crack will propagate along the α2 + γ LC boundary in a direction parallel to the compression, reaching point B1. At this stage, the angle between the crack propagation direction and the direction of the compressive stress deviation becomes larger, preventing the crack from continuing to propagate along the boundary of the α2 + γ LC.
When the stress exceeds the bonding strength between the α2 + γ lamellar, the crack will extend along the lamellar interface to point C1. At this point, the crack again deviates from the direction of stress, the crack will pass through several layers of lamellar back to the compressive stress direction of the D1 point, and so on until compression sample fracture. It is worth noting that, when the crack propagates between the α2 + γ lamellar, a cleavage plane will be formed, as shown in the B1C1 segment of Figure 10. When the crack passes through several lamellas, a cleavage step will be formed, as shown in the C1D1 segment of Figure 10. In addition, the low P sample has more LC and a stronger ability to resist crack propagation, so its UCS at RT is the highest.
The lamellar morphology following compression at RT is shown in Figure 11. A significant number of dislocations and stacking faults are generated, with the stacking faults distributed within the γ phase and terminating at the lamellar interface. During the deformation process, dislocations accumulate, and these accumulated dislocations serve as nucleation sites for stacking faults. As strain increases, stacking faults are formed, as depicted in Figure 11b. Stacking faults can act to separate the lamellar, thereby impeding subsequent dislocation slip [1], which ultimately contributes to the enhancement of mechanical properties.

4.2. HT Compressive Properties

Since the RT compression performance of the 450 W sample was the best, this sample was selected for the HT compression performance test. Figure 12 shows the compressive stress–strain curves of samples subjected to different strain rates at 900 °C. The analysis indicates that the curves can be divided into two distinct stages: the work-hardening stage and the dynamic-softening stage [23,24]. Observation of the stress–strain curve reveals that, at the beginning of the strain, the stress rises rapidly in a very small strain range, and the two are almost linearly related, with work hardening dominating the process and dislocation density increasing rapidly with the increase in strain. As the strain continues to increase, the alloy undergoes dynamic recrystallization at high temperatures, that is, dynamic softening [25,26]. At this time, the stress in the stress–strain curve does not increase linearly with the increase in strain. The stress reaches its peak when work hardening is comparable to the effect of dynamic softening. Dynamic softening will dominate during subsequent compression, with the stress decreasing as the strain increases. It is worth noting that there is no obvious steady-state stage in the compression process, which may be caused by the insufficient dynamic recrystallization process in the HT compression process [27]. The flow stress is very sensitive to the strain rate. The faster the strain rate is, the more difficult the dynamic softening is. Therefore, with the increase in strain rate, the UCS of the alloy increases gradually, from 890.7 ± 98.1 MPa at 0.5 mm/min to 1260.8 ± 91.0 MPa at 5 mm/min.
Figure 13 shows the lamellar morphology at different strain rates following compression at 900 °C. It is observed that dislocations are present within the lamellar structure. The dislocation density in the sample subjected to a strain rate of 5 mm/min is significantly higher than that in the sample with a strain rate of 0.5 mm/min, and dislocation winding occurs in both samples. A strong interlocking effect arises from the dislocation winding, which impedes the further slip of dislocations. The additional slip of these dislocation windings necessitates greater applied stress, a phenomenon associated with work hardening that occurs at the onset of the compression process. However, as strain continues to increase, the stress on the dislocation entanglement also rises. Once the stress threshold required to induce further slip of the dislocation windings is reached, these windings can undergo cross-slip [28], resulting in a shift in the slip plane. When cross-slip occurs in the alloy, the interlocking effect on dislocations is significantly diminished, thereby reducing the work-hardening capacity. Consequently, work hardening is progressively weakened in the later stages of the HT compression process.
Figure 14 shows the texture characteristics of the α2 + γ LC after the compression of samples subjected to varying strain rates. Under applied stress, the α2 + γ lamellar structure undergoes deformation. During the compression process, the energy stored in the deformation increases, placing the system in an unstable state. The internal energy of the sample is diminished due to deformation and dynamic recrystallization [29]. For the α2 + γ lamellar structure, the slip system in the γ phase is more prevalent than in the α2 phase, making dislocation slip more likely to occur in the γ phase. Furthermore, stress concentration can easily develop at the interface of the α2 + γ LC during compression, which facilitates dislocation slip. As strain progresses, dislocation accumulation at the interface between the γ and α2 phases, as well as at the interface of the α2 + γ LC, leads to a difference in dislocation density and a strain gradient at the interface. This phenomenon promotes the migration of grain boundaries, allowing dislocations in the deformed structure to be absorbed and resulting in the rearrangement of grain boundaries to form dynamic recrystallization [30].
Compared with Figure 14, it can be found that the dynamic recrystallization phenomenon of the low strain rate sample is more obvious than that of the high strain rate sample, which is mainly because the dynamic recrystallization process involves not only the dislocation slip and stacking but also the diffusion of the elements [31], and the time to reach the same amount of strain is much shorter under high strain rate, so the alloying elements do not have time to diffuse, which results in the dynamic recrystallization of the high strain rate specimen, with the number of grains being lower than that of the low strain rate sample.
Figure 15 shows a schematic diagram of the dynamic recrystallization formation of LDED Ti–45Al–8Nb alloy during compression at 900 °C. The matrix of the alloy consists of α2 + γ lamellar, so the narrower lamellar are used to represent the α2 phase and the wider lamellar are used to represent the γ phase. According to the previous analysis, it is known that dislocation slip in alloys is more likely to occur in the γ phase, and the lamellar interface is the main barrier to dislocation slip during deformation [14]; so, when the lamellar orientation is at 90° to the stress direction, the dislocations will slip along the direction perpendicular to the lamellar interface. The dislocations slip along the laminar interface when the angle between the lamellar orientation and the stress direction is between 0° and 90° [31]. At the early stage of the compression process, dislocations will accumulate at the α2 + γ LC junction, as shown in Figure 15a, and, as compression proceeds, distortion energy will be generated at the α2 + γ LC interface, which, in turn, promotes the nucleation of dynamic recrystallization, as shown in Figure 15b. At the late stage of the compression process, along with the absorption of dislocations and migration of grain boundaries, dynamic recrystallization was grown, as shown in Figure 15c.

5. Conclusions

Ti–45Al–8Nb alloy samples were prepared by an LDED technique, and the influence mechanism of P on the microstructure and compression properties of the alloy was investigated, and the crack extension mode and the performance strengthening mechanism during RT and HT compression were analyzed, the microstructure evolution law of the alloy in compression was revealed, and the main conclusions obtained are as follows:
(1) With the decrease in P, the percentage of columnar dendrites in the alloy gradually decreases and the percentage of equiaxial dendrites gradually increases; in addition, the size of α2 + γ LC of the alloy was reduced, which shows that the reduction in P can promote microstructure refinement.
(2) The RT UCS gradually increased with the decrease in P from 1065.5 ± 255.5 MPa at 750 W to 1240.1 ± 104.7 MPa at 450 W, and the alloy exhibits brittle fracture at RT. The strain rate is negatively correlated with the HT compression properties of the alloy, and the UCS of the alloys at 900 °C shows an increasing trend with the increase in strain rate, from 890.7 ± 98.1 MPa at 0.5 mm/min to 1260.8 ± 91.0 MPa at 5 mm/min.
(3) Dislocation and stacking faults can easily occur during the compression process at RT, and dislocation and dynamic recrystallization can easily occur during the compression process at 900 °C. Under the condition of a high temperature of 900 °C, the number of dynamic recrystallization grains of the high-strain-rate sample is small, and the UCS is improved.

Author Contributions

Conceptualization, F.N.; Software, C.S.; Validation, J.W.; Formal analysis, Z.W.; Resources, G.M.; Data curation, D.W.; Writing—original draft, T.D. and Y.W. All authors have read and agreed to the published version of the manuscript.

Funding

Financial support from the National Natural Science Foundation of China (No. 52175291), the Fundamental Research Funds for the Central University (No. DUT23YG116).

Institutional Review Board Statement

Not applicable.

Informed Consent Statement

Not applicable.

Data Availability Statement

Data is contained within the article.

Conflicts of Interest

The authors declare no conflicts of interest.

References

  1. Hu, Q.; Wang, Y.; Lv, L.; Luo, Y.; Su, L.; Liu, B. Hot deformation behavior and dynamic recrystallization mechanism of Ti-48Al-2Nb-2Cr with microstructure. J. Alloys Compd. 2023, 945, 169378. [Google Scholar] [CrossRef]
  2. Li, T.R.; Liu, G.H.; Xu, M.; Fu, T.L.; Tian, Y.; Misra, R.J.D.K.; Wang, Z.D. Hot Deformation Behavior and Microstructural Characteristics of Ti–46Al–8Nb Alloy. Acta Metall. Sin. 2018, 31, 933–944. [Google Scholar] [CrossRef]
  3. Lin, X.; Huang, H.; Yuan, X.; Zheng, B.; Wang, Y.; Zuo, X.; Zhou, G. Microstructure change characteristic and fracture mechanism of Ti-47.5Al-2.5V-1.0Cr-0.2Zr alloy during high temperature tensile deformation. J. Alloys Compd. 2023, 952, 169963. [Google Scholar] [CrossRef]
  4. Kim, Y.W.; Kim, S.L. Advances in Gammalloy Materials–Processes–Application Technology: Successes, Dilemmas, and Future. JOM 2018, 70, 553–560. [Google Scholar] [CrossRef]
  5. Zhang, S.; Tian, N.; Li, J.; Yang, G.; Yang, W.; Wang, G.; Liu, Z.; Li, Y. Microstructure evolution of a forged TiAl-Nb alloy during high-temperature tensile testing. Mater. Charact. 2023, 205, 113268. [Google Scholar] [CrossRef]
  6. Huang, H.; Liao, M.; Yu, Q.; Liu, G.; Wang, Z. The Effects of Hot-Pack Coating Materials on the Pack Rolling Process and Microstructural Characteristics during Ti-46Al-8Nb Sheet Fabrication. Materials 2020, 13, 762. [Google Scholar] [CrossRef]
  7. Wu, X. Review of alloy and process development of TiAl alloys. Intermetallics 2006, 14, 1114–1122. [Google Scholar] [CrossRef]
  8. Paul, J.D.H.; Lorenz, U.; Oehring, M.; Appel, F. Up-scaling the size of TiAl components made via ingot metallurgy. Intermetallics 2013, 32, 318–328. [Google Scholar] [CrossRef]
  9. Ngo, T.D.; Kashani, A.; Imbalzano, G.; Nguyen, K.T.Q.; Hui, D. Additive manufacturing (3D printing): A review of materials, methods, applications and challenges. Compos. Part B Eng. 2018, 143, 172–196. [Google Scholar] [CrossRef]
  10. Li, W.P.; Wang, H.; Zhou, Y.H.; Zhu, Y.Y.; Wang, N. Yttrium for the Selective Laser Melting of Ti-45Al-8Nb Intermetallic: Powder Surface Structure, Laser Absorptivity, and Printability. J. Alloys Compd. 2021, 892, 161970. [Google Scholar] [CrossRef]
  11. Huo, J.; He, B.; Lan, L. Effects of Boron on Microstructure and Mechanical Properties of High-Nb TiAl Alloy Fabricated via Laser Melting Deposition. J. Mater. Eng. Perform. 2023, 32, 10104–10114. [Google Scholar] [CrossRef]
  12. Zhang, X.; Li, C.; Wang, Q.; Zheng, M.; Ye, Z.; Gu, J. Unusual ordered phases with long periodic stacking structures in an additively manufactured TiAl alloy. Mater. Res. Lett. 2020, 8, 454–461. [Google Scholar] [CrossRef]
  13. Schwerdtfeger, J.; Koerner, C. Selective electron beam melting of Ti-48Al-2Nb-2Cr: Microstructure and aluminium loss. Intermetallics 2014, 49, 29–35. [Google Scholar] [CrossRef]
  14. Wang, Q.; Ding, H.; Zhang, H.; Liu, S.; Chen, R.; Guo, J.; Fu, H. Growth rates dependence of macro/microstructures and mechanical properties of Ti-47Al-2Nb-2Cr-0.2Er alloy directionally solidified by cold crucible. Mater. Des. 2017, 125, 146–157. [Google Scholar] [CrossRef]
  15. Wang, J.; Luo, Q.; Wang, H.; Wu, Y.; Cheng, X.; Tang, H. Microstructure characteristics and failure mechanisms of Ti-48Al-2Nb-2Cr titanium aluminide intermetallic alloy fabricated by directed energy deposition technique. Addit. Manuf. 2020, 32, 101007. [Google Scholar] [CrossRef]
  16. Thomas, M.; Malot, T.; Aubry, P. Laser Metal Deposition of the Intermetallic TiAl Alloy. Metall. Mater. Trans. A 2017, 48, 3143–3158. [Google Scholar] [CrossRef]
  17. Huang, K.; Xu, F.; Liu, X.; Liu, S.; Wang, Q.; Baker, I.; Song, M.; Wu, H. Microstructure, Mechanical, and Tribological Properties of Nb-Doped TiAl Alloys Fabricated via Laser Metal Deposition. Materials 2024, 17, 4260. [Google Scholar] [CrossRef]
  18. Wu, Y.; Zhang, S.; Cheng, X.; Wang, H. Investigation on solid-state phase transformation in a Ti-47Al-2Cr-2V alloy due to thermal cycling during laser additive manufacturing process. J. Alloys Compd. 2019, 799, 325–333. [Google Scholar] [CrossRef]
  19. Wang, Y.; Liu, Y.; Yang, G.Y.; Li, J.B.; Liu, B.; Wang, J.W.; Li, H.Z. Hot deformation behaviors of β phase containing Ti–43Al–4Nb–1.4W-based alloy. Mater. Sci. Eng. A 2013, 577, 210–217. [Google Scholar] [CrossRef]
  20. Di, T.; Wang, J.; Ma, G.; Song, C.; Niu, F.; Wu, D. The columnar dendrite and equiaxed dendrite transformation of high Nb-TiAl alloy by laser-directed energy deposition. J. Alloys Compd. 2024, 980, 173439. [Google Scholar] [CrossRef]
  21. Xu, X.; Ding, H.; Li, W.; Huang, H.; Liang, H.; Kwak, S.; Chen, R.; Guo, J.; Fu, H. The smooth and notched three-point bending fatigue behavior of directionally solidified high-Nb TiAl alloy. Mater. Charact. 2021, 181, 111444. [Google Scholar] [CrossRef]
  22. Liu, T.; Luo, L.S.; Zhang, D.H.; Wang, L.; Li, X.Z.; Chen, R.R.; Su, Y.Q.; Guo, J.J.; Fu, H.Z. Comparison of microstructures and mechanical properties of as-cast and directionally solidified Ti-47Al-1W-0.5Si alloy. J. Alloys Compd. 2016, 682, 663–671. [Google Scholar] [CrossRef]
  23. Youn, S.-J.; Kim, Y.-K.; Kim, S.-W.; Lee, K.-A. Elevated temperature compressive deformation behaviors of γ-TiAl-based Ti-48Al-2Cr-2Nb alloy additively manufactured by electron beam melting. Intermetallics 2020, 124, 106859. [Google Scholar] [CrossRef]
  24. Niu, H.Z.; Chen, Y.Y.; Xiao, S.L.; Kong, F.T.; Zhang, C.J. High temperature deformation behaviors of Ti-45Al-2Nb-1.5V-1Mo-Y alloy. Intermetallics 2011, 19, 1767–1774. [Google Scholar] [CrossRef]
  25. Liu, Z.C.; Lin, J.P.; Wang, Y.L.; Lin, Z.; Chen, G.L.; Chang, K.M. High temperature deformation behaviour of As-cast Ti-46Al-8.5Nb-0.2W alloy. Mater. Lett. 2004, 58, 948–952. [Google Scholar] [CrossRef]
  26. Singh, V.; Mondal, C.; Kumar, A.; Bhattacharjee, P.P.; Ghosal, P. High temperature compressive flow behavior and associated microstructural development in a β-stabilized high Nb-containing γ-TiAl based alloy. J. Alloys Compd. 2019, 788, 573–585. [Google Scholar] [CrossRef]
  27. Liu, X.; Song, L.; Stark, A.; Lorenz, U.; He, Z.; Lin, J.; Pyczak, F.; Zhang, T. Deformation and phase transformation behaviors of a high Nb-containing TiAl alloy compressed at intermediate temperatures. J. Mater. Sci. Technol. 2022, 102, 89–96. [Google Scholar] [CrossRef]
  28. Zhang, S.; Tian, N.; Li, D.; Li, J.; Jin, F.; Wang, G.; Tian, S. Microstructure evolution and fracture mechanism of a TiAl-Nb alloy during high-temperature tensile testing. Mater. Sci. Eng. A 2022, 831, 142094. [Google Scholar] [CrossRef]
  29. Chen, X.; Tang, B.; Chen, W.; Yang, Y.; Zheng, G.; Fan, Z.; Li, J. Effect of inter-pass annealing on the deformation microstructure of Ti-48Al-2Cr-2Nb alloy. J. Alloys Compd. 2023, 934, 167751. [Google Scholar] [CrossRef]
  30. Li, M.; Li, J.; Zhou, T.; Xiao, S.; Chen, Y.; Xu, L.; Hu, L.; Shi, L. The investigation of microstructure evolution, deformation behavior and processing performance of the high niobium containing TiAl alloys. Intermetallics 2021, 138, 107336. [Google Scholar] [CrossRef]
  31. Tang, B.; Qi, X.S.; Kou, H.C.; Li, J.S.; Milenkovic, S. Recrystallization Behavior at Diffusion Bonding Interface of High Nb Containing TiAl Alloy. Adv. Eng. Mater. 2016, 18, 453–677. [Google Scholar] [CrossRef]
Figure 1. Schematic diagram of the LDED system.
Coatings 15 00495 g001
Figure 2. Sampling method and size of compression sample: (a) sampling method of compression sample, (b) size of compression sample.
Coatings 15 00495 g002
Figure 3. Macroscopic morphology of samples.
Coatings 15 00495 g003
Figure 4. Cross-sectional morphology of samples: (a) 750 W, (b) 650 W, (c) 550 W, (d) 450 W.
Coatings 15 00495 g004
Figure 5. Dendrite morphology and α2 + γ LC morphology: (a,b) 750 W, (c,d) 650 W, (e,f) 550 W, (g,h) 450 W, (a,c,e,g) obtained from the EPMA backscattering mode, and (b,d,f,h) are the band contrast plots obtained from EBSD.
Coatings 15 00495 g005
Figure 6. (a) Magnification of dendrites; (b) morphology of α2 + γ lamellar.
Coatings 15 00495 g006
Figure 7. Texture characteristics of samples: (ac) 650 W, (df) 450 W.
Coatings 15 00495 g007
Figure 8. (a) Compression stress–strain curves at RT; (b) the relationship between P and UCS at RT.
Coatings 15 00495 g008
Figure 9. Compression fracture of different P samples at RT: (a,b) 750 W, (c,d) 650 W, (e,f) 550 W, (g,h) 450 W.
Coatings 15 00495 g009
Figure 10. Schematic diagrams of crack growth during RT compression.
Coatings 15 00495 g010
Figure 11. Lamellar morphology after compression at RT: (a) dislocation, (b) stacking fault, and (c) stacking fault high-resolution map.
Coatings 15 00495 g011
Figure 12. (a) Compressive stress–strain curves of samples with different strain rates and (b) the relationship between strain rate and ultimate tensile strength.
Coatings 15 00495 g012
Figure 13. The lamellar morphology of different strain rate samples after compression: (a) 0.5 mm/min sample, (b) 5 mm/min sample.
Coatings 15 00495 g013
Figure 14. BC diagram, IPF diagram, and deformation and recrystallization diagram: (ac) 0.5 mm/min sample, (df) 5 mm/min sample. In the (c,f) diagram, blue is a recrystallized structure and red is a deformed structure.
Coatings 15 00495 g014
Figure 15. Dynamic recrystallization process diagram: (a) dislocation accumulation, (b) dynamic recrystallization nucleation, and (c) dynamic recrystallization growth.
Coatings 15 00495 g015
Table 1. Elemental composition of Ti–45Al–8Nb and Ti–6Al–4V (wt.%).
MaterialTiAlNbVFeCONH
Ti–45Al–8NbBal28–29.517–17.80≤0.05≤0.025≤0.12≤0.02≤0.003
Ti–6Al–4VBal5.5–6.803.5–4.50.30.10.20.050.015
Table 2. Experimental process parameters.
p (W)750650550450
Scan rate (mm/min)120
Powder feed rate (g/min)1.7
Disclaimer/Publisher’s Note: The statements, opinions and data contained in all publications are solely those of the individual author(s) and contributor(s) and not of MDPI and/or the editor(s). MDPI and/or the editor(s) disclaim responsibility for any injury to people or property resulting from any ideas, methods, instructions or products referred to in the content.

