Article

Stabilization of Epitaxial NiO(001) Ultra-Thin Films on Body-Centered-Cubic Ni(001)-p(1x1)O

Dipartimento di Fisica, Politecnico di Milano, Piazza Leonardo da Vinci 32, 20133 Milano, Italy
*
Author to whom correspondence should be addressed.
Coatings 2025, 15(5), 507; https://doi.org/10.3390/coatings15050507
Submission received: 26 March 2025 / Revised: 13 April 2025 / Accepted: 21 April 2025 / Published: 23 April 2025

Abstract

:
Ultrathin NiO films, ranging from 1 to 16 monolayers (ML) in thickness, have been stabilized via reactive molecular beam epitaxy on the (001) surface of a metastable body-centered cubic (BCC) Ni film. Low-energy electron diffraction (LEED) confirms that NiO grows as a crystalline film, exposing the (001) surface. Auger electron spectroscopy (AES) reveals a slight oxygen excess compared to a perfectly stoichiometric NiO film. Scanning tunneling microscopy (STM) shows that at low coverages the film exhibits atomically flat terraces, while at higher coverage a “wedding cake” morphology emerges. Scanning tunneling spectroscopy (STS) reveals a thickness-dependent evolution of the electronic band gap, which increases from 0.8 eV at 3 ML to 3.5 eV at 16 ML. The center of the band gap is approximately 0.2 eV above the Fermi level, indicating that NiO is p-doped.

1. Introduction

Metal oxides exhibit an exceptionally diverse range of properties, rivalling those of any other material class [1,2,3]. Their electrical behaviour spans from excellent insulators, such as Al2O3 [4,5] and MgO [6,7], to superconductors like SrTiO3 [8,9]. Some oxides, like BaTiO3, exhibit ferroelectricity [10], while others, such as WO3, display antiferroelectricity [11]. Their magnetic properties are equally varied, encompassing ferromagnetism (CrO2) [12], antiferromagnetism (NiO) [13], diamagnetism (MoO3) [14], and even complex mixed magnetic behaviours [15]. In magnetoelectric oxides, different ferroic orders are coupled, enabling novel functionalities, such as electric-field-controlled magnetism and magnetic-field-induced ferroelectricity [16].
Beyond their intrinsic properties, the integration of oxides with metals is of even greater significance [17]. For example, metal oxides are the most common supports for dispersed metal catalysts and, in some cases, can profoundly influence the chemisorption and catalytic behaviour of supported metal particles [18,19]. Additionally, the interfacial coupling between a ferromagnetic metal and an antiferromagnetic oxide gives rise to the exchange bias effect, a phenomenon essential for applications in spintronic devices and magnetic storage technologies [20,21].
The surface of oxides is critically important for understanding and potentially tuning their physicochemical properties, as it governs their interaction with the surrounding environment and the nature of the interfaces they form with other materials. In this context, the surface science techniques developed over the past decades provide an excellent tool for characterization of the oxide surfaces at the atomic scale [22,23]. However, most bulk oxide surfaces are not accessible to electron-based microscopic and spectroscopic techniques, due to sample charging.
An effective approach to overcoming this limitation has proven to be the growth and characterization of ultrathin oxide films on metallic substrates, which has been the subject of intense research at both experimental and theoretical levels [24,25,26,27]. These films, with thicknesses ranging from a single atomic layer to a few nanometers, serve as model systems for studying the properties of bulk materials using electron-based spectroscopic and microscopic techniques without encountering charging issues. Moreover, the interaction with the metallic substrate, combined with vertical confinement, gives rise to unique physicochemical properties that are absent in bulk systems. These emergent characteristics can lead to novel electronic, magnetic, and catalytic behaviours [28].
Nickel oxide (NiO) is a widely studied transition metal oxide known for its unique electrical, optical, and magnetic properties. As a semiconductor with a wide band gap (~3.6–4.0 eV), NiO finds applications in various fields, including electrochromic devices [29], gas sensors [30], catalysis [31], and energy storage systems such as batteries and supercapacitors [32,33]. Its antiferromagnetic nature with high Neel temperature also makes it a key material in spintronics, particularly in exchange bias systems when coupled with ferromagnetic metals [34]. NiO ultra-thin films, with thicknesses ranging from one up to tens of ML, have been stabilized on various metallic substrates made of noble or quasi-noble metals, such as Ag(001) [35], Au(001) [36], and Pd(001) [37]. In these cases, the relative inertness of the substrate to oxidation and the favourable lattice mismatch allow the stabilization of crystalline films with sharp metal/oxide interfaces. NiO has also been grown on ferromagnetic materials such as Fe(001) [38] and Ni(001) [39]. In the case of Fe(001), the lattice mismatch is favourable, approximately 3.5%. However, the substrate oxidation, induced by the oxygen atmosphere employed during Ni deposition, compromises the epitaxial quality of the NiO film and prevents the formation of a well-defined metal/oxide interface. Conversely, when NiO is grown on a face-centered-cubic (FCC) Ni(001), substrate oxidation is more limited, but the significant lattice mismatch (higher than 18%) hinders the epitaxial growth. Notably, metastable BCC Ni films can be grown on Fe(001) [40,41], adopting the same lattice parameter as the Fe substrate. These films could serve as ideal templates for the growth of high-quality crystalline NiO films, enabling the formation of sharp and well-ordered interfaces between the ferromagnetic metal and the oxide, which is crucial for applications in spintronic and exchange bias systems. In this paper, we demonstrate the feasibility of growing epitaxial NiO films on BCC Ni and provide an atomic-scale characterization using advanced surface science techniques.

2. Experimental Details

The experiments have been performed in an ultra-high vacuum (UHV) chamber, at a base pressure of 10−10 mbar. The samples were prepared by growing a 500 nm thick Fe film on a MgO(001) crystal substrate using molecular beam epitaxy (MBE) at room temperature (RT). The samples have a square shape with a side of 1 cm. The Fe(001) surface was then exposed to 30 L (1 L = 1.33 × 10⁻⁶ mbar·s) of molecular oxygen immediately after being annealed at 700 K, followed by a flash heating process at 900 K. This procedure resulted in the well-characterized Fe(001)-p(1x1)O surface, where each surface unit cell contains a single oxygen atom occupying the fourfold symmetrical hollow site of Fe [42,43]. A 5 ML thick metallic Co buffer layer was subsequently deposited onto the Fe(001)-p(1x1)O surface (where 1 ML of Co corresponds to a thickness of about 0.14 nm). In this thickness range, Co is known to grow pseudomorphically on the Fe substrate [44], adopting a BCC structure with the same in-plane lattice parameter as bulk Fe (aFe = 0.287 nm). The growth of thin Co films on Fe(001)-p(1x1)O follows a layer-by-layer mode, as demonstrated in previous studies and confirmed by our STM observations [45]. The Co layer was deposited at RT via MBE using an electron-beam evaporator in UHV, followed by annealing at 200 °C for approximately 5 min. An additional 5 ML buffer layer of Ni was deposited on top of the cobalt film (1 ML of BCC Ni corresponds to a thickness of about 0.14 nm). We did not directly grow Ni on the Fe(001)-p(1x1)O substrate because the Ni buffer layer is unable to protect the Fe(001) surface from oxidation, as demonstrated in previous studies [46]. In contrast, the cobalt buffer layer preserves the metallic Fe substrate [47]. NiO was then grown at 150 °C by reactive deposition of metallic Ni in a pure O2 atmosphere at a partial pressure of pO2 = 1 × 10⁻⁶ mbar, with thicknesses up to approximately 16 ML (where 1 ML of NiO corresponds to about 0.2 nm). The exposure of the buffer layer to the oxygen atmosphere during growth causes its partial oxidation. Based on AES measurements, we estimated that approximately 3 ML of the Ni buffer layer are transformed in 2 ML of NiO during the reactive deposition. Therefore, the thicknesses considered in this paper are obtained by summing the nominal ML of NiO deposited and the 2 ML of NiO resulting from the oxidation of the Ni buffer layer. The chemical composition of the samples was analysed in situ using Auger Electron Spectroscopy (AES), with an Omicron SPECTALEED system equipped with a retarding field analyser (total acceptance angle: 102°), operated with a 3 kV, 20 µA primary electron beam and a 3 V peak-to-peak modulation amplitude. The same instrument was used to record LEED patterns. The STM/STS measurements have been performed using an Omicron Variable Temperature VT-STM in a UHV chamber connected to the preparation system. STM images have been acquired at room temperature in constant-current mode with home-made electrochemically etched W tips. STS spectra (i.e., dI/dV curves) for the investigation of the sample have been acquired at room temperature, using a lock-in amplifier with a modulation amplitude of 70 mV.

3. Results and Discussion

Figure 1 presents AES spectra and LEED patterns acquired for the Fe(001)-p(1x1)O substrate, as well as after the sequential deposition of 5 ML of Co [5 ML Co(001)-p(1x1)O sample] and 5 ML of Ni [5 ML Ni(001)-p(1x1)O sample]. The AES spectrum of Fe(001)-p(1x1)O (Figure 1a) displays three characteristic Fe LMM peaks, along with the O KLL transition, indicating the presence of a surface oxygen monolayer. The corresponding LEED pattern (Figure 1b) exhibits a well-defined square lattice, consistent with the Fe(001)-p(1x1)O crystal structure. Upon deposition of 5 ML of Co, the AES spectrum (Figure 1c) reveals the emergence of Co LMM peaks, which partially overlap with the attenuated Fe peaks. Notably, the O KLL peak remains unchanged, indicating that the oxygen monolayer floats on top of the surface. The LEED pattern (Figure 1d) retains the same square symmetry as Fe(001)-p(1x1)O, confirming that Co adopts the metastable BCC structure, in agreement with previous studies [44,45]. Similarly, for the 5 ML Ni(001)-p(1x1)O sample, the AES spectrum (Figure 1e) displays characteristic Ni LMM peaks, while the O KLL signal remains unaffected. The LEED pattern (Figure 1f) remains unchanged from the previous cases, demonstrating that the surface consists of a BCC Ni film covered by an oxygen monolayer.
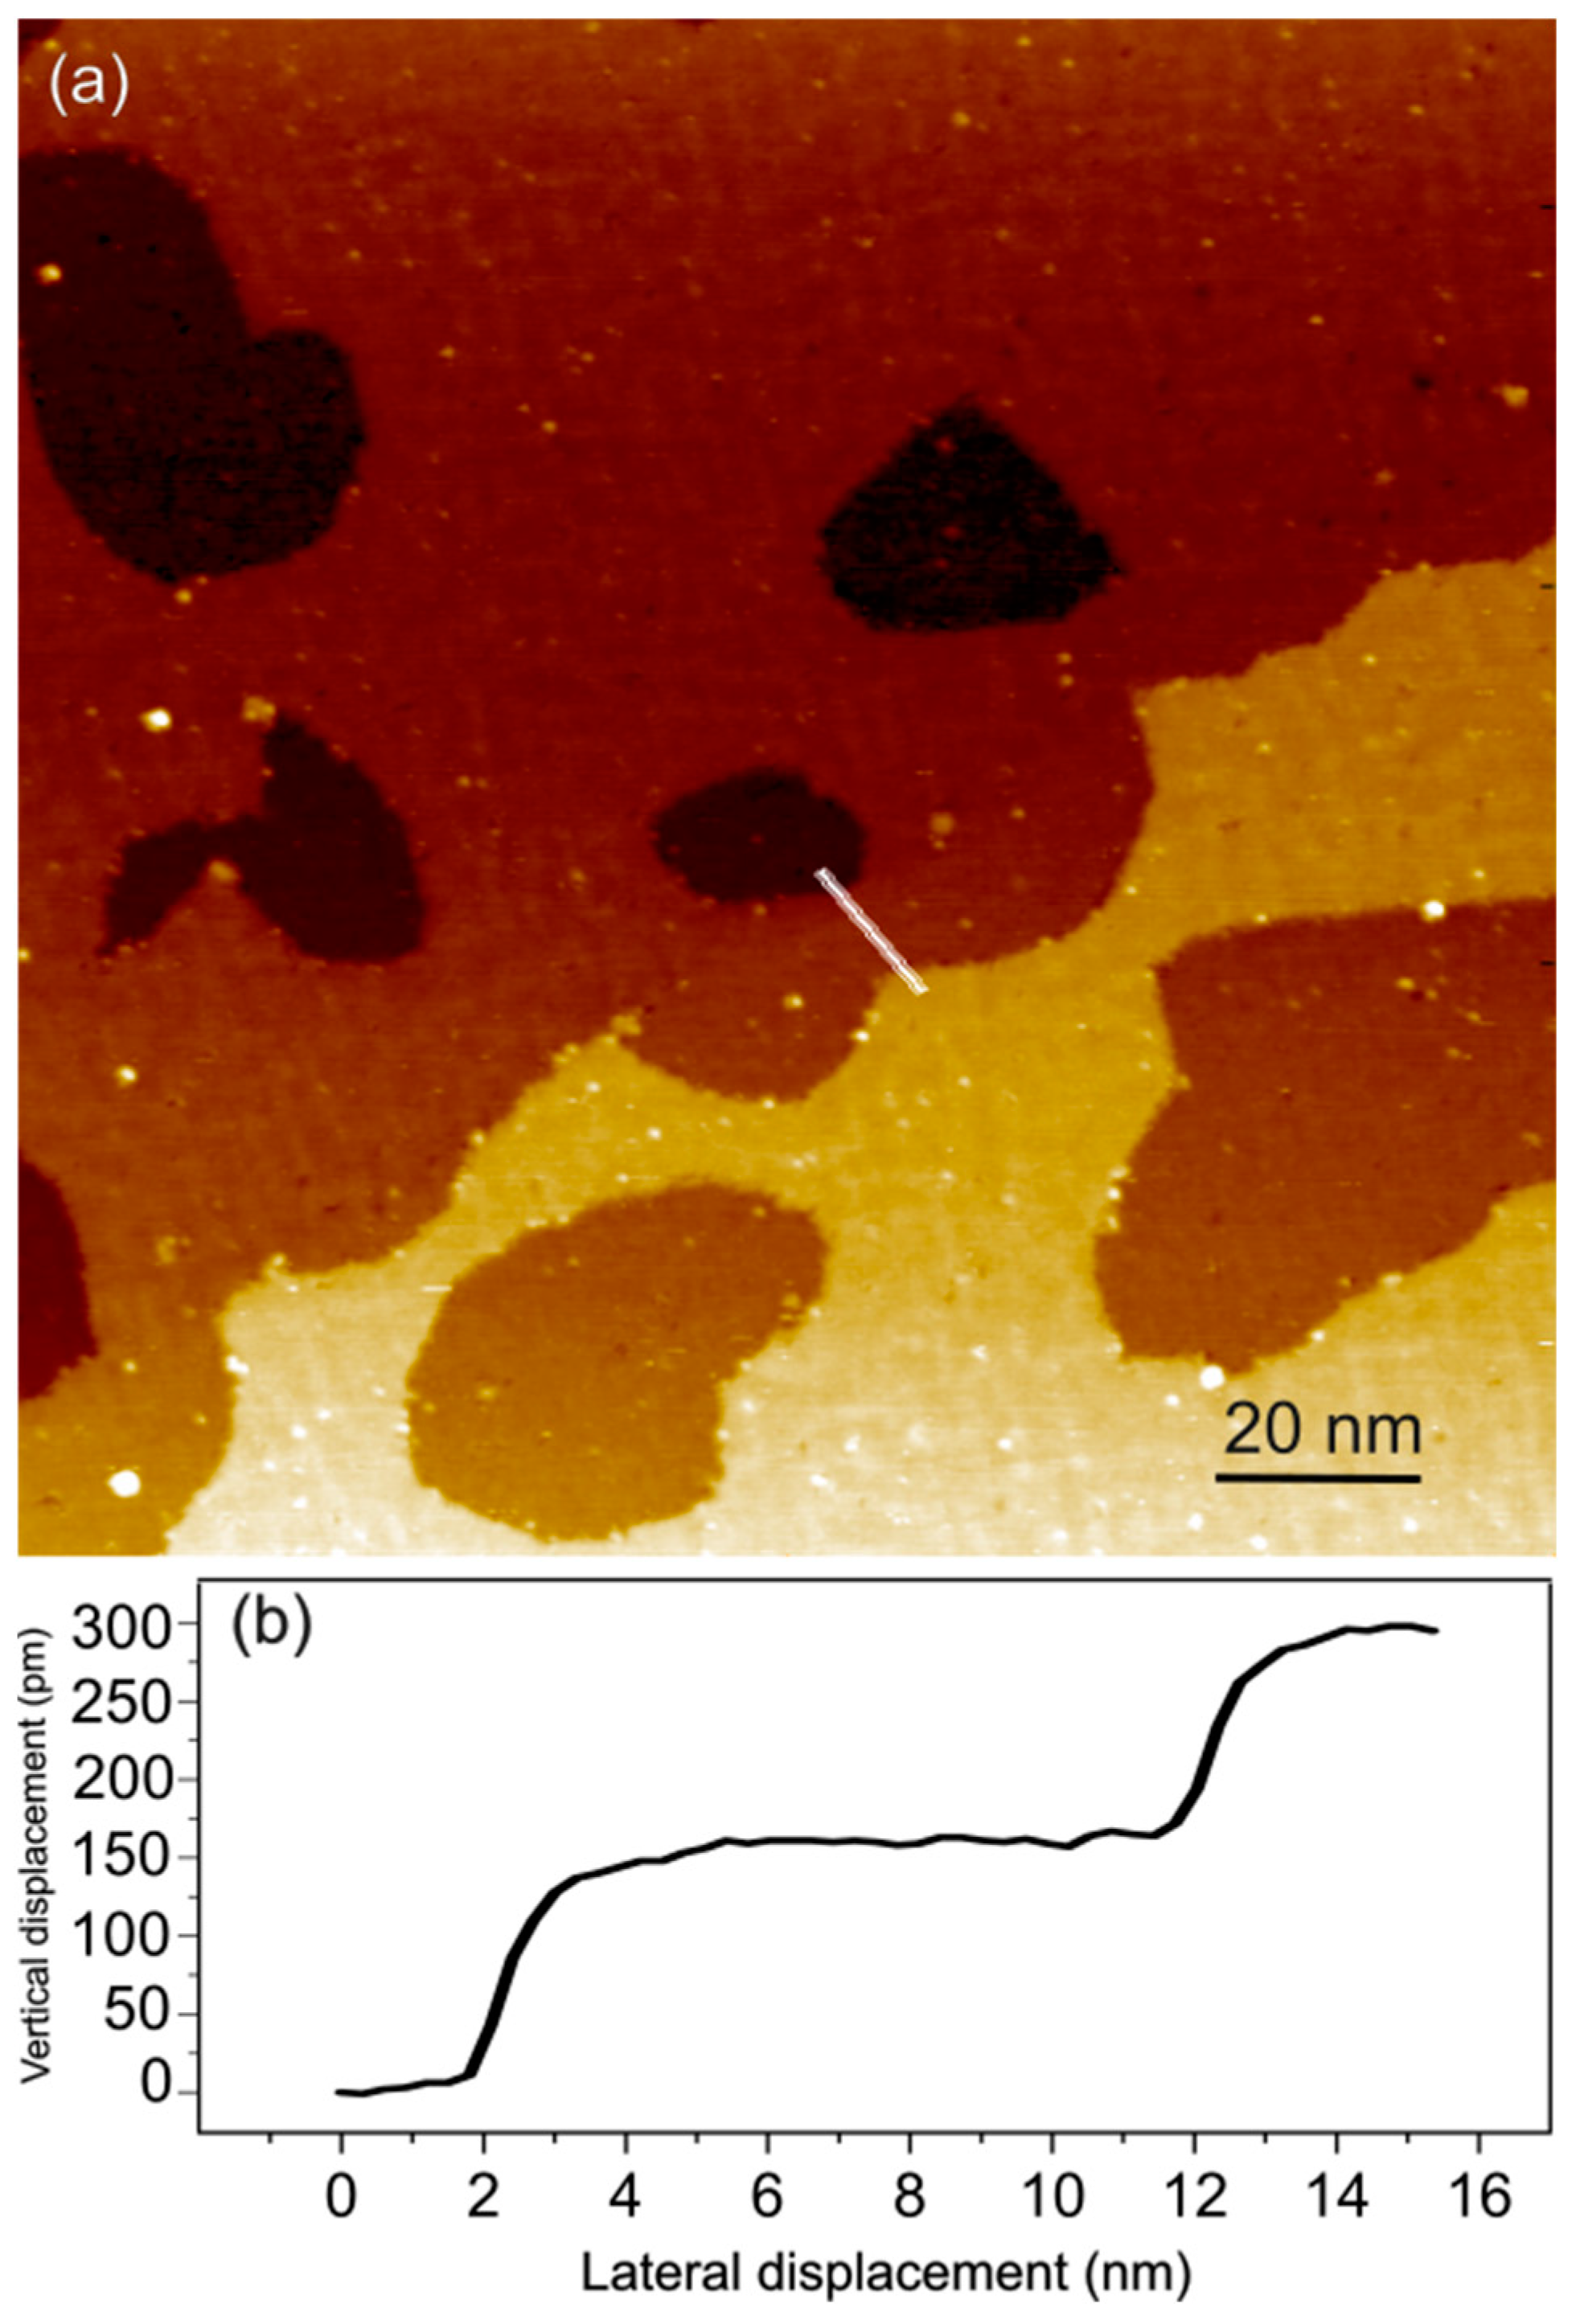
Figure 2 illustrates the surface morphology of the 5 ML Ni(001)-p(1x1)O sample. Figure 2a reveals large, atomically flat terraces separated by well-defined monoatomic steps. The topographic profile measured along the white line in Figure 2a is shown in Figure 2b, indicating a step height of approximately 140 pm. This value aligns with the expected step height for a pseudomorphic BCC Ni structure on Fe(001), confirming its structural compatibility with the substrate. In contrast, if Ni had adopted an FCC structure, the expected step height would be around 175 pm, significantly larger than the observed value, further supporting the stabilization of the metastable BCC phase.
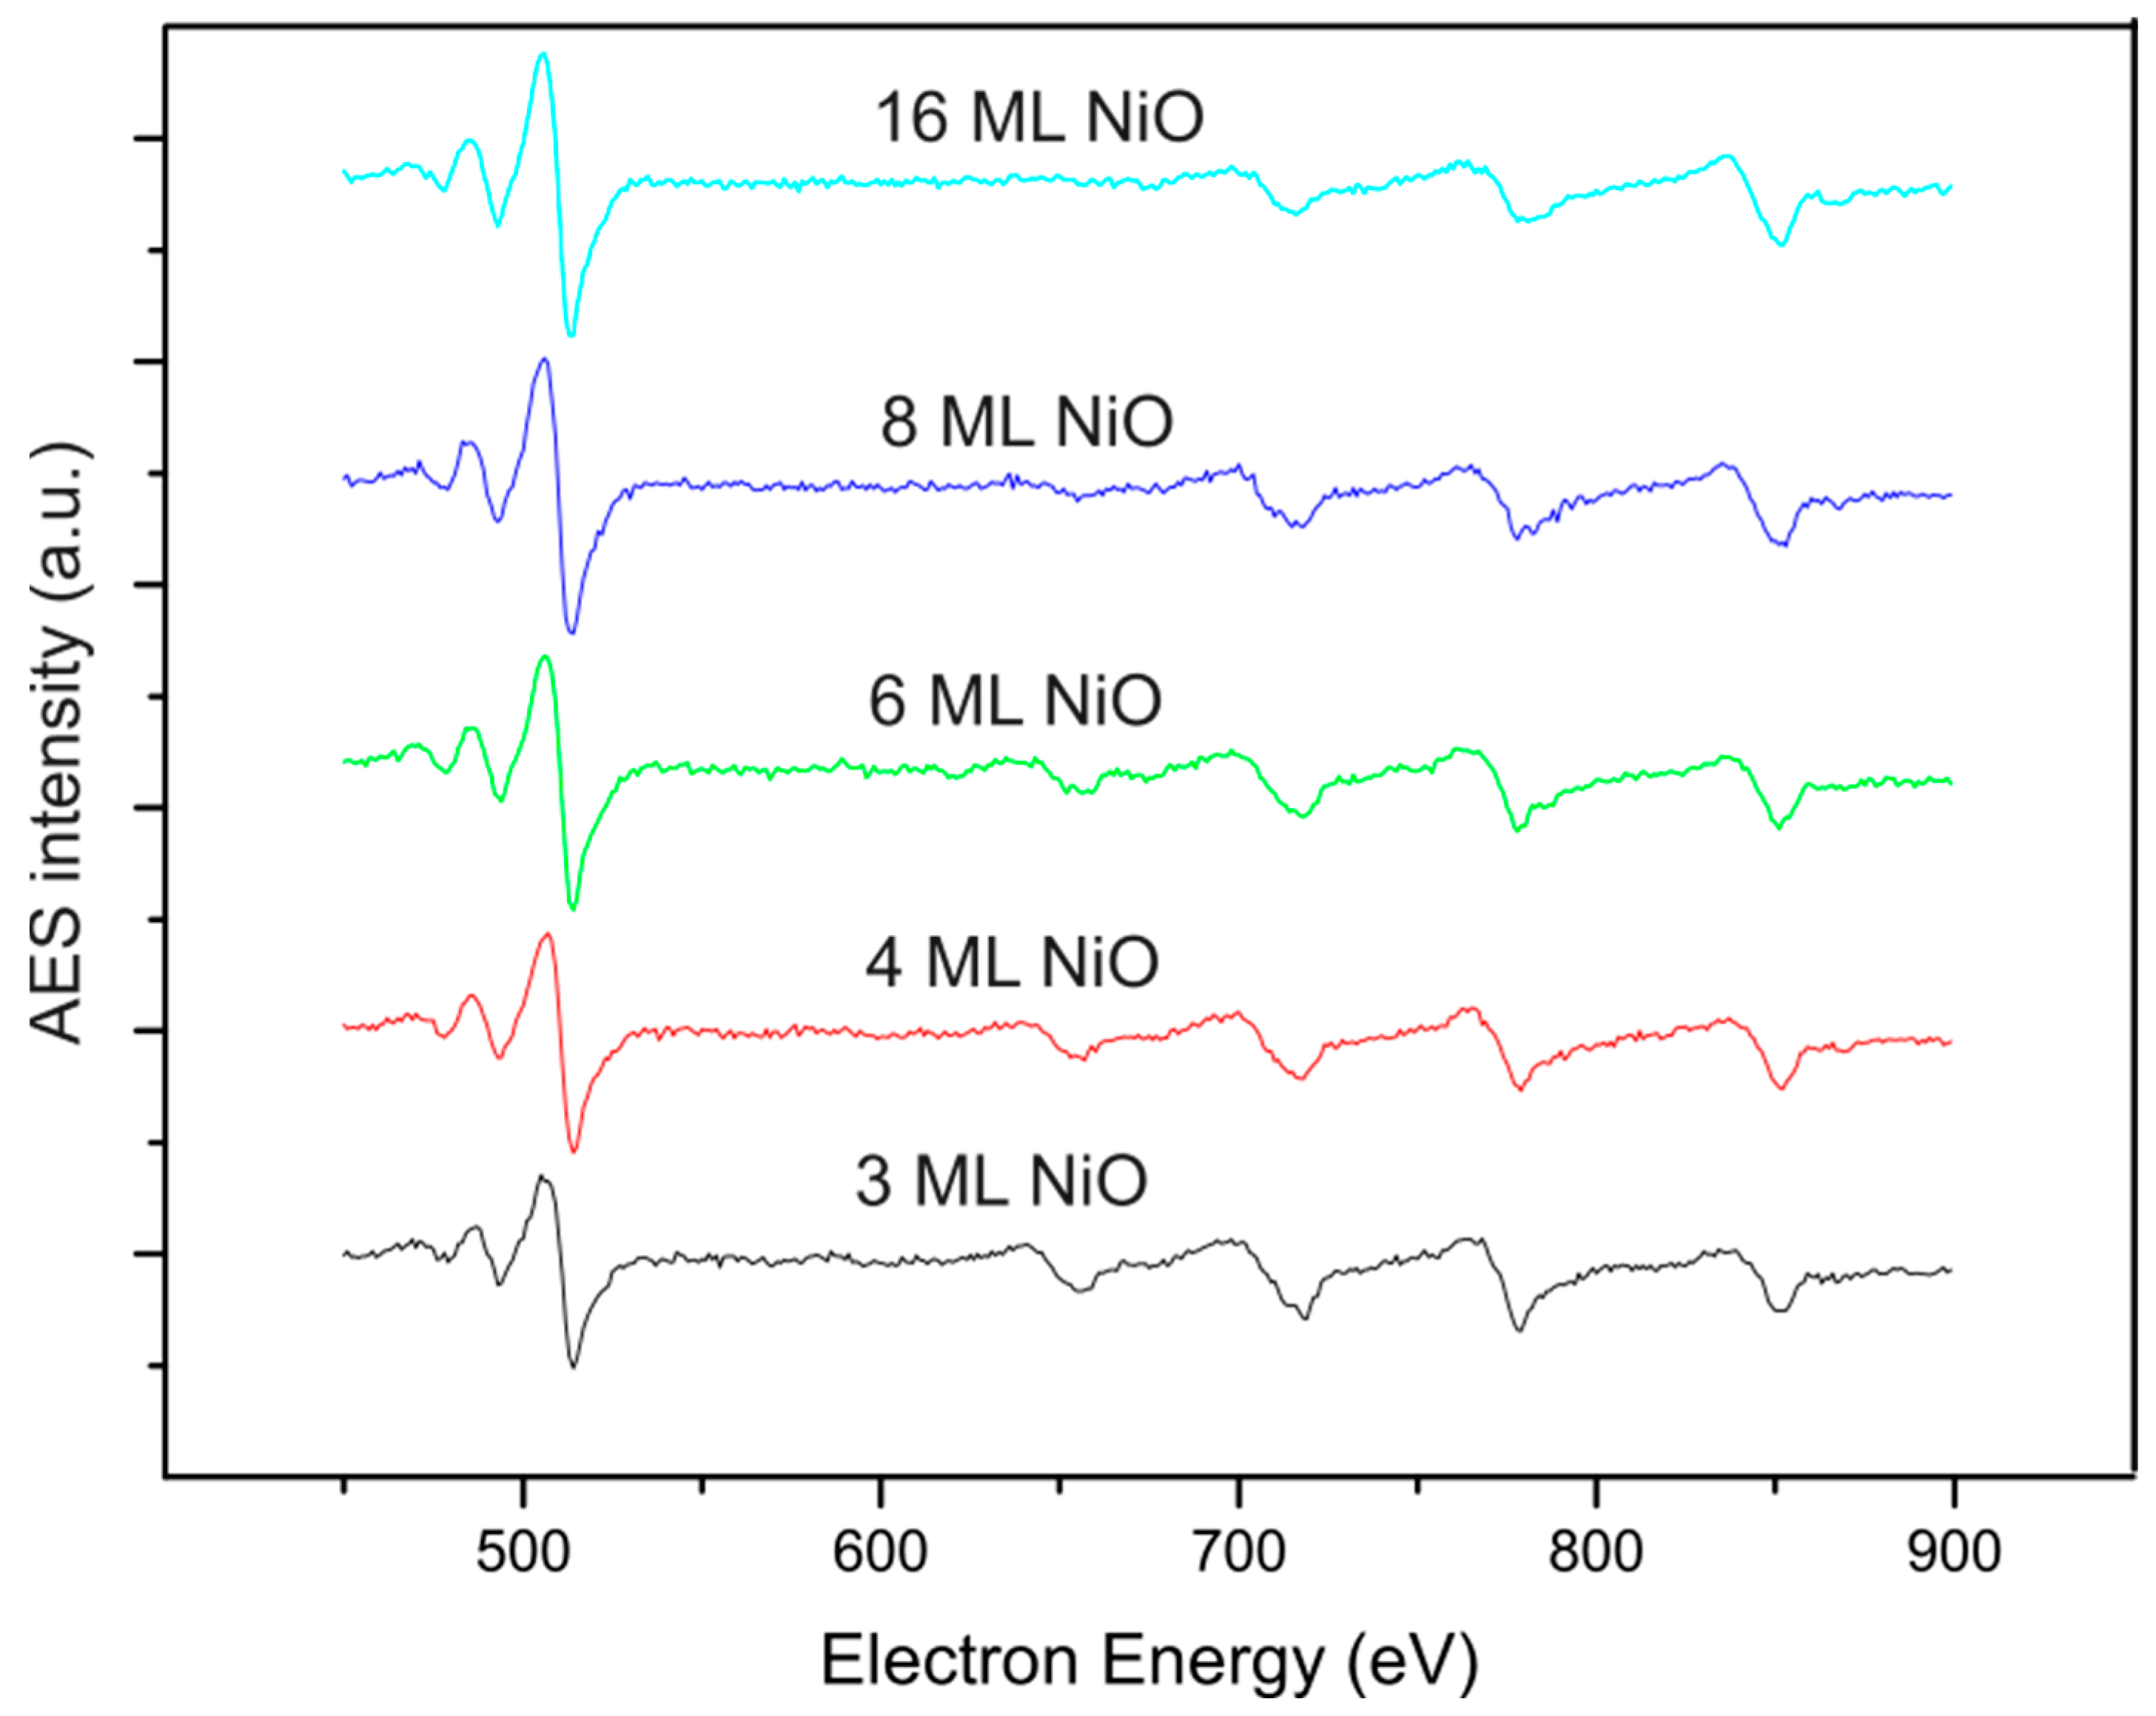
Figure 3 illustrates the evolution of AES spectra, recorded after incremental depositions of NiO, in the O KLL and Ni LMM spectral regions. For NiO thicknesses between 3 and 8 ML, the peak attributed to the underlying cobalt film remains visible at approximately 660 eV, while at a NiO thickness of 16 ML, only the LMM Ni peaks are present. Table 1 presents the ratios between the intensities of the O KLL peak and the Ni LMM peak at 850 eV ( I O / I N i ) as a function of NiO thickness, which can be used for the estimation of the stoichiometry of the NiO film. The average value of I O / I N i is 3.26, with a standard deviation of 0.11. We can extract the relative concentration of Ni ( C N i ) and O ( C O ) from these data by using the following formula [48]:
C N i = I N i S N i I N i S N i + I O S O
where S N i ( S O ) is the sensitivity factor of the Ni (O). By considering S N i = 0.2 and S O = 0.5 , we obtain C N i = 0.43 and C O = 0.57 . These concentrations slightly deviate from those expected for a perfectly stoichiometric NiO film, revealing an excess of oxygen relative to Ni. This excess oxygen may result from molecular oxygen adsorbed on the surface during the deposition of NiO, as reported by Valeri in the case of CoO grown on BCC Co [49]. However, another possibility is that surface defects, such as steps and dislocations observed in the STM images below, induce an imbalance between cations and anions, promoting Ni-deficient configurations. This interpretation is further supported by the observation of p-type doping in the films, as reported below.
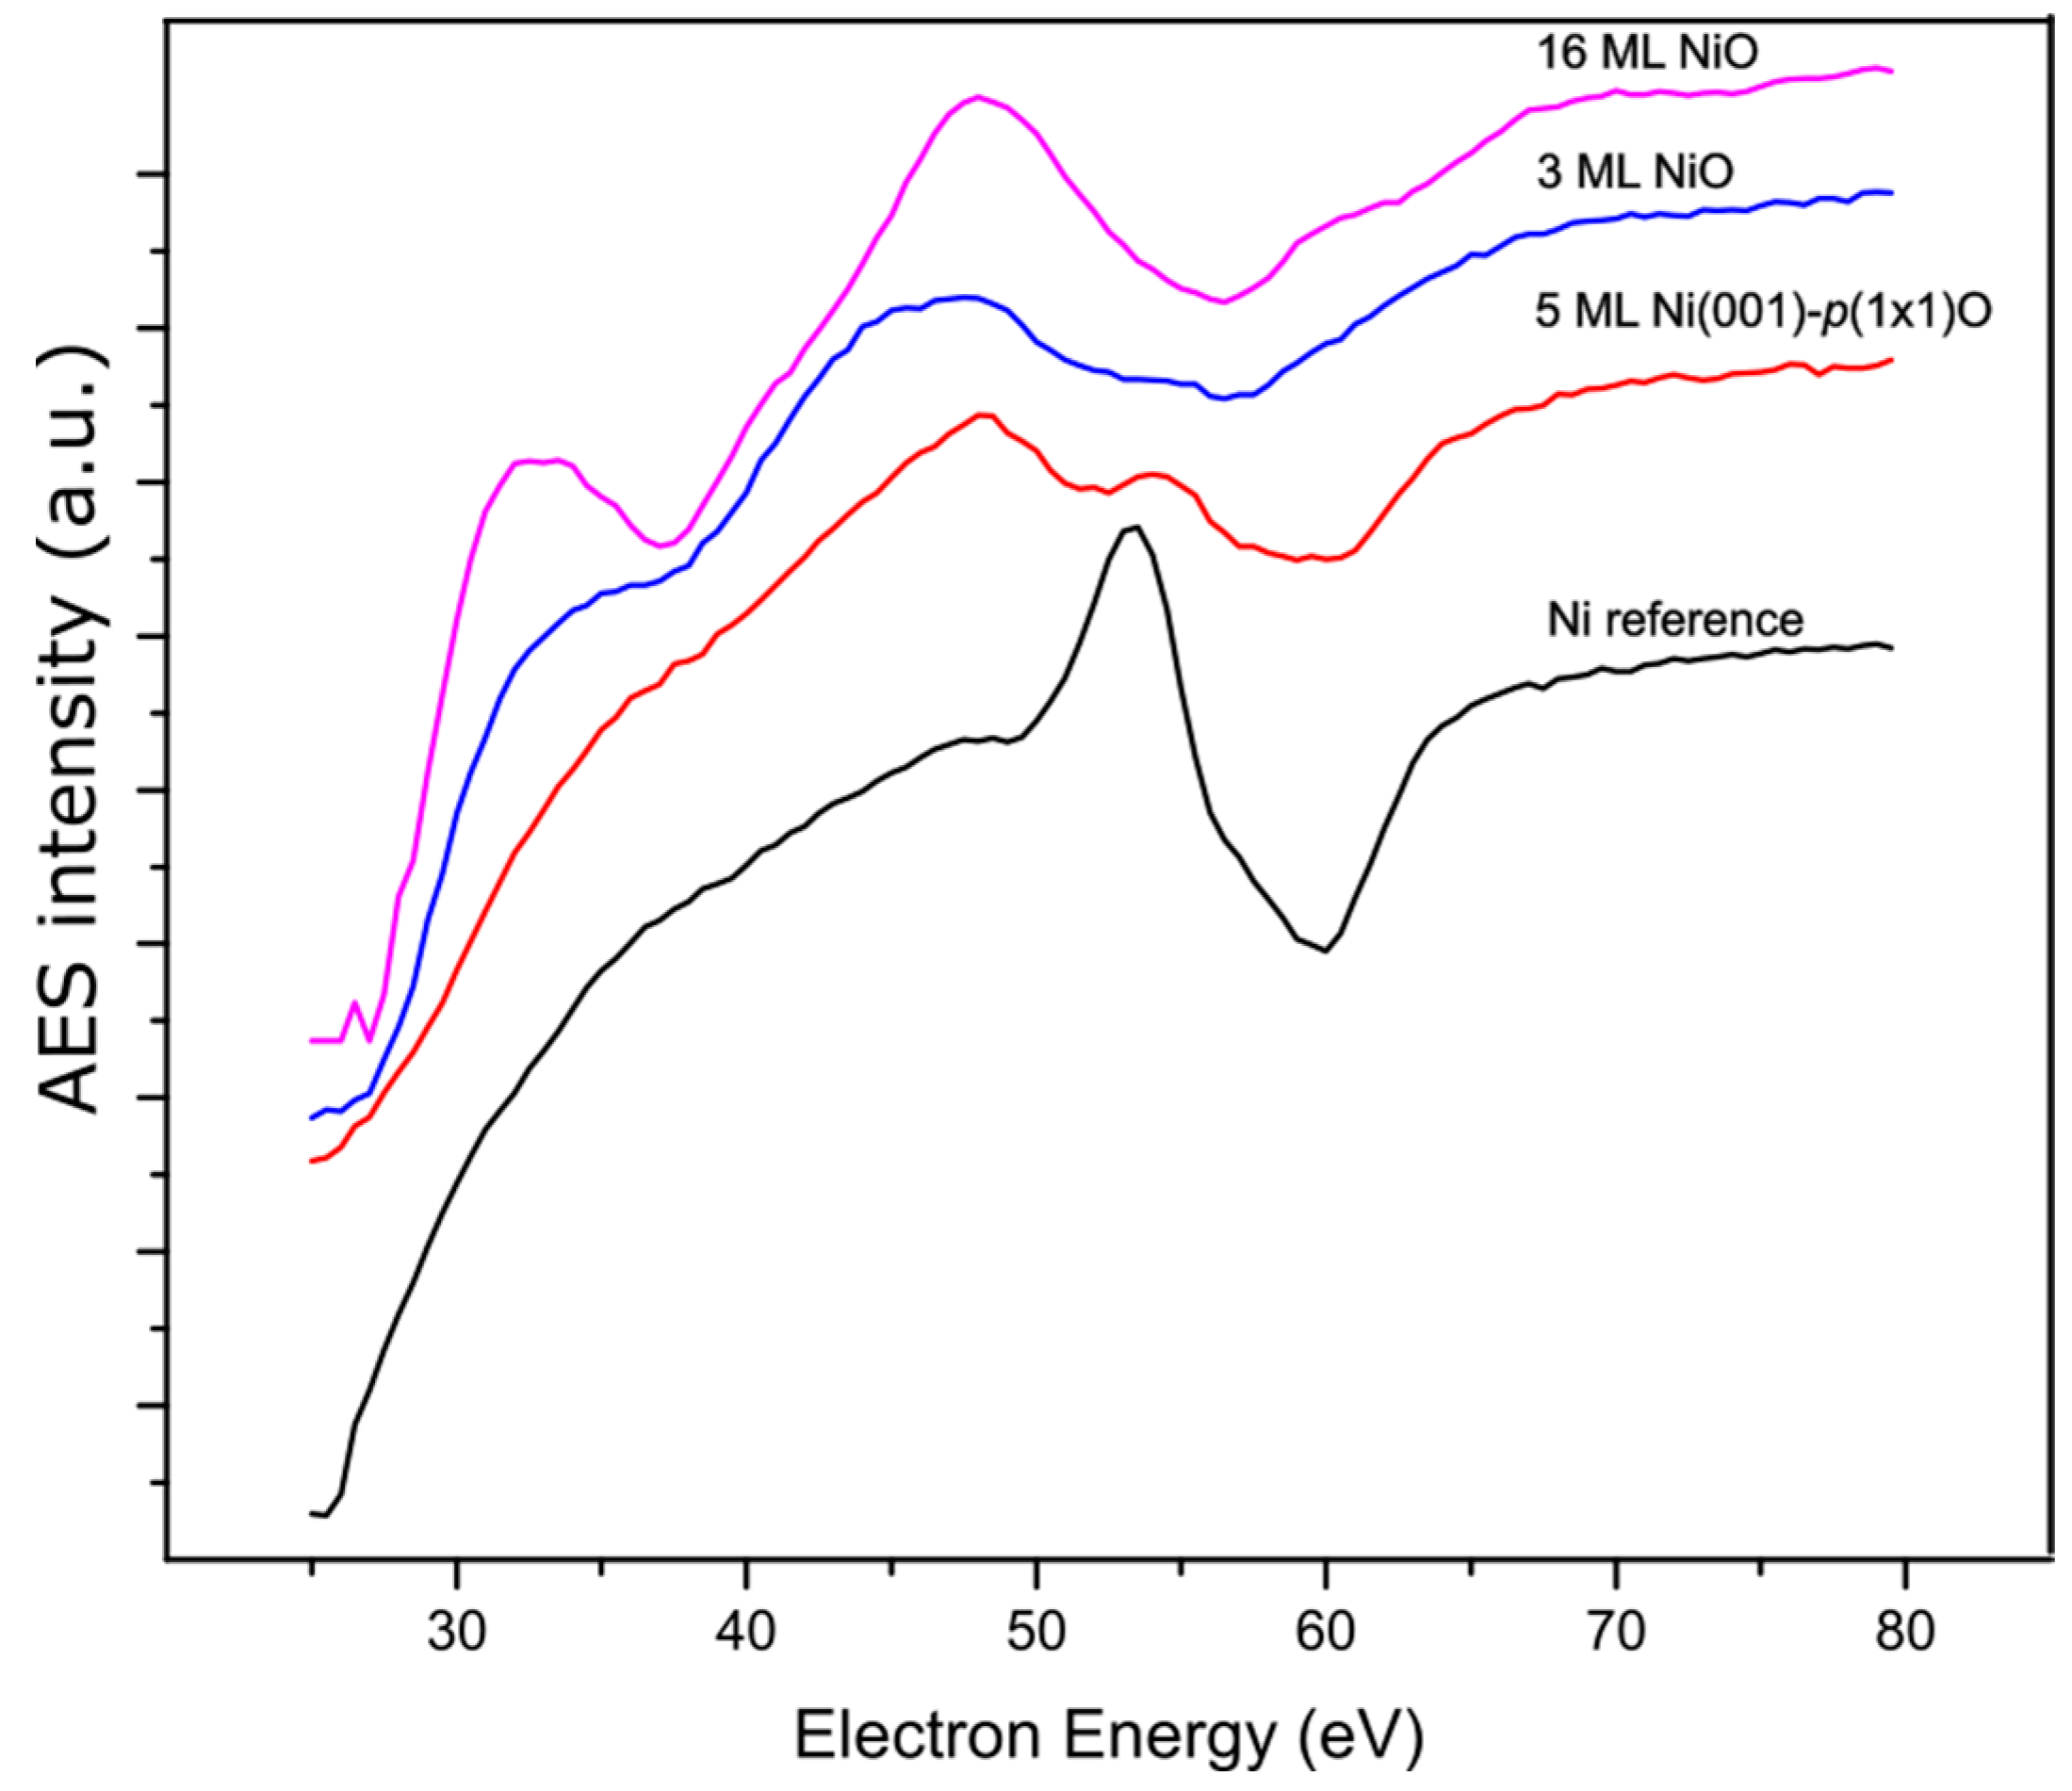
Figure 4 presents the AES spectra measured at low energy in the Ni MVV spectral region. A single feature with a maximum at approximately 53 eV and a minimum at 61 eV characterizes the spectrum acquired on a reference metallic Ni sample (black). The spectrum obtained from a 5 ML Ni(001)-p(1x1)O film (red) reveals the superposition of two features: the metallic Ni signal and a second feature attributed to NiO, which appears at lower energies. The NiO-related peak has a maximum at around 47 eV, while its minimum is not discernible, because of the partial overlap with the maximum of the metallic Ni. This spectrum indicates that the Ni(001)-p(1x1)O surface already exhibits the chemical characteristics of a single NiO layer. After depositing 3 ML of NiO, the metallic feature is suppressed, while the oxide feature becomes clearly distinguishable. Finally, in the sample covered with 16 ML of NiO, only the oxidized Ni peak remains, with a maximum at 47 eV and a minimum at approximately 58 eV.
Figure 5a displays the LEED pattern acquired on the 3 ML NiO, where intense spots arranged in a square lattice are visible, indicating that the (001) surface is exposed. Figure 5b presents a topographic image of the 3 ML NiO surface, characterized by atomically flat terraces, with nanometer-sized islands scattered across them. Figure 5c provides a magnified view of the surface, revealing a single-layer NiO island approximately 200 pm in height, as measured by the topographic profile displayed in Figure 5d.
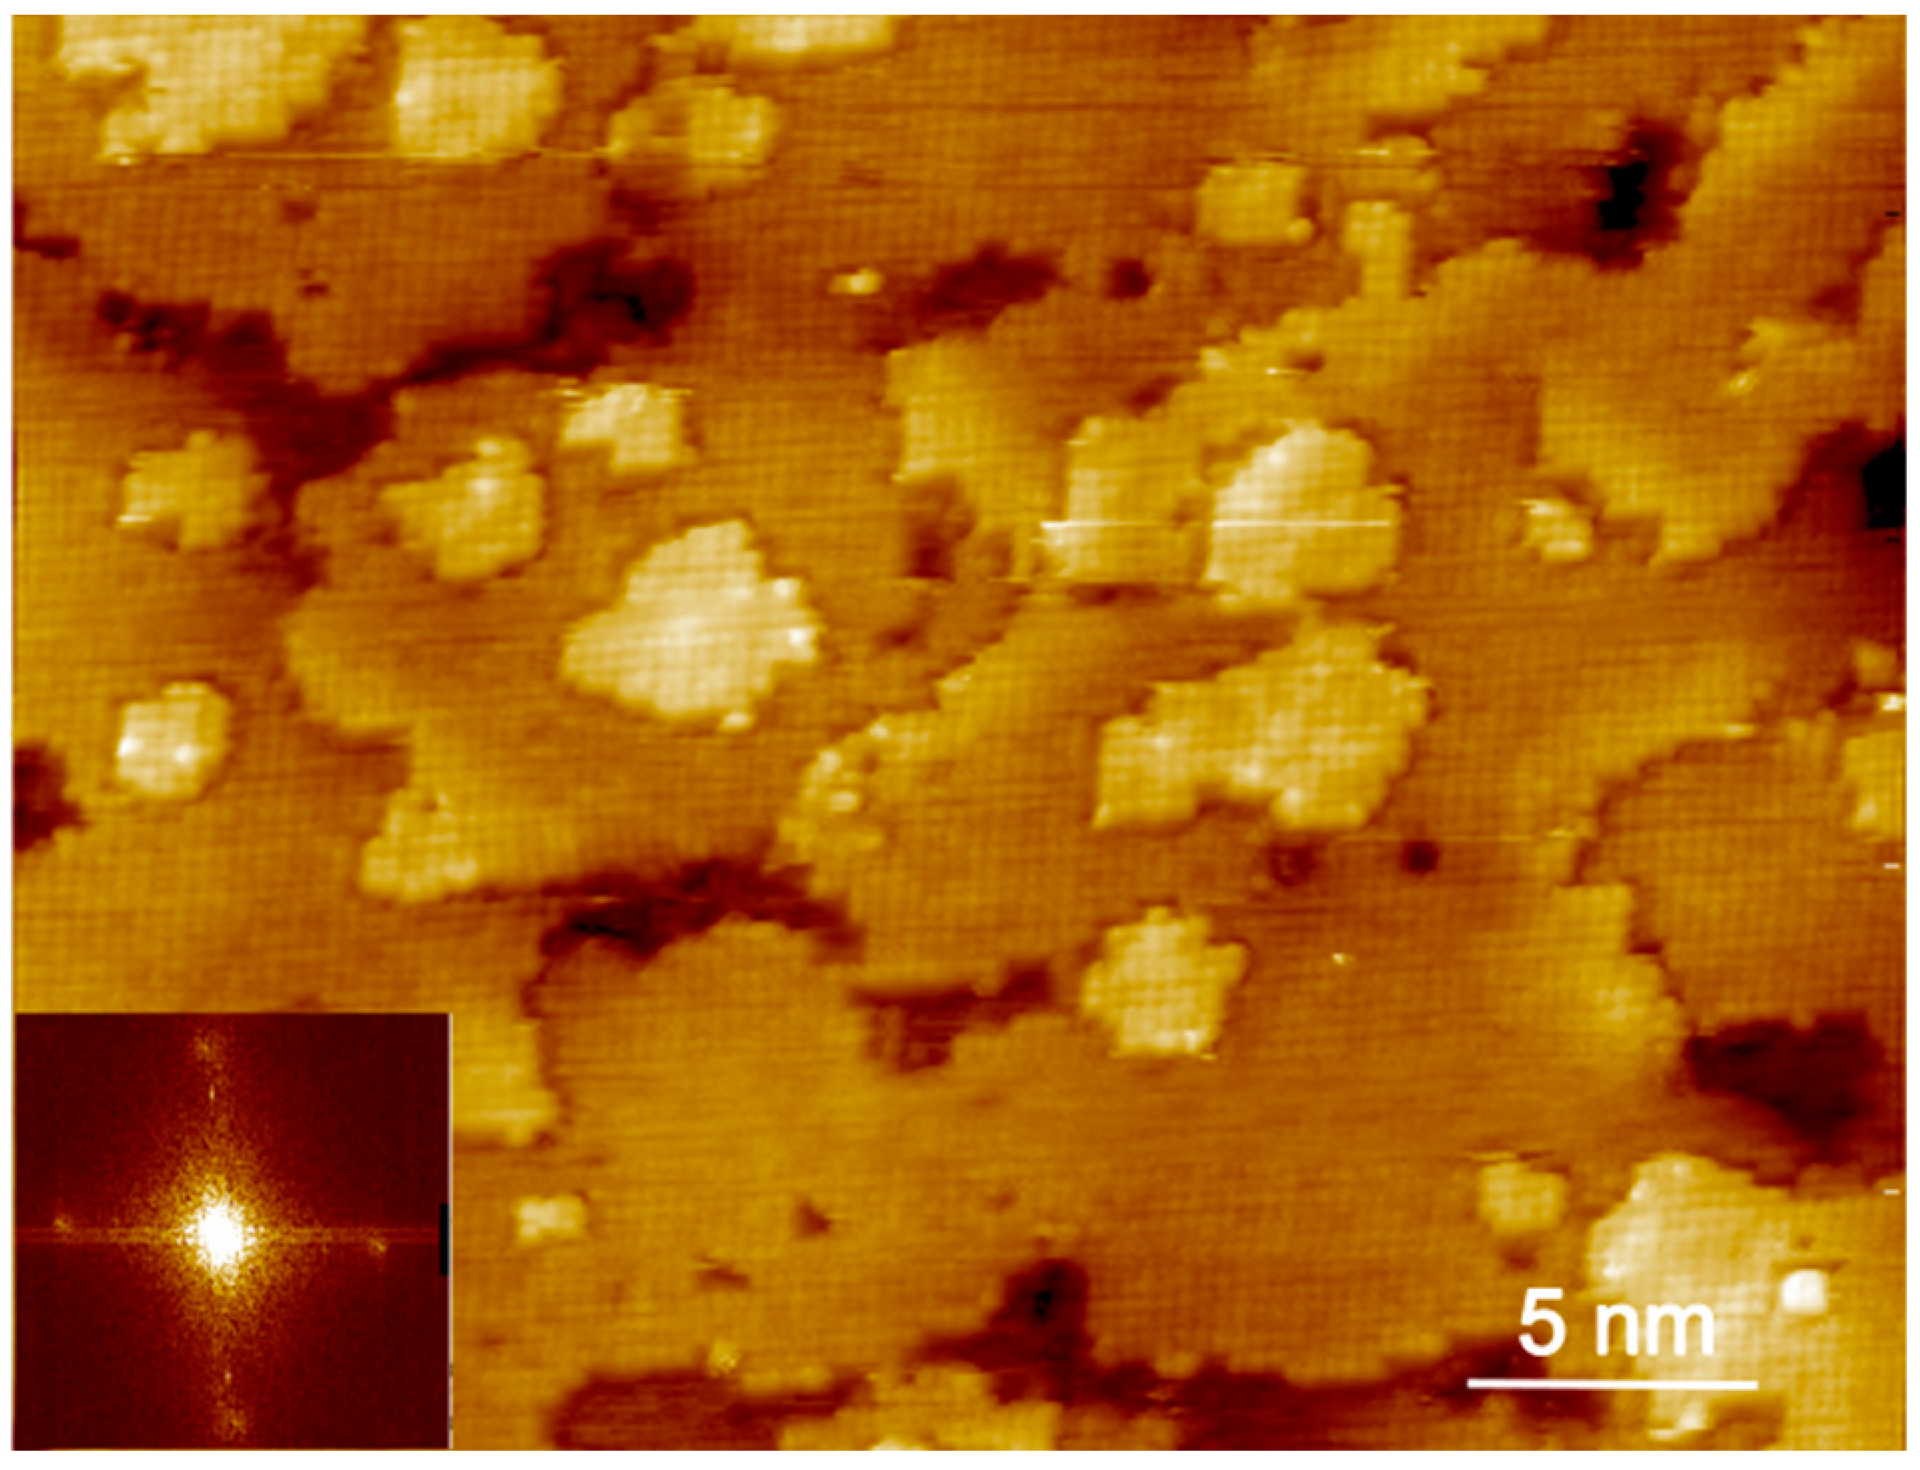
Figure 6 presents an atomically resolved image acquired on the 3 ML NiO surface, where a square atomic lattice is clearly visible. The inset of Figure 6 shows the corresponding Fourier transform of the STM image, revealing the first-order diffraction spots. Such measurements are in agreement with the LEED pattern shown in Figure 5, confirming that the NiO film is crystalline and exposes the (001) face.
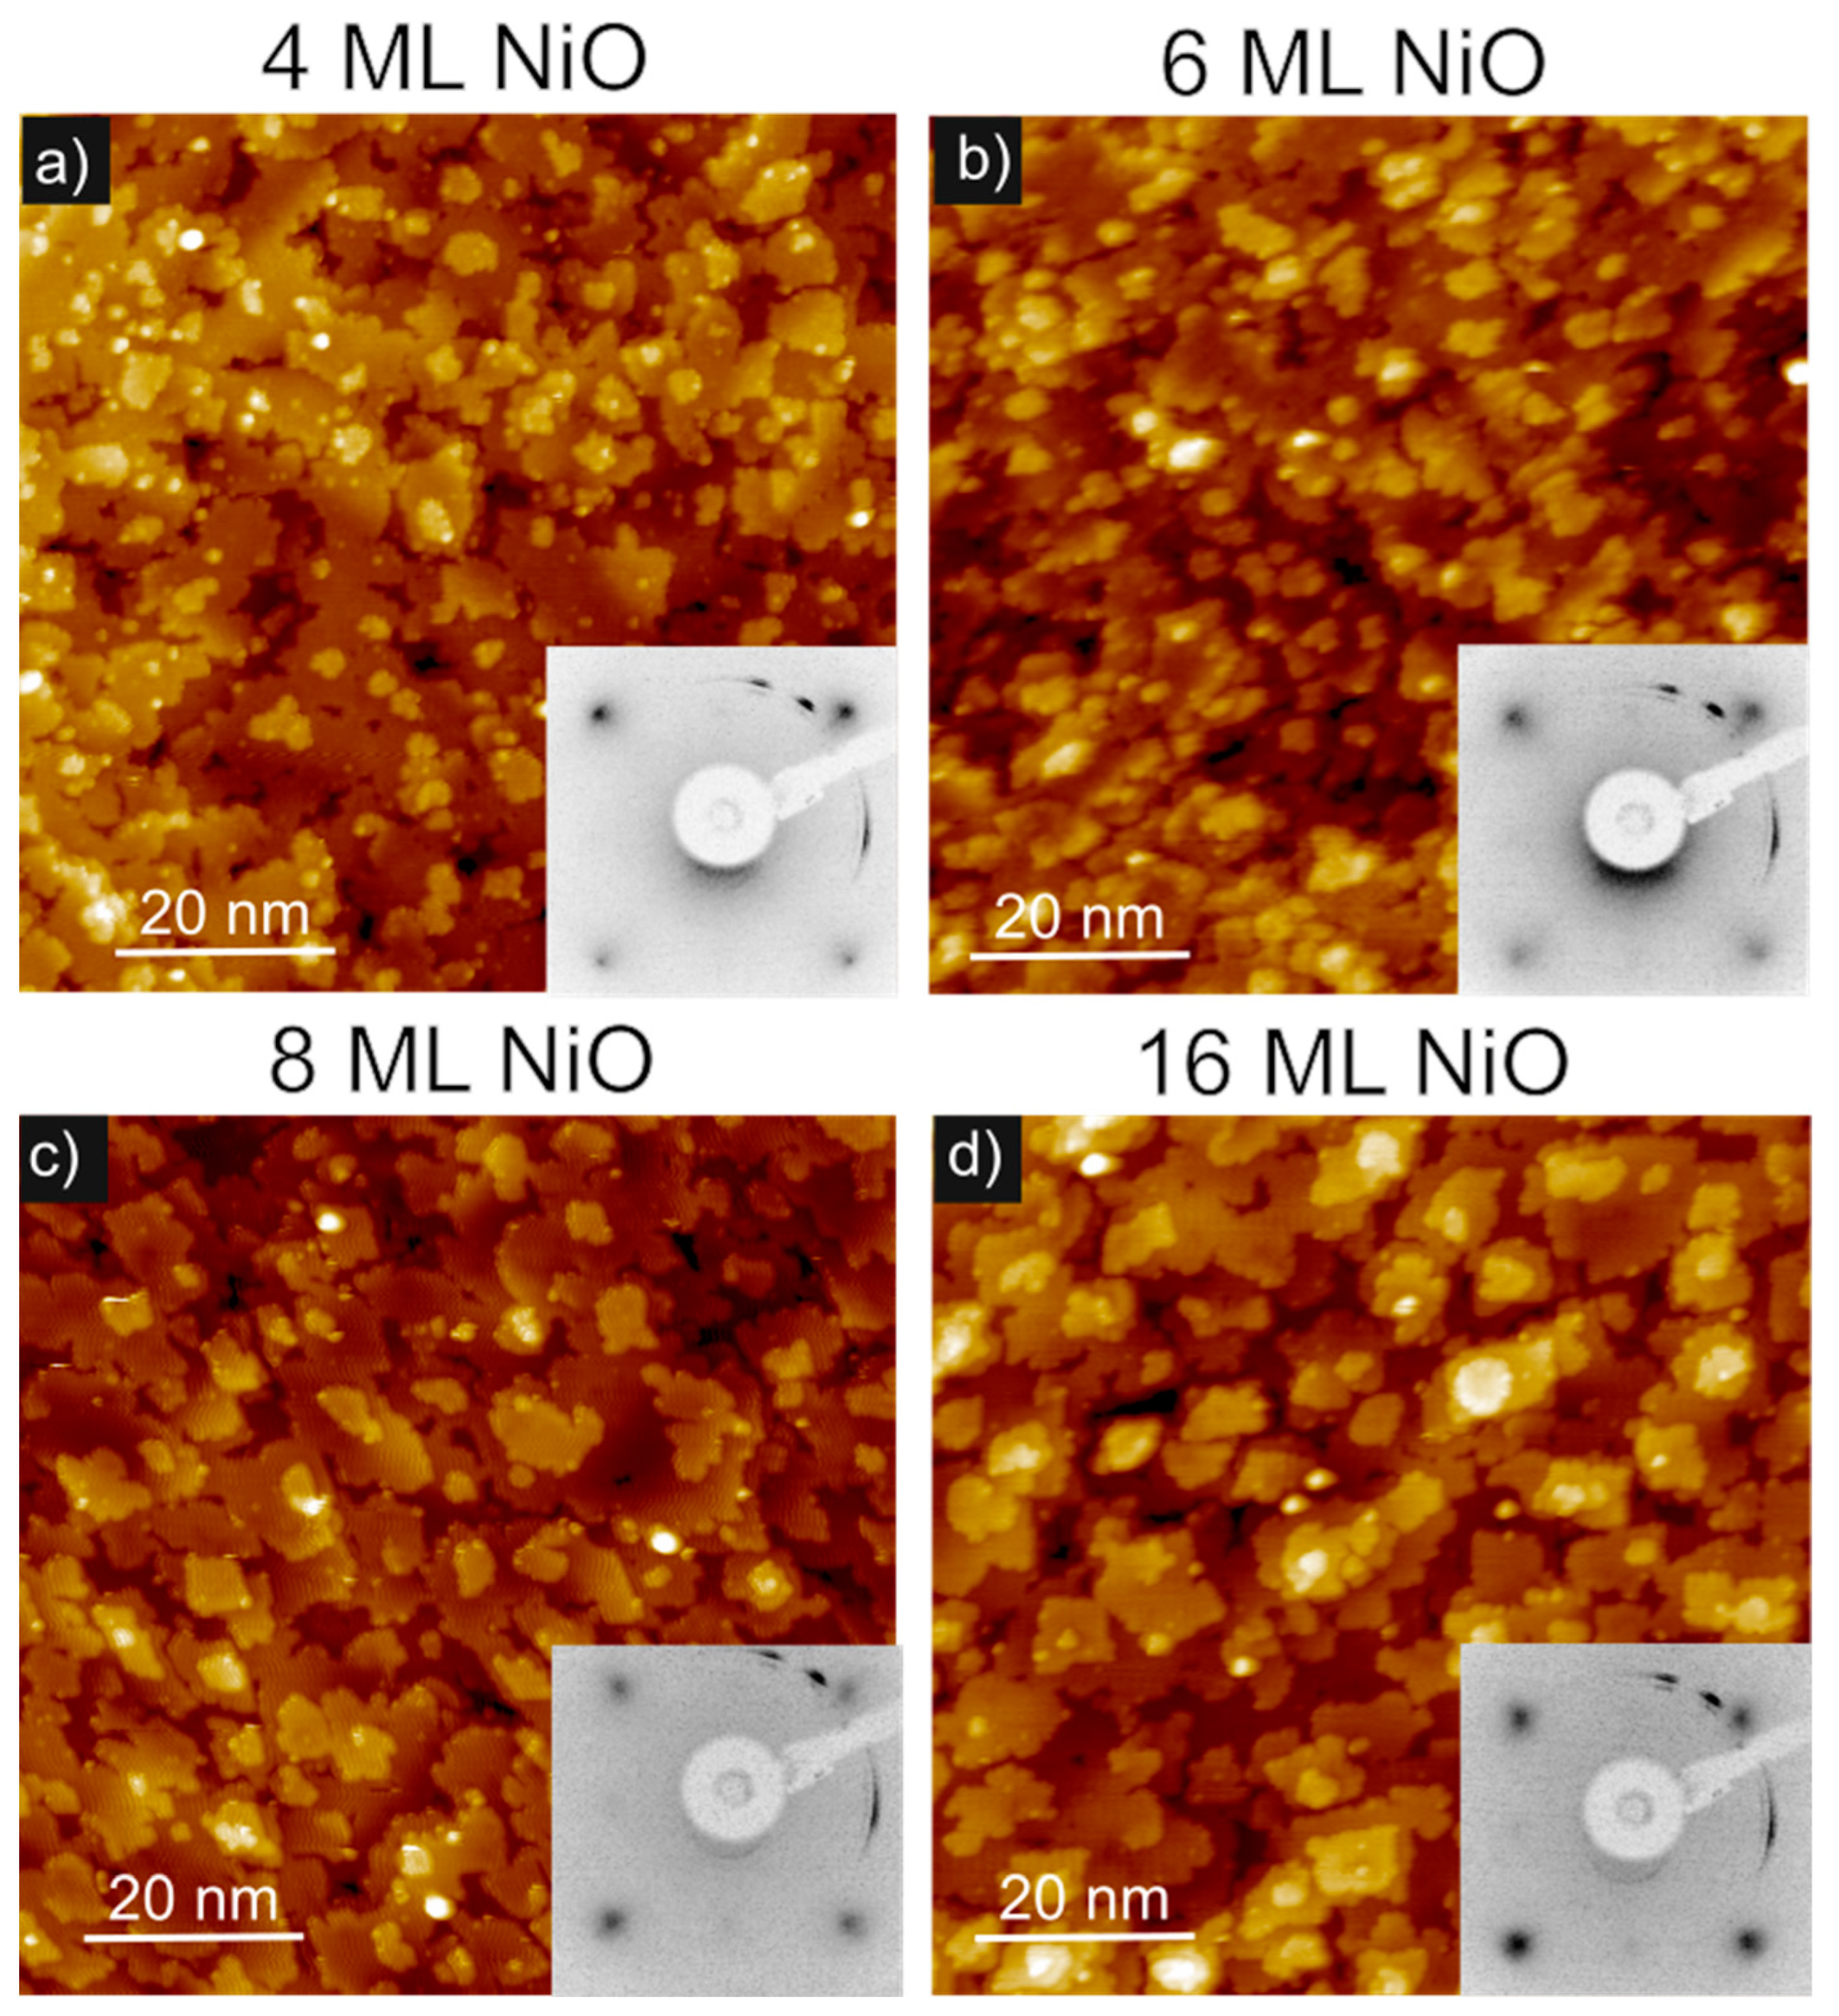
Figure 7 displays a series of STM images acquired for NiO thicknesses of 4 ML (Figure 7a), 6 ML (Figure 7b), 8 ML (Figure 7c), and 16 ML (Figure 7d). Each sample exhibits a morphology characterized by terraces covered by NiO islands 1 ML high. At a thickness of 16 ML, the morphology evolves into a “wedding-cake” shape, which is generally attributed to the three-dimensional growth of the film due to kinetic limitations in mass transport [42]. The LEED patterns shown in the insets of each panel confirm that the samples are crystalline and reveal the square lattice of the NiO(001) surface. To quantify the topographical features of the surface, we extracted from the STM images the Root Mean Square Roughness (RMS), defined as the square root of the mean of the squared deviations of surface heights from the mean plane. The results, summarized in Table 2, show that the RMS roughness remains nearly constant at about 0.14 nm up to a thickness of 8 ML, slightly increasing to 0.17 nm at 16 ML.
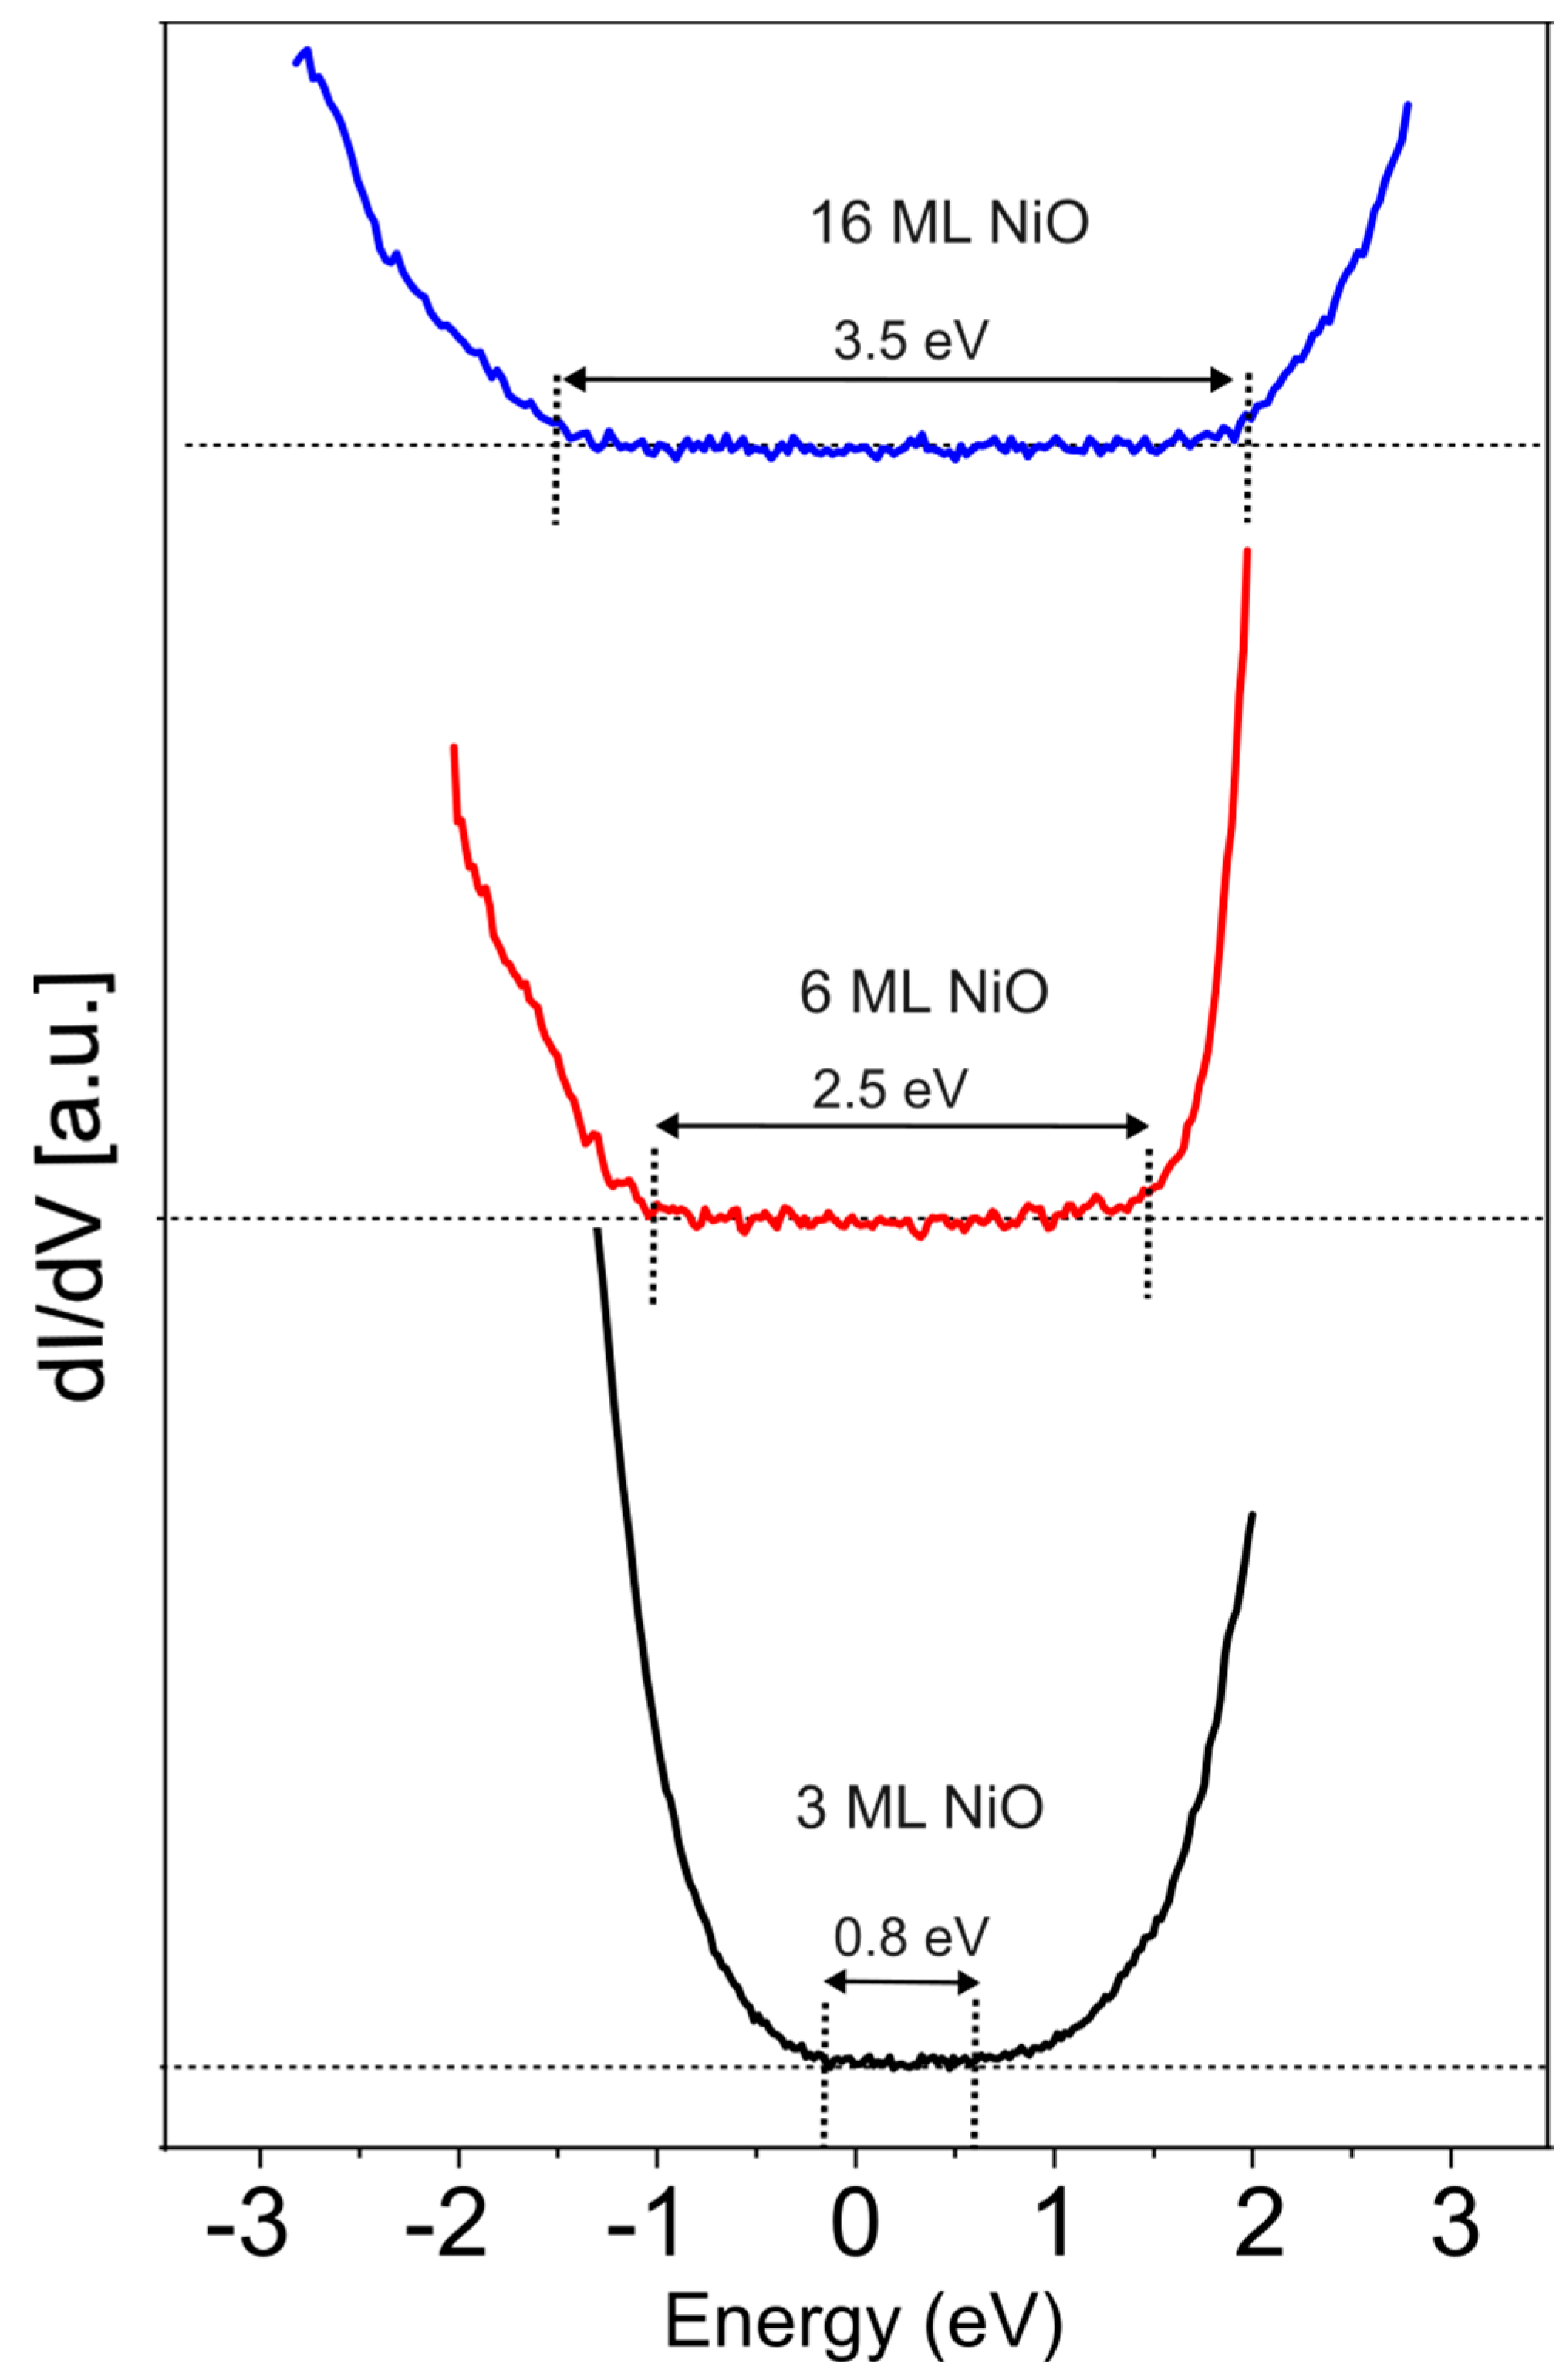
Figure 8 shows the differential conductance spectra dI/dV acquired for different NiO thicknesses. Each of these curves was obtained by averaging several spectra collected at the center of the NiO terraces. In these curves, which are proportional to the local density of states (LDOS) of the surface, the zero energy corresponds to the Fermi level of NiO, while the positive (negative) energies indicate the empty (occupied) electronic states of the NiO surface. At a thickness of 3 ML (black curve), the LDOS is flat within a 0.8 eV range around the Fermi level, indicating the presence of an electronic band gap. This band gap increases with the film thickness, reaching 2.5 eV for 6 ML (red curve) and 3.6 eV for 16 ML (blue curve). Table 3 reports the band gap values for the film thicknesses considered in this study, along with the valence and conduction band edges. Notably, the band gap width can be tuned by adjusting the film thickness. Furthermore, the center of the band gap does not align with the Fermi level but is instead positioned closer to the conduction band by about 0.2 eV, indicating that all the films exhibit p-type doping. The observation of a naturally p-doped NiO film aligns with the general trend reported in the scientific literature [50]. Furthermore, it corresponds to the Ni deficiency identified through AES measurements. The measurements reported in Table 1 show that the Ni deficiency remains approximately constant across the considered thicknesses, in agreement with the fact that the band gap offset is also constant. The dependence of the band gap on thickness deserves a more in-depth discussion. The band gap width can be influenced by several factors, including strain [51], quantum size effects [52], and image charge screening [53]. In the present case, the observed increase in band gap with thickness suggests that image charge screening plays a dominant role. Specifically, at the interface between an insulator and a metal, image charge screening induced by the polarizability of the metallic substrate tends to reduce the band gap of the insulator. Therefore, increasing the thickness of the oxide film is expected to suppress this effect, allowing the band gap to approach its bulk value.

4. Conclusions

In this study, we have successfully stabilized high-quality epitaxial NiO films with thicknesses ranging from 1 ML to 16 ML on a metastable BCC Ni(001)-p(1x1)O surface. The analysis of LEED patterns confirms that the NiO films adopt a well-ordered crystalline structure, growing with the (001) surface exposed. To further investigate the chemical composition of the oxide, we performed AES measurements, which reveals a slight excess of oxygen compared to the nominal stoichiometry. This subtle deviation suggests the presence of oxygen-rich conditions during growth, which may influence the electronic and magnetic properties of the material. Interestingly, STS measurements indicate that the electronic band gap of NiO varies as a function of film thickness. This observation suggests a potential route for tuning the electronic properties of the system by carefully adjusting the thickness of the oxide layer. Such tunability is particularly relevant for applications in oxide electronics, spintronics, and correlated electron systems. The epitaxial NiO films synthesized in this work provide an excellent platform for exploring the fundamental properties of ferromagnet/antiferromagnet interfaces. Their well-defined crystallinity and controllable electronic characteristics make them ideal candidates for investigating interfacial magnetic coupling, exchange bias effects, and other emergent phenomena in thin-film heterostructures. Future studies may focus on probing the spin dynamics and magnetic ordering at these interfaces, further expanding the potential technological applications of these systems. To enable scalability toward industrial applications, the deposition rate of NiO films on Fe(001) may be enhanced, or alternatively, the process could be transitioned to a more accessible and industry-compatible technique such as sputtering.

Author Contributions

Methodology, A.P.; Formal analysis, A.P.; Writing—original draft, A.P.; Writing—review & editing, F.C., L.D. and A.B.; Supervision, A.B.; Funding acquisition, F.C. All authors have read and agreed to the published version of the manuscript.

Funding

This research received no external funding.

Institutional Review Board Statement

Not applicable.

Informed Consent Statement

Not applicable.

Data Availability Statement

The raw data supporting the conclusions of this article will be made available by the authors on request.

Conflicts of Interest

The authors declare no conflict of interest.

References

  1. Henrich, V.E.; Cox, P.A. The Surface Science of Metal Oxides; Cambridge University Press: Cambridge, UK, 1994. [Google Scholar]
  2. Jayaraj, M.K. Nanostructured Metal Oxides and Devices; Springer: Cham, Switzerland, 2020. [Google Scholar]
  3. Siedliska, K. Metal Oxides: Crystal Structure, Synthesis and Characterization. Crystals 2024, 14, 991. [Google Scholar] [CrossRef]
  4. Bu, Z.; Xue, Y.; Chen, J.; Zhang, L.; Li, J.; Wang, L.; Wang, X.; Wang, Z.; Liu, Y.; Li, Y. Exploring the Crystal Structure and Electronic Properties of γ-Al2O3: Machine Learning Drives Future Material Innovations. ACS Appl. Mater. Interfaces 2024, 16, 60458–60471. [Google Scholar] [CrossRef] [PubMed]
  5. Jbara, A.S.; Othaman, Z.; Aliabad, H.A.R.; Saeed, M.A. Electronic and Optical Properties of γ- and θ-Alumina by First Principle Calculations. Adv. Sci. Eng. Med. 2017, 9, 287–293. [Google Scholar] [CrossRef]
  6. Hoat, D.M.; Van On, V.; Nguyen, D.K.; Naseri, M.; Ponce-Pérez, R.; Vu, T.V.; Rivas-Silva, J.F.; Hieu, N.N.; Cocoletzi, G.H. Structural, Electronic, and Optical Properties of Pristine and Functionalized MgO Monolayers: A First Principles Study. RSC Adv. 2020, 10, 40411–40420. [Google Scholar] [CrossRef]
  7. Schönberger, U.; Aryasetiawan, F. Bulk and Surface Electronic Structures of MgO. Phys. Rev. B 1995, 52, 8788–8793. [Google Scholar] [CrossRef]
  8. Park, M.; Chung, S.B. Effects of Homogeneous Doping on Electron–Phonon Coupling in SrTiO3. Nanomaterials 2025, 15, 137. [Google Scholar] [CrossRef]
  9. Gastiasoro, M.N.; Ruhman, J.; Fernandes, R.M. Superconductivity in dilute SrTiO3: A review. Ann. Phys. 2020, 417, 168107. [Google Scholar] [CrossRef]
  10. Namsar, O.; Watcharapasorn, A.; Jiansirisomboon, S. Structure–property relations of ferroelectric BaTiO3 ceramics containing nano-sized Si3N4 particulates. Ceram. Int. 2012, 38, S95–S99. [Google Scholar] [CrossRef]
  11. Hirose, T.; Furukawa, K. Dielectric anomaly of tungsten trioxide WO3 with giant dielectric constant. Phys. Status Solidi A 2006, 203, 608–615. [Google Scholar] [CrossRef]
  12. Solovyev, I.V.; Kashin, I.V.; Mazurenko, V.V. Mechanisms and origins of half-metallic ferromagnetism in CrO2. Phys. Rev. B 2015, 92, 144407. [Google Scholar] [CrossRef]
  13. Li, L.; Kanai, Y. Antiferromagnetic structures and electronic energy levels at reconstructed NiO(111) surfaces: A DFT+U study. Phys. Rev. B 2015, 91, 235304. [Google Scholar] [CrossRef]
  14. Singh, R.; Ahmad, F.; Kumar, S.; Kumar, N.; Kumar, R.; Kumar, P. Magnetic, Optical and I-V Characteristics of MoO3 thin films. J. Phys. Conf. Ser. 2021, 1947, 012048. [Google Scholar] [CrossRef]
  15. Keßler, P.; Garcia-Gassull, L.; Suter, A.; Prokscha, T.; Salman, Z.; Khalyavin, D.; Manuel, P.; Orlandi, F.; Mazin, I.I.; Valentí, R.; et al. Absence of magnetic order in RuO2: Insights from μSR spectroscopy and neutron diffraction. npj Spintron. 2024, 2, 50. [Google Scholar] [CrossRef]
  16. Halley, D.; Najjari, N.; Majjad, H.; Joly, L.; Ohresser, P.; Scheurer, F.; Ulhaq-Bouillet, C.; Berciaud, S.; Doudin, B.; Henry, Y. Size-Induced Enhanced Magnetoelectric Effect and Multiferroicity in Chromium Oxide Nanoclusters. Nat. Commun. 2014, 5, 3167. [Google Scholar] [CrossRef]
  17. Picone, A.; Riva, M.; Brambilla, A.; Calloni, A.; Bussetti, G.; Finazzi, M.; Ciccacci, F.; Duò, L. Reactive Metal-Oxide Interfaces: A Microscopic View. Surf. Sci. Rep. 2016, 71, 32–52. [Google Scholar] [CrossRef]
  18. Wang, T.; Hu, J.; Ouyang, R.; Wang, Y.; Huang, Y.; Hu, S.; Li, W.-X. Nature of Metal-Support Interaction for Metal Catalysts on Oxide Supports. Science 2024, 386, 915–920. [Google Scholar] [CrossRef]
  19. Leybo, D.; Etim, U.J.; Monai, M.; Bare, S.R.; Zhong, Z.; Vogt, C. Metal–Support Interactions in Metal Oxide-Supported Atomic, Cluster, and Nanoparticle Catalysis. Chem. Soc. Rev. 2024, 53, 10450–10490. [Google Scholar] [CrossRef]
  20. Mohapatra, J.; Xing, M.; Wu, R.; Yang, J.; Liu, J.P. Giant Exchange Bias by Tuning Co/CoO Core/Shell Structure. Scr. Mater. 2023, 230, 115400. [Google Scholar] [CrossRef]
  21. Mitrofanov, O.; Wang, J.; Liu, Y.; Nagaoka, M.; Mizukami, S.; Ohno, H. Exchange Bias without Directional Anisotropy in Permalloy/CoO Bilayers. Phys. Rev. B 2021, 104, 144413. [Google Scholar] [CrossRef]
  22. Campbell, C.T.; Sauer, J. Introduction: Surface Chemistry of Oxides. Chem. Rev. 2013, 113, 3859–3862. [Google Scholar] [CrossRef]
  23. Diebold, U.; Li, S.-C.; Schmid, M. Oxide Surface Science. Annu. Rev. Phys. Chem. 2010, 61, 129–148. [Google Scholar] [CrossRef] [PubMed]
  24. Picone, A.; Brambilla, A.; Riva, M.; Calloni, A.; Bussetti, G.; Finazzi, M.; Ciccacci, F.; Duò, L. Self-organized chromium oxide monolayers on Fe(001). Phys. Rev. B 2013, 87, 085403. [Google Scholar] [CrossRef]
  25. Gubo, M.; Ebensperger, C.; Meyer, W.; Hammer, L.; Heinz, K. Substoichiometric cobalt oxide monolayer on Ir(100)-(1 × 1). J. Phys. Condens. Matter 2009, 21, 474211. [Google Scholar] [CrossRef] [PubMed]
  26. Kostov, K.L.; Schumann, F.O.; Polzin, S.; Sander, D.; Widdra, W. NiO growth on Ag(001): A layer-by-layer vibrational study. Phys. Rev. B 2016, 94, 075438. [Google Scholar] [CrossRef]
  27. Jaouen, T.; Tricot, S.; Delhaye, G.; Lépine, B.; Sébilleau, D.; Jézéquel, G.; Schieffer, P. Layer-Resolved Study of Mg Atom Incorporation at MgO/Ag(001) Buried Interface. Phys. Rev. Lett. 2013, 111, 266801. [Google Scholar] [CrossRef]
  28. Netzer, F.P. “Small and Beautiful”—The Novel Structures and Phases of Nano-Oxides. Surf. Sci. 2010, 604, 485–489. [Google Scholar] [CrossRef]
  29. Zhao, F.; Chen, T.; Zeng, Y.; Chen, J.; Zheng, J.; Liu, Y.; Han, G. Nickel Oxide Electrochromic Films: Mechanisms, Preparation Methods, and Modification Strategies—A Review. J. Mater. Chem. C 2024, 12, 7126–7145. [Google Scholar] [CrossRef]
  30. Gagaoudakis, E.; Tsakirakis, A.; Moschogiannaki, M.; Sfakianou, A.; Binas, V. Room-Temperature Nitric Oxide Gas Sensors Based on NiO/SnO2 Heterostructures. Sensors 2023, 23, 8583. [Google Scholar] [CrossRef]
  31. Gong, M.; Zhou, W.; Tsai, M.-C.; Zhou, J.; Guan, M.; Lin, M.-C.; Zhang, B.; Hu, Y.; Wang, D.-Y.; Yang, J.; et al. Nanoscale Nickel Oxide/Nickel Heterostructures for Active Hydrogen Evolution Electrocatalysis. Nat. Commun. 2014, 5, 4695. [Google Scholar] [CrossRef]
  32. Kasinathan, D.; Prabhakar, P.; Muruganandam, P.; Wiston, B.R.; Mahalingam, A.; Sriram, G. Solution Processed NiO/MoS2 Heterostructure Nanocomposite for Supercapacitor Electrode Application. Energies 2023, 16, 335. [Google Scholar] [CrossRef]
  33. Vinodh, R.; Babu, R.S.; Atchudan, R.; Kim, H.-J.; Yi, M.; Samyn, L.M.; de Barros, A.L.F. Fabrication of High-Performance Asymmetric Supercapacitor Consists of Nickel Oxide and Activated Carbon (NiO//AC). Catalysts 2022, 12, 375. [Google Scholar] [CrossRef]
  34. Ni, J.; Zhang, Y.; Li, J.; Ren, Y.; Zhou, J.; Dai, B. Electric Control of NiFe/NiO Exchange Bias through Resistive Switching under Zero Magnetic Field. J. Mater. Sci. Mater. Electron. 2023, 34, 552. [Google Scholar] [CrossRef]
  35. Luches, P.; Altieri, S.; Giovanardi, C.; Moia, T.S.; Valeri, S.; Bruno, F.; Floreano, L.; Morgante, A.; Santaniello, A.; Verdini, A.; et al. Growth, Structure, and Epitaxy of Ultrathin NiO Films on Ag(001). Thin Solid Film. 2001, 400, 139–143. [Google Scholar] [CrossRef]
  36. Visikovskiy, A.; Mitsuhara, K.; Hazama, M.; Kohyama, M.; Kido, Y. The Atomic and Electronic Structures of NiO(001)/Au(001) Interfaces. J. Chem. Phys. 2013, 139, 144705. [Google Scholar] [CrossRef]
  37. Schoiswohl, J.; Agnoli, S.; Xu, B.; Surnev, S.; Sambi, M.; Ramsey, M.G.; Granozzi, G.; Netzer, F.P. Growth and Thermal Behaviour of NiO Nanolayers on Pd(100). Surf. Sci. 2005, 599, 1–13. [Google Scholar] [CrossRef]
  38. Finazzi, M.; Brambilla, A.; Duò, L.; Ghiringhelli, G.; Portalupi, M.; Ciccacci, F.; Zacchigna, M.; Zangrando, M. Chemical Effects at the Buried NiO/Fe(001) Interface. Phys. Rev. B 2004, 70, 235420. [Google Scholar] [CrossRef]
  39. Mitchell, D.F.; Sewell, P.B.; Cohen, M. A Kinetic Study of the Initial Oxidation of the Ni(001) Surface by RHEED and X-ray Emission. Surf. Sci. 1976, 61, 355–376. [Google Scholar] [CrossRef]
  40. Bussetti, G.; Riva, M.; Picone, A.; Brambilla, A.; Duò, L.; Finazzi, M.; Ciccacci, F. Martensitic Transition During Ni Growth on Fe(001): Evidence of a Precursor Phase. New J. Phys. 2012, 14, 053048. [Google Scholar] [CrossRef]
  41. Wang, Z.Q.; Li, Y.S.; Jona, F.; Marcus, P.M. Epitaxial Growth of Body-Centered-Cubic Nickel on Iron. Solid State Commun. 1987, 61, 623–626. [Google Scholar] [CrossRef]
  42. Picone, A.; Brambilla, A.; Calloni, A.; Duò, L.; Finazzi, M.; Ciccacci, F. Oxygen-Induced Effects on the Morphology of the Fe(001) Surface in Out-of-Equilibrium Conditions. Phys. Rev. B Condens. Matter Mater. Phys. 2011, 83, 235402. [Google Scholar] [CrossRef]
  43. Tange, A.; Gao, C.L.; Yavorsky, B.Y.; Maznichenko, I.V.; Etz, C.; Ernst, A.; Hergert, W.; Mertig, I.; Wulfhekel, W.; Kirschner, J. Electronic Structure and Spin Polarization of the Fe(001)-p(1×1)O Surface. Phys. Rev. B 2010, 81, 195410. [Google Scholar] [CrossRef]
  44. Kim, S.K.; Petersen, C.; Jona, F.; Marcus, P.M. Ultrathin Films of Cobalt on Fe{001} and the Effect of Oxygen. Phys. Rev. B 1996, 54, 2184–2190. [Google Scholar] [CrossRef] [PubMed]
  45. Riva, M.; Picone, A.; Giannotti, D.; Brambilla, A.; Fratesi, G.; Bussetti, G.; Duò, L.; Finazzi, M.; Ciccacci, F. Mesoscopic Organization of Cobalt Thin Films on Clean and Oxygen-Saturated Fe(001) Surfaces. Phys. Rev. B 2015, 92, 115434. [Google Scholar] [CrossRef]
  46. Riva, M.; Picone, A.; Bussetti, G.; Brambilla, A.; Calloni, A.; Berti, G.; Duò, L.; Ciccacci, F.; Finazzi, M. Oxidation Effects on Ultrathin Ni and Cr Films Grown on Fe(001): A Combined Scanning Tunneling Microscopy and Auger Electron Spectroscopy Study. Surf. Sci. 2021, 713, 121894. [Google Scholar] [CrossRef]
  47. Brambilla, A.; Picone, A.; Giannotti, D.; Riva, M.; Bussetti, G.; Berti, G.; Calloni, A.; Finazzi, M.; Ciccacci, F.; Duò, L. Self-Organized Nano-Structuring of CoO Islands on Fe(001). Appl. Surf. Sci. 2016, 362, 374–379. [Google Scholar] [CrossRef]
  48. Davis, L.E.; MacDonald, N.C.; Palmberg, P.W.; Riach, G.E.; Weber, R.E. Handbook of Auger Electron Spectroscopy; Perkin-Elmer Corporation: Minneapolis, MN, USA, 1976. [Google Scholar]
  49. Valeri, S.; Borghi, A.; Gazzadi, G.C.; di Bona, A. Growth and Structure of Cobalt Oxide on (001) Bct Cobalt Film. Surf. Sci. 1999, 423, 346–356. [Google Scholar] [CrossRef]
  50. Thimsen, E.; Martinson, A.B.F.; Elam, J.W.; Pellin, M.J. Energy Levels, Electronic Properties, and Rectification in Ultrathin p-NiO Films Synthesized by Atomic Layer Deposition. J. Phys. Chem. C 2012, 116, 16830–16840. [Google Scholar] [CrossRef]
  51. Teply, C.; Tyler, B.A.; Berger, R.F. Tuning the Band Gaps of Oxide and Halide Perovskite Compounds via Biaxial Strain in All Directions. J. Phys. Chem. C 2021, 125, 25951–25958. [Google Scholar] [CrossRef]
  52. Dissanayake, D.M.C.U.; Wickramasinghe, J.S.T.; Samarasekara, P. Effect of Annealing Temperature on Photovoltaic Properties of Spin Coated CdS Films. arXiv 2018, arXiv:1804.04493. [Google Scholar]
  53. Altieri, S.; Finazzi, M.; Hsieh, H.H.; Haverkort, M.W.; Lin, H.-J.; Chen, C.T.; Frabboni, S.; Gazzadi, G.C.; Rota, A.; Valeri, S.; et al. Image Charge Screening: A New Approach to Enhance Magnetic Ordering Temperatures in Ultrathin Correlated Oxide Films. Phys. Rev. B 2009, 79, 174431. [Google Scholar] [CrossRef]
Figure 1. AES spectra and LEED images acquired on the Fe(001)-p(1x1)O substrate (panels (a,b)), 5 ML Co(001)-p(1x1)O (panels (c,d)), and 5 ML Ni(001)-p(1x1)O (panels (e,f)). In panel (b), the red circles highlight the diffraction points of the first Brillouin zone. AES spectra were measured with an electron beam energy (BE) of 3 keV, while LEED images were obtained at BE = 125 eV.
Coatings 15 00507 g001
Figure 2. Panel (a): STM constant current image acquired on the 5 ML Ni(001)-p(1x1)O surface. Tunneling parameters are I = 1   n A and V = 1   V . Image size 150 × 150   n m 2 . Panel (b): topographic profile measured along the white line drawn in panel (b).
Coatings 15 00507 g002
Figure 3. AES spectra acquired on NiO films with nominal thicknesses of 3 ML (black), 4 ML (red), 6 ML (green), 8 ML (blue), and 16 ML (light blue). The primary electron beam energy is 3 KeV.
Coatings 15 00507 g003
Figure 4. AES spectra acquired on metallic Ni (black), 5 ML Ni(001)-p(1x1)O (red), and after deposition of 3 ML (blue) and 16 ML (pink) of NiO.
Coatings 15 00507 g004
Figure 5. (a) LEED image acquired on the 3 ML NiO film. The red circles indicate the points of the square reciprocal lattice. BE is 125 eV. (b) Large scale STM image showing the 3 ML NiO surface topography. Image size   90 × 90   n m 2 . (c) Closer view of the 3 ML NiO surface. Image size   20 × 20   n m 2 . (d) Topographic profile acquired along the dotted white line drawn in panel (c). Tunneling parameters for panels (b) and (c) are I = 0.5   n A and V = 2   V .
Coatings 15 00507 g005
Figure 6. Atomically resolved constant current STM image acquired on the 3 ML NiO sample. Tunneling parameters are I = 5   n A and V = 0.8   V . Image size   33 × 25   n m 2 . The inset shows the Fourier transform of the image, where the spots corresponding to the first-order diffraction are clearly visible.
Coatings 15 00507 g006
Figure 7. Constant-current STM images were acquired for NiO films of 4 ML (a), 6 ML (b), 8 ML (c), and 16 ML (d). The tunneling parameters for all images were set to I = 0.5 nA and V = 2.2 V. Each image covers an 80 × 80 nm2 area. The insets display the corresponding LEED patterns, revealing a well-defined square diffraction pattern. LEED measurements in panels (ac) were obtained at a beam energy of 125 eV, while the measurement in panel (d) was acquired at 150 eV.
Coatings 15 00507 g007
Figure 8. dI/dV spectra acquired on 3 ML (black), 6 ML (red), and 16 ML (blue) thick NiO film. For each curve, the band gap value is reported.
Coatings 15 00507 g008
Table 1. Ratios between the O KLL peak and the Ni LMM peak at 850 eV measured for increasing thicknesses of NiO.
NiO (ML)OKLL/Ni850
33.16
43.10
63.45
83.39
163.20
Table 2. Root Mean Square Roughness (RMS) as a function of NiO thickness.
NiO (ML)RMS (nm)
30.12
40.15
60.13
80.14
160.17
Table 3. Valence band (VB) and conduction band (CB) edges measured from the STS spectra acquired on NiO films with different thicknesses. The energy gap is reported in the last column.
NiO (ML)VB (eV)CB (eV)Energy Gap (eV)
3−0.20.60.8
4−1.20.82
6−11.52.5
8−1.21.83
16−1.523.5
Disclaimer/Publisher’s Note: The statements, opinions and data contained in all publications are solely those of the individual author(s) and contributor(s) and not of MDPI and/or the editor(s). MDPI and/or the editor(s) disclaim responsibility for any injury to people or property resulting from any ideas, methods, instructions or products referred to in the content.