Abstract
Many pipelines are buried and operated underground in nuclear and chemical plants. Since these pipelines are welded on-site and subsequently coated, ensuring the integrity of these coatings is crucial. Over time, rubber coatings can disbond due to factors such as soil pressure, creating gaps that lead to defects and may expose weld joints to electrolytes locally. Thus, effective detection of coating defects in buried pipelines is crucial for maintaining pipelines’ structural integrity and preventing corrosion. This study examines the shielding effect of rubber disbond on DCVG signal magnitude using the Direct Current Voltage Gradient (DCVG) technique. Simulations conducted with COMSOL Multiphysics®, considering variables such as soil resistivity (1–19 kΩ·cm), defect exposure size (100 cm2 and 1 cm2), detection electrode distance, and applied voltage, show that the DCVG signal generally increases as soil resistivity decreases and as defect size and electrode spacing increase. This is due to a stronger current distribution resulting from the higher applied voltages. However, shielded defects consistently produce lower DCVG signals than unshielded ones, a phenomenon that stems from the insulating shielding layer around the defect, which restricts the flow of the inspection current. These findings highlight how the shielding layer significantly influences the distribution of the inspection current.
1. Introduction
Pipelines are commonly used to transport resources such as oil, gas, and water and are frequently buried underground where space is limited [1,2]. Nevertheless, these pipelines are prone to various forms of corrosion owing to material properties and surrounding environmental conditions. The primary causes of corrosion in these underground pipelines stem from natural currents, stray currents, and soil conditions [3,4]. An analysis of approximately 400 cases involving city gas pipelines revealed that about 35% of accidents were due to natural corrosion. Similarly, a 20-year study by a U.S. Gulf Coast company, assessing around 640 pipeline failures in coastal areas, indicated that 49% of these failures were attributed to corrosion [5,6,7,8].
To mitigate corrosion, various protective measures, such as selecting appropriate materials, applying coatings to isolate the pipeline from the environment, and employing cathodic protection (CP), are used [9,10]. Typically, coatings are applied both internally and externally on pipelines to prevent corrosion. However, external coatings on buried pipelines can deteriorate due to factors such as inadequate surface preparation, changing soil conditions, or damage from nearby construction activities [11,12]. When the coating of a buried pipeline is compromised, the exposed metal interacts with the soil, leading to electrochemical reactions that accelerate corrosion [13,14,15,16,17]. In critical infrastructures such as power plants, corrosion-induced cracks in pipelines can result in severe economic and environmental consequences. To mitigate these risks, buried pipelines in key facilities are protected with external and internal coatings, along with cathodic protection, which introduces an external current to curb further corrosion. However, if the coating is damaged over time, corrosion and cracking may still occur [18,19].
In nuclear power plants, both direct and indirect inspections are periodically conducted on buried pipelines. Given the multitude of buried pipelines in the confined spaces of these facilities, assessments of coating defects are carried out first to determine excavation points. The indirect inspection protocol for buried pipelines typically involves identifying pipeline routes, assessing the status of cathodic protection, and evaluating coating defects. Techniques for locating pipelines include Ground-Penetrating Radar (GPR), which uses electromagnetic waves, and the Alternating Current Voltage Gradient (ACVG) technique, which measures voltage gradients induced by alternating currents [20]. The GPR is extensively used in sectors such as wastewater management, gas distribution, and telecommunications, proving especially effective in nuclear power plants where pipelines may intersect in vertical, horizontal, and diagonal orientations. The assessment of cathodic protection typically involves the Close-Interval Potential Survey (CIPS) method for measuring pipeline potentials, while the DCVG method is used to detect coating defects in buried pipelines [21,22,23,24]. It works by applying a direct current to the pipeline and then measuring the voltage difference (potential gradient) on the ground surface. If a defect is present, the current escapes through the exposed area, creating a detectable voltage gradient.
Recently constructed buried pipelines are generally coated with high-performance factory-applied coatings, consisting of three layers: an epoxy layer, a polyethylene adhesive layer, and an outer polyethylene layer [25,26]. However, in sections where pipelines are welded onsite (which typically requires the removal of approximately 15 cm of factory coating for welding), a less protective heat-shrink sleeve is applied. Generally, even if defects are present in the factory-applied coating, corrosion is anticipated to be prevented as long as cathodic protection standards are met and there is no further degradation, such as delamination. Yet, heat-shrink sleeves at weld joints tend to sustain more damage or degradation, and frequent pigging has shown these welded sections to be more susceptible to corrosion [27,28]. Consequently, weld joints represent high-risk areas for corrosion, making it critical to detect even small micro-defects in these areas to maintain pipeline integrity.
Weld coatings, relatively more vulnerable, pose additional challenges. Heat-shrink sleeves applied to weld joints in trenches experience shear stress from the backfilled soil pressing down on them. Moreover, poor installation quality can lead to stretching, wrinkling, or detachment of the sleeve from the pipeline, especially on the lower portion. This phenomenon is known as coating disbond [29,30,31,32]. When coating disbond occurs, corrosive electrolytes present in the soil can infiltrate the space between the disbonded coating and the pipeline, coming into direct contact with the weld area.
Under such conditions, the cathodic protection current cannot pass through the highly insulating heat-shrink material and must instead flow through the electrolyte that has entered the gap (a phenomenon known as cathodic shielding). However, the scale of the current entering the gap depends on factors including the size of the disbonded area, the conductivity of the electrolyte under the disbonded coating, and the applied potential. Due to the typically high resistance of this path, the flow of cathodic protection current into the gap is significantly restricted, leading to an inadequate current distribution and continued corrosion. Where coating disbond has occurred, the limited flow of current results in a small potential gradient at the ground surface.
Currently, the primary industry-standard techniques for detecting coating damage in buried pipelines are CIPS and DCVG. However, one substantial limitation of both CIPS and DCVG is their reduced effectiveness in electrically shielded environments caused by coating disbond. This limitation introduces critical uncertainties about whether DCVG can effectively detect such small potential gradients and under what specific conditions these defects can be accurately identified.
This study aims to determine the detectability of both non-shielded and shielded coating defects at rubber-lined weld joints by simulating various conditions to calculate potential distribution and analyzing the shielding effect in coating defect detection using the DCVG method. While this study focuses on DCVG simulation, various detection techniques are commonly used in the field to assess coating defects and cathodic protection status. DCVG (Direct Current Voltage Gradient) is effective in localizing coating disbonds with reasonable surface accuracy, particularly for electrically isolated pipelines. However, it may suffer from signal attenuation in high-resistivity soils or in the presence of shielding. In contrast, current interruption methods provide an overall view of cathodic protection effectiveness through potential decay curves but lack spatial resolution. Electromagnetic sensing techniques are also widely used to detect insulation loss or metallic discontinuities, though they may be less effective for non-metallic coating disbonds.
2. Experimental Methods
2.1. Rubber Disbond and Its Geometry for Computer Simulation
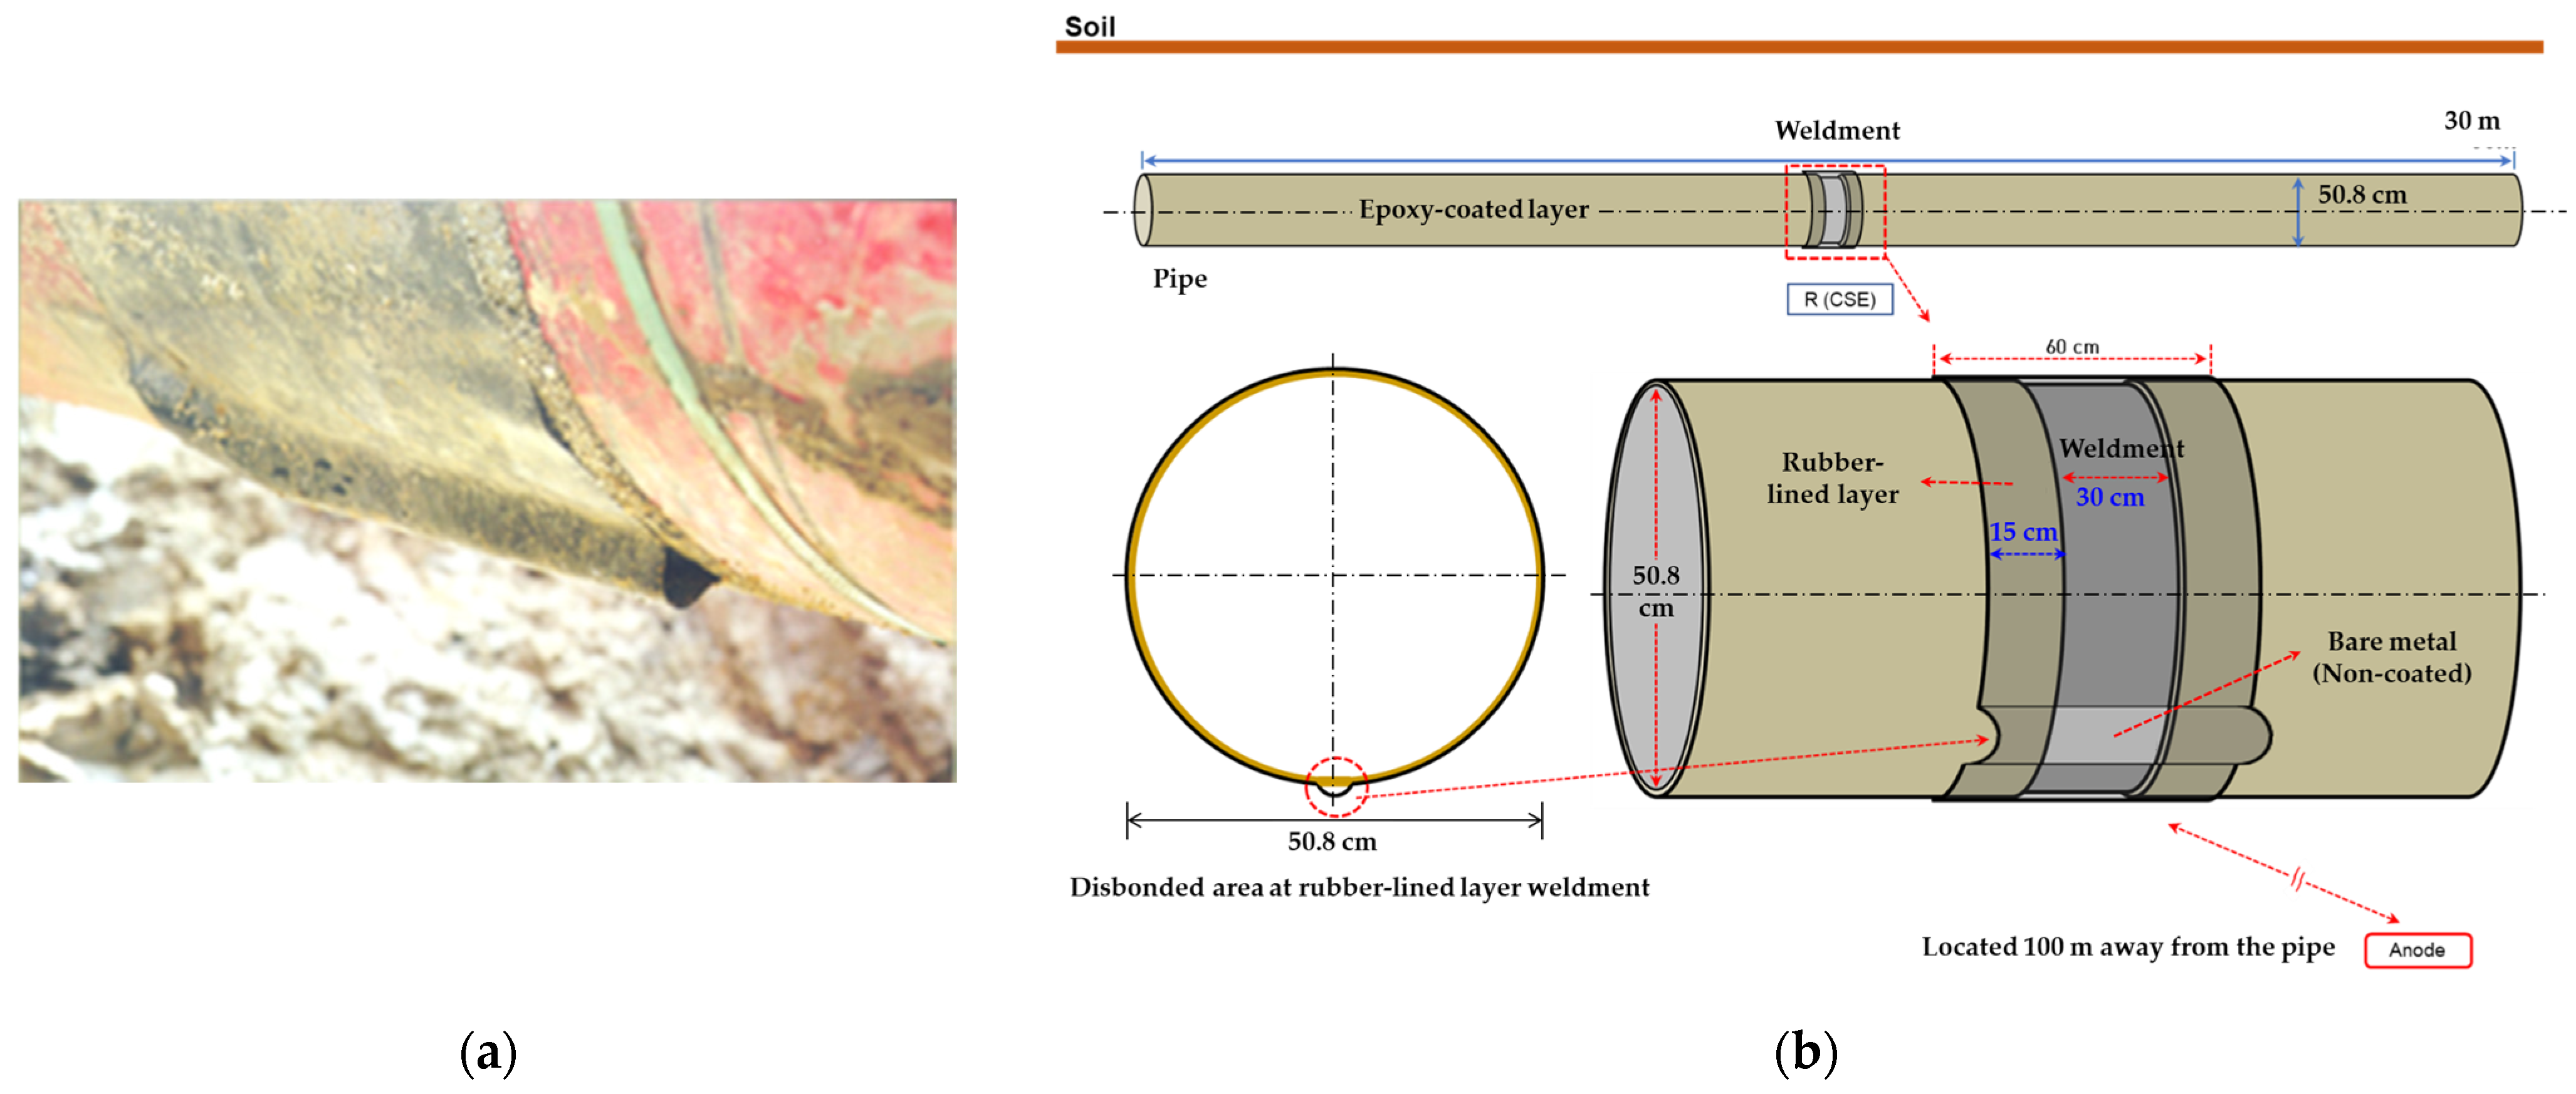
In this study, the governing equation of the studied system was revised by incorporating the polarization behavior in the soil solution; subsequently, a stationary analysis was conducted since it was unnecessary to account for temporal changes in the system. The soil was assumed to be homogeneous throughout the domain, with the conductivity of the electrolyte, representing the soil in the simulation, set to resistivity values of 1, 10, and 19 kΩ·cm, analogous to that of the soil solution. Soil resistivity was varied and was set at 1, 10, and 19 kΩ·cm to examine its influence on DCVG signals. These values were selected to represent typical field conditions based on standard industry references such as NACE RP0502 [33]. Specifically, 1 kΩ·cm corresponds to moist, conductive soils (e.g., clay), 10 kΩ·cm to medium-resistivity soils (e.g., sandy loam), and 19 kΩ·cm to dry, coarse soils (e.g., gravel or sand). This range reflects commonly observed conditions around buried pipelines. A schematic diagram of the pipeline with a shielded defect for the simulation is presented in Figure 1, where Figure 1a displays an actual photograph, and Figure 1b depicts the schematic of the shielding model. The pipeline measured 30 m in length, with a diameter of 50.8 cm (20 inches). The coated weld joint and disbond were centrally located along the pipeline’s length. The entire pipeline, with the exception of the defect area, was insulated with a coating. The weld joint at the center featured a band shape with a 30 cm length. The welded area was insulated with rubber, extending 30 cm on both sides from the center of the weld, totaling 60 cm in length. A single coating disbond, situated below the welded joint at the 6 o’clock position, was introduced. Such a disbond might arise from factors such as the shear stress exerted by the buried soil or a suboptimal weld application, leading to the swelling or detachment of the coating from the pipeline. The size of the exposed defect due to the coating disbond was set in the simulations at 100 cm2 and 1 cm2.
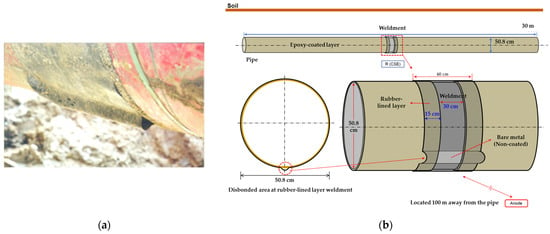
Figure 1.
(a) Actual rubber disbond occurring in welded pipelines, (b) schematic diagram used in computer simulation.
2.2. DCVG Calculation for Shielded Defect by FEM Simulation
The simulation analysis of DCVG signals for detecting defects in buried pipelines was conducted using COMSOL Multiphysics® (COMSOL Inc., Burlington, MA, USA), specifically employing the secondary current distribution feature of the corrosion module. The simulation included key considerations such as activation polarization at the material interface exposed to the electrolyte (soil), assuming that electrolyte conductivity is governed by Ohm’s law for charge transport, and involved calculating the current and potential distribution within the electrochemical cell. The governing equations describe how electric current is distributed in both the solid and the liquid domains. Specifically, they are derived from Ohm’s law and the principle of charge conservation
where i1 and is represent the current densities in the liquid (soil electrolyte) and solid (pipeline) regions, respectively; σ1 and σs are their electrical conductivities, and 1 and s are the electric potentials in each domain. These equations ensure that current conservation is satisfied in both regions and allow us to calculate the potential distribution necessary for simulating the DCVG signal.
In this study, the polarization behavior in a solution with simulated soil resistivity was explored to replace the system’s governing equations. It did not require a time-variant description; hence, a stationary analysis was performed. A homogeneous soil (electrolyte) was assumed, and this assumption was maintained throughout the simulation domain.
2.3. Evaluation of Electrochemical Properties
A simulated soil electrolyte solution was prepared using NaCl and Na2SO4, following the composition guidelines outlined in reference materials [34,35]. The soil resistivity values were set at 1, 10, and 19 kΩ·cm, with adjusted salt concentrations in the mixed solution. The polarization behavior of the samples was evaluated at different soil resistivities in accordance with ASTM G5 [36] using a potentiostat (Interface 1000, Gamry, Warminster, PA, USA). To eliminate the dissolved oxygen, N2 gas was bubbled through the solution at a flow rate of 200 mL/min for 30 min. After deaeration, polarization measurements were performed using a scan rate of 0.137 mV/s, with a saturated calomel electrode (SCE) as the reference electrode. The polarization experiments were performed more than three times for each soil resistivity condition, and the averaged data were used to generate polarization curves. In addition, the electrochemical response to changes in current density was checked using the internal IR compensation function of the potentiostat to confirm data stability.
3. Results and Discussion
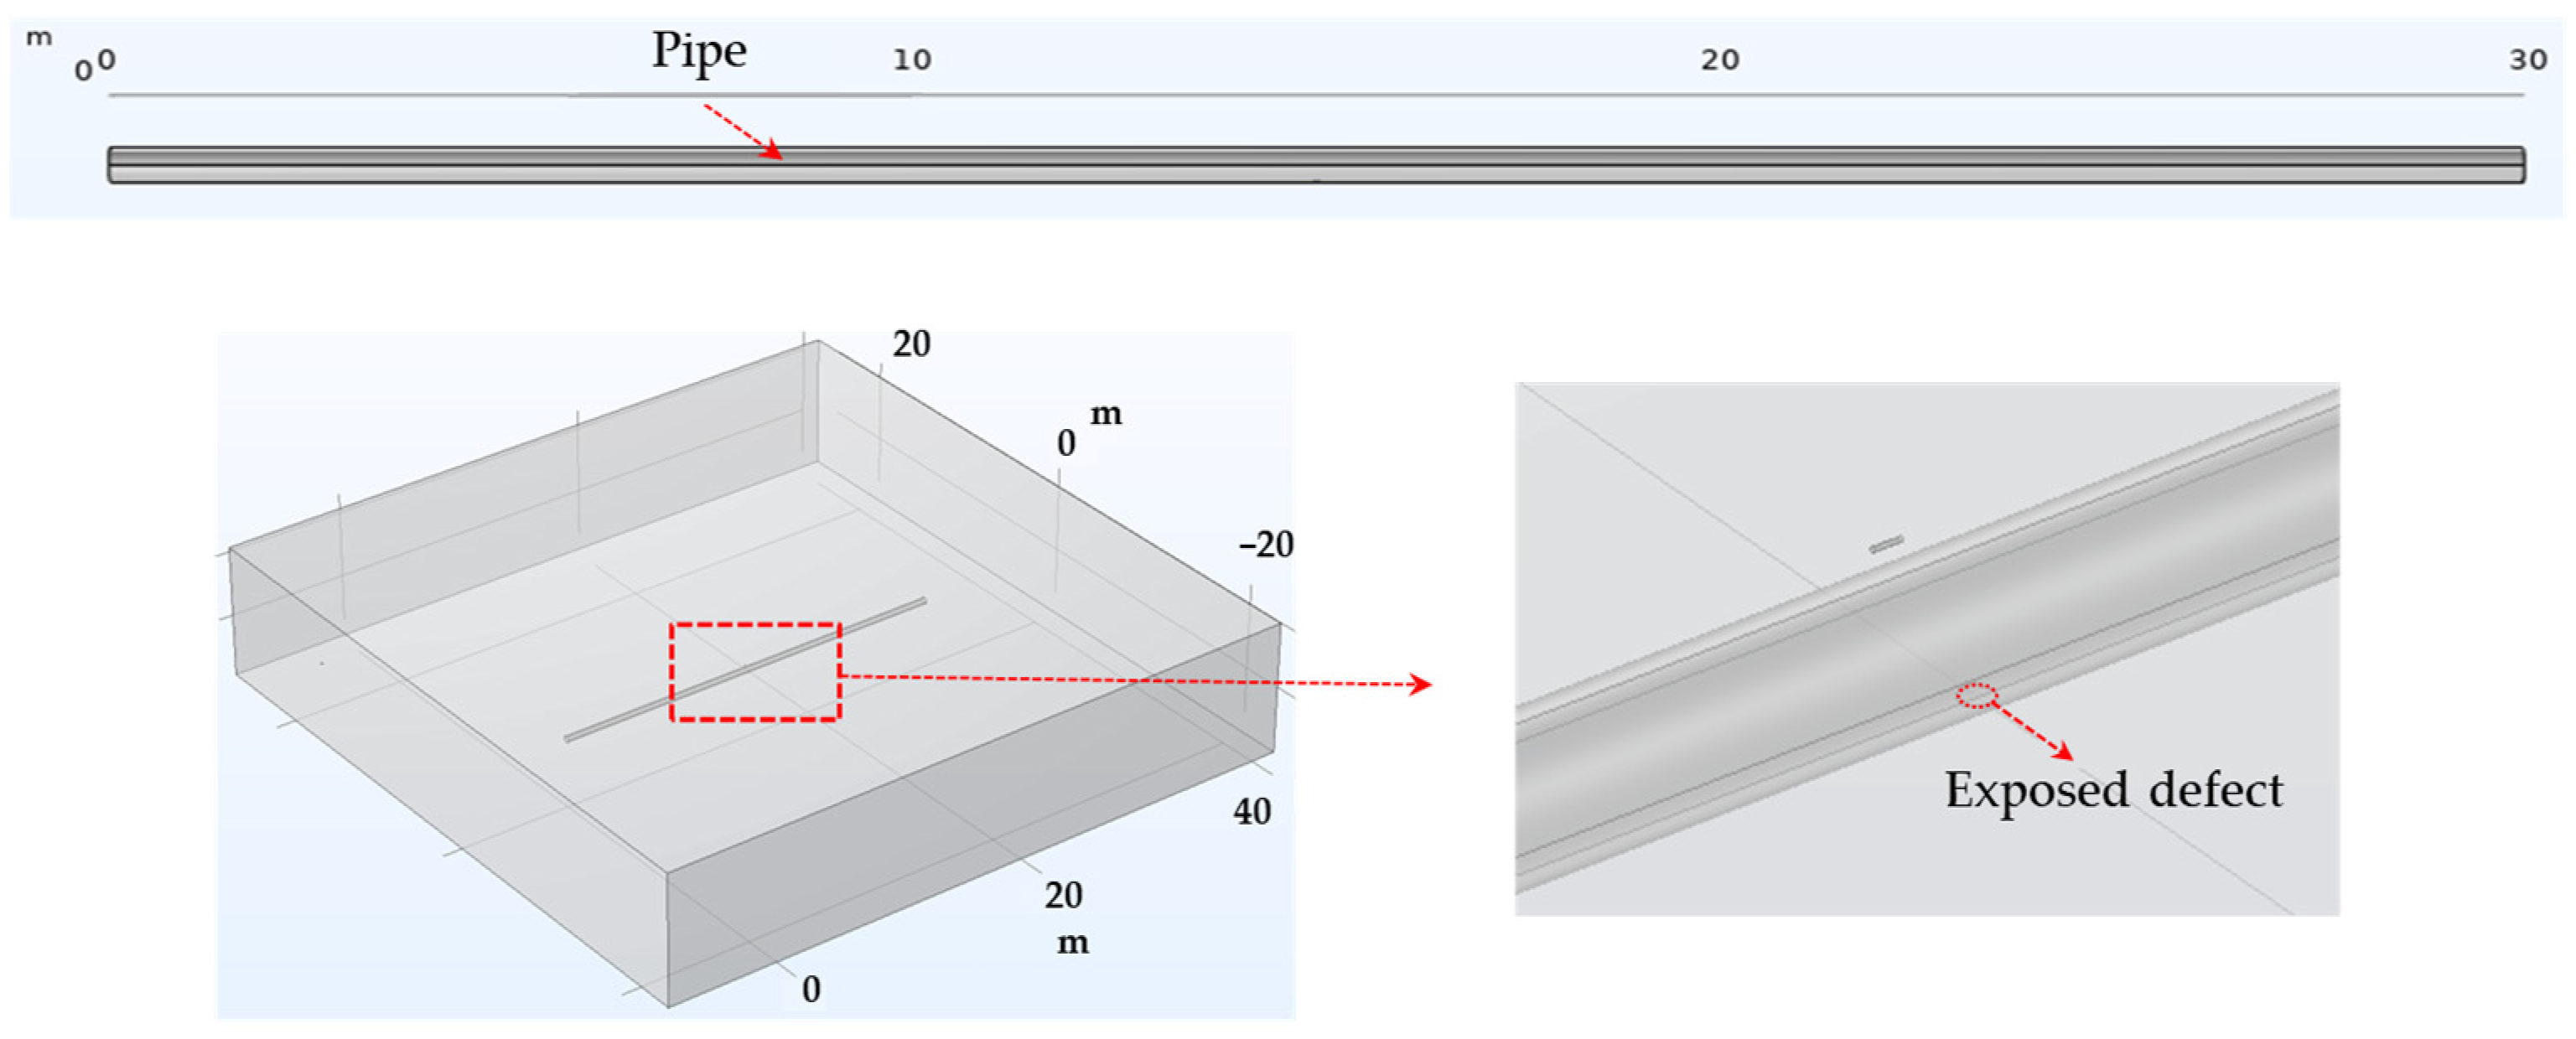
DCVG simulation in the non-shielded condition. Figure 2 depicts a model for detecting defects in a non-shielded buried pipe. The model comprised a 30 m long pipe within a homogeneous soil environment. The pipeline’s coating was either missing or damaged at specific spots, exposing the pipeline directly to the external environment. The enlarged view highlights where these coating failures occurred, with defect sizes set at 100 cm2 and 1 cm2, leading to direct exposure of the pipeline to the electrolyte.
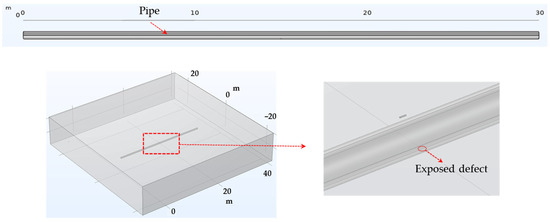
Figure 2.
Geometries employed in the simulation of DCVG signal for non-shielded exposed defect on pipe.
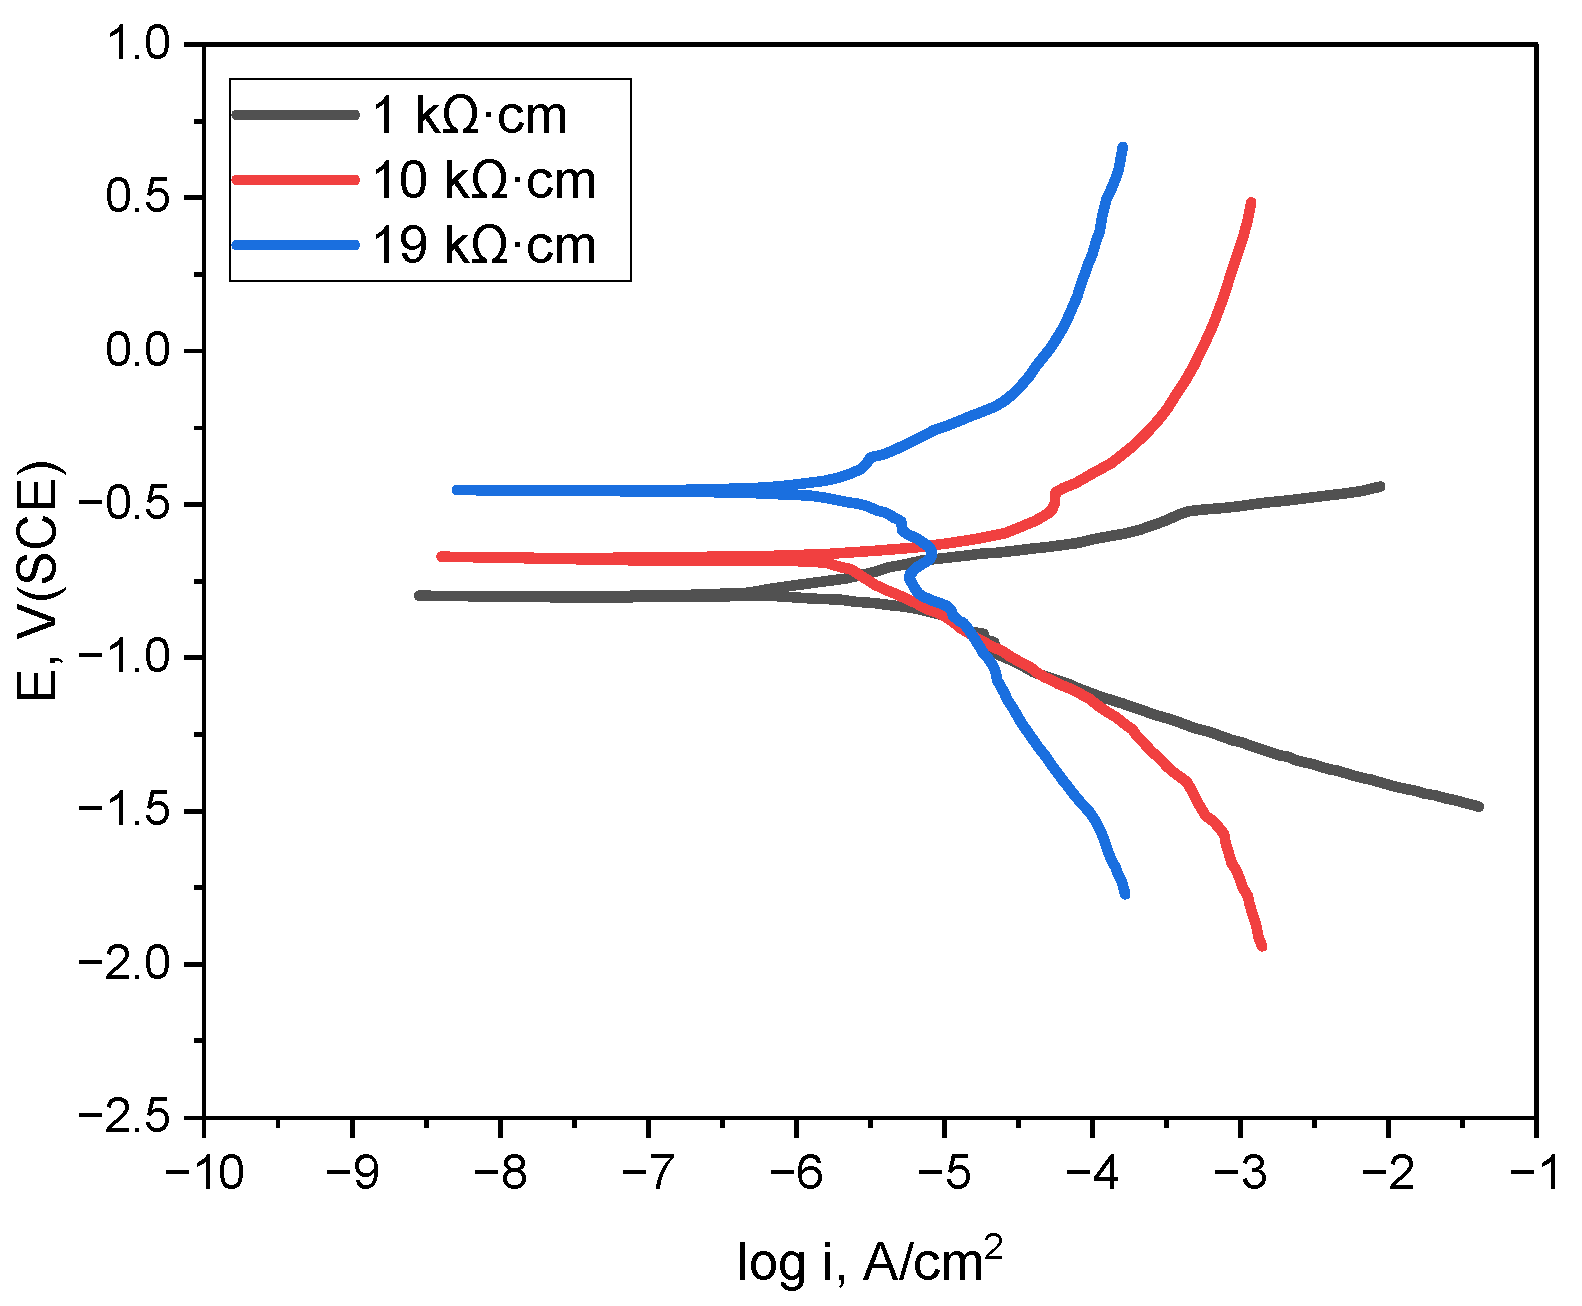
Figure 3 illustrates the polarization behavior of the pipeline material in deaerated conditions for various soil resistivities (1 kΩ·cm, 10 kΩ·cm, and 19 kΩ·cm). From the polarization curves, electrochemical parameters such as corrosion potential and Tafel constants (Beta A, Beta C) were derived, serving as material data in the simulation. COMSOL Multiphysics® was used to simulate defect detection in buried pipelines by directly incorporating the data from the polarization curves instead of separately entering the parameters of the material properties derived from the polarization behavior. This method permitted a more accurate depiction of the electrochemical reactions within the electrolyte and improved the simulation’s precision by using an intrinsic analysis to integrate the necessary electrochemical constants with the polarization behavior. This approach allows the same polarization curve data to be reused or updated without the need to manually extract individual parameter values each time, thereby ensuring reproducibility.
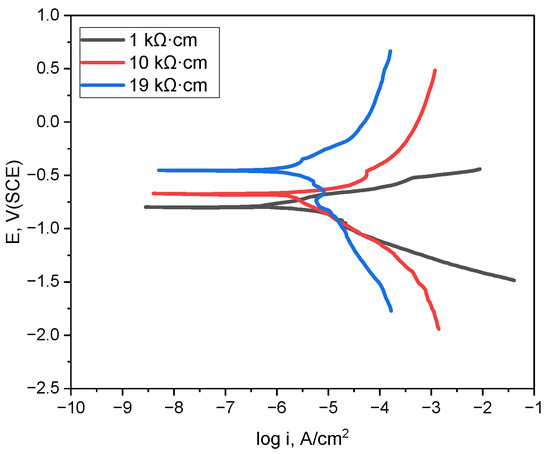
Figure 3.
Polarization curves obtained in simulated soil solutions with varying soil resistivities at 25 °C.
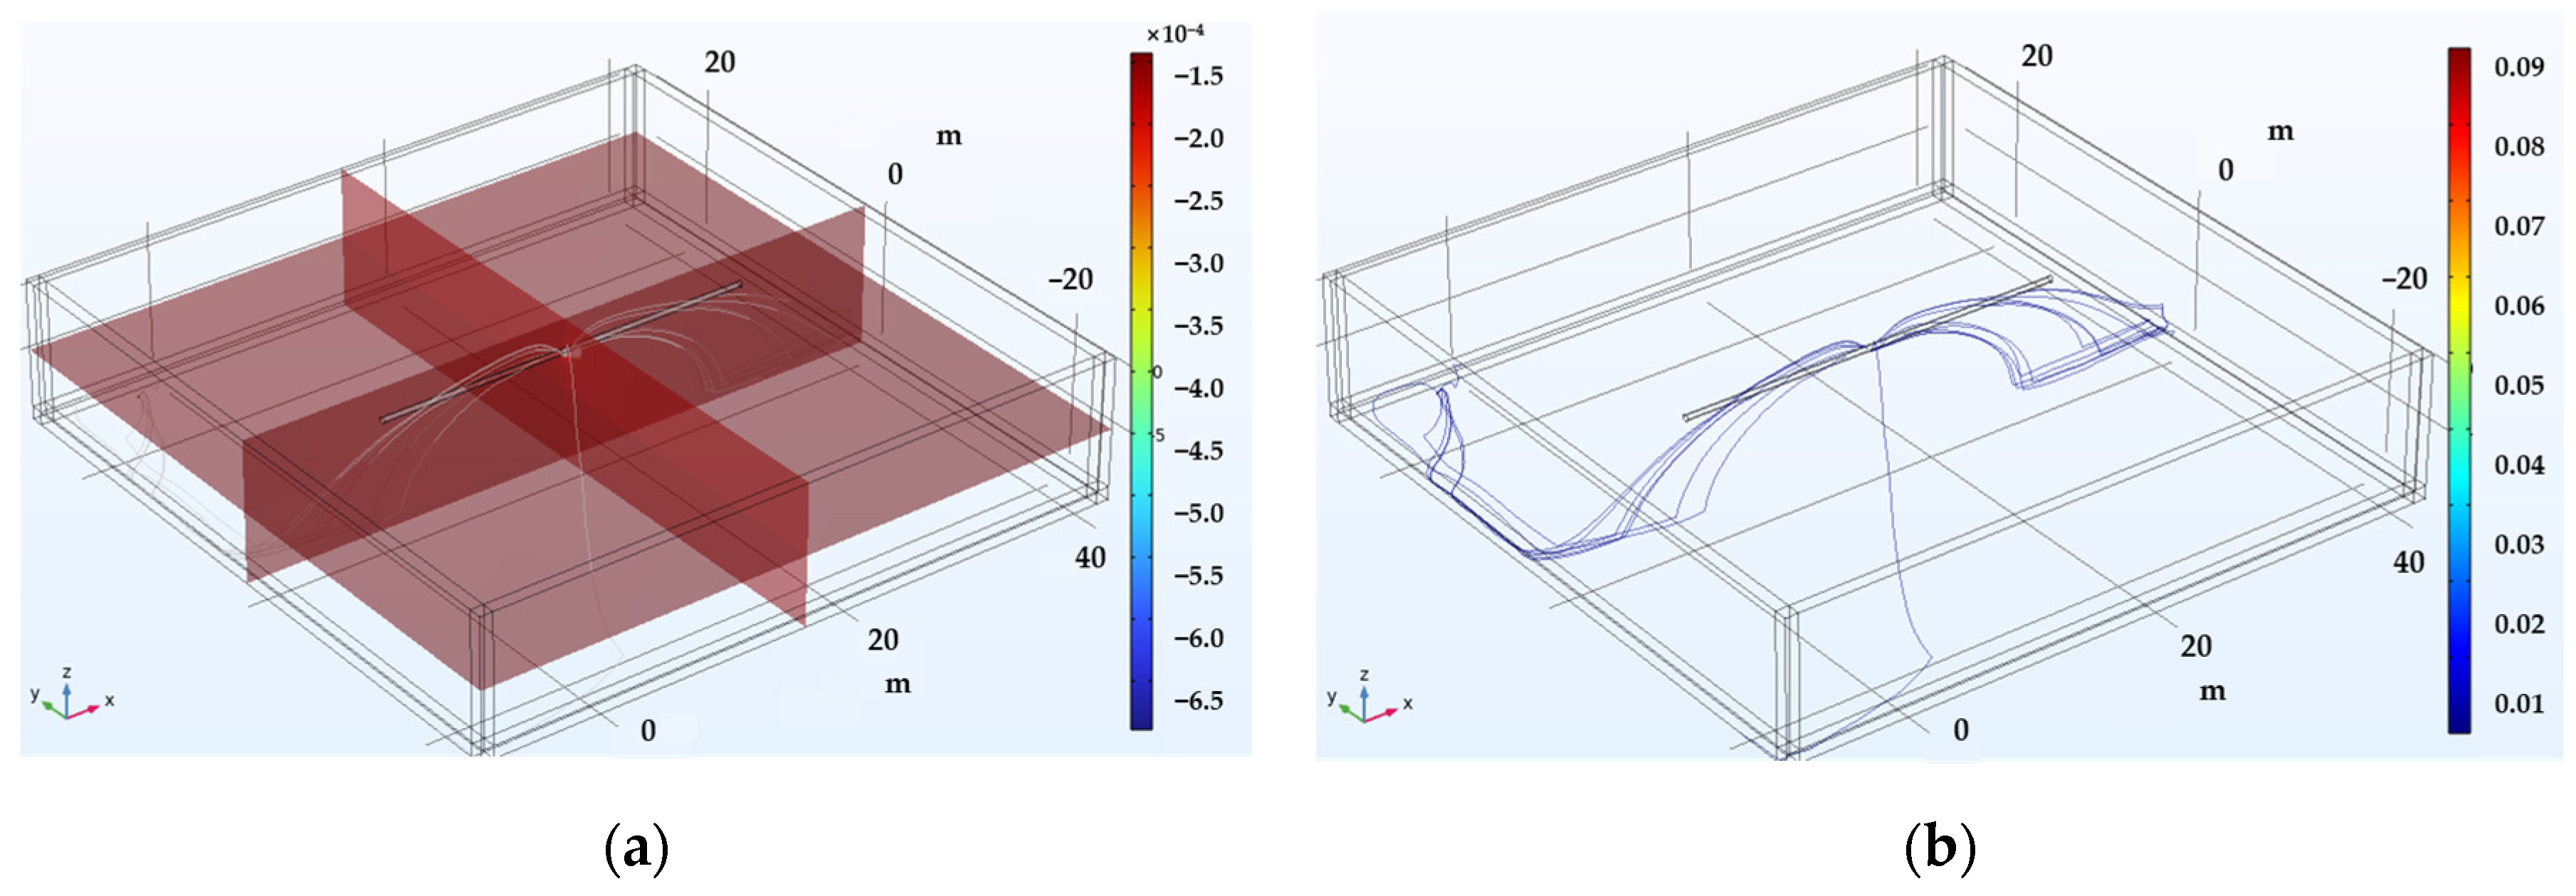
Figure 4 illustrates the 3D simulation results for detecting unshielded defects in buried pipelines. Figure 4a shows the potential distribution within the electrolyte, highlighting the formation of a potential gradient at the defect site. Figure 4b demonstrates the current distribution within the electrolyte, indicating that the current density is concentrated at the defect location, indicating strong current leakage through the exposed metal surface. This means that the defect acts as an escape point for the cathodic protection current, which creates a voltage signal detectable by surface electrodes. The more concentrated this current, the more detectable the signal.
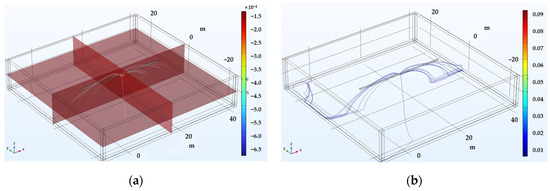
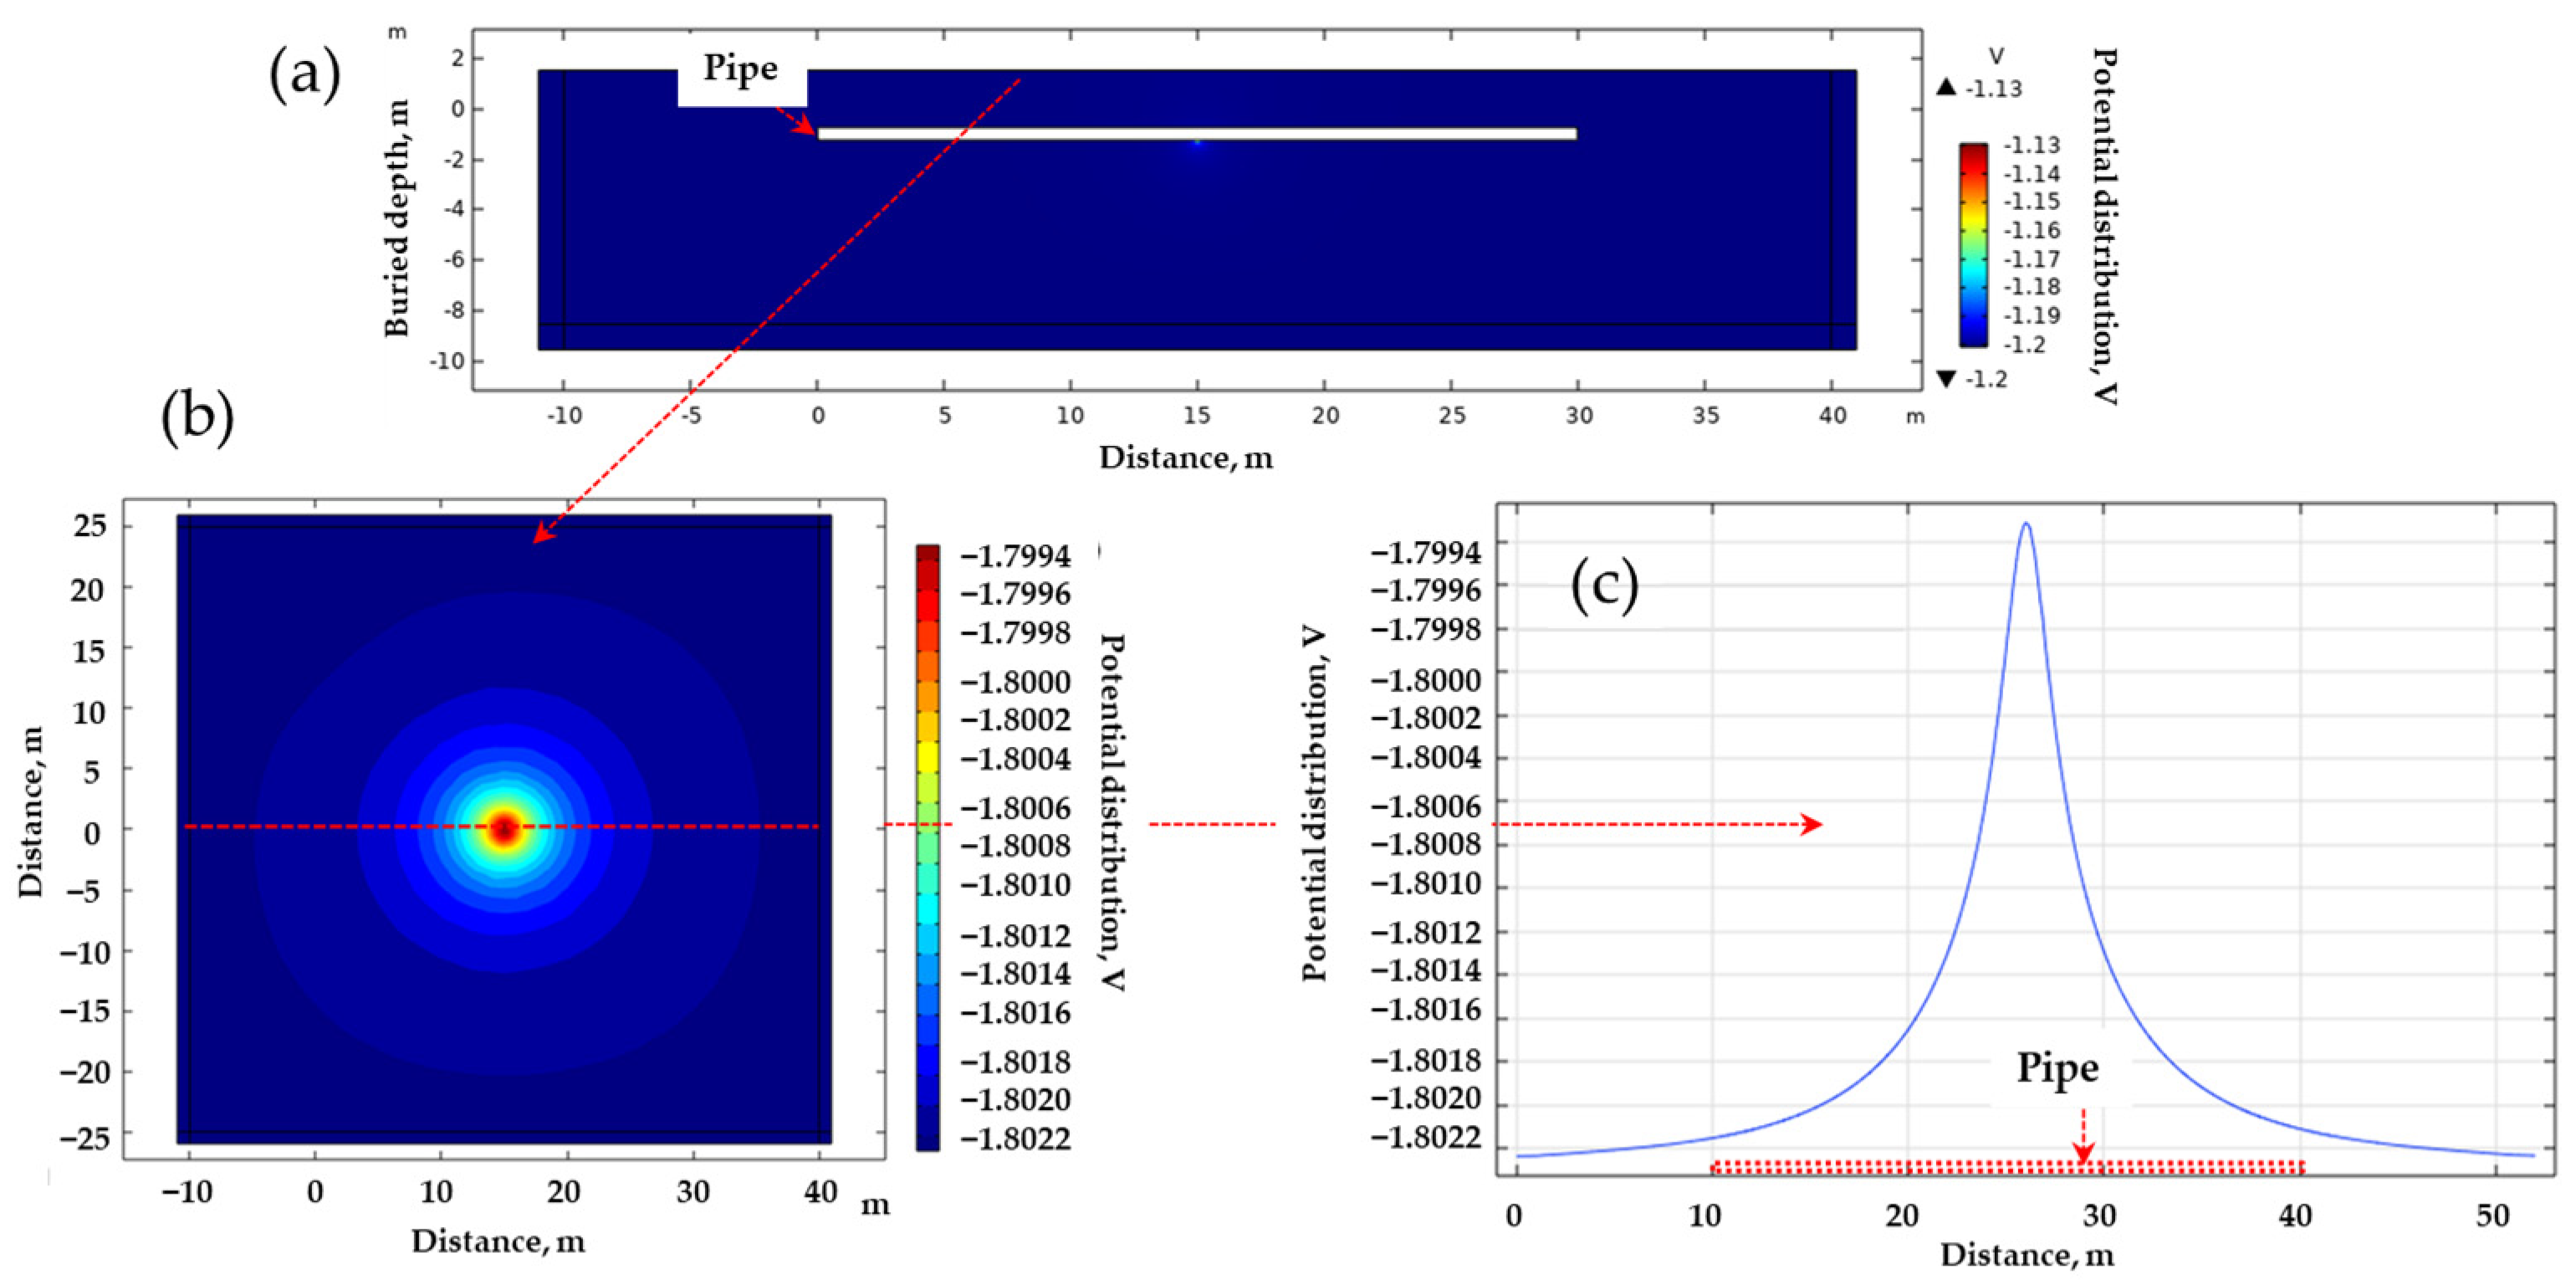
Figure 5 outlines the computational process used to ascertain the magnitude of the DCVG signal via simulation. The simulation incorporated critical parameters including soil resistivity, defect size, and applied voltage. Figure 5a illustrates the potential distribution from a lateral view, depicting the pipeline in white, where it is clear that the potential is localized at the exposed defect at the bottom center of the pipeline. From these simulation results, the potential distribution on the ground surface was visualized as depicted in Figure 5b. Additionally, the ground surface potential along a path parallel to the pipeline is depicted in Figure 5c, identified as the “on-potential”. The magnitude of the DCVG signal was then determined by calculating the potential difference at various electrode spacings relative to the on-potential. This signal reflected how much current was leaking from the coating defect. Larger defects or lower soil resistivity typically generate stronger signals, which makes defects easier to detect. This approach allows the same polarization curve data to be reused or updated without the need to manually extract individual parameter values each time, thereby ensuring reproducibility.
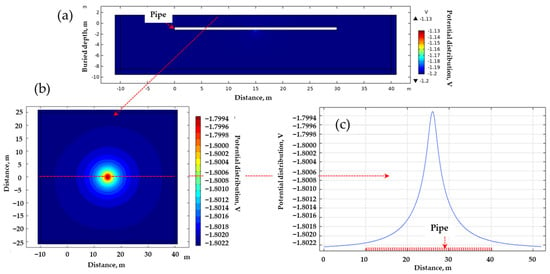
Figure 5.
Determination process of DCVG signal magnitude utilizing the electrolyte potential distribution. (a) Calculated potential distribution (cross-sectional view) ➔ (b) visualization of the potential distribution on the ground surface ➔ (c) on-potential as the ground surface potential, whose value was determined along a path parallel to the buried pipe.
Based on the simulation results for detecting non-shielded defects in buried pipelines, the DCVG signal can be calculated by determining the potential difference between the survey electrodes using the surface potential (on-potential) gradient induced by the applied voltage. In this study, the resultant DCVG signals calculated using this method are presented in Figure 6 and Figure 7.

Figure 6.
Calculated DCVG signal magnitude for non-shielded defect with different detection electrode distances from 1 m to 6 m (simulated soil resistivity: 1 kΩ·cm, exposed defect size: 100 cm2). (a) Applied voltage, 0.3 V, (b) applied voltage, 0.9 V, (c) applied voltage, 1.5 V.

Figure 7.
Calculated DCVG signal magnitude for non-shielded defect with different detection electrode distances from 1 m to 6 m (simulated soil resistivity: 1 kΩ·cm; exposed defect size: 1 cm2). (a) Applied voltage, 0.3 V, (b) applied voltage, 0.9 V, (c) applied voltage, 1.5 V.
Figure 6 presents the simulation results for detecting non-shielded defects in buried pipelines under a soil resistivity of 1 kΩ·cm and in the presence of a defect size of 100 cm2, incorporating the analysis of the detection electrode distance effect. The results showed that the presence of a non-shielded defect led to an increase in the DCVG signal as the applied voltage increased. Additionally, the DCVG signal escalated as the distance between the detection electrodes and the coating defect enlarged.
Similarly, Figure 7 illustrates the behavior of the DCVG signal under identical conditions to those in Figure 6, but with a defect size of 1 cm2. The findings indicated a comparable trend, where the DCVG signal intensified with an increase in the applied voltage. Moreover, as the detection electrode distance increased, the DCVG signal also increased.
These trends are consistent with prior experimental studies, such as Choi et al. (2023) [37], which also observed that DCVG signals increased with voltage and electrode spacing. This agreement supports the model validity in non-shielded conditions. In contrast, the signal attenuation under shielding is a novel contribution of this study.
These results show that a DCVG signal is significantly reduced in the presence of a shielding layer due to the limited current flow to the defect site. In addition to signal attenuation, shielding can lead to localized electrochemical conditions by restricting the ionic transport and reducing the cathodic protection efficiency at the defect. This may result in an increased corrosion risk despite the absence of detectable signals. Further experimental validation under controlled shielding conditions is planned to examine these electrochemical effects in detail.
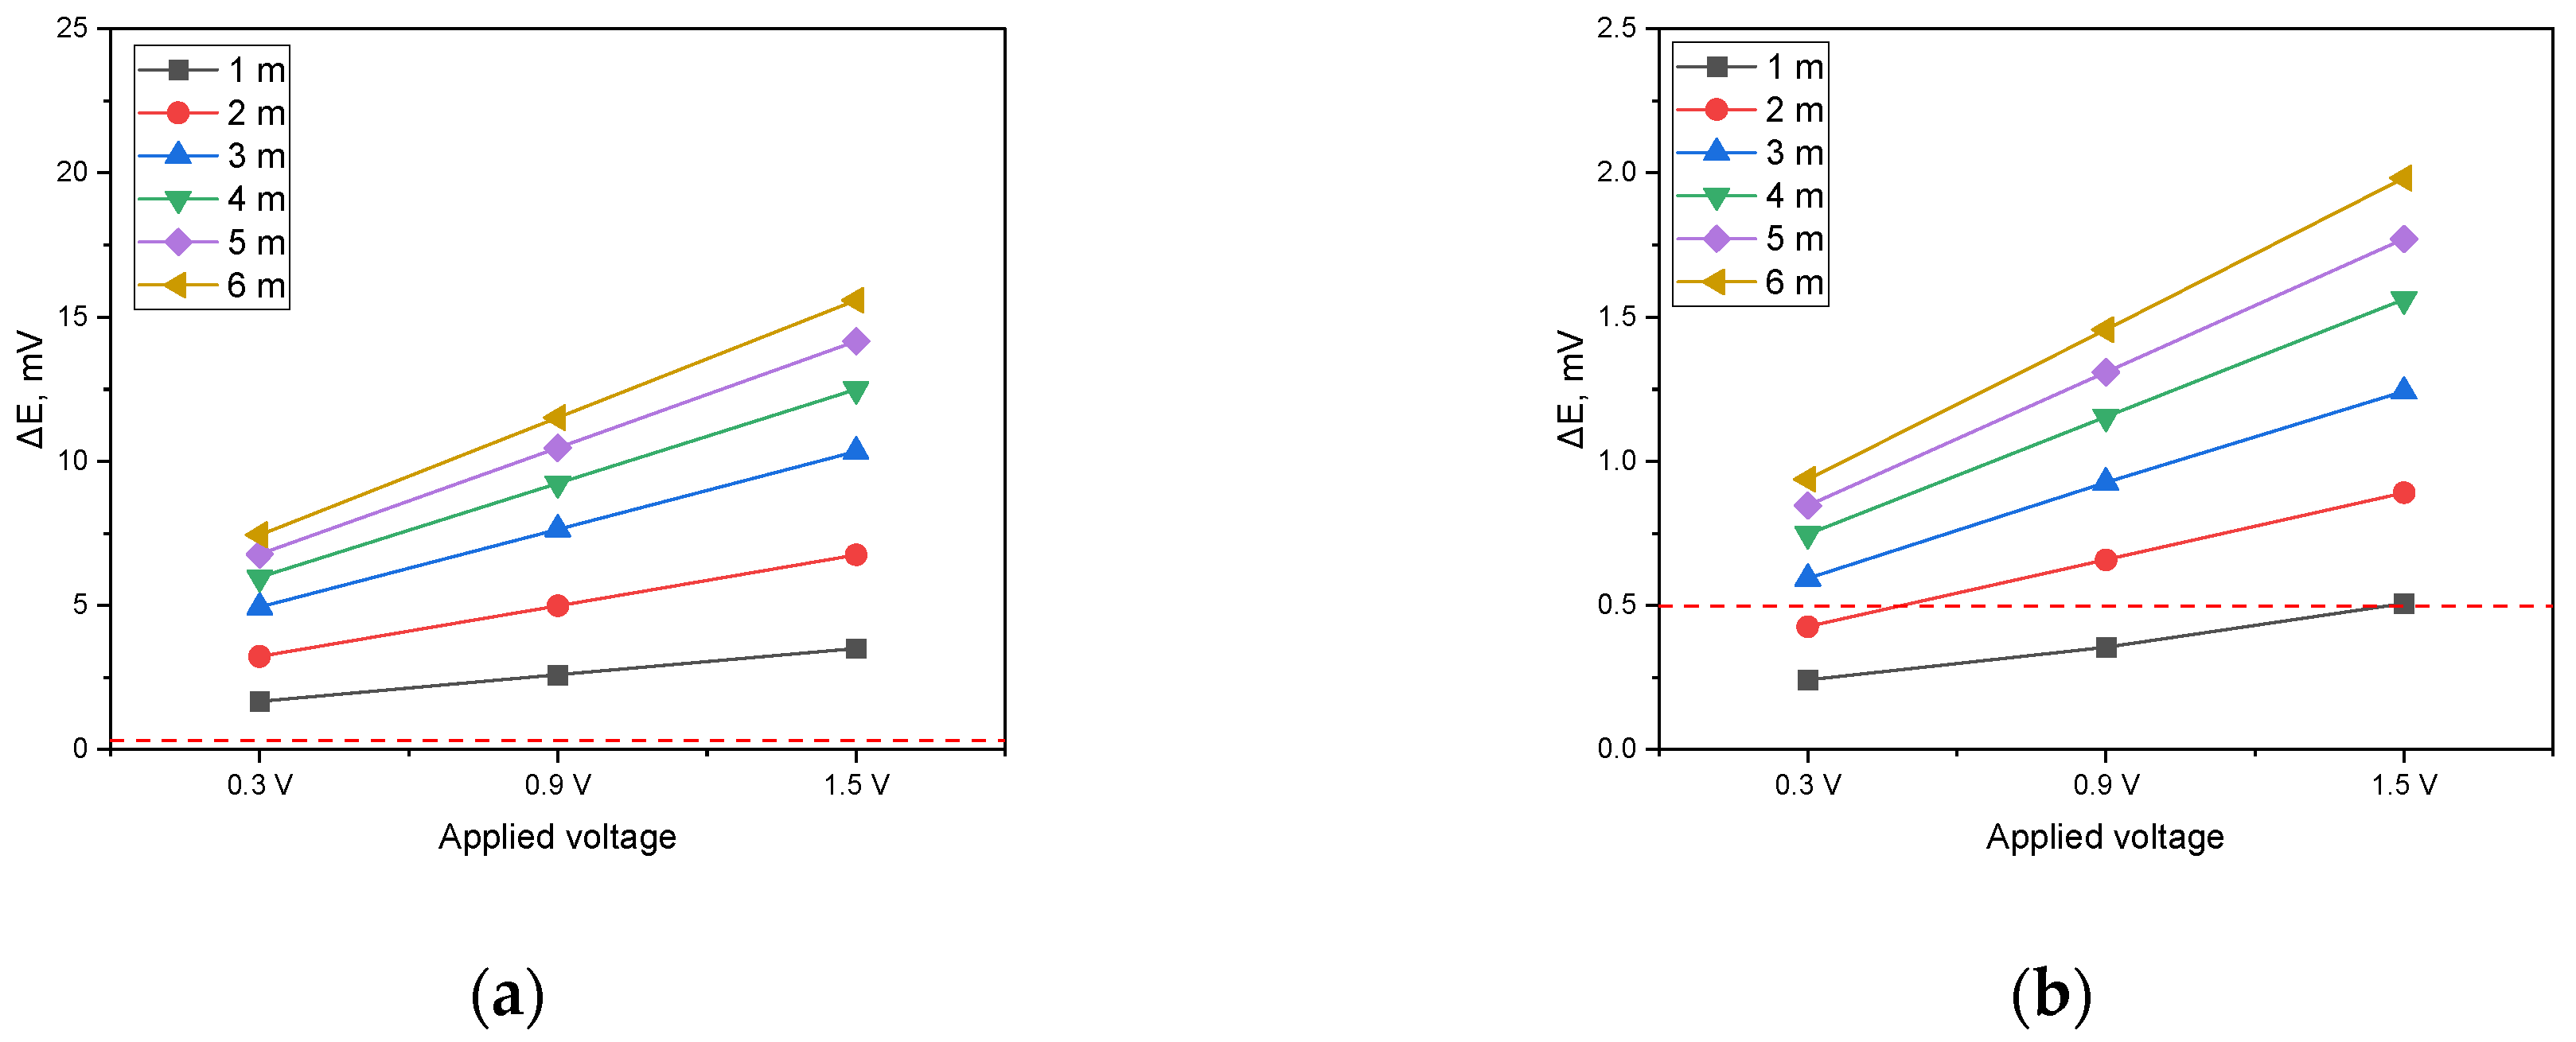
Figure 8 presents the simulation results for detecting non-shielded defects in welded pipelines under a soil resistivity of 1 kΩ·cm, illustrating the DCVG signal variations corresponding to the detection electrode distances for different defect sizes. Figure 8a presents the DCVG signal magnitude for a defect size of 100 cm2, while Figure 8b provides the results for a defect size of 1 cm2.
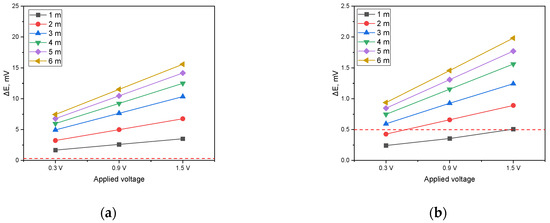
Figure 8.
Effect of applied voltage on DCVG magnitude for non-shielded conditions with varying detection electrode distances (simulated soil resistivity: 1 kΩ·cm; red dotted line represents the criteria (0.5 mV) for defect detection). (a) Exposed coating defect: 100 cm2, (b) exposed coating defect: 1 cm2.
When the DCVG defect detection threshold was defined as 0.5 mV, it was confirmed that for a defect size of 100 cm2, defect detection remained effective regardless of the detection electrode distance and the applied voltage. This revealed that for relatively large defects, sufficient signal magnitude is secured under various testing conditions, facilitating defect detection. In contrast, for a defect size of 1 cm2 and a detection electrode distance of 1 m, detection proved difficult, independent of the applied voltage. This phenomenon is due to the localized nature of the current distribution as the defect size decreases, which subsequently results in a lower potential difference on the ground surface. Moreover, when the detection electrode distance exceeded 3 m, the DCVG signal surpassed the threshold value of 0.5 mV in all applied voltage scenarios. This effect can be interpreted as an increment in signal intensity caused by an expanded distribution of the potential difference across a larger area as the electrode distance increases [37]. However, employing a large detection electrode distance may introduce practical constraints in field applications, potentially complicating the accurate identification of small defects during actual surveys.
DCVG simulation in the shielded condition. Figure 9 presents the simulation model designed to detect shielded defects in buried pipelines. The model depicts a pipeline with a welded joint at the longitudinal center, where a shielded defect formed due to coating disbond at the weld (Figure 1). Aside from the defect area, all regions were assumed to be insulated with a protective coating. The defect was modeled as a region where the coating was either detached or wrinkled at the bottom of the pipeline (6 o’clock position) due to shear stress imposed by the surrounding soil or welding quality issues, exposing the pipeline to the electrolyte. The sizes of the exposed defects due to coating disbond were set to both 100 cm2 and 1 cm2 in the simulation model, permitting the analysis of these conditions. Additionally, soil resistivities of 1, 10, and 19 kΩ·cm were used to evaluate the detection of shielded defects under diverse soil conditions.

Figure 9.
Geometry for simulating the screening defect caused by coating disbonding at the welded joint of the pipe.
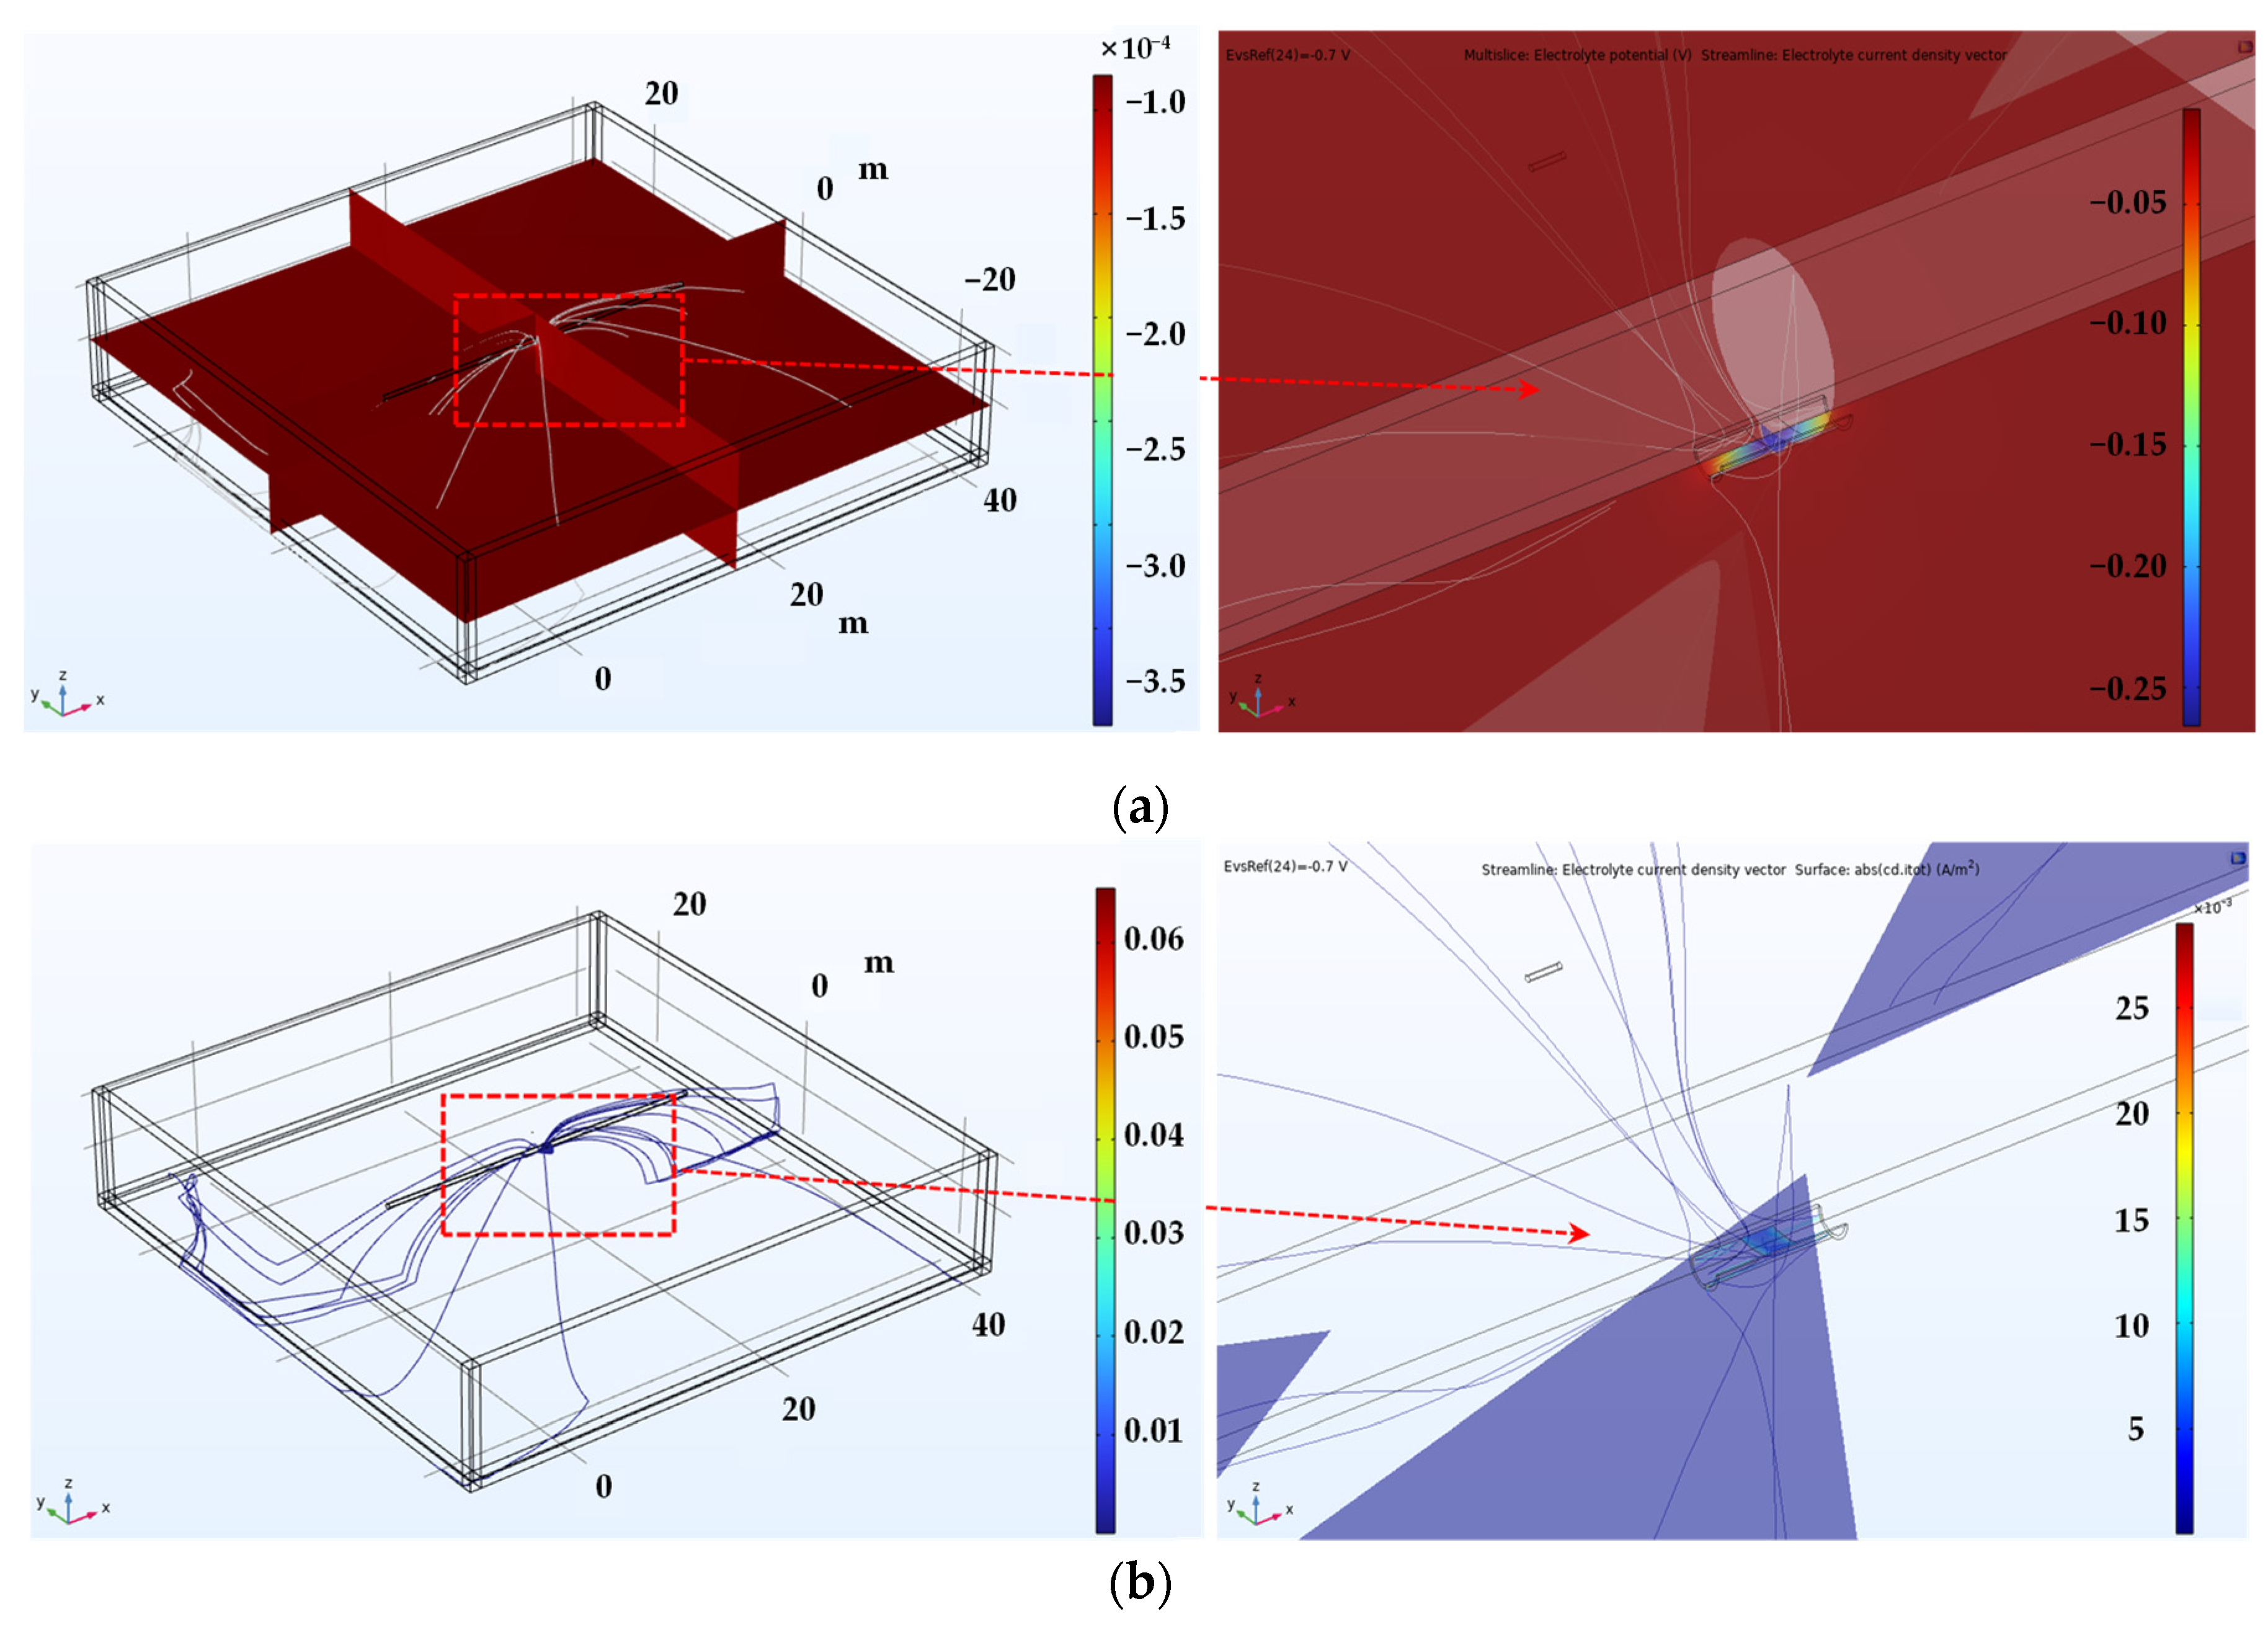
Figure 10 illustrates the 3D simulation results for detecting shielded defects at the pipeline weld. Figure 10a depicts the potential distribution within the electrolyte, where an increase in potential at the exposed defect area is evident in both the full image on the left and the magnified view on the right. Figure 10b displays the current density distribution within the electrolyte, indicating that the current density is concentrated at the exposed defect caused by the coating disbond, as visible in both the full and the magnified images.
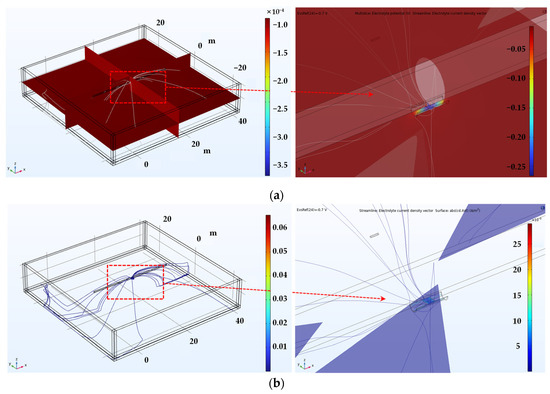
Figure 10.
Shown are the 3D simulation results of the inspection of the screening defect at the welded joint of the pipe. (a) Potential distribution in the electrolyte, (b) current density distribution in the electrolyte.
The DCVG signal was calculated using the method described in Figure 5, and the results were analyzed to evaluate the effectiveness of the simulations in detecting shielded defects. The DCVG signal was determined by computing the potential difference at the detection electrode distance, utilizing the surface potential (on-potential) gradient induced by the applied voltage. From this, the characteristics of the detection signal were assessed. Figure 11, Figure 12 and Figure 13 present the simulation results when detecting shielded defects under varying soil resistivity conditions, comparing the changes in DCVG signal with variations in detection electrode distance and applied voltage.

Figure 11.
Calculated DCVG signal magnitude under shielded conditions with different detection electrode distances from 1 m to 6 m (simulated soil resistivity: 1 kΩ·cm; exposed defect size: 100 cm2). (a) Applied voltage, 0.3 V, (b) applied voltage, 0.9 V, (c) applied voltage, 1.5 V.

Figure 12.
Calculated DCVG signal magnitude under shielded conditions with different detection electrode distances from 1 m to 6 m (simulated soil resistivity: 10 kΩ·cm; exposed defect size: 100 cm2). (a) Applied voltage, 0.3 V, (b) applied voltage, 0.9 V, (c) applied voltage, 1.5 V.

Figure 13.
Calculated DCVG signal magnitude under shielded conditions with different detection electrode distances from 1 m to 6 m (simulated soil resistivity: 19 kΩ·cm; exposed defect size: 100 cm2). (a) Applied voltage, 0.3 V, (b) applied voltage, 0.9 V, (c) applied voltage, 1.5 V.
Figure 11 illustrates the simulation results when detecting shielded defects in a buried pipeline under a soil resistivity of 1 kΩ·cm and a defect size of 100 cm2. The analysis indicated that the presence of a shielded defect led to an increase in the applied voltage, which correspondingly increased the DCVG signal. Additionally, as the detection electrode distance increased relative to the coating defect, the DCVG signal also increased.
Figure 12 presents the simulation results for a soil resistivity of 10 kΩ·cm and a defect size of 100 cm2. The results demonstrate that as the applied voltage increased, the DCVG signal magnitude also increased, and as the detection electrode distance increased, the DCVG signal exhibited an increasing trend.
Figure 13 presents the simulated DCVG response for a defect measuring 100 cm2 in a high-resistivity environment (19 kΩ·cm). The results indicate that in high-resistivity conditions, the DCVG signal exhibited reduced sensitivity and a diminished variation in magnitude. Despite the reduced sensitivity, the DCVG signal increased consistently with higher applied voltage. Additionally, variations in signal strength became more apparent as the detection electrode distance increased.
Figure 14 presents a graph that displays the variation in DCVG signal magnitude as a function of the applied voltage for a pipeline with an exposed defect size of 100 cm2. The graph in Figure 14a corresponds to a soil resistivity of 1 kΩ·cm, that in Figure 14b to a soil resistivity of 10 kΩ·cm, and that in Figure 14c to a soil resistivity of 19 kΩ·cm. Additionally, the variations in the DCVG signal due to increasing detection electrode distances were compared.

Figure 14.
Effect of applied voltage on DCVG magnitude for shielded condition with various detection electrode distances (red dotted line indicates the criteria (0.5 mV) for defect detection; exposed defect size: 100 cm2). (a) Simulated soil resistivity: 1 kΩ·cm, (b) simulated soil resistivity: 10 kΩ·cm, (c) simulated soil resistivity: 19 kΩ·cm).
The analysis was performed by establishing a DCVG defect detection threshold of 0.5 mV. As shown in Figure 14a (1 kΩ·cm), when the applied voltage was set to 0.3 V, a minimum detection electrode distance of 3 m was required for the signal to surpass the threshold. However, at increased voltages of 0.9 V and 1.5 V, the signal exceeded the threshold at all detection electrode distances, confirming that defect detection was feasible under these conditions. In Figure 14b (10 kΩ·cm), a detection electrode distance of at least 5 m was necessary when the applied voltage was 0.3 V. As the applied voltage increased to 0.9 V, a minimum distance of 2 m was required to achieve successful detection. At 1.5 V, the signal consistently surpassed the threshold regardless of the detection electrode distance, ensuring reliable defect identification. In Figure 14c (19 kΩ·cm), the signal did not exceed the threshold at any detection electrode distance when the applied voltage was 0.3 V. However, when the voltage was raised to 0.9 V, a detection electrode distance of at least 4 m was required for the signal to reach the threshold. At an applied voltage of 1.5 V, a minimum distance of 2 m was necessary to achieve a detectable signal.
These findings suggest that as soil resistivity increases, higher applied voltages are required to obtain a detectable signal and the detection electrode distance must be carefully optimized for effective defect detection. In particular, for a soil resistivity of 19 kΩ·cm, maintaining a sufficiently high applied voltage and an appropriately large detection electrode distance is essential to ensure successful DCVG signal identification.
Figure 15, Figure 16 and Figure 17 present the simulation results when detecting shielded defects measuring 1 cm2 under soil resistivity of 1 kΩ·cm, 10 kΩ·cm, and 19 kΩ·cm, respectively. The influence of detection electrode distance and applied voltage on the DCVG signal was analyzed.

Figure 15.
Calculated DCVG signal magnitude under shielded conditions with different detection electrode distances from 1 m to 6 m (simulated soil resistivity: 1 kΩ·cm; exposed defect size: 1 cm2). (a) Applied voltage, 0.3 V, (b) applied voltage, 0.9 V, (c) applied voltage, 1.5 V.

Figure 16.
Calculated DCVG signal magnitude under shielded conditions with different detection electrode distances from 1 m to 6 m (simulated soil resistivity: 10 kΩ·cm; exposed defect size: 1 cm2). (a) Applied voltage, 0.3 V, (b) applied voltage, 0.9 V, (c) applied voltage, 1.5 V.

Figure 17.
Calculated DCVG signal magnitude under shielded conditions with different detection electrode distances from 1 m to 6 m (simulated soil resistivity: 19 kΩ·cm; exposed defect size: 1 cm2). (a) Applied voltage, 0.3 V, (b) applied voltage, 0.9 V, (c) applied voltage, 1.5 V.
Figure 15 illustrates the simulation findings when detecting shielded defects in a buried pipeline with a soil resistivity of 1 kΩ·cm and a defect size of 1 cm2. The results demonstrate that when a shielded defect was present, an increase in applied voltage led to a corresponding rise in the DCVG signal. Moreover, as the detection electrode distance expanded, the DCVG signal strength also increased.
Figure 16 presents the simulation results for a soil resistivity of 10 kΩ·cm and a defect size of 1 cm2. The findings indicate that at lower applied voltages, the DCVG signal sensitivity diminished, resulting in a minimal variation in signal magnitude. However, as the applied voltage increased, a substantial rise in the DCVG signal was observed, along with noticeable variations associated with an increasing detection electrode distance.
Figure 17 displays the simulation results for a soil resistivity of 19 kΩ·cm and a defect size of 1 cm2. The analysis suggested that in high-resistivity environments, the sensitivity of the DCVG signal was significantly reduced. Additionally, at applied voltages below 1.5 V, the signal magnitude remained relatively low, making defect detection more challenging.
Figure 18 illustrates the variation in the DCVG signal as a function of applied voltage for a buried pipeline with a shielded defect of 1 cm2. The graph in Figure 18a corresponds to a soil resistivity of 1 kΩ·cm, that in Figure 18b to a soil resistivity of 10 kΩ·cm, and that in Figure 18c to a soil resistivity of 19 kΩ·cm. Additionally, the variations in the DCVG signal due to an increasing detection electrode distance were analyzed.

Figure 18.
Effect of applied voltage on DCVG magnitude for the shielded condition with varying detection electrode distances (red dotted line indicates the criteria (0.5 mV) for defect detection; exposed defect size: 1 cm2). (a) Simulated soil resistivity: 1 kΩ·cm, (b) simulated soil resistivity: 10 kΩ·cm, (c) simulated soil resistivity: 19 kΩ·cm).
The assessment was carried out by setting the DCVG defect detection threshold at 0.5 mV. In Figure 18a (1 kΩ·cm), when the applied voltage was 0.3 V, the signal remained below the threshold, irrespective of the detection electrode distance. At an applied voltage of 0.9 V, a detection electrode distance of at least 3 m was necessary for the signal to exceed the threshold. At 1.5 V, the signal exceeded the threshold when the detection electrode distance was at least 2 m. Conversely, under soil resistivity of 10 kΩ·cm (Figure 18b) and 19 kΩ·cm (Figure 18c), the DCVG signals did not exceed the threshold at any detection electrode distance, suggesting that detecting defects is impractical under these conditions. The DCVG signal decreased significantly under the shielded conditions, especially when the defect was small, or the soil resistivity was high. These findings suggest that the simulation model can be utilized as a pre-inspection tool for DCVG-based surveys. By analyzing how signal magnitude varies with electrode spacing, applied voltage, and shielding conditions, the results may aid in the optimization of the inspection parameters and help field engineers in interpreting ambiguous signals, especially in high-resistivity soils or partially shielded environments.
Comparison between non-shielded and shielded conditions. Figure 19 presents a comparative analysis of the DCVG signals for non-shielded and shielded defects with a size of 100 cm2 under a soil resistivity of 1 kΩ·cm. Each graph illustrates the DCVG signal magnitudes based on applied voltage (0.3 V, 0.9 V, 1.5 V) and detection electrode distance (1 m, 3 m, 6 m), allowing for a direct comparison between non-shielded and shielded conditions. Table 1 shows a comparison of the DCVG signal magnitudes for non-shielded and shielded defects.

Figure 19.
Shielding effect on DCVG signal magnitude by applied voltage for different detection electrode distances (simulated soil resistivity 1 kΩ·cm; exposed coating defect 100 cm2, red dotted line indicates the criteria (0.5 mV) for defect detection). (a) Applied voltage, 0.3 V, (b) applied voltage, 0.9 V, (c) applied voltage, 1.5 V.

Table 1.
The DCVG signal magnitudes under different conditions.
Figure 19a shows that under an applied voltage of 0.3 V, the DCVG signal for the non-shielded defect increased with the detection electrode distance, peaking at 7.45 mV at 6 m. In contrast, for the shielded defect, the DCVG signal remained below the detection threshold (0.5 mV) at all distances except for that of 6 m, suggesting that defect detection may be challenging under these conditions. In this study, a detection threshold of 0.5 mV was defined to evaluate defect detectability. This value was determined based on the measurement error of the DCVG instruments under field noise conditions and the results of repeated simulations under the same conditions.
Figure 19b illustrates the DCVG signal behavior under an applied voltage of 0.9 V. For the non-shielded defect, the signal increased with the detection electrode distance, reaching 2.8 mV at 1 m, 7.84 mV at 3 m, and 11.52 mV at 6 m, all of which exceeded the detection threshold, ensuring feasible defect detection. For the shielded defect, the DCVG signal was 0.16 mV at 1 m, remaining below the threshold, but increased to 0.79 mV at 3 m and 1.25 mV at 6 m, surpassing the threshold and allowing for detection.
Figure 19c presents the DCVG signal at an applied voltage of 1.5 V. For the non-shielded defect, the signal magnitude increased consistently with the detection electrode distance, reaching a maximum of 15.58 mV at 6 m, confirming the feasibility of detection under all tested conditions. In the case of the shielded defect, the signal increased to 1.26 mV at 3 m and 1.9 mV at 6 m, exceeding the threshold. However, at 1 m, the signal remained relatively low at 0.24 mV, indicating that detection may be difficult at this distance.
Figure 20 compares the DCVG signals for non-shielded and shielded defects with a size of 1 cm2 under a soil resistivity of 1 kΩ·cm. Figure 20a reveals that for the non-shielded defect, the DCVG signal increased with the detection electrode distance, reaching 0.94 mV at 6 m. At 3 m, the signal was 0.59 mV, exceeding the threshold, which supports the feasibility of detection. In contrast, for the shielded defect, the DCVG signal remained below the threshold at all electrode distances, suggesting that detection was unlikely.

Figure 20.
Shielding effect on DCVG signal magnitude by applied voltage for different detection electrode distances (simulated soil resistivity 1 kΩ·cm; exposed coating defect 1 cm2, red dotted line indicates the criteria (0.5 mV) for defect detection). (a) Applied voltage, 0.3 V, (b) applied voltage, 0.9 V, (c) applied voltage, 1.5 V.
Figure 20b illustrates the DCVG signal at an applied voltage of 0.9 V. For the non-shielded defect, the DCVG signal increased with the detection electrode distance, reaching 0.38 mV at 1 m, 0.93 mV at 3 m, and 1.46 mV at 6 m. Detection was feasible at distances of 3 m or more. However, for the shielded defect, the DCVG signal consistently remained below the threshold at all detection electrode distances, making detection challenging.
Figure 20c presents the DCVG signal at an applied voltage of 1.5 V. For the non-shielded defect, the signal increased with the detection electrode distance, reaching 1.98 mV at 6 m, enabling detection at all distances. Conversely, for the shielded defect, the DCVG signal remained below the threshold at all detection electrode distances, with recorded values of 0.11 mV at 1 m, 0.25 mV at 3 m, and 0.34 mV at 6 m, implying that defect detection was difficult.
To further investigate the significant reduction in the DCVG signals for shielded defects compared to non-shielded defects under identical applied voltages, a cross-sectional potential distribution analysis was conducted through simulations, as shown in Figure 21.

Figure 21.
Cross-sectional potential distribution around coating defect under (a) non-shielded condition and (b) shielded condition.
Figure 21 illustrates the simulated cross-sectional potential distribution for shielded and non-shielded coating defects in a buried pipeline. Figure 21a represents the distribution for a non-shielded defect, while Figure 21b shows the distribution for a shielded defect. In the case of the non-shielded defect, the potential was widely distributed throughout the surrounding soil (blue regions). Conversely, for the shielded defect, potential variations were confined within the shielded region, with minimal distribution into the surrounding soil.
These results confirmed that in the presence of shielded defects, the non-conductive space created by coating disbond restricts the flow of the survey current, significantly reducing the sensitivity of DCVG signals. This finding suggests that while the DCVG technique is effective for detecting non-shielded defects, its capability may be limited for shielded defects due to weakened detection signals. This trend is consistent with field reports, including that of Choi et al. [37], where shielding reduced signal detectability despite the presence of active corrosion. Such consistency supports the validity of the simulation model.
4. Conclusions
Coating defects in buried pipelines can lead to corrosion, and coating disbond, in particular, may create a gap between the pipeline and the surrounding soil, potentially attenuating the DCVG inspection signal. This study investigated the shielding effect of rubber lining on the detection of coating defects using the DCVG method through numerical simulations, leading to the following conclusions:
- The DCVG detection signal increases with decreasing soil resistivity, increasing defect size, and greater detection electrode distance. This trend is primarily attributed to the enhanced distribution of the inspection current under these conditions. The simulation results indicated that non-shielded coating defects were detectable under most conditions using the DCVG method. This is because the absence of insulating material allows the inspection current to easily escape, creating a stronger signal.
- The simulation results indicated that non-shielded defects were detectable under most conditions using the DCVG method. However, for shielded defects, neither increasing the applied voltage nor extending the detection electrode distance sufficiently improved detection feasibility, resulting in a weak defect signal that made detection challenging. Specifically, the DCVG signal for shielded defects was significantly lower than that for non-shielded defects, and as the defect size decreased, the signal further diminished, making detection increasingly difficult. This phenomenon is attributed to the insulating shielding layer surrounding the defect, which impedes the flow of the inspection current, thereby weakening the DCVG signal.
5. Limitations and Future Work
This study was limited to stationary simulations under homogeneous soil conditions without considering transient behaviors or soil heterogeneity. The simulation model has not yet been experimentally validated, particularly under shielding conditions.
In future work, the simulation model will be experimentally validated using a laboratory-scale DCVG setup under both shielded and non-shielded conditions. This will be accompanied by the analysis of electrochemical effects such as limited ion transport and localized corrosion risks in shielded defects. Additionally, environmental factors such as soil moisture and temperature, as well as comparisons with other detection methods, will be considered to improve the model’s field applicability.
Author Contributions
Conceptualization, Y.-R.Y.; methodology, B.-T.L. and S.-H.C.; investigation, S.-H.C. and K.-T.K.; data curation and analysis, S.-H.C., Y.-R.Y., and B.-T.L.; writing—original draft preparation, S.-H.C., K.-T.K., and Y.-R.Y.; writing—review and editing, Y.-C.K., D.-Y.L., and Y.-S.K.; supervision, Y.-S.K. All authors have read and agreed to the published version of the manuscript.
Funding
This work was supported by the Korea Institute of Energy Technology Evaluation and Planning (KETEP) and the Ministry of Trade, Industry & Energy (MOTIE) of the Republic of Korea (No. RS-2021-KP002617).
Institutional Review Board Statement
Not applicable.
Informed Consent Statement
Not applicable.
Data Availability Statement
The original contributions presented in this study are included in the article. Further inquiries can be directed to the corresponding author.
Conflicts of Interest
Authors Ki-Tae Kim, Bu-Teak Lim, Dae-Young Lee were employed by the company KEPCO Engineering & Construction Company. The remaining authors declare that the research was conducted in the absence of any commercial or financial relationships that could be construed as a potential conflict of interest.
References
- Mgonja, C.T. The Impacts of corrosion in weld joints and surfaces of oil and gas pipelines: A Review. Int. J. Eng. Trends Technol. 2017, 52, 99–108. [Google Scholar] [CrossRef]
- Berrouane, M.T.; Khan, F.; Hawboldt, K.; Eckert, R.; Skovhus, T.L. Model for microbiologically influenced corrosion potential assessment for the oil and gas industry. Corros. Eng. Sci. Technol. 2018, 53, 378–392. [Google Scholar] [CrossRef]
- Cole, I.S.; Marney, D. The science of pipe corrosion: A review of the literature on the corrosion of ferrous metals in soils. Corros. Sci. 2012, 56, 5–16. [Google Scholar] [CrossRef]
- Biase, L.D.; Cigna, R.; Fumei, O. A new technique for locating coating faults on buried metallic pipelines. Adv. Mater. Res. 2008, 38, 113–120. [Google Scholar] [CrossRef]
- Kim, M.G.; No, H.Y.; Kim, H.G.; Lee, K.J.; Shin, C.H.; Lee, K.S.; Lee, C.J.; Jang, Y.Y. Comparison of Detection Results Based on Buried Pipe Coating Flaw Measurement Environments. J. Korean Soc. Nondestruct. Test. 2023, 43, 398–408. [Google Scholar] [CrossRef]
- Gómez, R.A.; Silva, M.S.; Arteaga, E.B.; Schoefs, F.; Muñoz, F. Reliability assessments of corroded pipelines based on internal pressure—A review. Eng. Fail. Anal. 2019, 98, 190–214. [Google Scholar] [CrossRef]
- Liu, X.; Zheng, J.; Fu, J.; Nie, Z.; Chen, G. Optimal Inspection Planning of Corroded Pipelines Using BN and GA. J. Petrol. Sci. Eng. 2018, 163, 546–555. [Google Scholar] [CrossRef]
- Seo, J.K.; Cui, Y.; Mohd, M.H.; Ha, Y.C.; Kim, B.J.; Paik, J.K. A Risk-Based Inspection Planning Method for Corroded Subsea Pipelines. Ocean. Eng. 2015, 109, 539–552. [Google Scholar] [CrossRef]
- Ossai, C.I. Advances in Asset Management Techniques: An overview of corrosion mechanisms and mitigation strategies for oil and gas pipelines. Int. Sch. Res. Netw. Corros. 2012, 2012, 570143. [Google Scholar] [CrossRef]
- Samimi, A.; Zarinabadi, S. An analysis of polyethylene coating corrosion in oil and gas pipelines. J. Am. Sci. 2011, 7, 1032–1036. [Google Scholar]
- Wasim, M.; Djukic, M.B. External corrosion of oil and gas pipelines: A review of failure mechanisms and predictive preventions. Nat. Gas Sci. Eng. 2022, 100, 104467. [Google Scholar] [CrossRef]
- Choi, S.H.; Won, S.Y.; Yoo, Y.R.; Kim, Y.S. Relationship between the Cathodic Protection of Pipe Buried in Soil and Environmental Factors. Corros. Sci. Technol. 2022, 21, 372–380. [Google Scholar] [CrossRef]
- Breton, T.; Heno, J.C.S.; Alamilla, J.L.; Ramirez, J.A. Identification of failure type in corroded pipelines: A Bayesian probabilistic approach. J. Hazard. Mater. 2010, 179, 628–634. [Google Scholar] [CrossRef] [PubMed]
- Sun, W.; Liu, G.; Wang, L.; Li, Y. A Mathematical Model for Modeling the Formation of Calcareous Deposits on Cathodically Protected Steel in Seawater. Electrochim. Acta 2012, 78, 597–608. [Google Scholar] [CrossRef]
- Chen, X.; Li, X.G.; Du, C.W.; Cheng, Y.F. Effect of Cathodic Protection on Corrosion of Pipeline Steel under Disbonded Coating. Corros. Sci. 2009, 51, 2242–2245. [Google Scholar] [CrossRef]
- Schultze, J.D.; Bohning, M.; Springer, J. Sorption and Permeation Properties of Poly(p-phenylene sulfide) Crystallized in the Presence of Sorbed Gas Molecules. Makromol. Chem. 1993, 194, 431–444. [Google Scholar] [CrossRef]
- Naito, Y.; Kamiya, Y.; Terada, K.; Mizoguchi, K.; Wang, J.-S. Pressure Dependence of Gas Permeability in a Rubbery Polymer. J. Appl. Polym. Sci. 1996, 61, 945–950. [Google Scholar] [CrossRef]
- Wasim, M.; Shoaib, S.; Mubarak, N.M.; Inamuddin; Asiri, A.M. Factors influencing corrosion of metal pipes in soils. Environ. Chem. Lett. 2018, 16, 861–879. [Google Scholar] [CrossRef]
- Li, X.; Castaneda, H. Damage evolution of coated steel pipe under cathodic-protection in soil. Anti-Corros. Methods Mater. 2017, 64, 118–126. [Google Scholar] [CrossRef]
- NACE 05166; External Corrosion Risk Management for Aged Steel Pipelines Buried in High Consequence Areas. Association for Materials Protection and Performance: Houston, TX, USA; Pittsburgh, PA, USA, 2005.
- Kowalski, A. The close interval potential survey (CIS/CIPS) method for detecting corrosion in underground pipelines. In Underground Pipeline Corrosion; Woodhead Publishing: Sawston, UK, 2014; pp. 227–246. [Google Scholar] [CrossRef]
- Masilela, Z.; Pereira, J. Using the direct current voltage gradient technology as a quality control tool during construction of new pipelines. Eng. Fail. Anal. 1998, 5, 99–104. [Google Scholar] [CrossRef]
- Lim, B.T.; Kim, M.G.; Kim, K.T.; Chang, H.Y.; Kim, Y.S. Effect of Applied Voltage on the Reliability of Coating Flaw Detection of Pipe with Different Buried Depths. Corros. Sci. Technol. 2019, 18, 277–284. [Google Scholar] [CrossRef]
- Kim, M.G.; Lim, B.T.; Kim, K.T.; Chang, H.Y.; Park, H.B.; Kim, Y.S. Enhancing the Reliability of Coating Flaw Detection for Pipes Buried in Soil Using a Multi-Electrode Detector. Corros. Sci. Technol. 2020, 19, 265–280. [Google Scholar] [CrossRef]
- Husain, A.; Chakkamalayath, J.; Al-Bahar, S. Electrochemical Impedance Spectroscopy as a Rapid Technique for Evaluating the Failure of Fusion Bonded Epoxy Powder Coating. Eng. Fail. Anal. 2017, 82, 765–775. [Google Scholar] [CrossRef]
- Jadoon, A.N.K.; Thompson, I. Fusion Bonded Epoxy Mainline and Field Joint Coatings Performance from the X100 Field Trial—A Case Study. Int. J. Press. Vessel. Pip. 2012, 92, 48–55. [Google Scholar] [CrossRef]
- Wang, Q.; Cao, X.; Wu, T.; Liu, M.; Li, C.; Yin, F. Corrosion of X80 Steel Welded Joint under Disbonded Coating in an Acidic Soil Solution. Int. J. Press. Vessel. Pip. 2021, 194, 104508. [Google Scholar] [CrossRef]
- Zhao, W.; Zou, Y.; Matsuda, K.; Zou, Z. Corrosion Behavior of Reheated CGHAZ of X80 Pipeline Steel in H2S-Containing Environments. Mater. Des. 2016, 99, 44–56. [Google Scholar] [CrossRef]
- Perdomo, J.J.; Song, I. Chemical and Electrochemical Conditions on Steel under Disbonded Coatings: The Effect of Applied Potential, Solution Resistivity, Crevice Thickness and Holiday Size. Corros. Sci. 2000, 42, 1389–1415. [Google Scholar] [CrossRef]
- Wang, W.; Shen, K.; Yi, J.; Wang, Q. A Mathematical Model of Crevice Corrosion for Buried Pipeline with Disbonded Coatings under Cathodic Protection. J. Loss Prev. Process Ind. 2016, 41, 270–281. [Google Scholar] [CrossRef]
- Varela, F.; Tan, M.Y.J.; Forsyth, M. Understanding the Effectiveness of Cathodic Protection under Disbonded Coatings. Electrochim. Acta 2015, 186, 377–390. [Google Scholar] [CrossRef]
- Yan, M.; Wang, J.; Han, E.; Ke, W. Local Environment under Simulated Disbonded Coating on Steel Pipelines in Soil Solution. Corros. Sci. 2008, 50, 1331–1339. [Google Scholar] [CrossRef]
- NACE International. Pipeline External Corrosion Direct Assessment (External DA): Methodology; NACE RP0502-2002; NACE International: Houston, TX, USA, 2002. [Google Scholar]
- Analysis of Pipeline Steel Corrosion Data from NBS (NITS) Studies Conducted Between 1922–1940 and Relevance to Pipeline Management; (NISTIR 7415, 2 May 2007); Nation Institute of Standards and Technology: Gaithersburg, MD, USA, 2007.
- Evaluation of External Corrosion-Rate Using Polarization Resistance and Soil Properties, GTI Project No. 20753; Gas Technology Institute: Des Plaines, IL, USA, 2010.
- ASTM G5-2004; Standard Reference Test Method for Making Potentiostatic and Potentiodynamic Anodic Polarization Measure ments. ASTM International: West Conshohocken, PA, USA, 2004.
- Choi, S.H.; Yoo, Y.R.; Kim, Y.S. Effect of Electrode Spacing on the Detection of Coating Defects in Buried Pipelines Using Direct Current Voltage Gradient Method. Coatings 2023, 13, 1471. [Google Scholar] [CrossRef]
Disclaimer/Publisher’s Note: The statements, opinions and data contained in all publications are solely those of the individual author(s) and contributor(s) and not of MDPI and/or the editor(s). MDPI and/or the editor(s) disclaim responsibility for any injury to people or property resulting from any ideas, methods, instructions or products referred to in the content. |
© 2025 by the authors. Licensee MDPI, Basel, Switzerland. This article is an open access article distributed under the terms and conditions of the Creative Commons Attribution (CC BY) license (https://creativecommons.org/licenses/by/4.0/).

