
Experimental and Numerical Studies on the Tribological Properties of Bearing Steel 20GrNi2MoV Against W2Mo9Cr4VCo8 Steel Under Dry Sliding Process

Abstract
:1. Introduction
2. Experiment and Finite Element Simulation
2.1. Materials
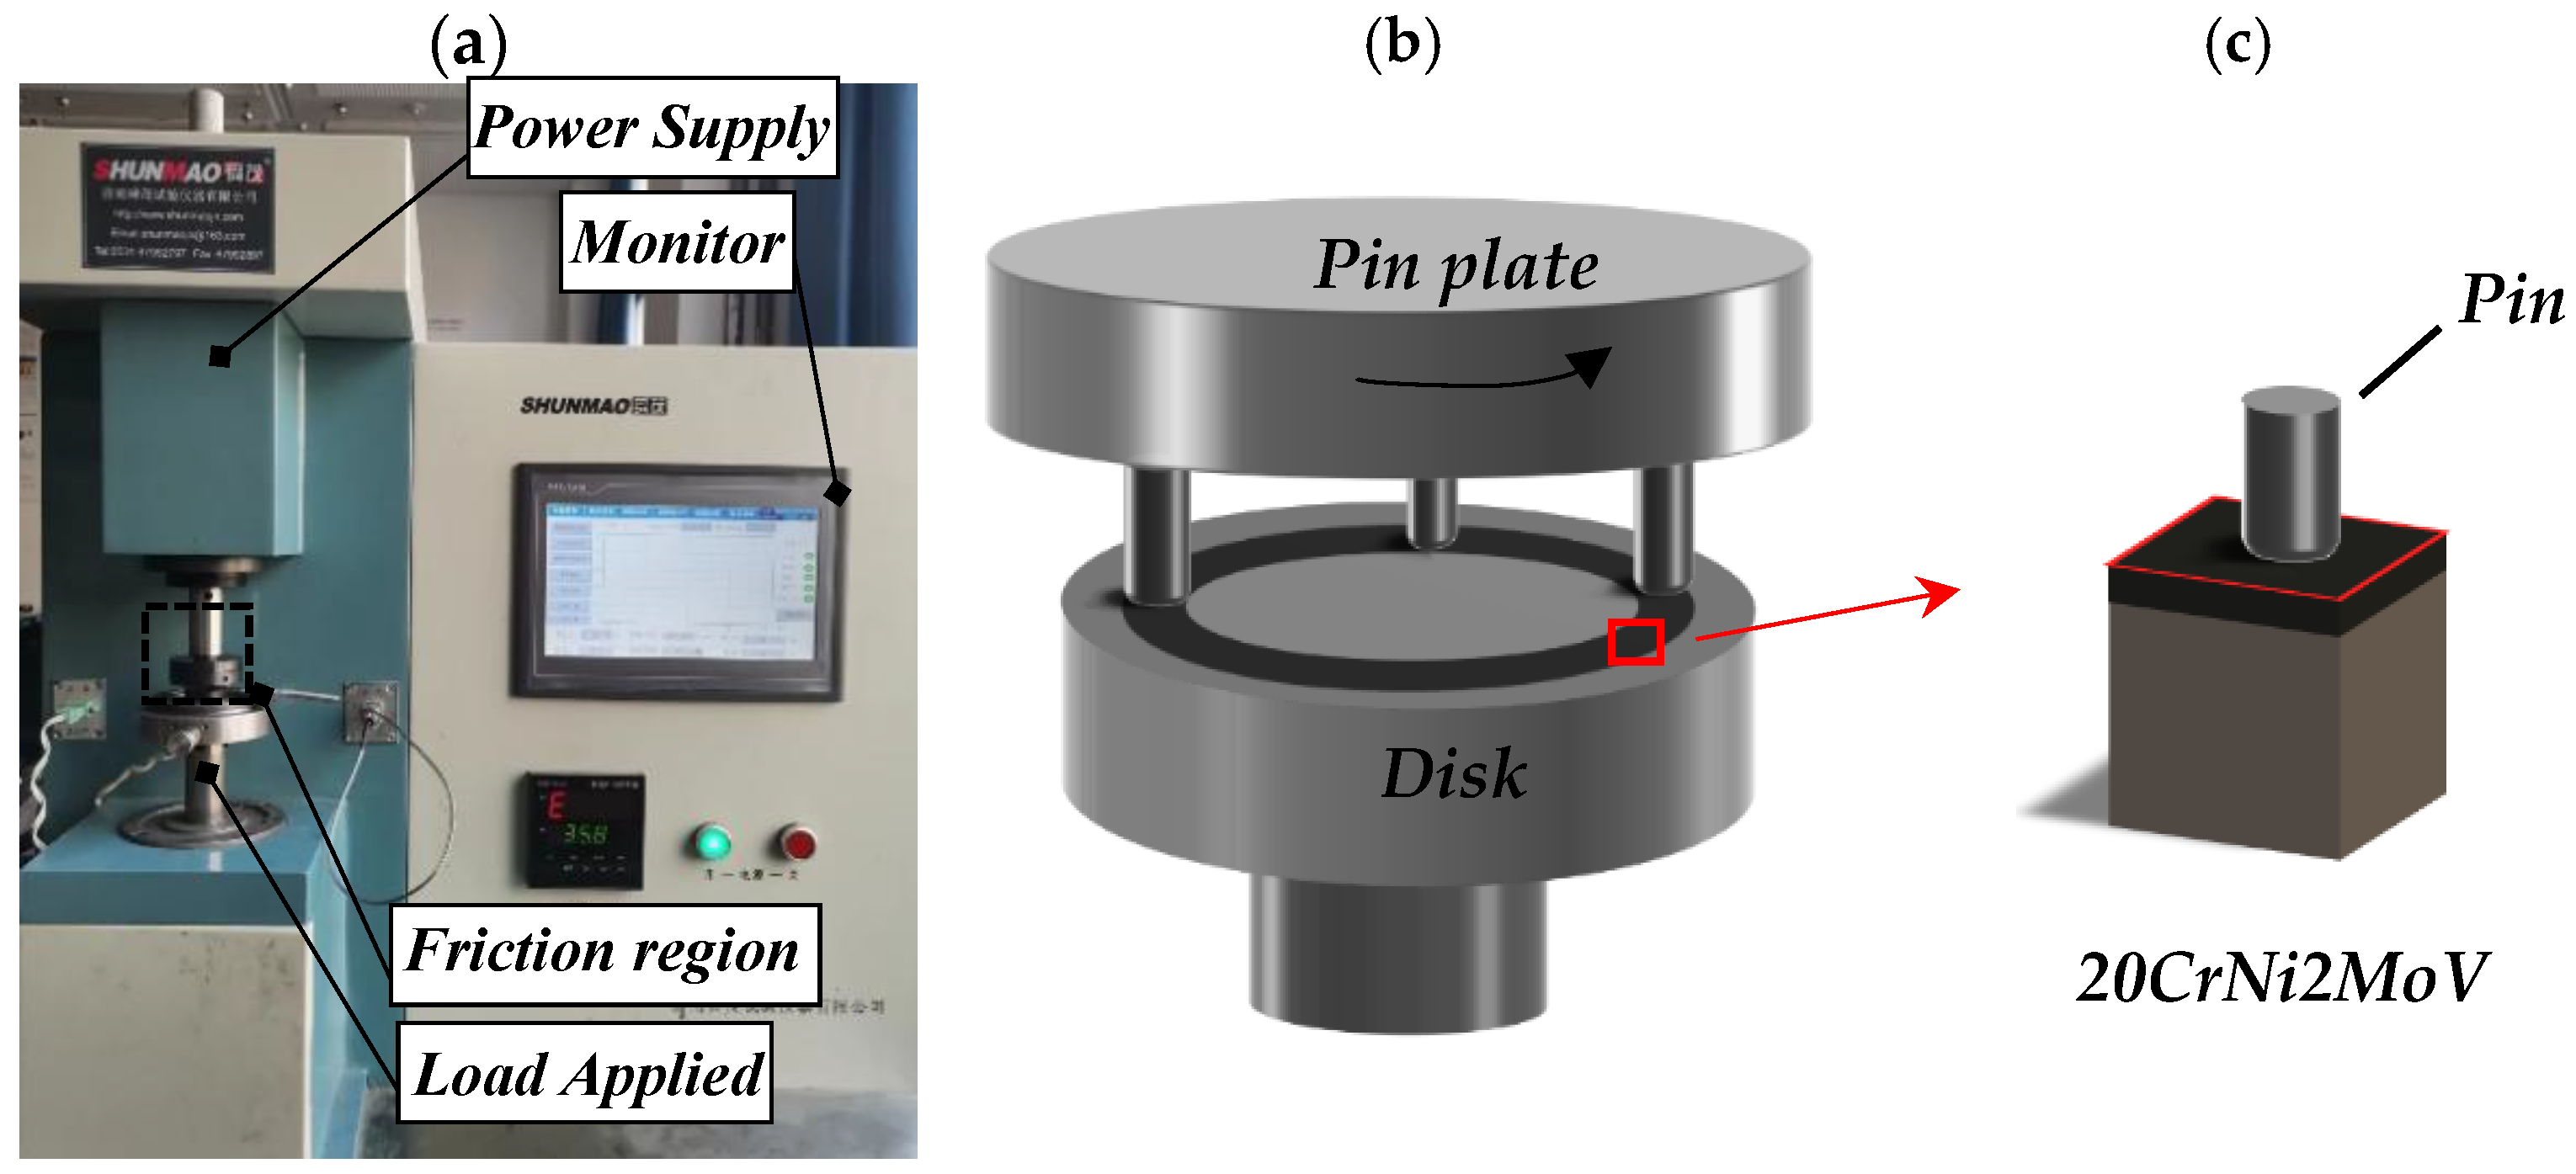
2.2. Experimental Procedure
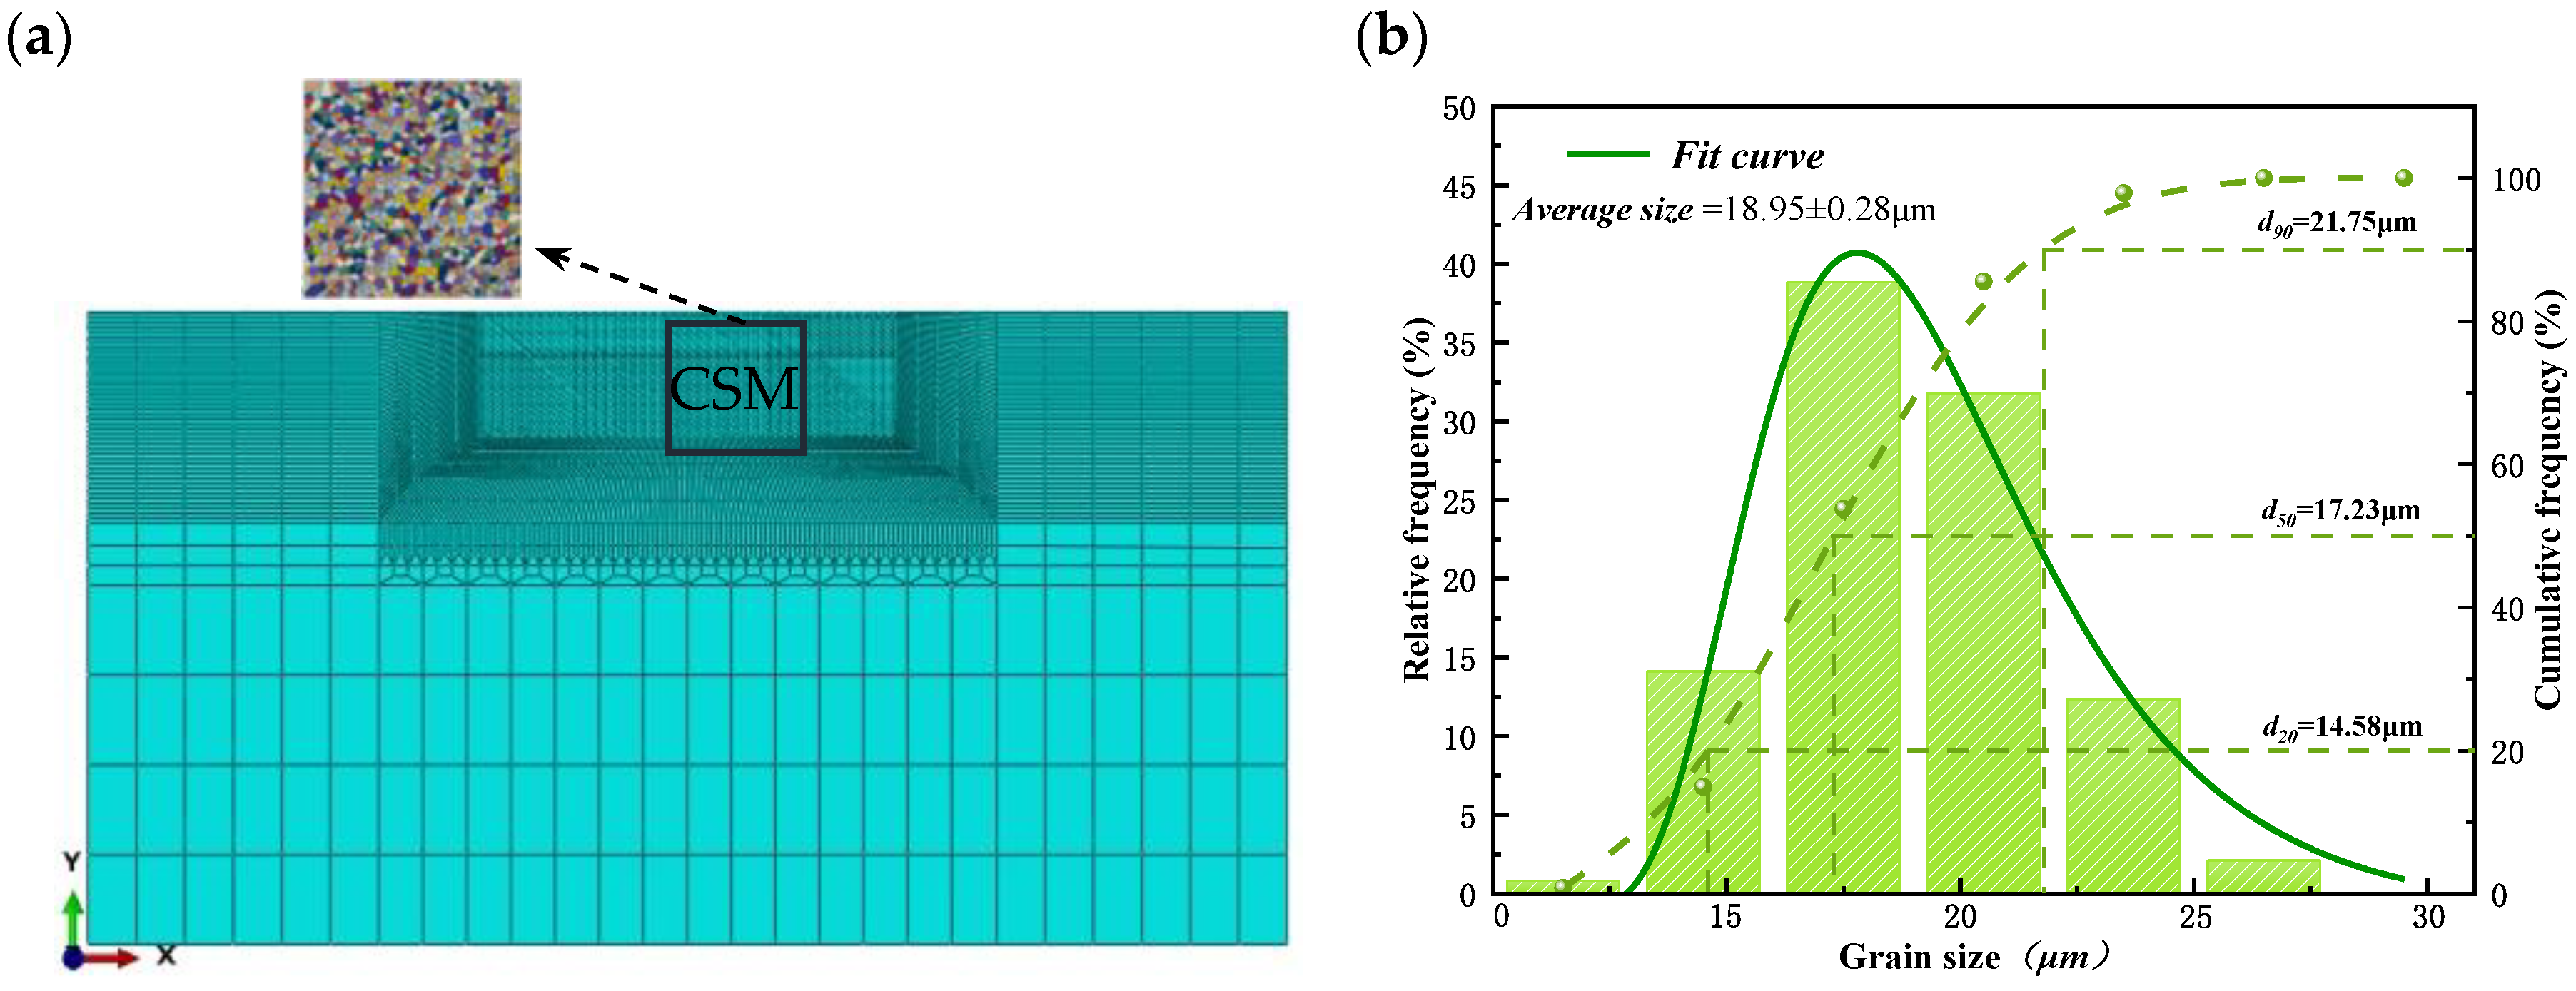
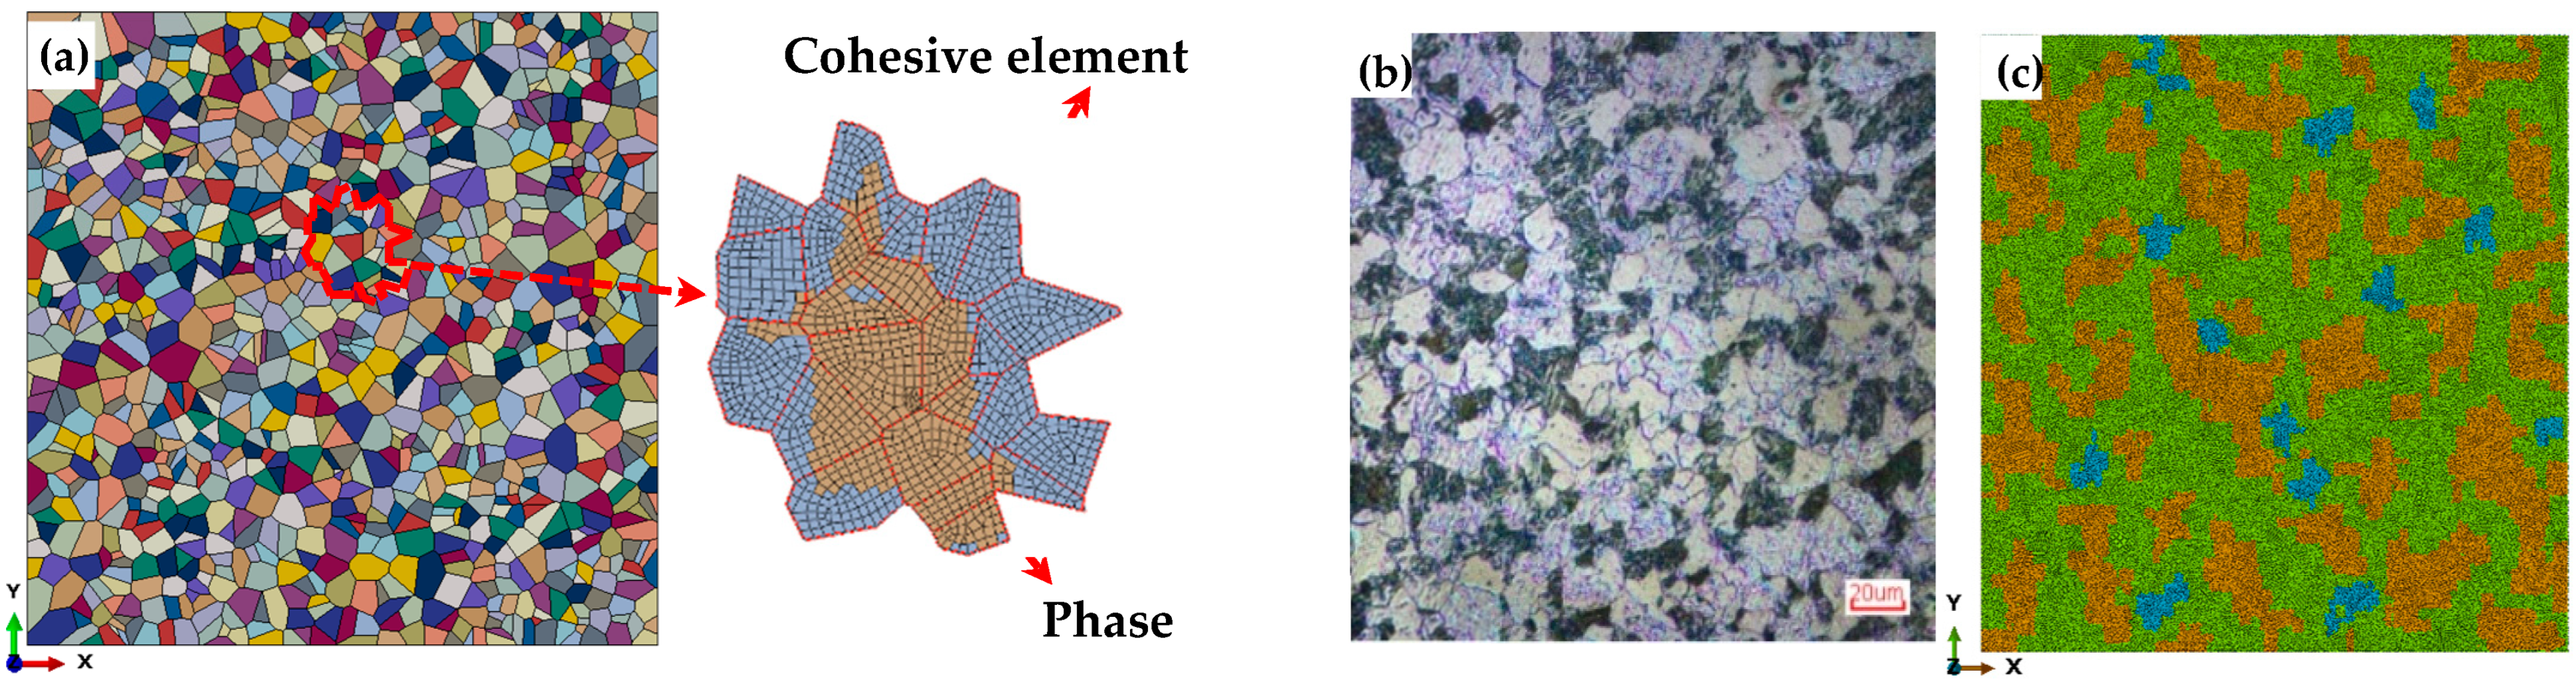
2.3. Finite Element Model
3. Results
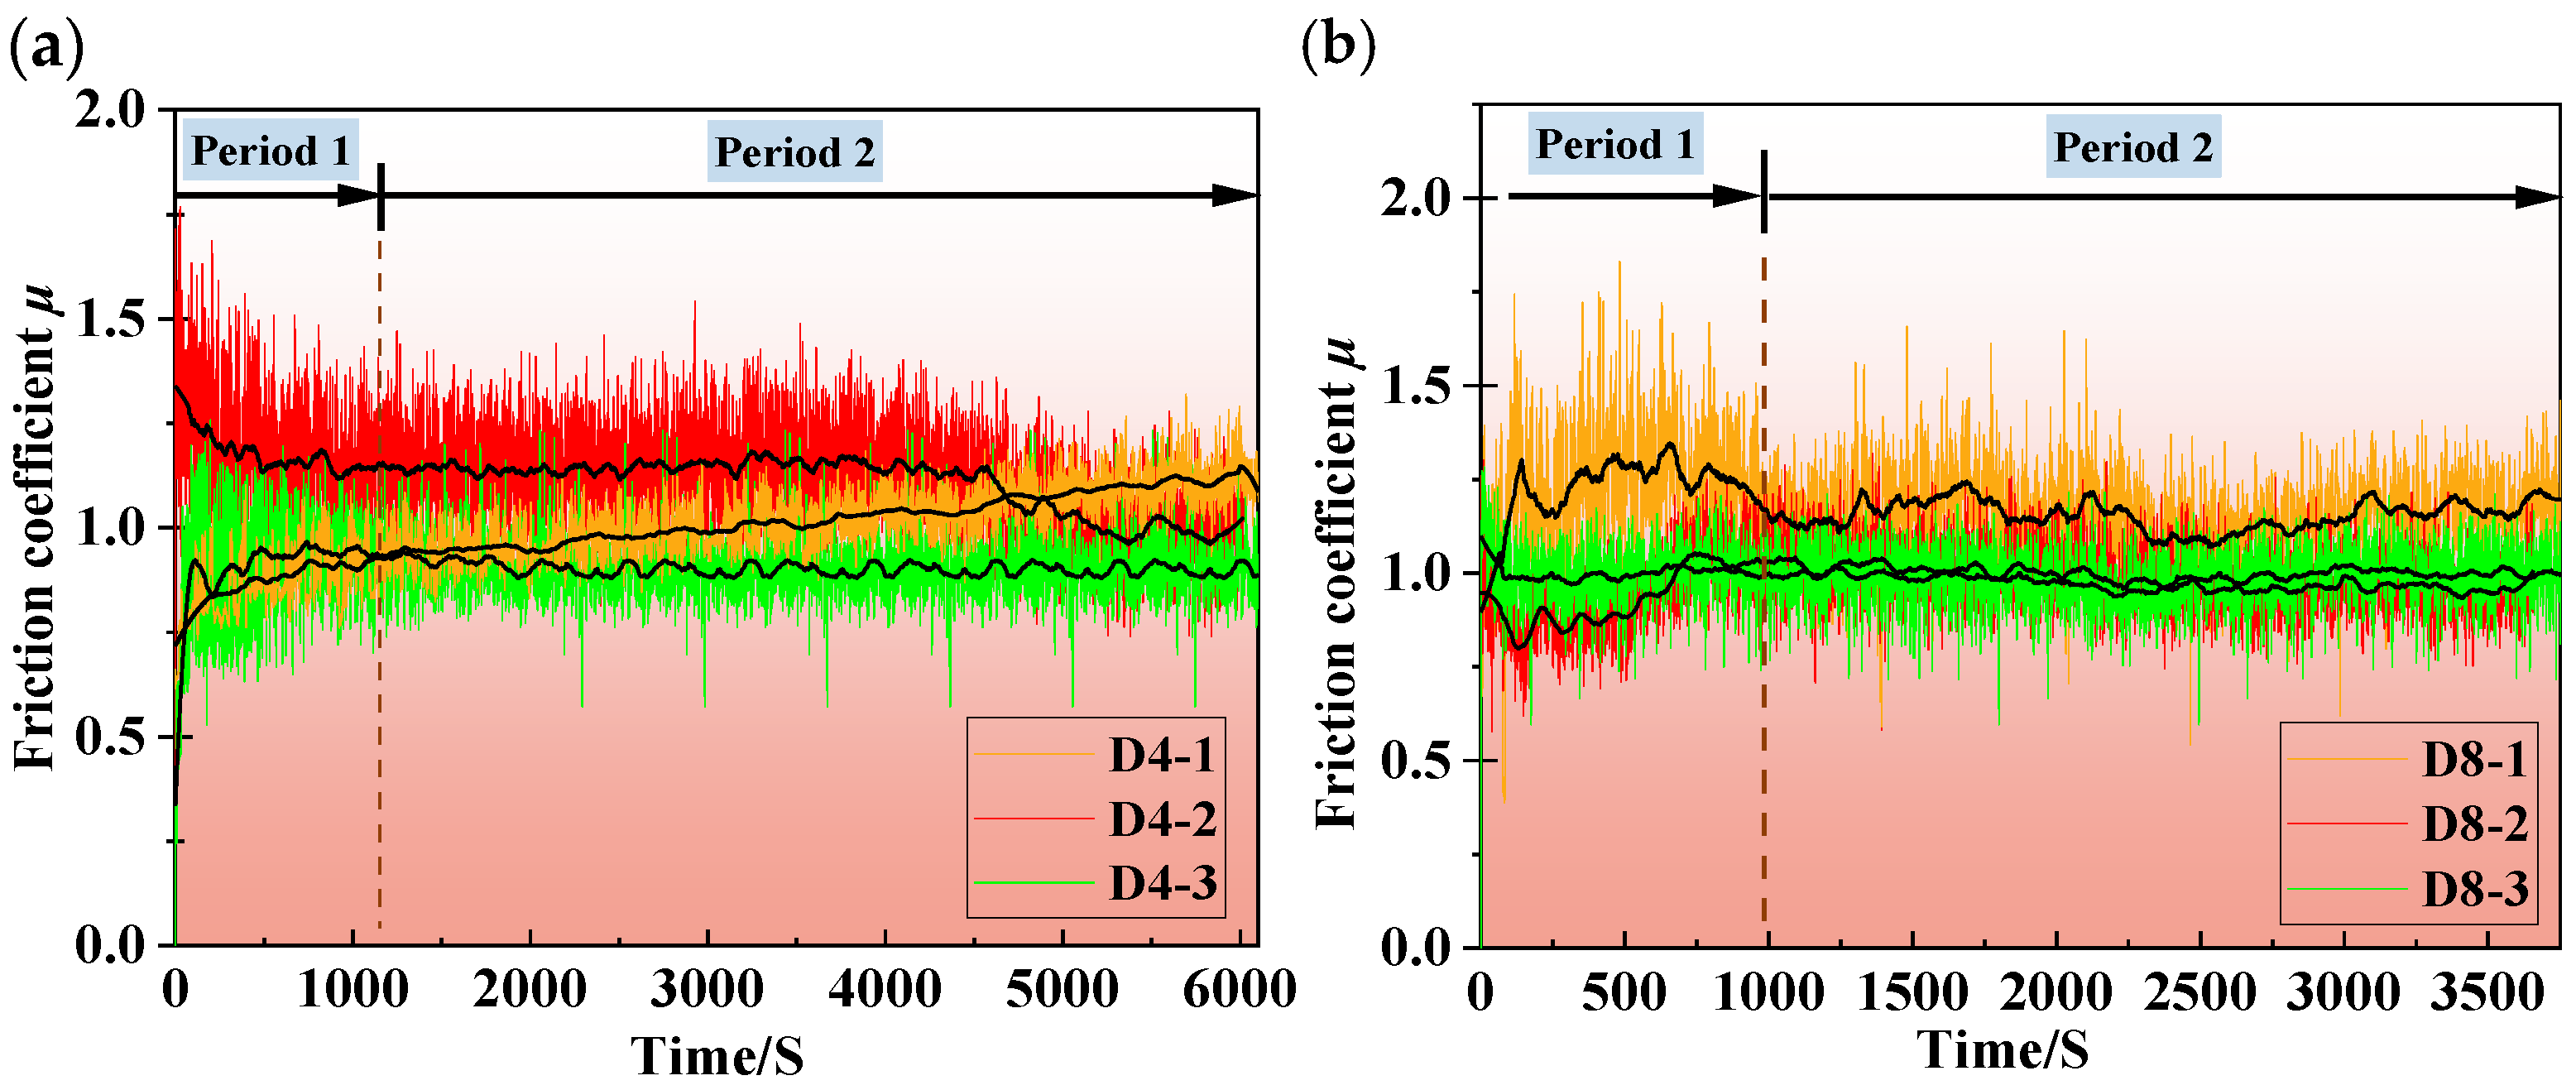
3.1. Friction Coefficient and Wear Loss
3.2. Surface Damage
3.3. Subsurface Damage
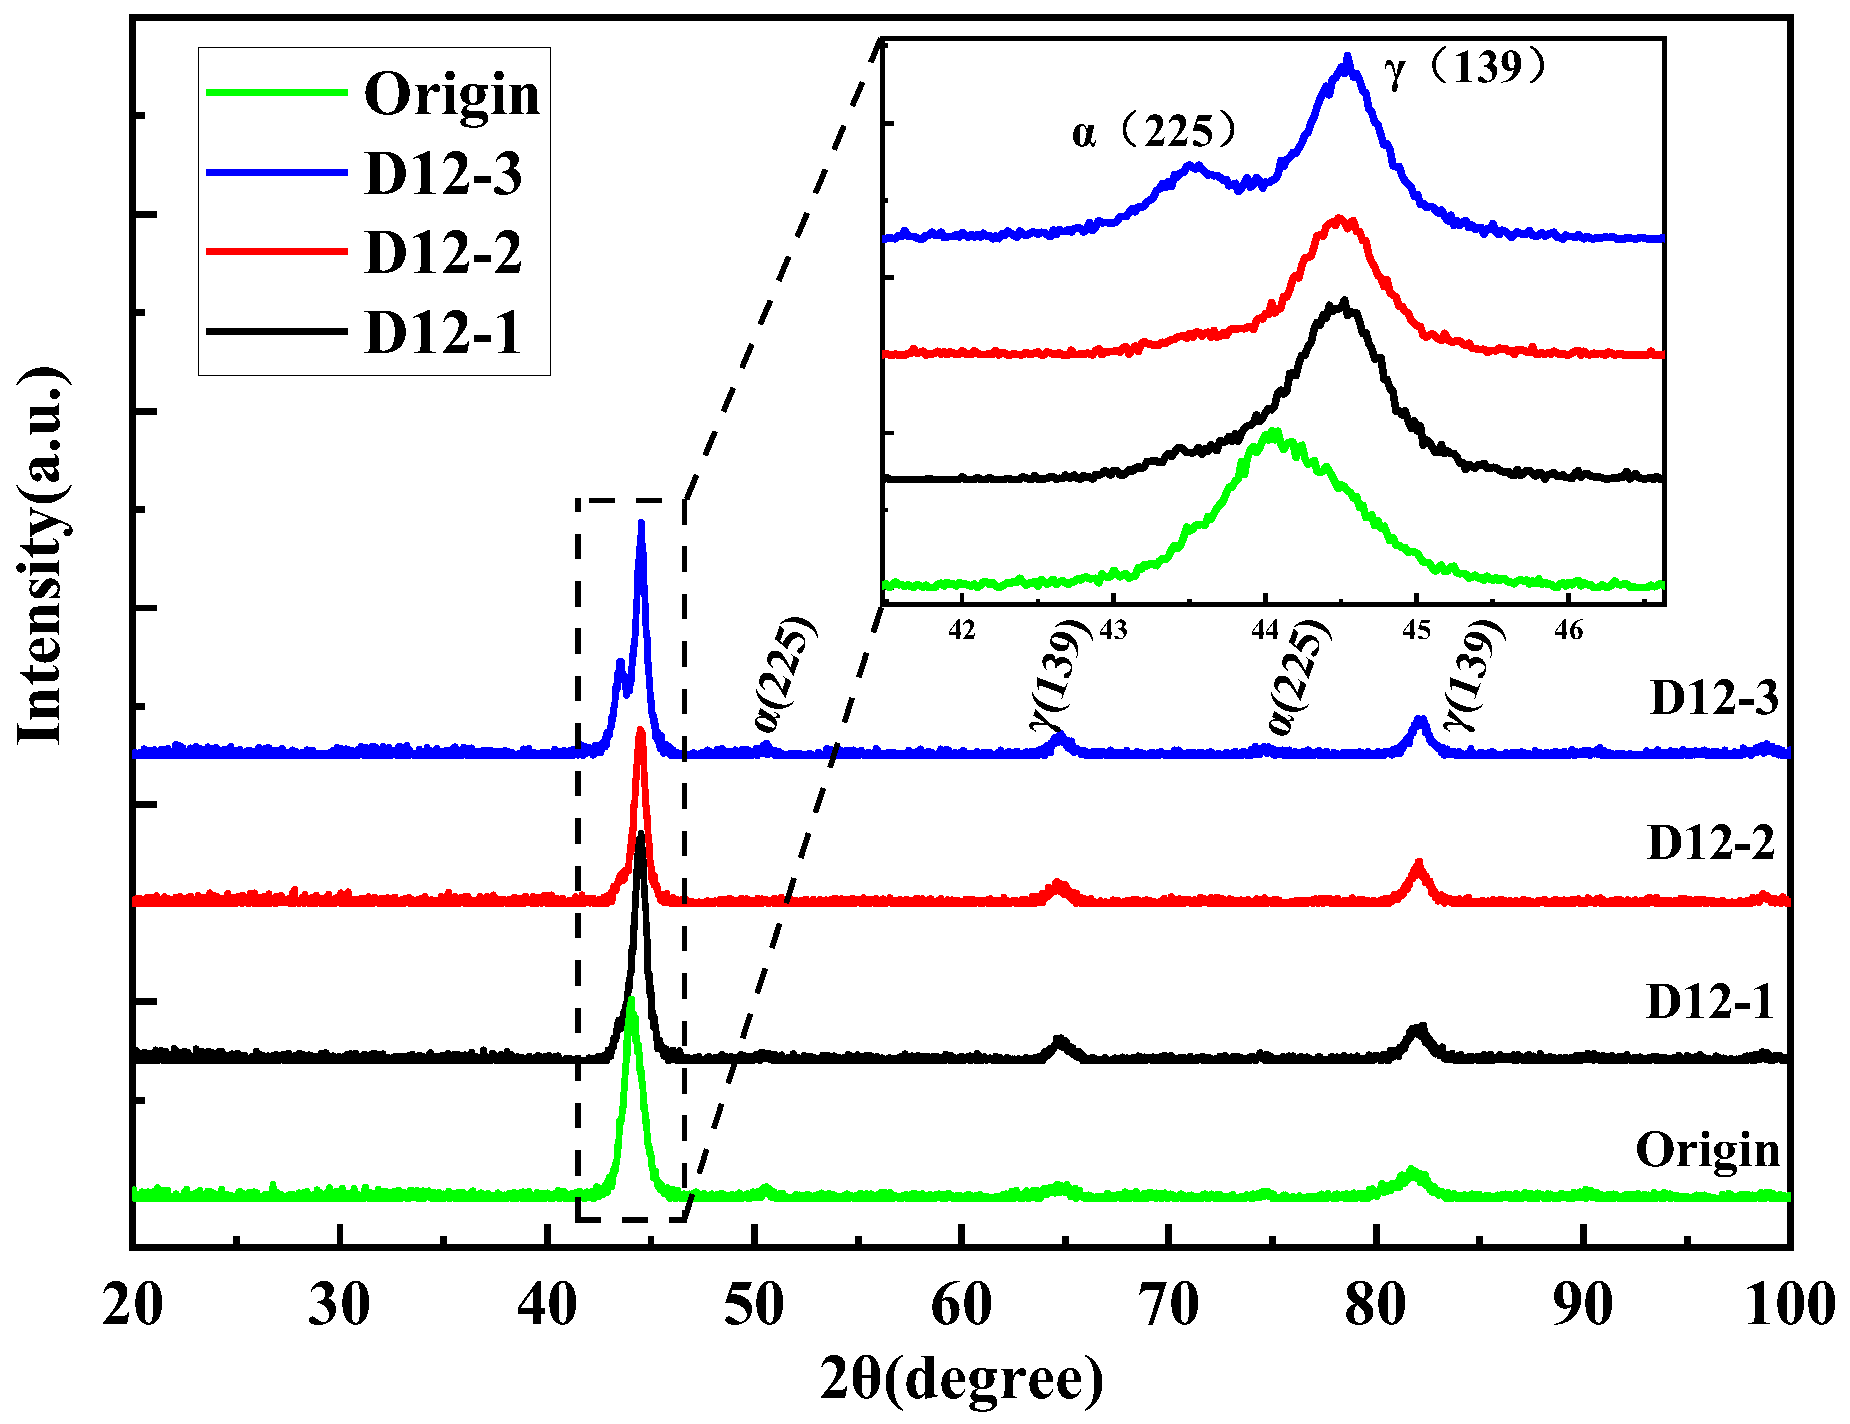
3.4. Phase Transition in Dry Friction
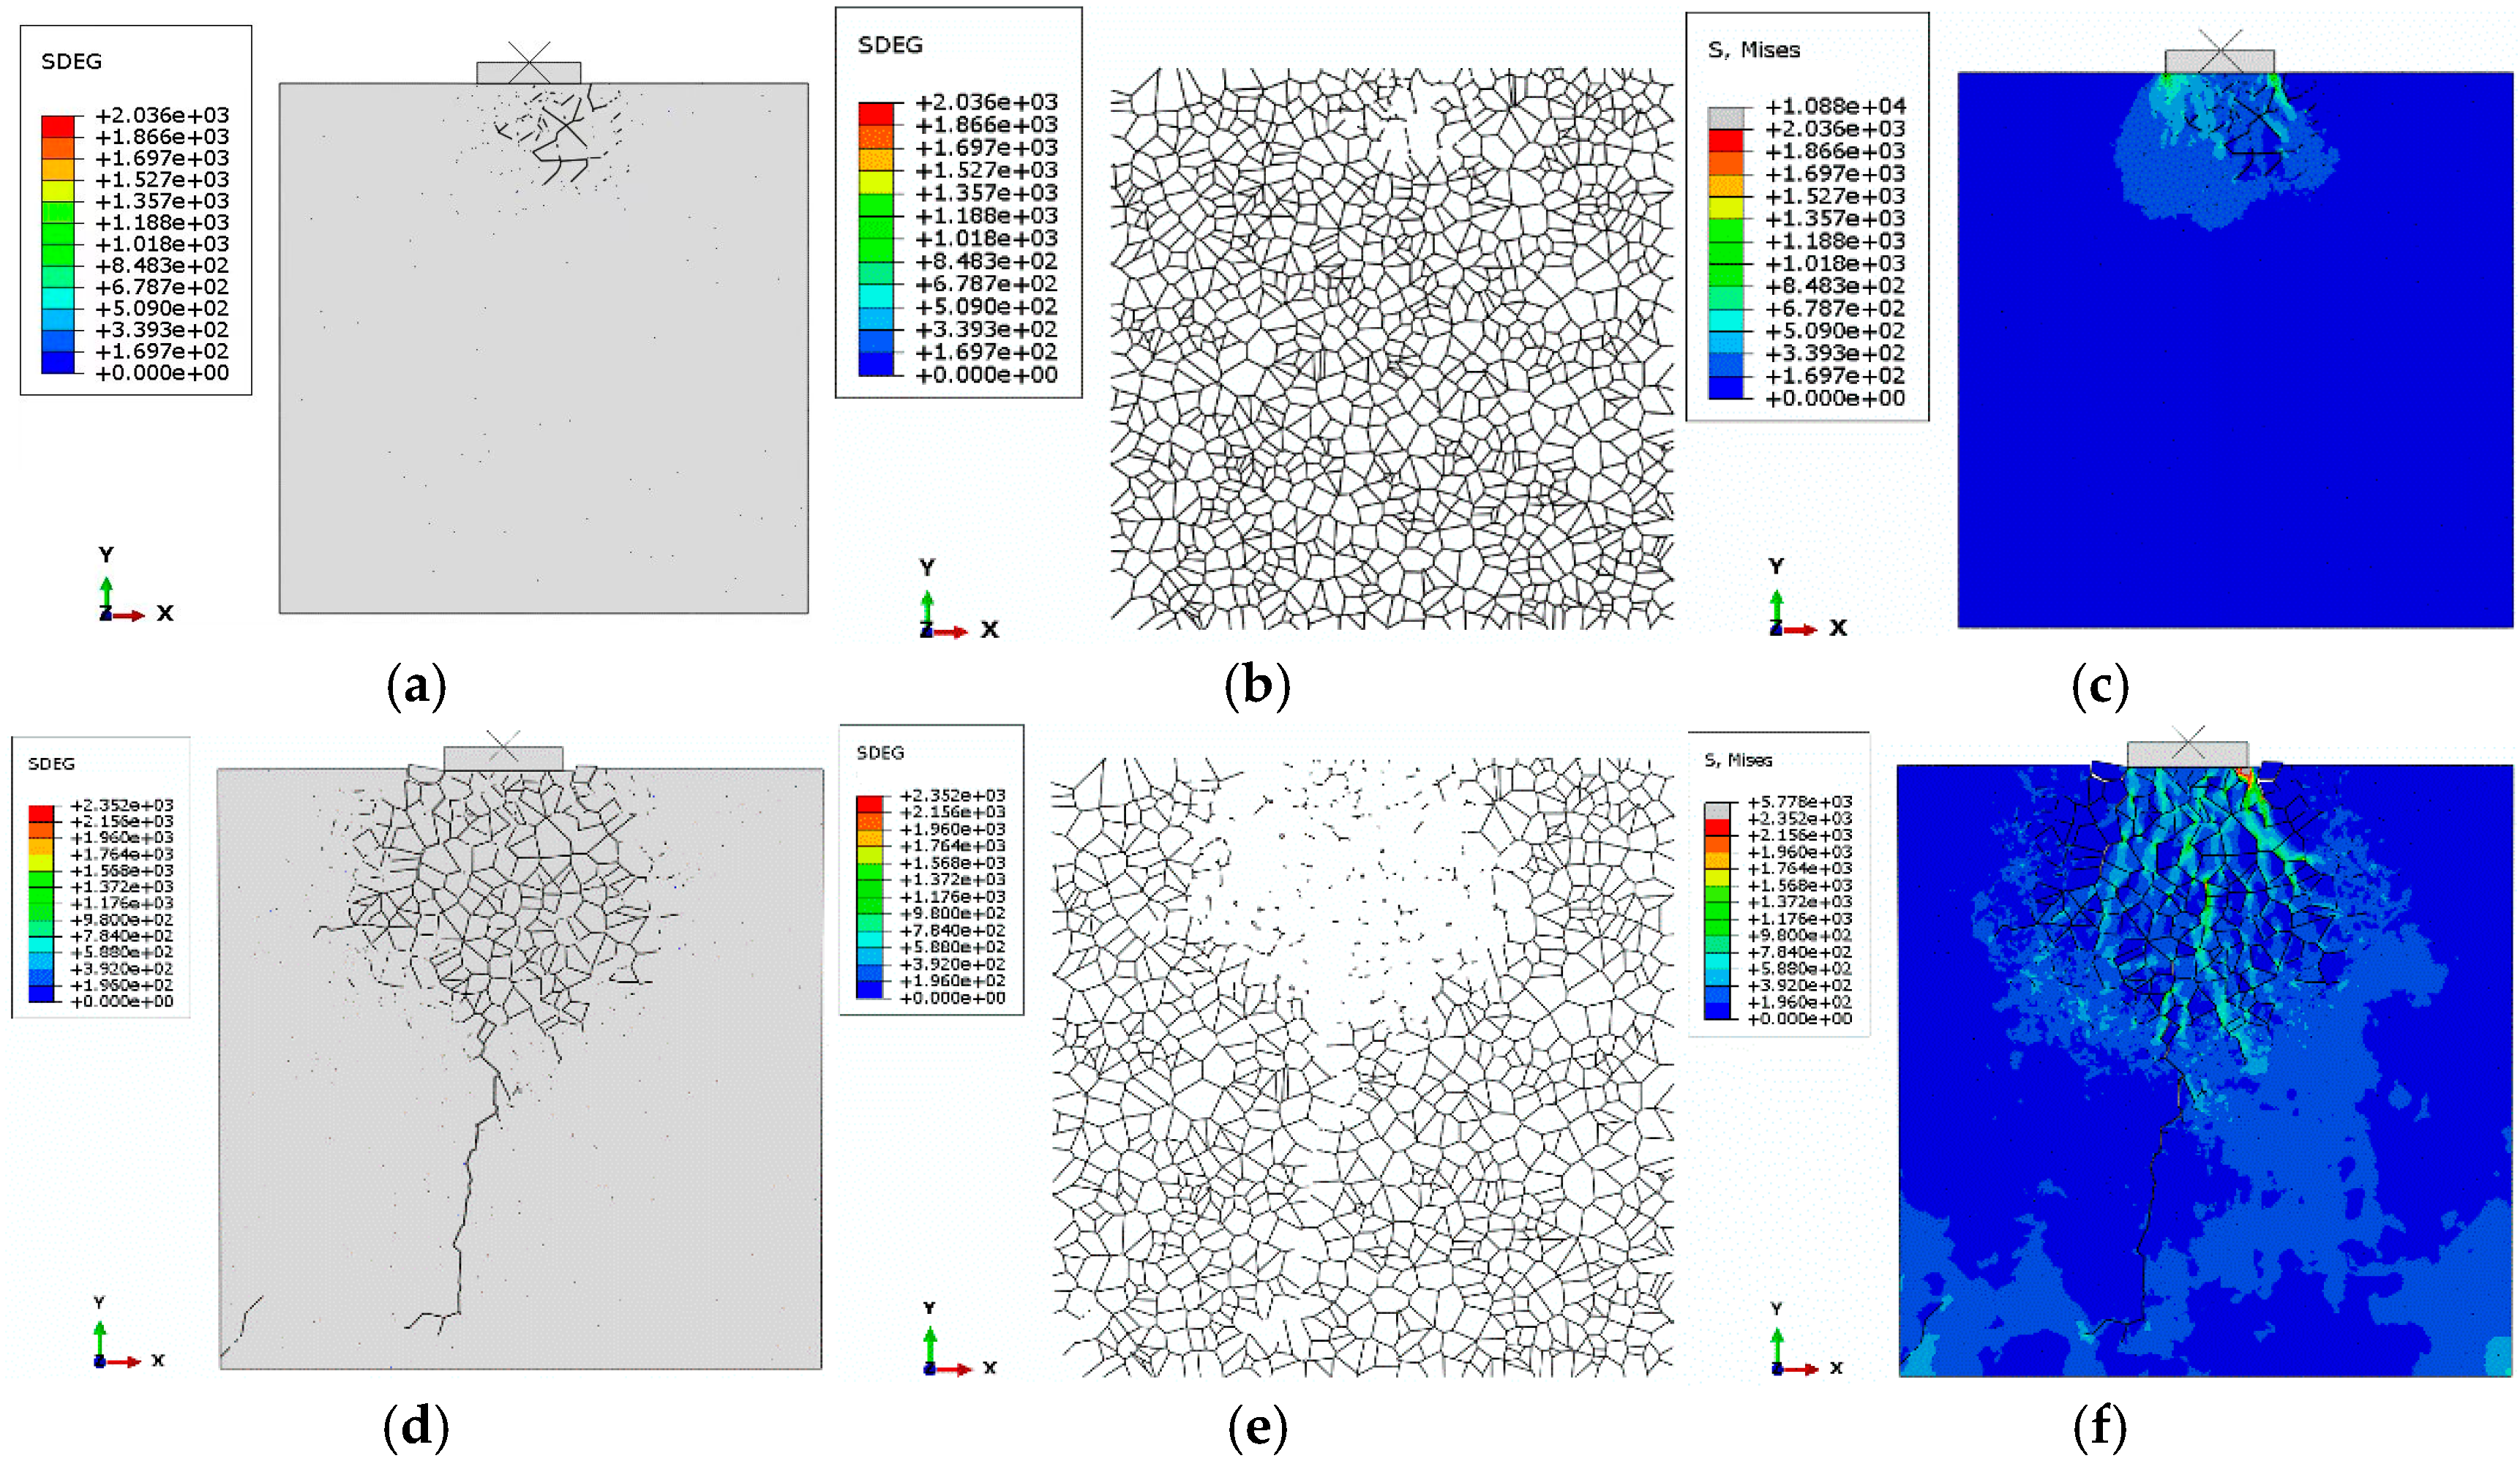
3.5. Prediction of Crack Initiation
4. Discussion
5. Conclusions
- (1)
- The coefficient of friction in the break-in stage increases and then decreases with the increase in contact load. The average coefficient of friction at 400 rpm ranges from 0.9 to 1.12 and decreases and then increases with the increase in contact load, and the average coefficient of friction at the speeds of 800 rpm and 1200 rpm increases and then decreases with the contact load.
- (2)
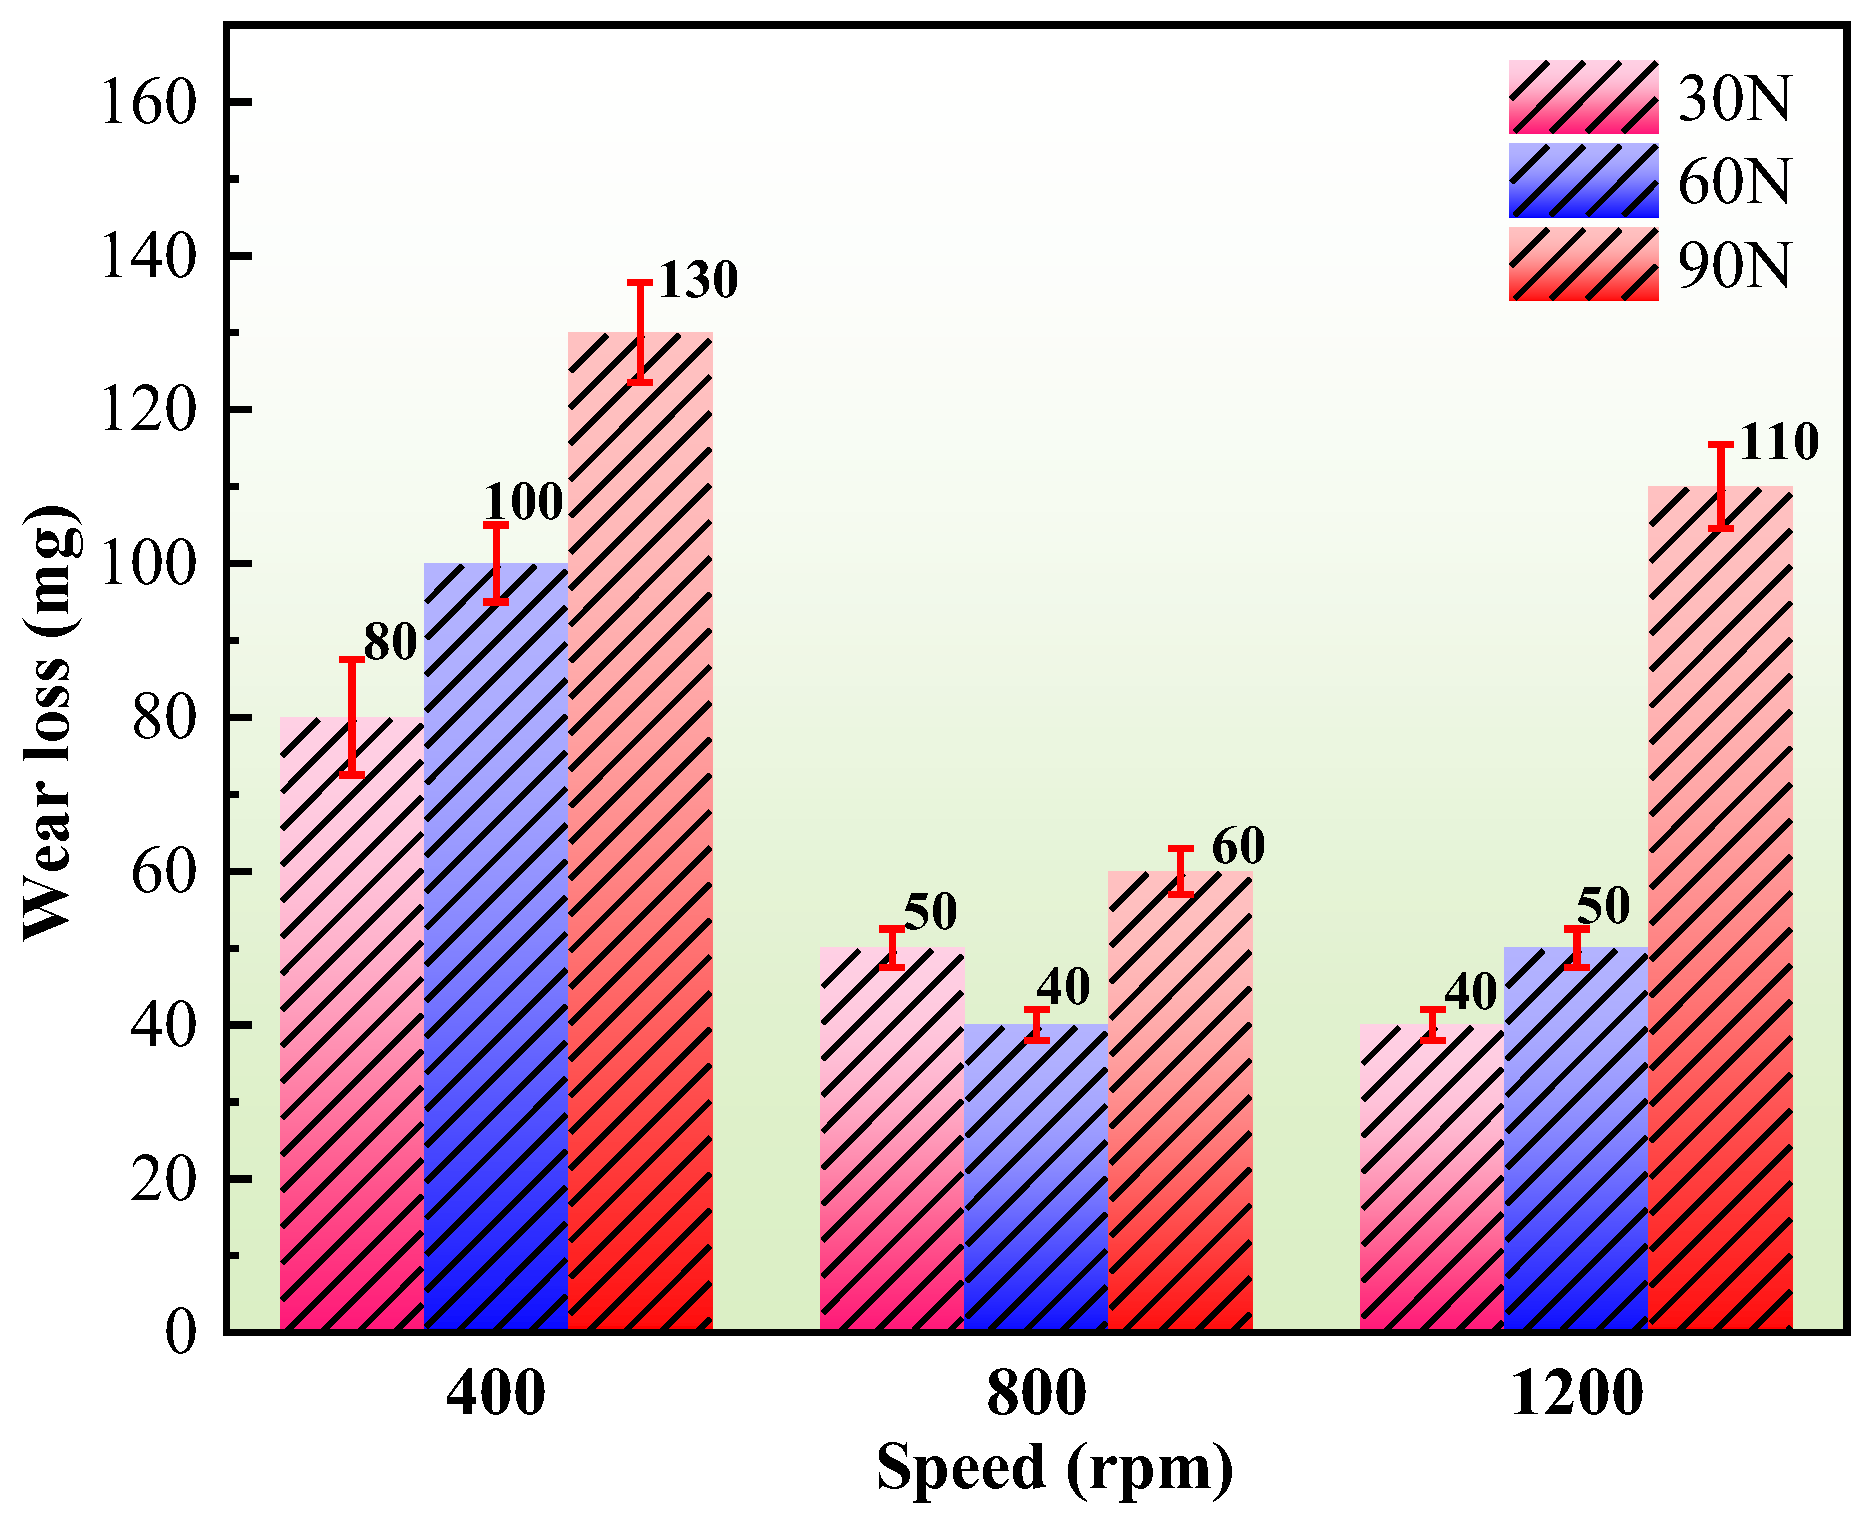
- With the increase in rotational speed, the wear of the friction partner decreases gradually. The amount of wear increases as the load increases. The cumulative wear of the test ring at 400 rpm ranges from 0.08 to 0.13 g, that of the test ring at 800 rpm ranges from 0.04 to 0.06 g, and that of the test ring at 1200 rpm ranges from 0.04 to 1.1 g.
- (3)
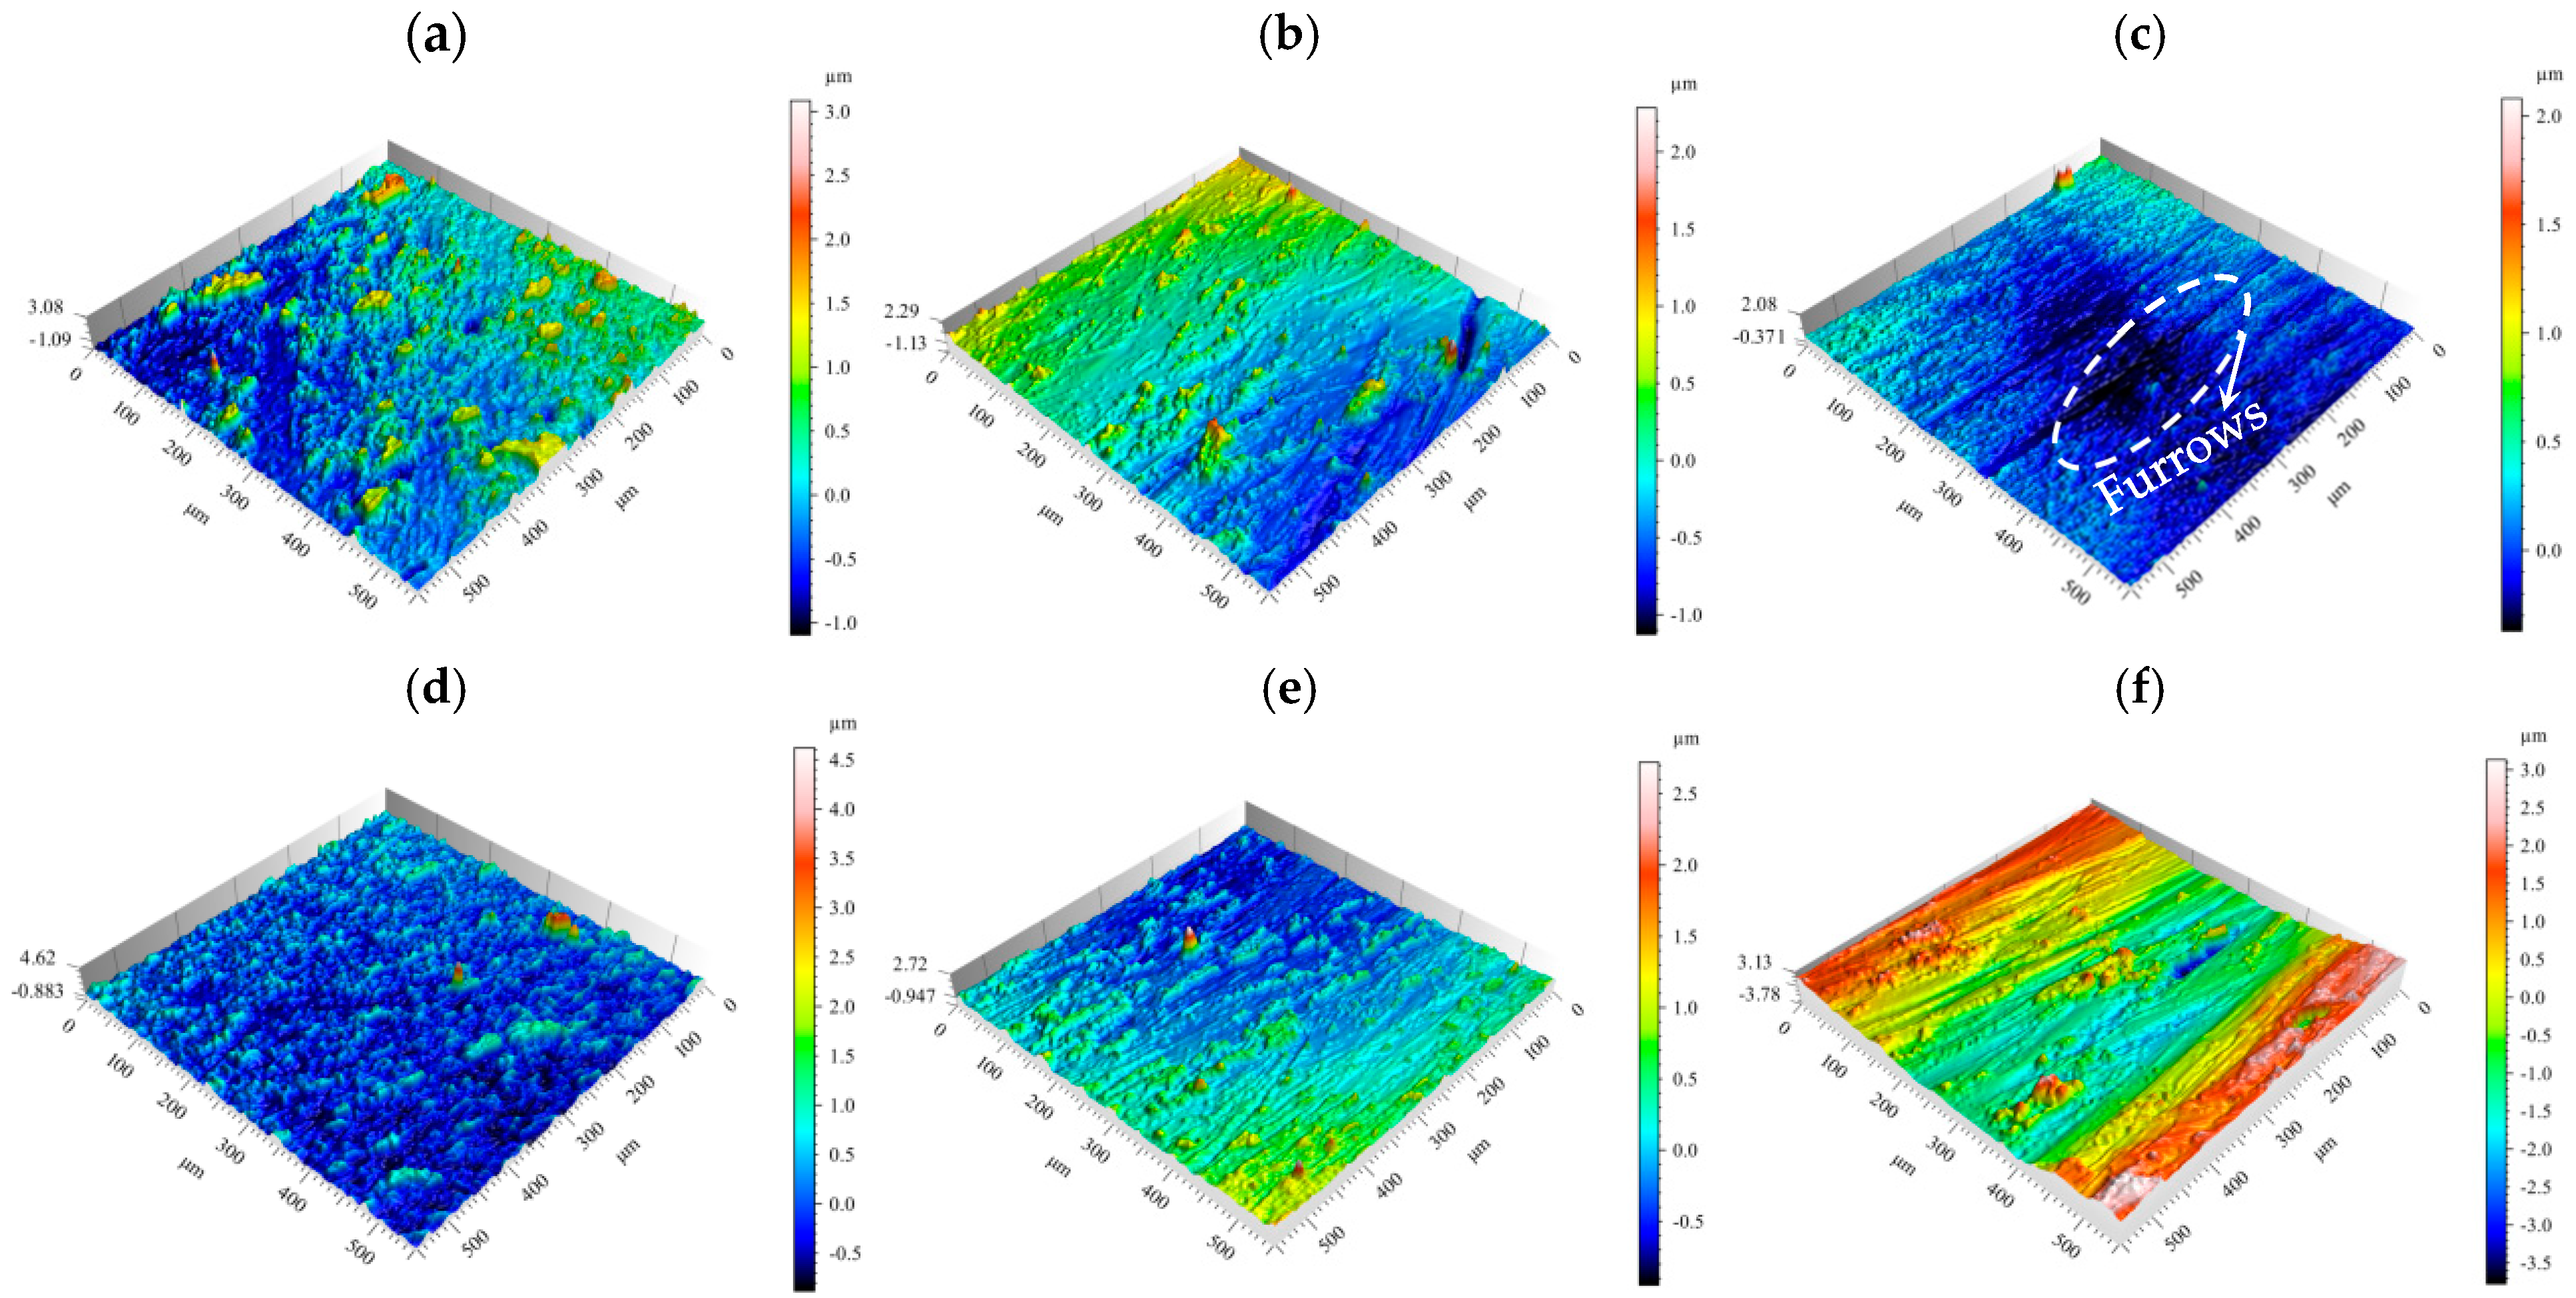
- After dry sliding friction occurs in the W2Mo9Cr4VCo8 HSS pin/20CrNi2MoV disk friction partner, the depth of wear marks on the specimen disk increases and then decreases with the increase in rotational speed. The depth of wear marks on the surface of the test ring is in the range of 2–4 μm at the rotational speed of 400 rpm, and the depth of wear marks on the surface of the test ring is in the range of 3–12 μm and 2–6.5 μm at the rotational speeds of 800 rpm and 1200 rpm, respectively.
- (4)
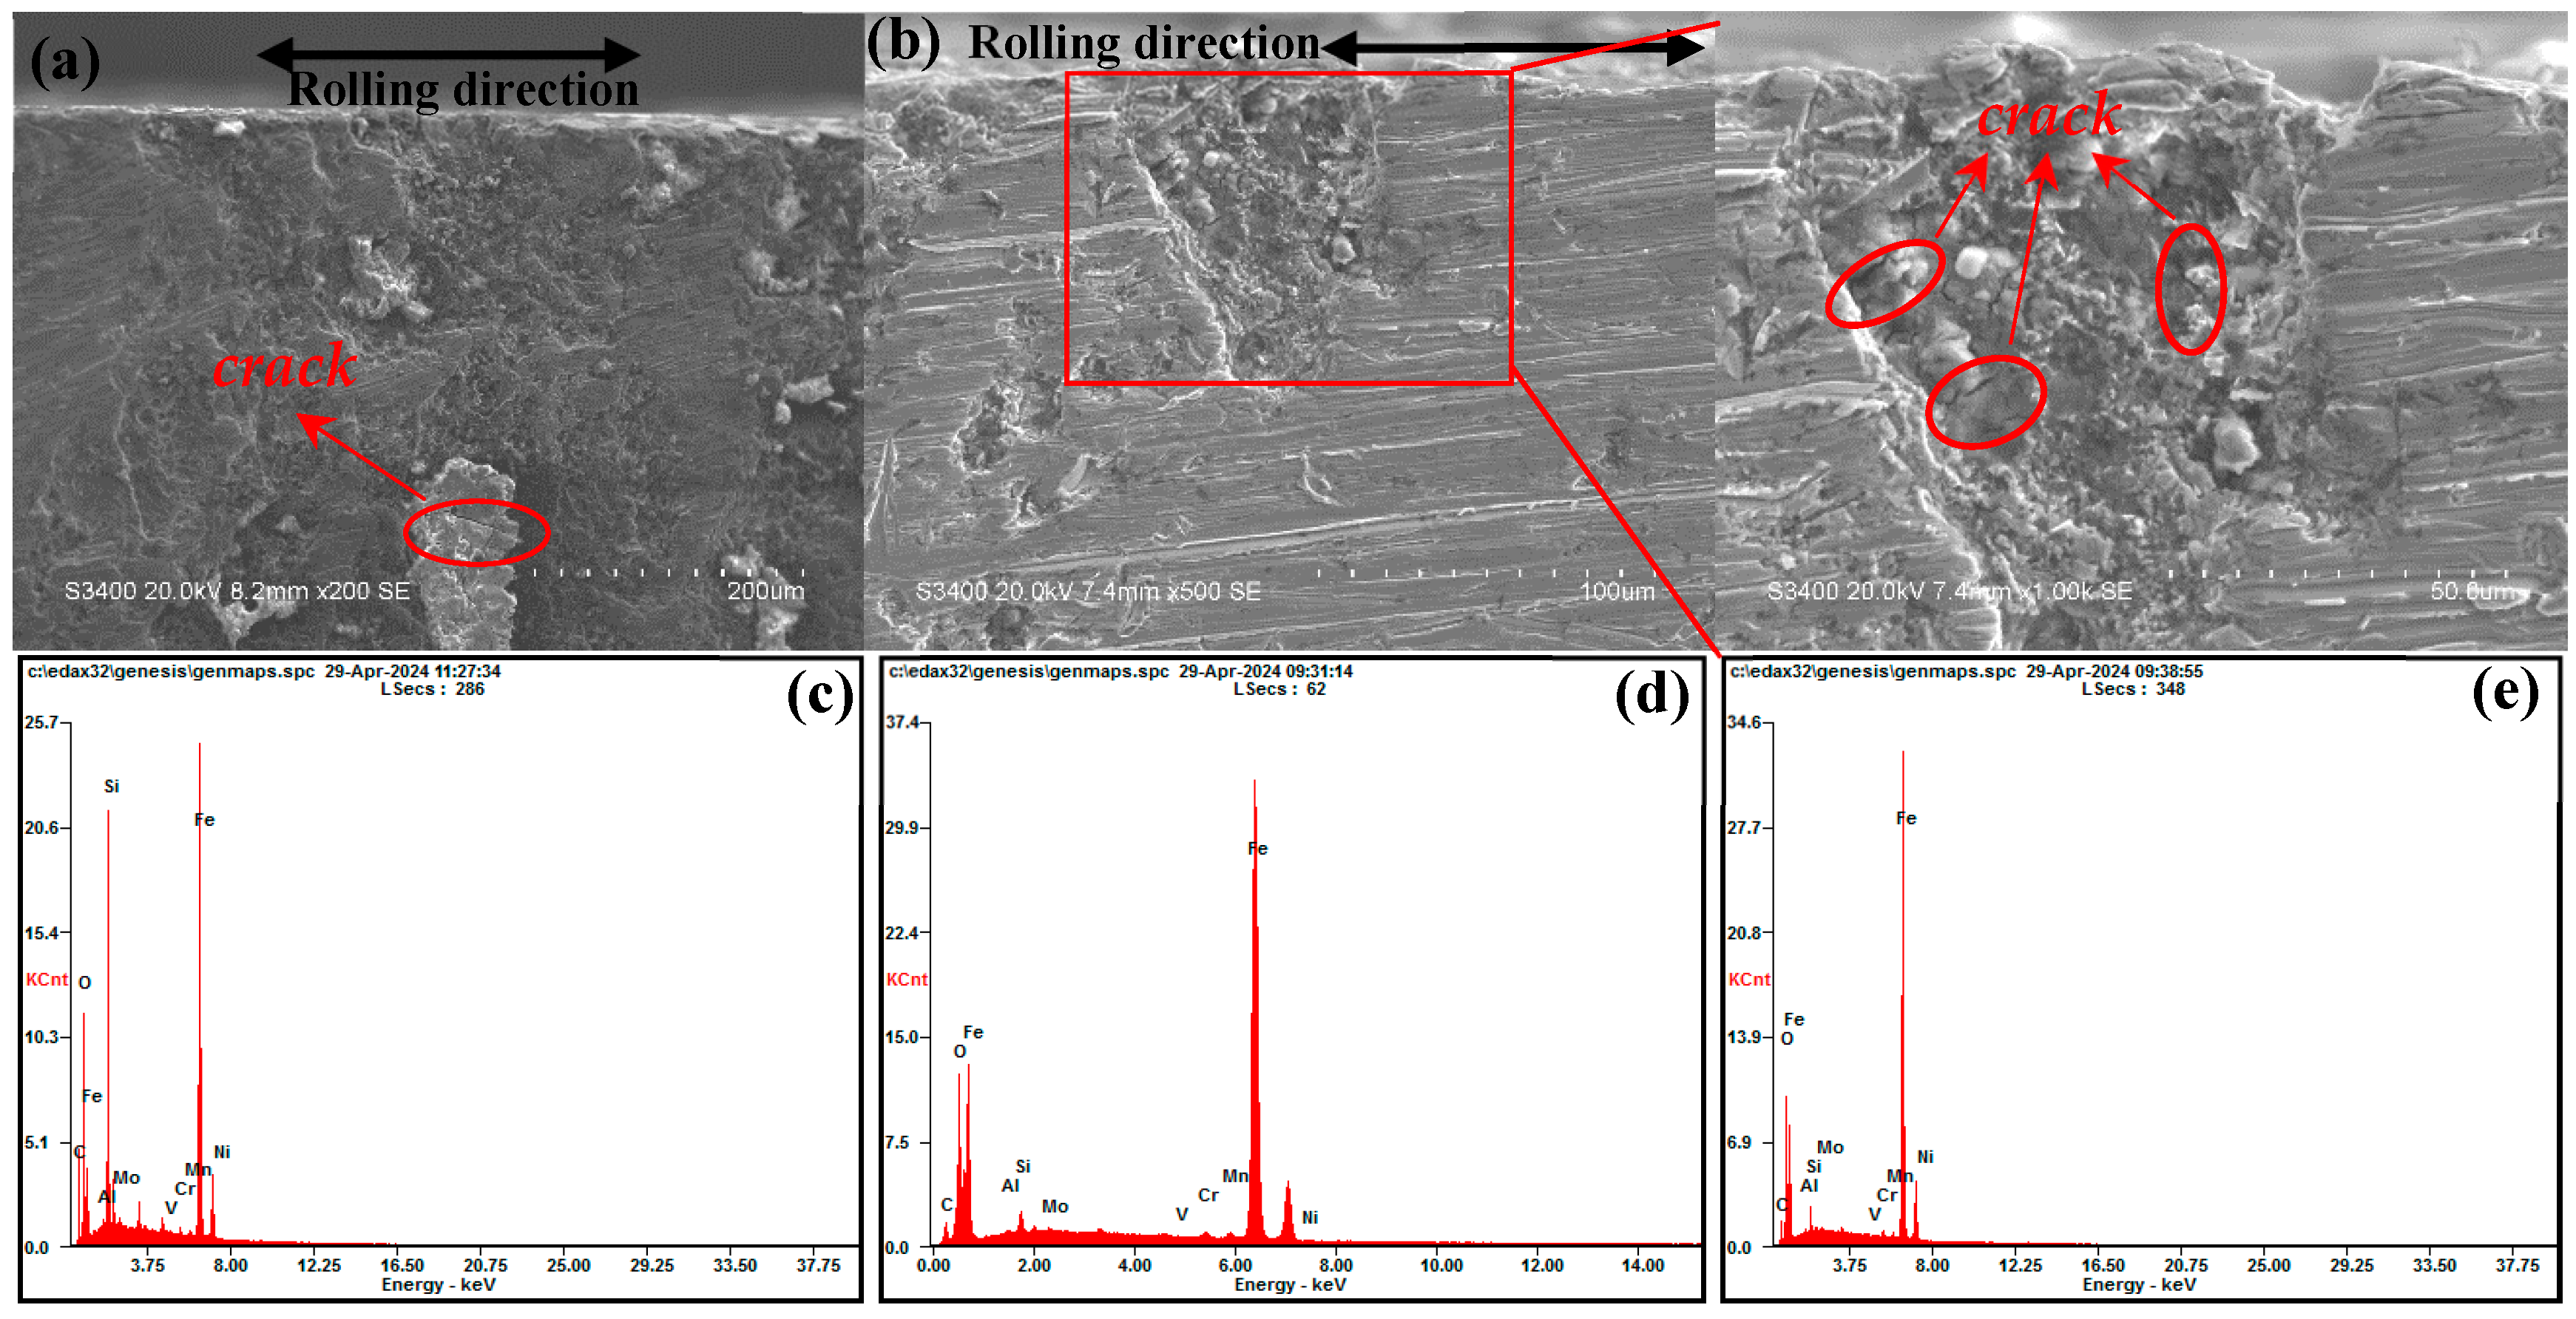
- Due to the interaction of contact pressure and relative sliding, wear, pitting, and cracking occur on the surface of the specimen disk with less hardness. Under the conditions of high speed, high pressure, and dry friction, with the increase in temperature, the wear form of the specimen disk surface goes from abrasive wear and adhesive wear to a mix of three kinds of wear, abrasive wear, adhesive wear, and cracking.
- (5)
- Grooves and spalls of varying degrees appear in the contact area, and martensitic phase transformation occurs during the frictional wear of the pinned disk.
- (6)
- The effect of load on crack initiation is more significant than the effect of speed on crack initiation and extension compared to speed, and the rate of crack initiation is faster under high-speed and heavy-load conditions compared to low-speed and light-load conditions.
- (7)
- The crack location can be predicted using cohesive unit and tensile separation criteria. The crack extension locations predicted by the finite element model are consistent with the experimental results of pin-on-disk friction, which provide a technical reference for the study of crack initiation and extension of bearings with different grain sizes and phase compositions.
Author Contributions
Funding
Institutional Review Board Statement
Informed Consent Statement
Data Availability Statement
Conflicts of Interest
References
- Chang, Z.; Jia, Q.; Yuan, X.; Chen, Y. Main failure mode of oil-air lubricated rolling bearing installed in high speed machining. Tribol. Int. 2017, 112, 68–74. [Google Scholar] [CrossRef]
- Darmo, S.; Bahiuddin, I.; Handoko, P.; Priatomo, H.R.; Kuncoro, M.; Priyambodo, S.; Haryanto; Rahman, N.F.; Kanosri, A.M.; Winarno, A. Failure analysis of double-row tapered roller bearing outer ring used in Coal Wagon Wheelset. Eng. Fail. Anal. 2022, 135, 106153. [Google Scholar] [CrossRef]
- König, F.; Chaib, A.O.; Jacobs, G.; Sous, C. A multiscale-approach for wear prediction in journal bearing systems–from wearing-in towards steady-state wear. Wear 2019, 426–427, 1203–1211. [Google Scholar] [CrossRef]
- Li, B.; Li, C.; Wang, Y.; Jin, X. Effect of Cryogenic Treatment on Microstructure and Wear Resistance of Carburized 20CrNi2MoV Steel. Metals 2018, 8, 808. [Google Scholar] [CrossRef]
- Ji, C.Y.; Jin, X.Y.; Chen, Z.P. Analysis on tribological properties and contact stress during friction process of sic ceramic materials. Lubr. Eng. 2018, 43, 78–81. [Google Scholar]
- Sander, D.E.; Allmaier, H. Starting and stopping behavior of worn journal bearings. Tribol. Int. 2018, 127, 478–488. [Google Scholar] [CrossRef]
- Ardila, M.A.N.; Costa, H.L.; de Mello, J.D.B. Influence of the ball material on friction and wear in microabrasion tests. Wear 2020, 450–451, 203266. [Google Scholar] [CrossRef]
- Mirzababaei, S.; Filip, P. Impact of humidity on wear of automotive friction materials. Wear 2017, 376–377, 717–726. [Google Scholar] [CrossRef]
- Maya-Johnson, S.; Santa, J.F.; Toro, A. Dry and lubricated wear of rail steel under rolling contact fatigue-Wear mechanisms and crack growth. Wear 2017, 380–381, 240–250. [Google Scholar] [CrossRef]
- Feng, H.; Pang, J.; Fang, Q.; Chen, C.; Wen, P. Enhanced ductility of nanomaterials through cooperative dislocation emission from cracks and grain boundaries. Int. J. Mech. Sci. 2020, 179, 105652. [Google Scholar] [CrossRef]
- Rui, S.-S.; Wei, S.; Sun, C. Microstructure evolution, crack initiation and early growth of high-strength martensitic steels subjected to fatigue loading. Int. J. Fatigue 2024, 188, 108534. [Google Scholar] [CrossRef]
- Nejad, R.M.; Shariati, M.; Farhangdoost, K. Effect of wear on rolling contact fatigue crack growth in rails. Tribol. Int. 2016, 94, 118–125. [Google Scholar] [CrossRef]
- Liu, X.; Liu, J.; Zuo, Z.; Zhang, H. The effect of wear on short crack propagation under fretting conditions. Int. J. Mech. Sci. 2019, 157–158, 552–560. [Google Scholar] [CrossRef]
- Chen, H.; Zhang, Z.; Hu, S.; Peng, J.; Zhou, Z.; Cao, S.; Du, X.; Wei, H. Investigation into effect of grain sizes on deformation behavior of AZ31 alloys in different loading conditions. J. Mater. Res. Technol. 2023, 27, 7656–7663. [Google Scholar] [CrossRef]
- Li, X.; Ye, T.; Du, Y.; Zhan, M.; Wang, X.; Dai, Y.; Liu, Y.; Wang, C.; Yang, K.; He, C.; et al. Effect of microstructure on small fatigue crack initiation and early propagation behavior in super martensite stainless steel. Int. J. Fatigue 2025, 190, 108604. [Google Scholar] [CrossRef]
- Sun, H.; Ma, Y.; Cai, Q.; Zhou, G. Study on the effect of grain size on the microstructure evolution of Q345 steel plate under high-speed impact. J. Mater. Res. Technol. 2023, 27, 6782–6791. [Google Scholar] [CrossRef]
- Wang, S.; Chen, Y.; Pan, P.; Lin, Z.; Zuo, L. Influence of Co on the microstructure and mechanical properties of M42 high-speed steel. J. Phys. Conf. Ser. 2022, 2393, 012033. [Google Scholar] [CrossRef]
- Li, C.-s.; Li, B.-z.; Jin, X.; Wang, Y. Microstructure and mechanical properties in core of a carburizing 20CrNi2MoV bearing steel subjected to cryogenic treatment. J. Iron Steel Res. Int. 2021, 28, 360–369. [Google Scholar] [CrossRef]
- GB/T 12444-2016; Metallic Materials. Wear Test Method. Block-on-Ring Sliding Wear Test. National Steel Standardization Technical Committee: Beijing, China, 2016.
- Zhang, Z.; Huang, K. A simple J-integral governed bilinear constitutive relation for simulating fracture propagation in quasi-brittle material. Int. J. Rock Mech. Min. Sci. 2011, 48, 294–304. [Google Scholar] [CrossRef]
- Liang, C.; Wang, Y.; Zhang, K.; Peng, Z. Dry sliding behavior of Qbe-2 Beryllium bronze against 38CrMoAlA steel in pneumatic downhole motor under different loads. Metals 2021, 11, 459. [Google Scholar] [CrossRef]
- Li, H.; Li, R.; Yang, F.; Zhang, D.; Zhang, J. Friction and wear characteristics of aluminum bronze (QAl10-4-4) bearing materials under high-temperature dry sliding conditions. J. Braz. Soc. Mech. Sci. Eng. 2020, 42, 354. [Google Scholar] [CrossRef]
- Ajayi, O.O.; Lorenzo-Martin, C.; Erck, R.A.; Fenske, G.R. Scuffing mechanism of near-surface material during lubricated severe sliding contact. Wear 2011, 271, 1750–1753. [Google Scholar] [CrossRef]
- Zhu, Z.; Liang, Y.; Yin, C.; Ren, X.; Yang, M.; Zou, J. Influence of friction-induced retained austenite transformation to martensite on the wear properties of a carburized layer of 23CrNi3MoA steel. Appl. Surf. Sci. 2022, 595, 153548. [Google Scholar] [CrossRef]
- Ma, L.; Ding, S.; Zhang, C.; Huang, Y.; Zhang, X. Study on the wear performance of high-speed railway brake materials at low temperatures under continuous braking conditions. Wear 2023, 512–513, 204556. [Google Scholar] [CrossRef]
- Chang, X.; Peng, Y.; Zhu, Z.; Lu, H.; Tang, W.; Zhang, X. Sliding Friction and Wear Characteristics of Wire Rope Contact with Sheave under Long-Distance Transmission Conditions. Materials 2022, 15, 7092. [Google Scholar] [CrossRef] [PubMed]
- Gåård, A.; Hallbäck, N.; Krakhmalev, P.; Bergström, J. Temperature effects on adhesive wear in dry sliding contacts. Wear 2010, 268, 968–975. [Google Scholar] [CrossRef]
- Mukherjee, D.; Tiwari, Y.; E, C.; Mandal, N.; Qiu, D.; Mukherjee, M.; Easton, M.A.; Roy, H. Unravelling crack tip damage mechanisms: In-situ tensile assessment of Al-6Zn-2.1 Mg-2Cu alloy strengthened by Ti, Zr, and Sc micro-alloying. Eng. Fract. Mech. 2024, 312, 110663. [Google Scholar] [CrossRef]
- Goto, M.; Yamamoto, T.; Kim, S.; Choi, E.-A.; Han, S.Z. Effect of grain boundary phase formed by Mn addition on initiation and propagation of fatigue cracks in homogenized Cu-6Ni-1.3Si alloy. Int. J. Fatigue 2025, 192, 108731. [Google Scholar] [CrossRef]
- Liu, S.; Li, W.; Shen, J.; Yang, X.; Wang, B.; Liu, J. Size-dependent constitutive model incorporating grain refinement and martensitic transformation. Archiv. Civ. Mech. Eng. 2023, 23, 38. [Google Scholar] [CrossRef]
- Minaii, K.; Farrahi, G.H.; Karimpour, M.; Bahai, H.; Majzoobi, G.H. Investigation of microstructure effect on fretting fatigue crack initiation using crystal plasticity. Fatigue Fract. Eng. Mater Struct. 2019, 42, 640–650. [Google Scholar] [CrossRef]
- Fang, X.-Y.; Zhang, H.-N.; Ma, D.-W.; Wu, Z.-J.; Huang, W. Influence of welding residual stress on subsurface fatigue crack propagation of rail. Eng. Fract. Mech. 2022, 271, 108642. [Google Scholar] [CrossRef]
- Jiang, R.; Song, Y.D.; Reed, P.A. Fatigue crack growth mechanisms in powder metallurgy Ni-based superalloys—A review. Int. J. Fatigue 2020, 141, 105887. [Google Scholar] [CrossRef]
- Fu, X.; Wei, L.; Zhang, Y.; Li, S. Comparative study of bearing wear in spindle system at different working conditions. Mech. Based Des. Struct. Mach. 2023, 51, 6184–6203. [Google Scholar] [CrossRef]
- Wang, D.H.; Xie, S.H.; Yang, H.P.; Qian, H.X.; Zeng, X.R. Wear behaviors of three typical bulk metallic glasses in bearing applications. Met.-Open Access Metall. J. 2018, 8, 1005. [Google Scholar] [CrossRef]
- Jiang, T.; Wei, S.; Xu, L.; Zhang, C.; Wang, X.; Xiong, M.; Mao, F.; You, L.; Chen, C. Effect of microstructures on the tribological performance of medium carbon steel. Metals 2022, 12, 546. [Google Scholar] [CrossRef]
- Liu, P.; Quan, Y.; Wan, J.; Yu, L. Experimental Investigation on the Wear and Damage Characteristics of Machined Wheel/Rail Materials under Dry Rolling-Sliding Condition. Metals 2020, 10, 472. [Google Scholar] [CrossRef]


| Materials | C | Mn | Si | Cr | Ni | Mo | S | P | V | N | Fe |
|---|---|---|---|---|---|---|---|---|---|---|---|
| W2Mo9Cr4VCo8 [17] | 0.96 | 0.36 | 0.19 | 1.46 | 0.08 | 0.02 | 0.006 | 0.01 | / | / | Bal. |
| 20CrNi2MoV [18] | 0.2 | 0.61 | 0.25 | 0.56 | 1.77 | 0.26 | 0.002 | 0.007 | 0.21 | / | Bal. |
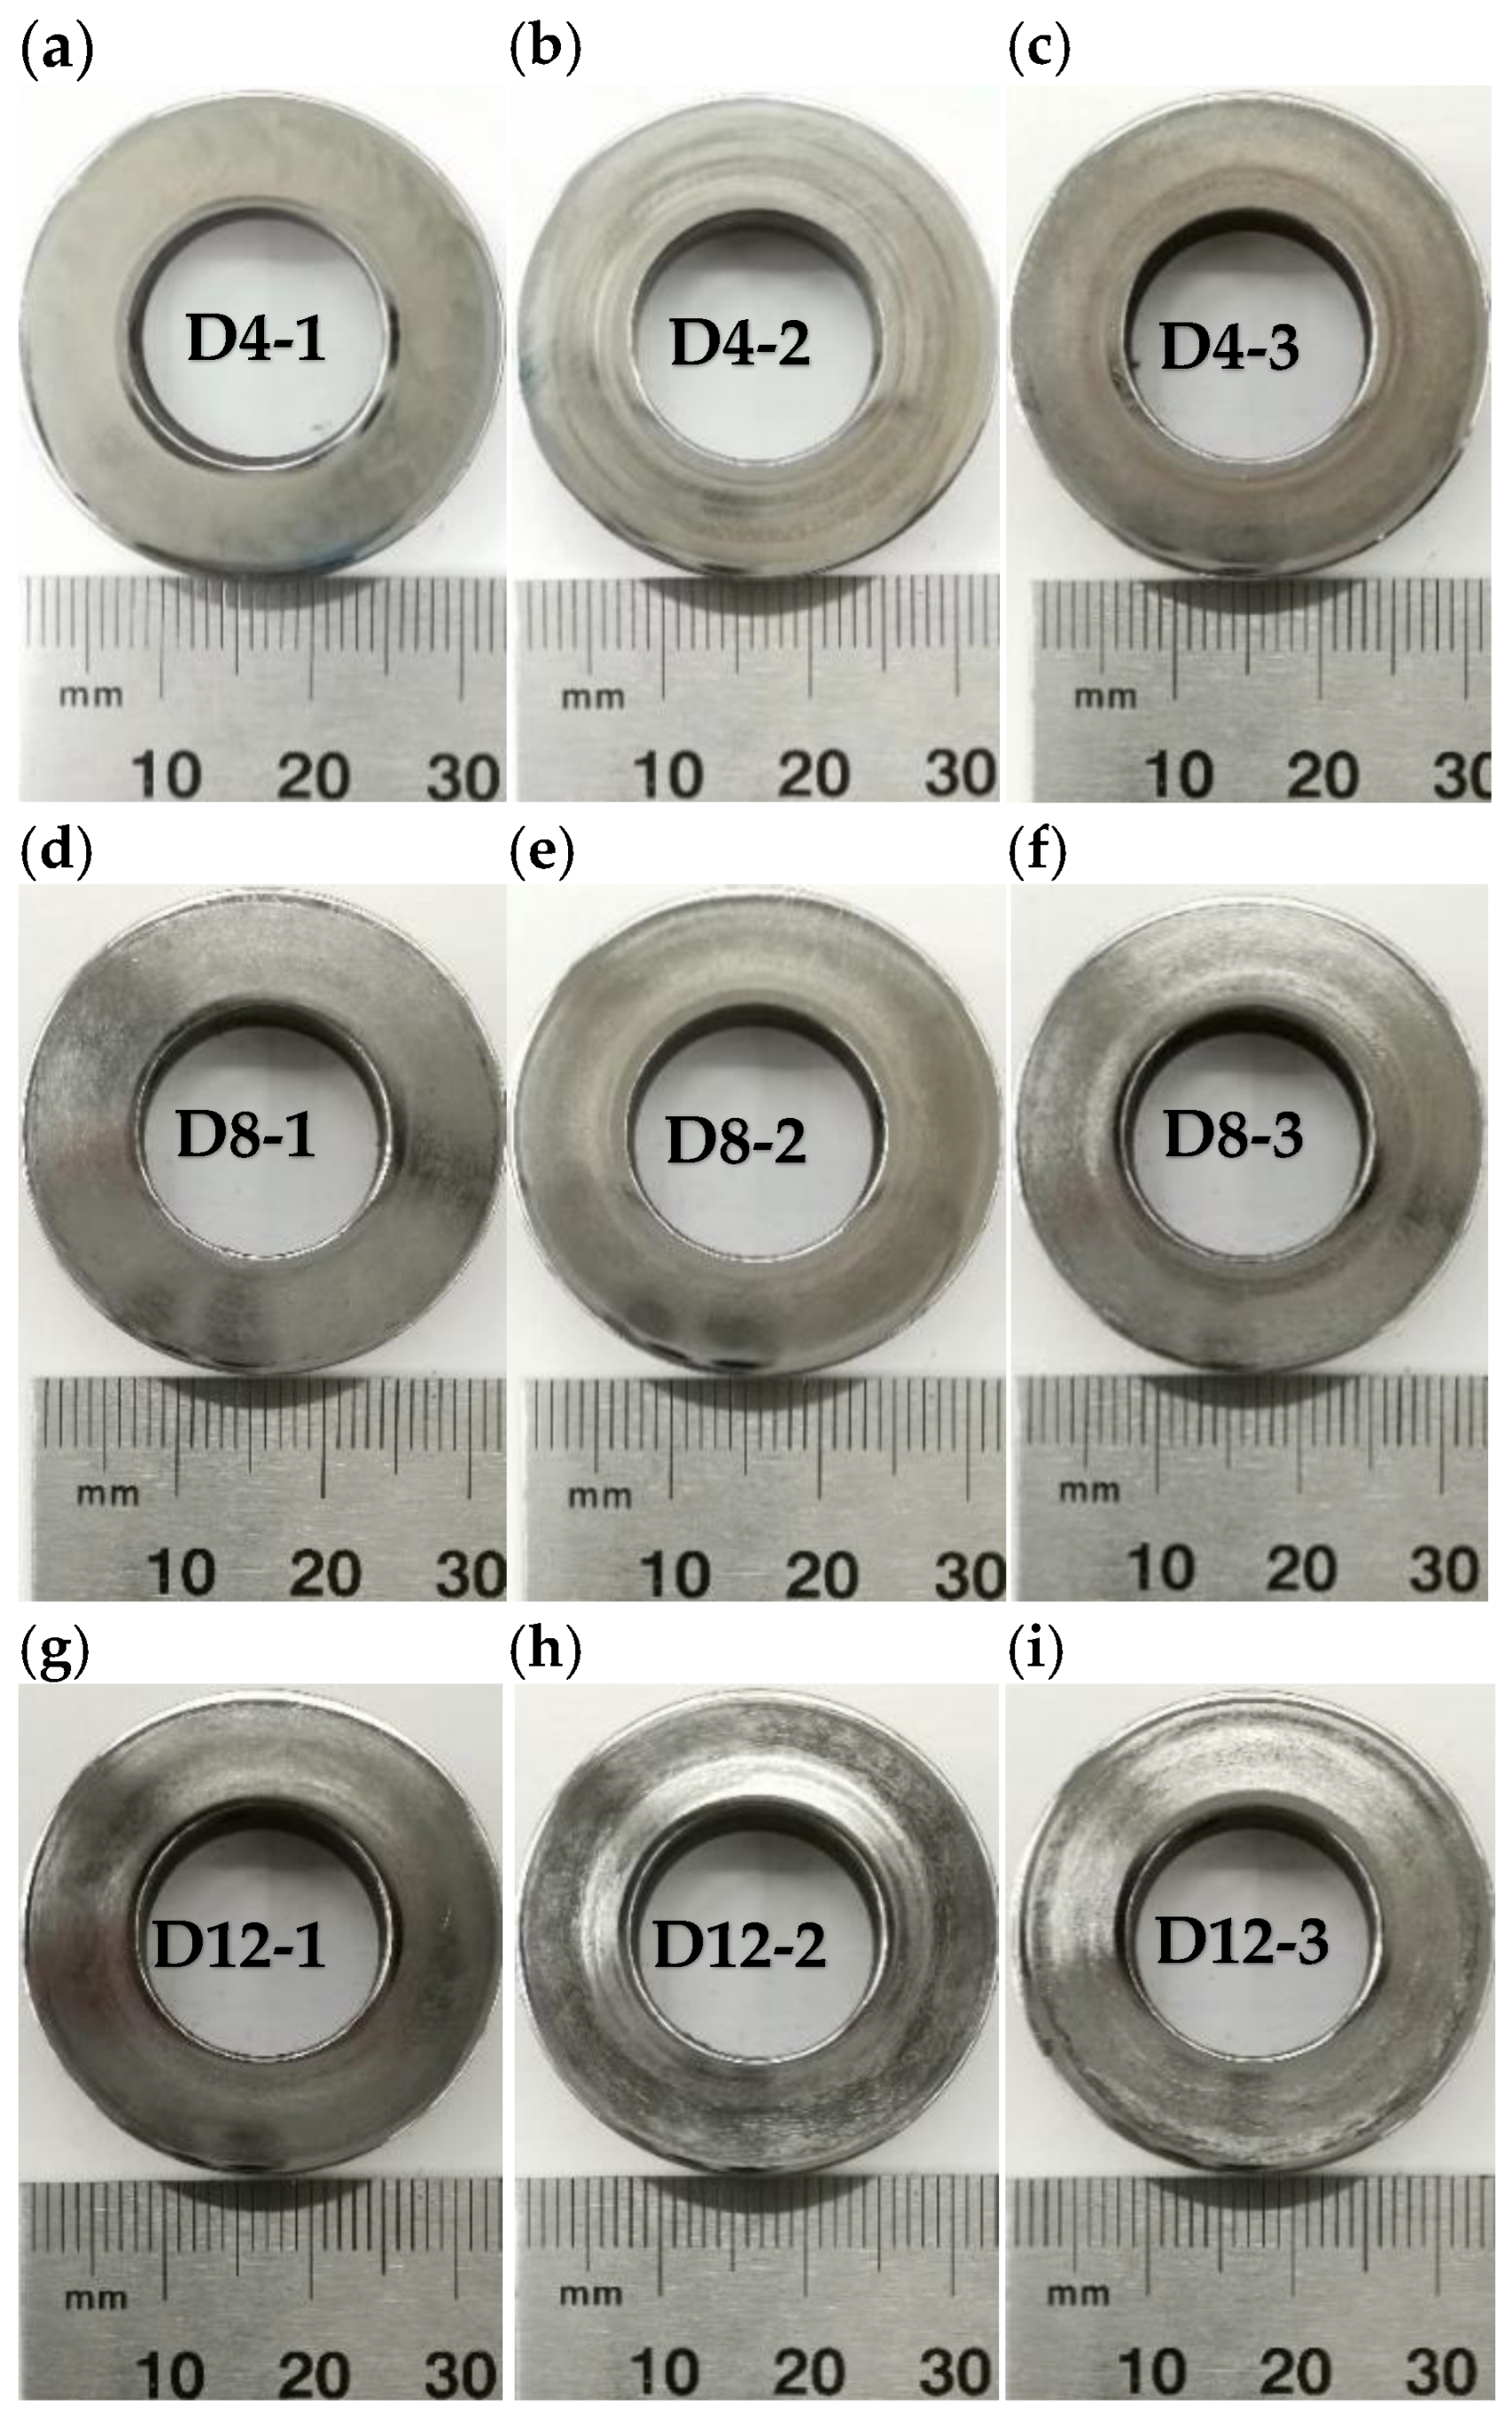
| Tests | D4-1 | D4-2 | D4-3 | D8-1 | D8-2 | D8-3 | D12-1 | D12-2 | D12-3 |
|---|---|---|---|---|---|---|---|---|---|
| Load/N | 30 | 60 | 90 | 30 | 60 | 90 | 30 | 60 | 90 |
| Speed/rpm | 400 | 400 | 400 | 800 | 800 | 800 | 1200 | 1200 | 1200 |
| Cycle number | 5 × 10⁴ | 5 × 10⁴ | 5 × 10⁴ | 5 × 10⁴ | 5 × 10⁴ | 5 × 10⁴ | 5 × 10⁴ | 5 × 10⁴ | 5 × 10⁴ |
Disclaimer/Publisher’s Note: The statements, opinions and data contained in all publications are solely those of the individual author(s) and contributor(s) and not of MDPI and/or the editor(s). MDPI and/or the editor(s) disclaim responsibility for any injury to people or property resulting from any ideas, methods, instructions or products referred to in the content. |
© 2025 by the authors. Licensee MDPI, Basel, Switzerland. This article is an open access article distributed under the terms and conditions of the Creative Commons Attribution (CC BY) license (https://creativecommons.org/licenses/by/4.0/).
Share and Cite
Cui, L.; Wang, D.; Ma, X.; Zhang, B.; Wang, X. Experimental and Numerical Studies on the Tribological Properties of Bearing Steel 20GrNi2MoV Against W2Mo9Cr4VCo8 Steel Under Dry Sliding Process. Coatings 2025, 15, 506. https://doi.org/10.3390/coatings15050506
Cui L, Wang D, Ma X, Zhang B, Wang X. Experimental and Numerical Studies on the Tribological Properties of Bearing Steel 20GrNi2MoV Against W2Mo9Cr4VCo8 Steel Under Dry Sliding Process. Coatings. 2025; 15(5):506. https://doi.org/10.3390/coatings15050506
Chicago/Turabian StyleCui, Li, Donghui Wang, Xingyu Ma, Bo Zhang, and Xin Wang. 2025. "Experimental and Numerical Studies on the Tribological Properties of Bearing Steel 20GrNi2MoV Against W2Mo9Cr4VCo8 Steel Under Dry Sliding Process" Coatings 15, no. 5: 506. https://doi.org/10.3390/coatings15050506
APA StyleCui, L., Wang, D., Ma, X., Zhang, B., & Wang, X. (2025). Experimental and Numerical Studies on the Tribological Properties of Bearing Steel 20GrNi2MoV Against W2Mo9Cr4VCo8 Steel Under Dry Sliding Process. Coatings, 15(5), 506. https://doi.org/10.3390/coatings15050506