Article

Genome-Wide Identification and Expression Pattern of the GRAS Gene Family in Pitaya (Selenicereus undatus L.)

1
Hainan Yazhou Bay Seed Laboratory, Sanya Nanfan Research Institute, Hainan University, Sanya 572025, China
2
College of Tropical Crops, Hainan University, Haikou 570228, China
*
Author to whom correspondence should be addressed.
Biology 2023, 12(1), 11; https://doi.org/10.3390/biology12010011
Submission received: 30 November 2022 / Revised: 15 December 2022 / Accepted: 16 December 2022 / Published: 21 December 2022

Abstract

:

Simple Summary

The GRAS gene family plays a critical role in regulation of growth, defense, light and hormone responses. We identified 45 GRAS genes in the pitaya genome and categorized them into nine respective subfamilies: PAT1, SHR, LISCL, HAM, SCR, RGL, LAS, DELLA and SCL-3. Among these 45 HuGRAS family members, we reported nine candidate genes that played key roles in the growth and development of the pitaya plant.

Abstract

The GRAS gene family is one of the most important families of transcriptional factors that have diverse functions in plant growth and developmental processes including axillary meristem patterning, signal-transduction, cell maintenance, phytohormone and light signaling. Despite their importance, the function of GRAS genes in pitaya fruit (Selenicereus undatus L.) remains unknown. Here, 45 members of the HuGRAS gene family were identified in the pitaya genome, which was distributed on 11 chromosomes. All 45 members of HuGRAS were grouped into nine subfamilies using phylogenetic analysis with six other species: maize, rice, soybeans, tomatoes, Medicago truncatula and Arabidopsis. Among the 45 genes, 12 genes were selected from RNA-Seq data due to their higher expression in different plant tissues of pitaya. In order to verify the RNA-Seq data, these 12 HuGRAS genes were subjected for qRT-PCR validation. Nine HuGRAS genes exhibited higher relative expression in different tissues of the plant. These nine genes which were categorized into six subfamilies inlcuding DELLA (HuGRAS-1), SCL-3 (HuGRAS-7), PAT1 (HuGRAS-34, HuGRAS-35, HuGRAS-41), HAM (HuGRAS-37), SCR (HuGRAS-12) and LISCL (HuGRAS-18, HuGRAS-25) might regulate growth and development in the pitaya plant. The results of the present study provide valuable information to improve tropical pitaya through a molecular and conventional breeding program.

1. Introduction

Pitaya fruit, also known as dragon fruit, belongs to the Cactaceae family, which comprises 127 genera and 1750 species [1]. Among these species, pitaya-Selenicereus undatus (S. undatus) formerly known as Hylocereus undatus (2n = 2x = 22) is a diploid perennial climbing plant that originated from rainforests in the tropical and subtropical regions of Mexico and Colombia [2]. Pitaya fruit gained the attention of growers due to its attractive fuchsia color, its delicious aroma and its ability to tolerate harsh environmental conditions [1,3]. It contains vitamin C and has high antioxidant properties linked to its phenolic and betacyanin content [4]. Several transcription factors (TFs), including WRKY [5], MYB [6], MADS-box [7], ARF [8], AP2/EREBP [9], HB [10], SBP [11], bZIP [12], APX [13] and the GRAS family, are being explored to identify their specific roles in plants [14]. Significant research has been conducted on the GRAS gene family in many crops, including Arabidopsis thaliana [15], Chinese cabbage [16], switchgrass [17] Medicago sativa [18], cassava [19], maize [20,21], rice [22], Melilotus albus [23], wheat [24], canola [25], foxtail millet [26] and soybean [27], but rarely in tropical fruits such as litchi [28]. To improve the growth and developmental process, it is important to report the GRAS gene family in pitaya fruit.
TFs are proteins that contain domains that bind to the promoter regions that transcribe DNA into mRNA. The GRAS TF is named after the first reported TFs: gibberellic acid insensitive (GAI) [29,30], REPRESSOR of GAI (RGA) [31] and SCARECROW (SCR) [32]. GRAS proteins consist of 360–850 amino acids, C-terminal homology and five carboxyl-terminal motifs with the same sequence in the whole family [30,33,34]. The GRAS protein can be divided into five peptide regions, and it carries highly conserved motifs in a specific order: leucine heptad repeat I (LHRI), VHID, leucine heptad repeat II (LHRII), PFYRE and SAW [34,35]. The GRAS gene family is involved in multiple phytohormone-signaling pathways and plays a diverse role in signal transduction [35,36], root patterning [37], meristem formation, shoot development [35], axillary meristem patterning and cell maintenance.
The GRAS gene family is divided, based on its structure, into the following subfamilies: DELLA, HAIRY MERISTEM (HAM), LATERAL SUPRESSOR (LAS), Lilium longiflorum SCARECROW-LIKE (LISCL), REPRESSOR OF GAI-LIKE (RGL), PHYTOCHROME A SIGNAL TRANSDUCTION 1 (PAT1), SCARECROW (SCR), SCARECROW-LIKE 3 (SCL3) and SHORT ROOT (SHR) [35,38,39,40]. GRAS subfamilies perform transcriptional regulation and are involved in specific functions, as the DELLA subfamily negatively interacts with the gibberellic-acid (GA) and light-signaling pathways [41], HAM with shoot-stem-cell initiation and proliferation [42] and LAS with axillary meristems [43,44]. The LISCL/TGA complex responds to defense and stress tolerance, PAT1 interacts with phytochrome-A signal transduction [45] and SCR interacts with radial patterning in roots and shoots [46]. SCL3 acts as an attenuator of DELLA proteins and represses their expression antagonistically [47], and SHR interacts with endodermis specification and root patterning [37]. Through genome-wide analysis, different GRAS genes have been predicted in different crop species: 48 in Chinese cabbage [16], 144 in switchgrass [17], 87 in canola (Brassica napus) [25], 59 in Medicago truncatula [48], 52 in quinoa [49], 117 in soybeans (Glycine max L.) [21], 150 in cotton (Gossypium hirsutum) [50], 62 in barley (Hordeum vulgare) [51], 37 in bottle gourds [52], 50 in sweet oranges [53], 48 in litchi (Litchi chinesis Sonn) [28], 57 in rice (Oryza sativa L.) and maize (Zea mays L.) [30], 55 in Melilotus albus [23], 50 in pepper (Capsicum annuum L.) [54] and 32 in Arabidopsis thaliana [55].
In this study, we performed a comprehensive genome-wide analysis of the GRAS gene family and identified 45 GRAS members in the pitaya (S. undatus L.) genome, mapped to 11 chromosomes (chrs). The GRAS genes were identified, and phylogenetic relationships were established with the previously reported GRAS proteins of maize (Zea mays L.), soybeans (Glycine max L.), Mediacgo trunctula, rice (Oryza sativa L.), Arabidopsis thaliana and tomatoes (Solanum lycopersicum). We identified the locations of 45 genes on the chromosome and selected 12 genes to check their expression patterns in different tissues of the pitaya plant. Among them, HuGRAS-1, HuGRAS-6, HuGRAS-12, HuGRAS-18, HuGRAS-25, HuGRAS-34, HuGRAS-35, HuGRAS-37 and HuGRAS-41 were found to be important genes that exert their potential functions in the growth and development of the pitaya (S. undatus L.) plant.

2. Materials and Methods

2.1. Retrieval of GRAS Family Members in Pitaya

The genome of the pitaya plant (S. undatus L.) was downloaded from the pitaya genome database, http://www.pitayagenomic.com/ (accessed on 1 September 2022) [56]. All previously published information about GRAS proteins was retrieved from the NCBI website, https://www.ncbi.nlm.nih.gov/protein (accessed on 24 September 2022), and Phytozome, https://phytozome-next.jgi.doe.gov/ (accessed on 2 October 2022) [57]. The InterPro tool, https://www.ebi.ac.uk/interpro/ (accessed on 29 November 2022), was used to find the domains of the GRAS proteins. The characterized protein sequences of corn (Zea mays L.) [30], soybeans (Glycine max L.) [21], Mediacgo truncatula [48], rice (Oryza sativa L.) [55], Arabidopsis thaliana [46] and tomatoes (Solanum lycopersicum) [58] were obtained from previous studies. GRAS-protein physical and chemical properties, including each protein’s molecular weight, isoelectric point and grand average of hydropathicity (GRAVY), were computed using the Expasy ProtParam Tool, https://web.expasy.org/protparam/ (accessed on 9 October 2022).

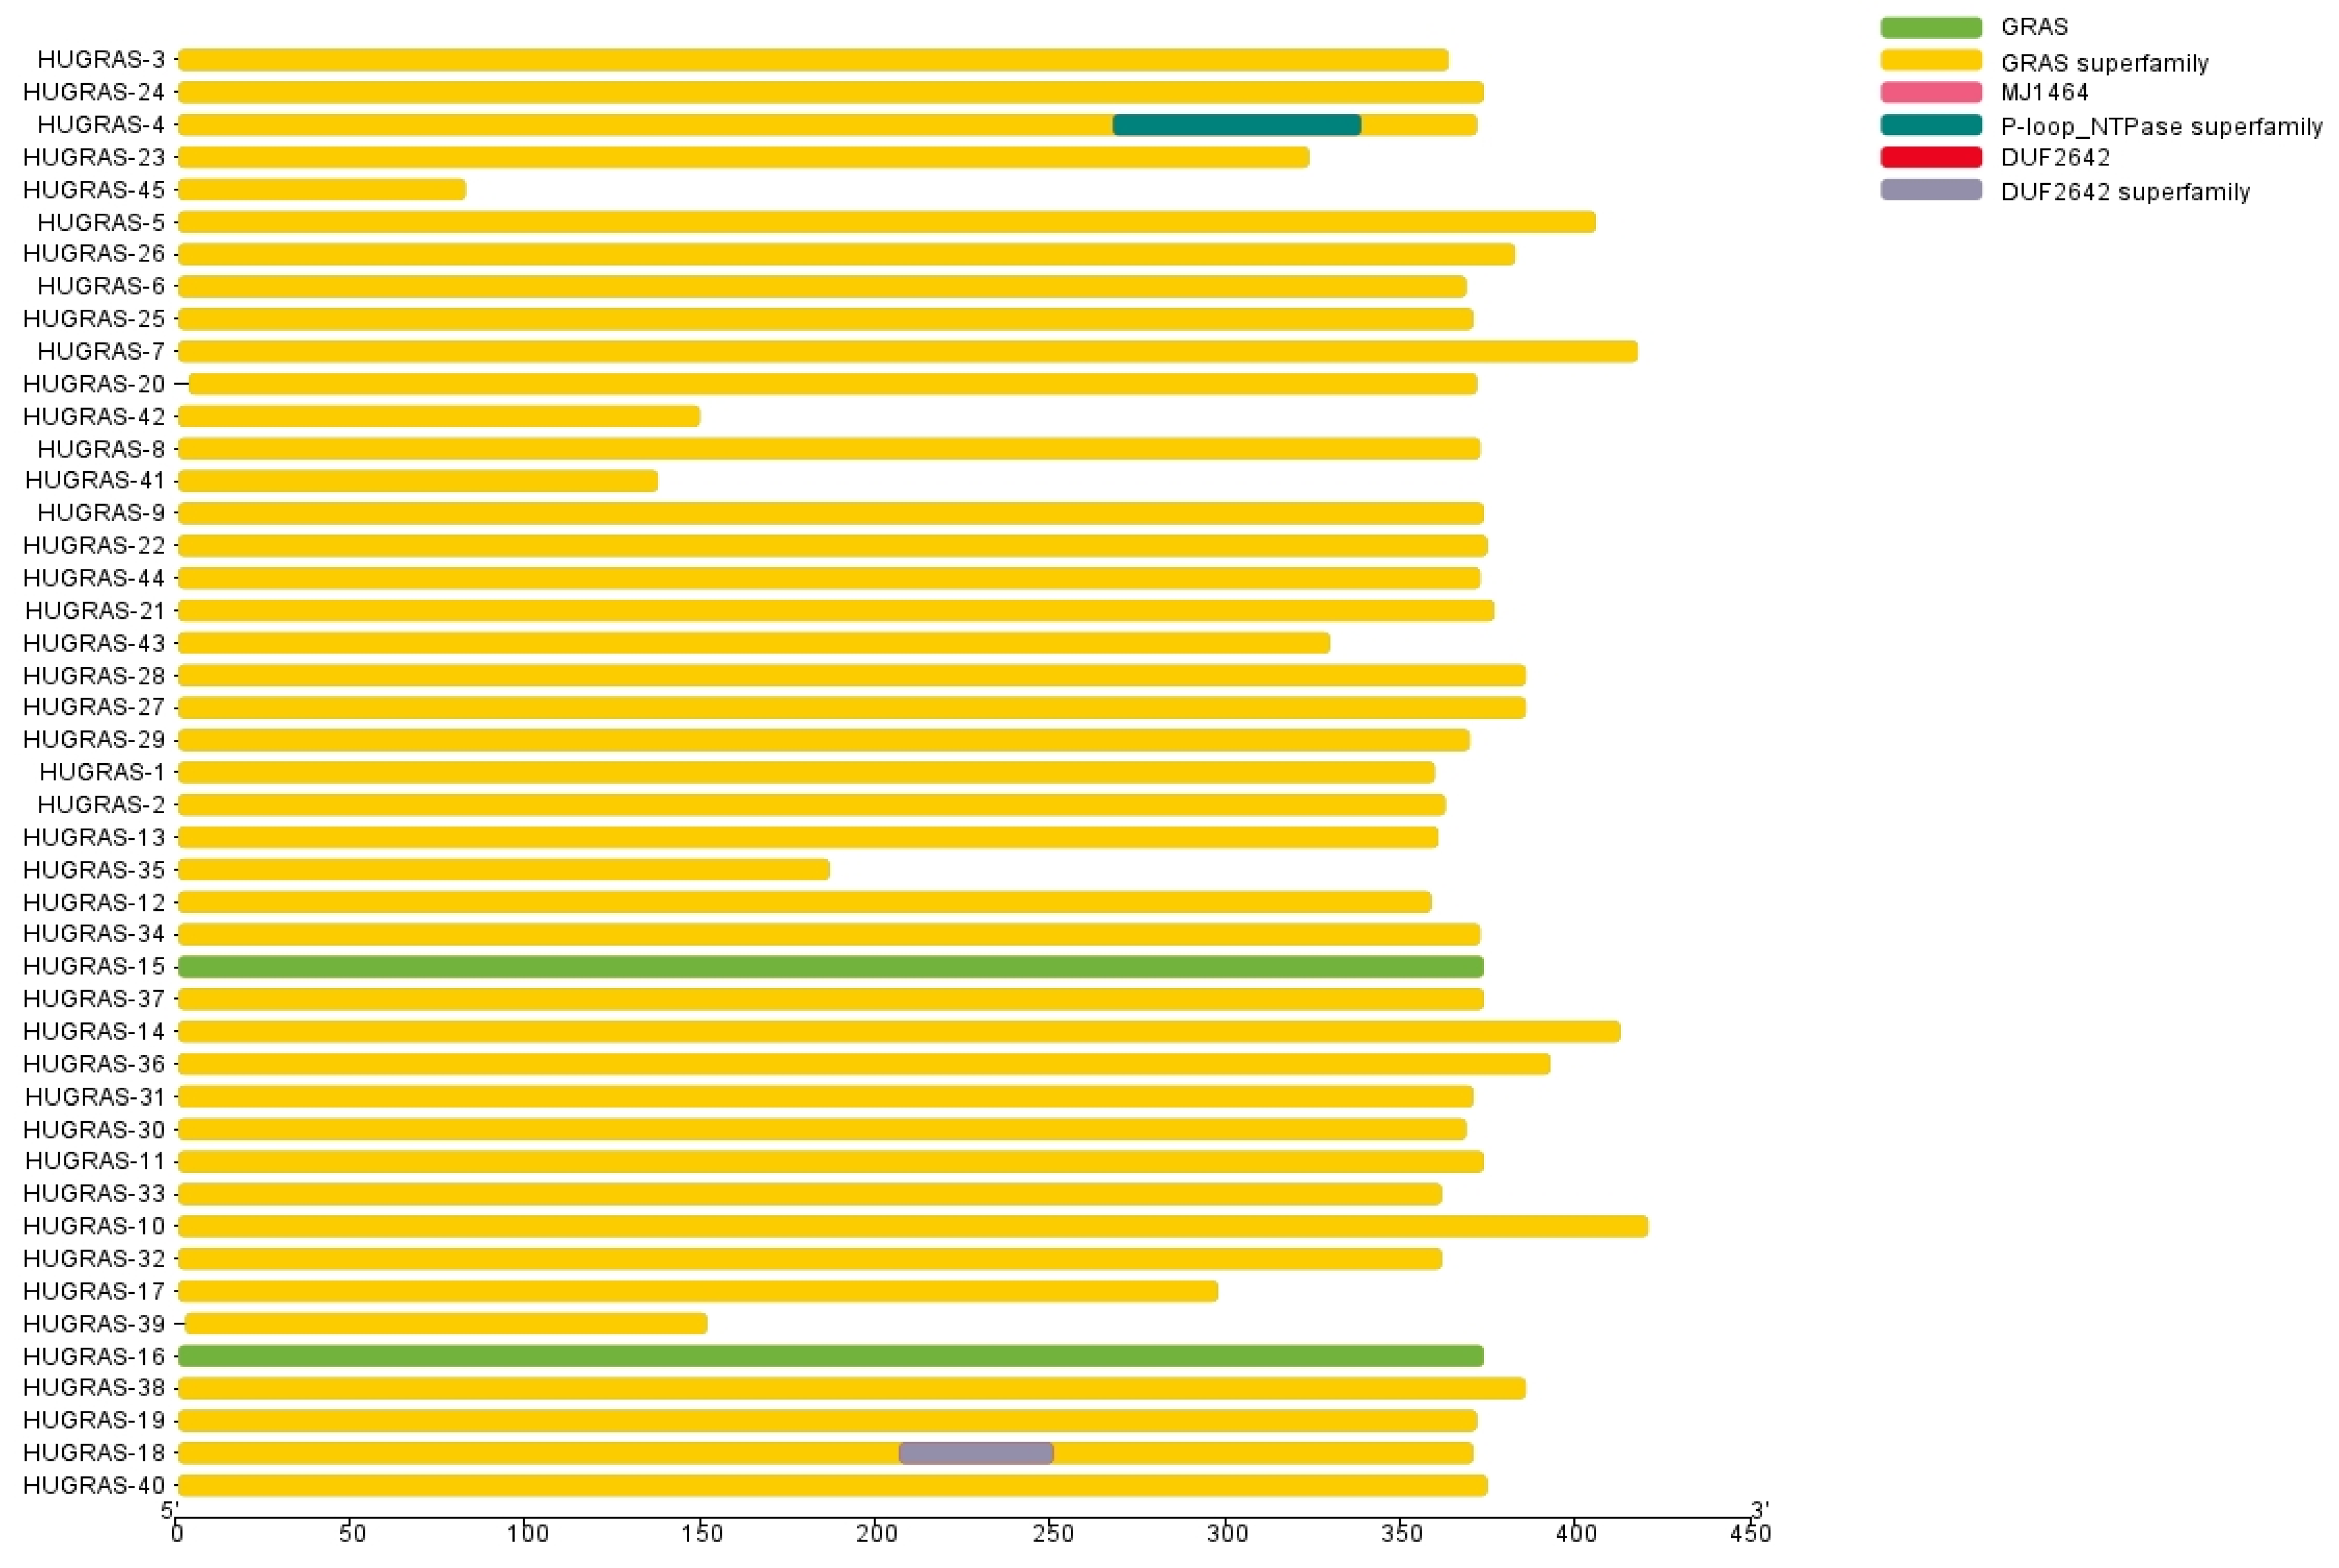
2.2. Domain Analysis of HuGRAS Proteins

All 45 HuGRAS protein sequences were subjected to finding of conserved domains using the NCBI conserved domain tool, https://www.ncbi.nlm.nih.gov/Structure/cdd/wrpsb.cgi (accessed on 13 October 2022), against Pfamv34.0-19178pSSMs. The retrieved data was used to draw the structure of the GRAS domain using TBTools [59]. A motif finder, https://www.genome.jp/tools/motif/ (accessed on 17 October 2022), was also used to compute the concerned motifs.

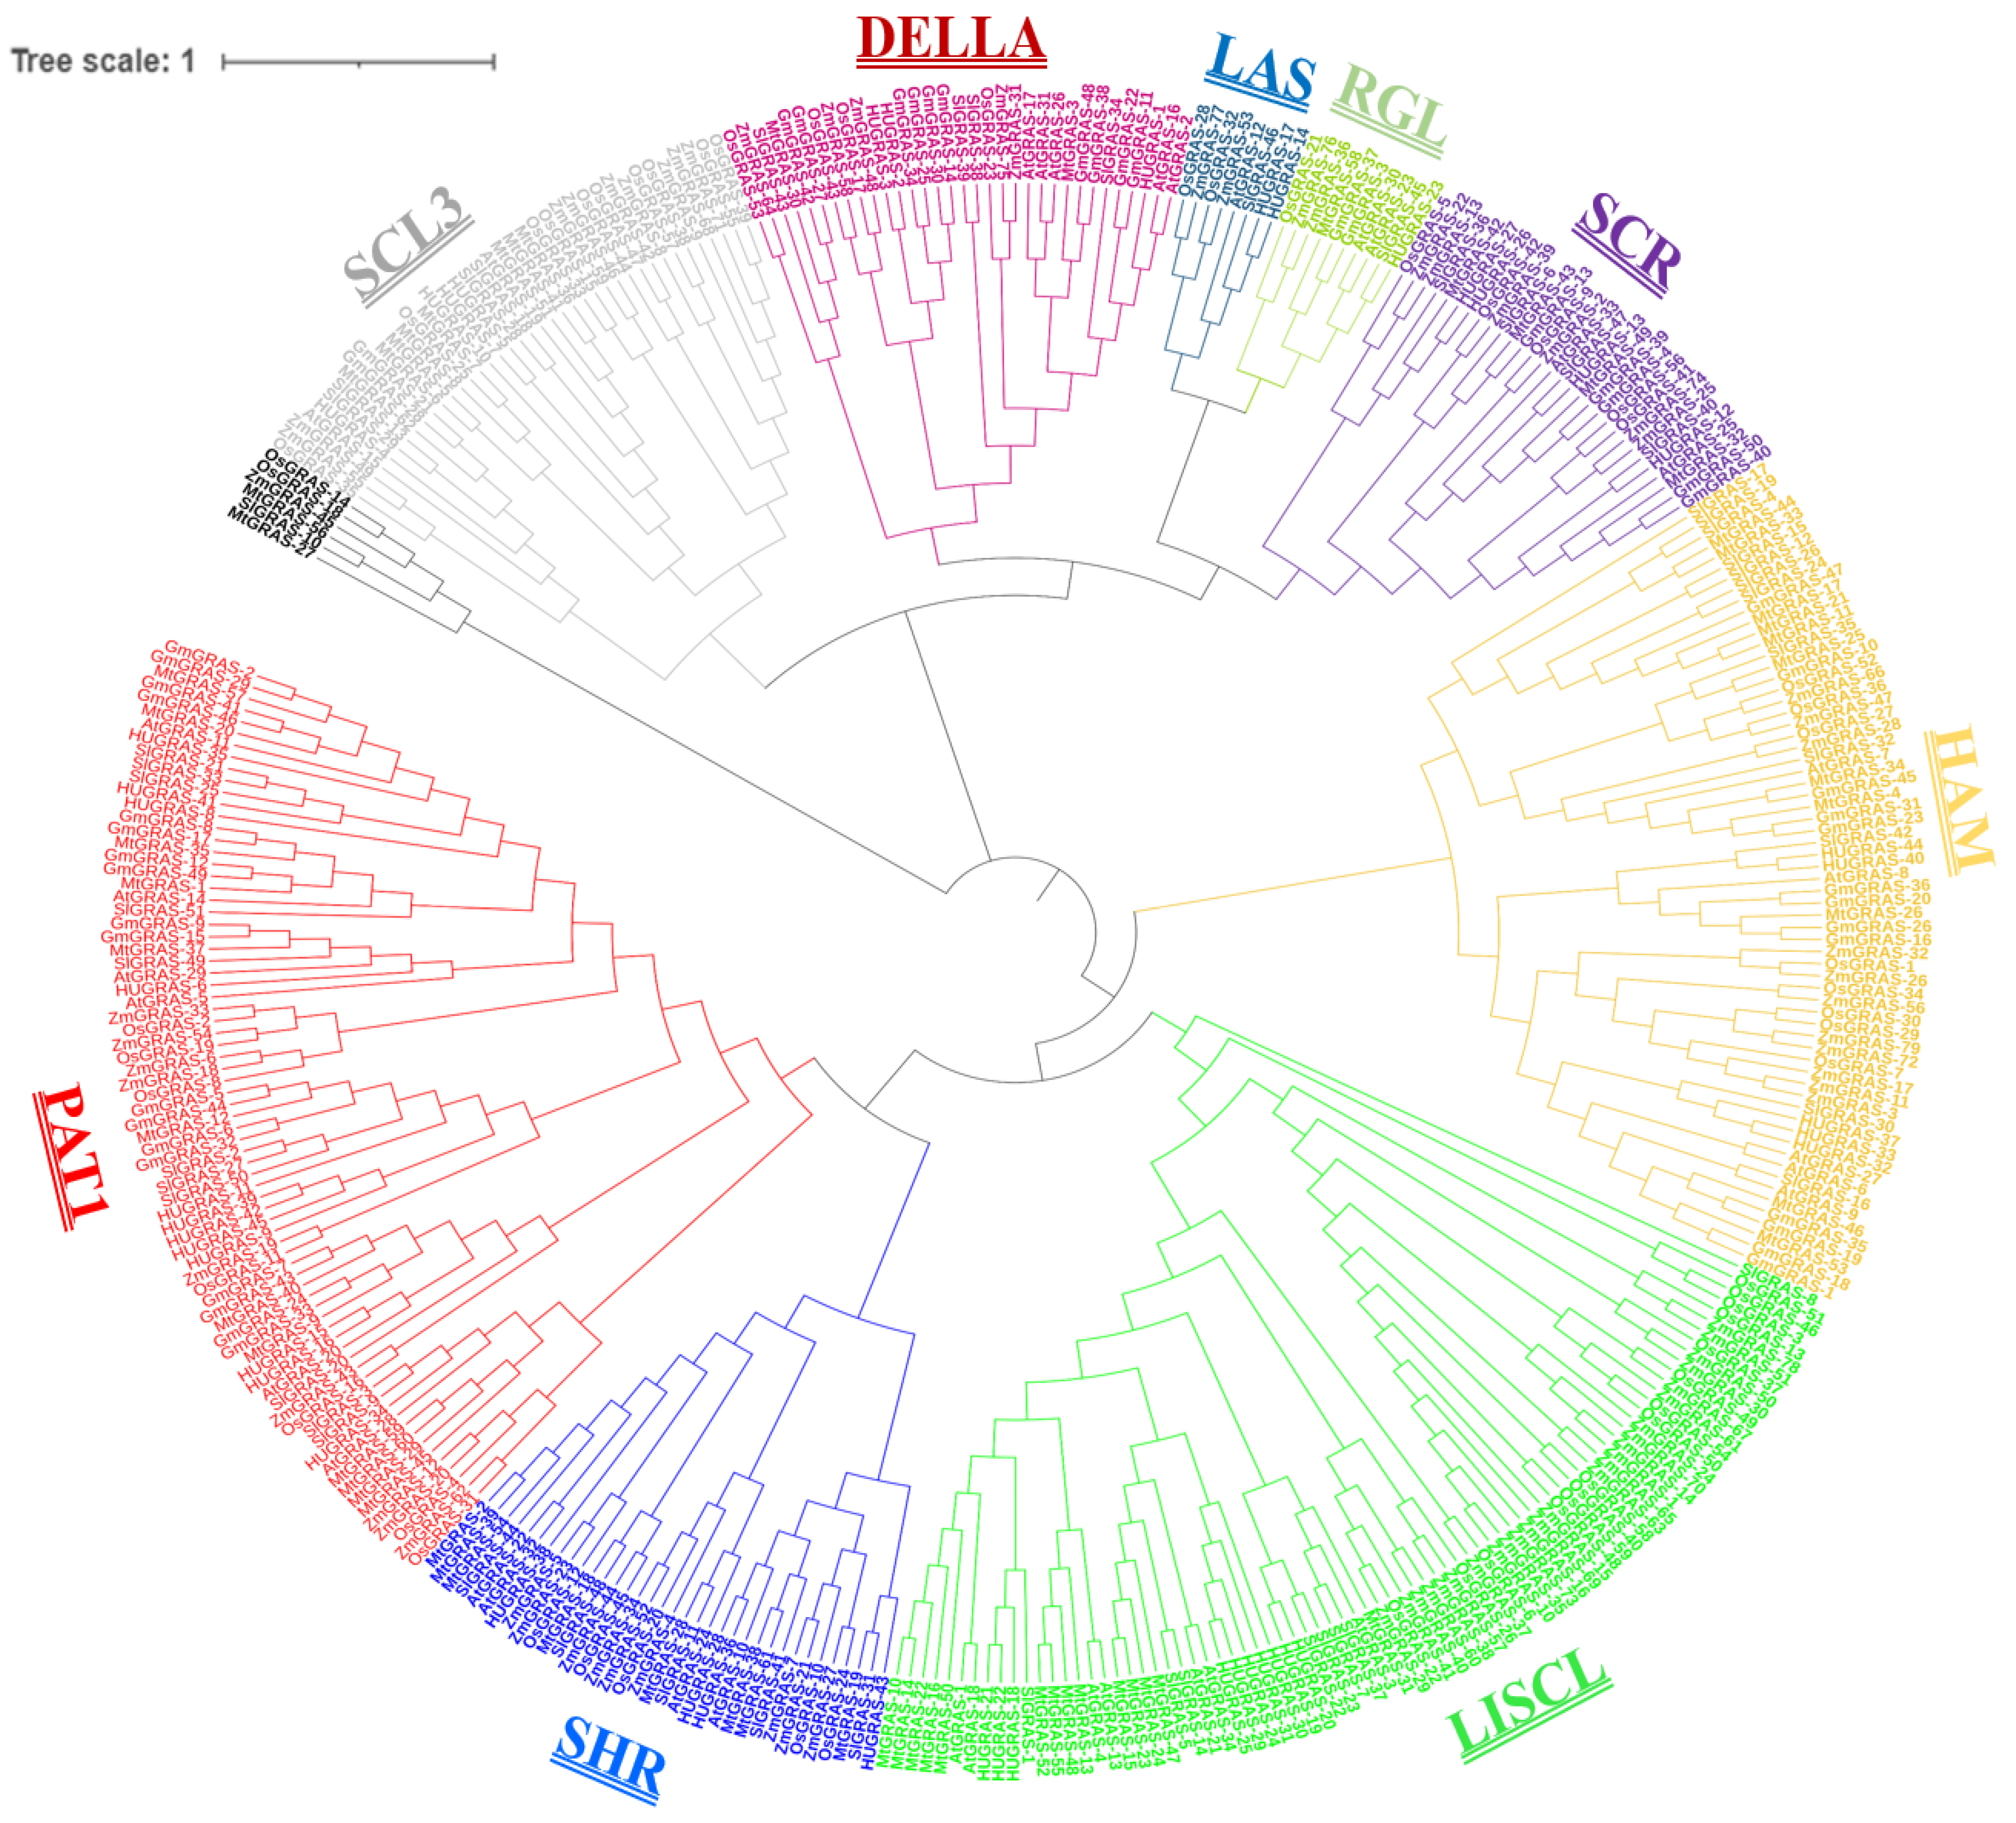
2.3. Phylogenetic Analysis of HuGRAS Family

All GRAS protein sequences of Arabidopsis (A. thaliana araport11), Medicago truncatula (Medicago truncatula Mt4.0v1—barrel medic), soybeans (Glycine max Wm82.a4.v1), rice (Oryza sativa—v7.0), tomatoes (Solanum lycopersicum—ITAG4.0) and corn (Zea mays—Refgen_V4) were downloaded from Phytozome-13 (https://phytozome-next.jgi.doe.gov (accessed on 13 October 2022)) [57], and pitaya (S. undatus—Guanhuabai) protein sequences were retrieved from the “pitaya-genome-website” [56]. All 380 protein sequences were used to perform alignment through molecular evolutionary genetic analysis (MEGA-11) [60]. The aligned protein sequences were employed for phylogenetic analysis with the maximum likelihood tree test, which used 1000 bootstrap replicates. Finally, the tree was visualized using iTOL software [61].

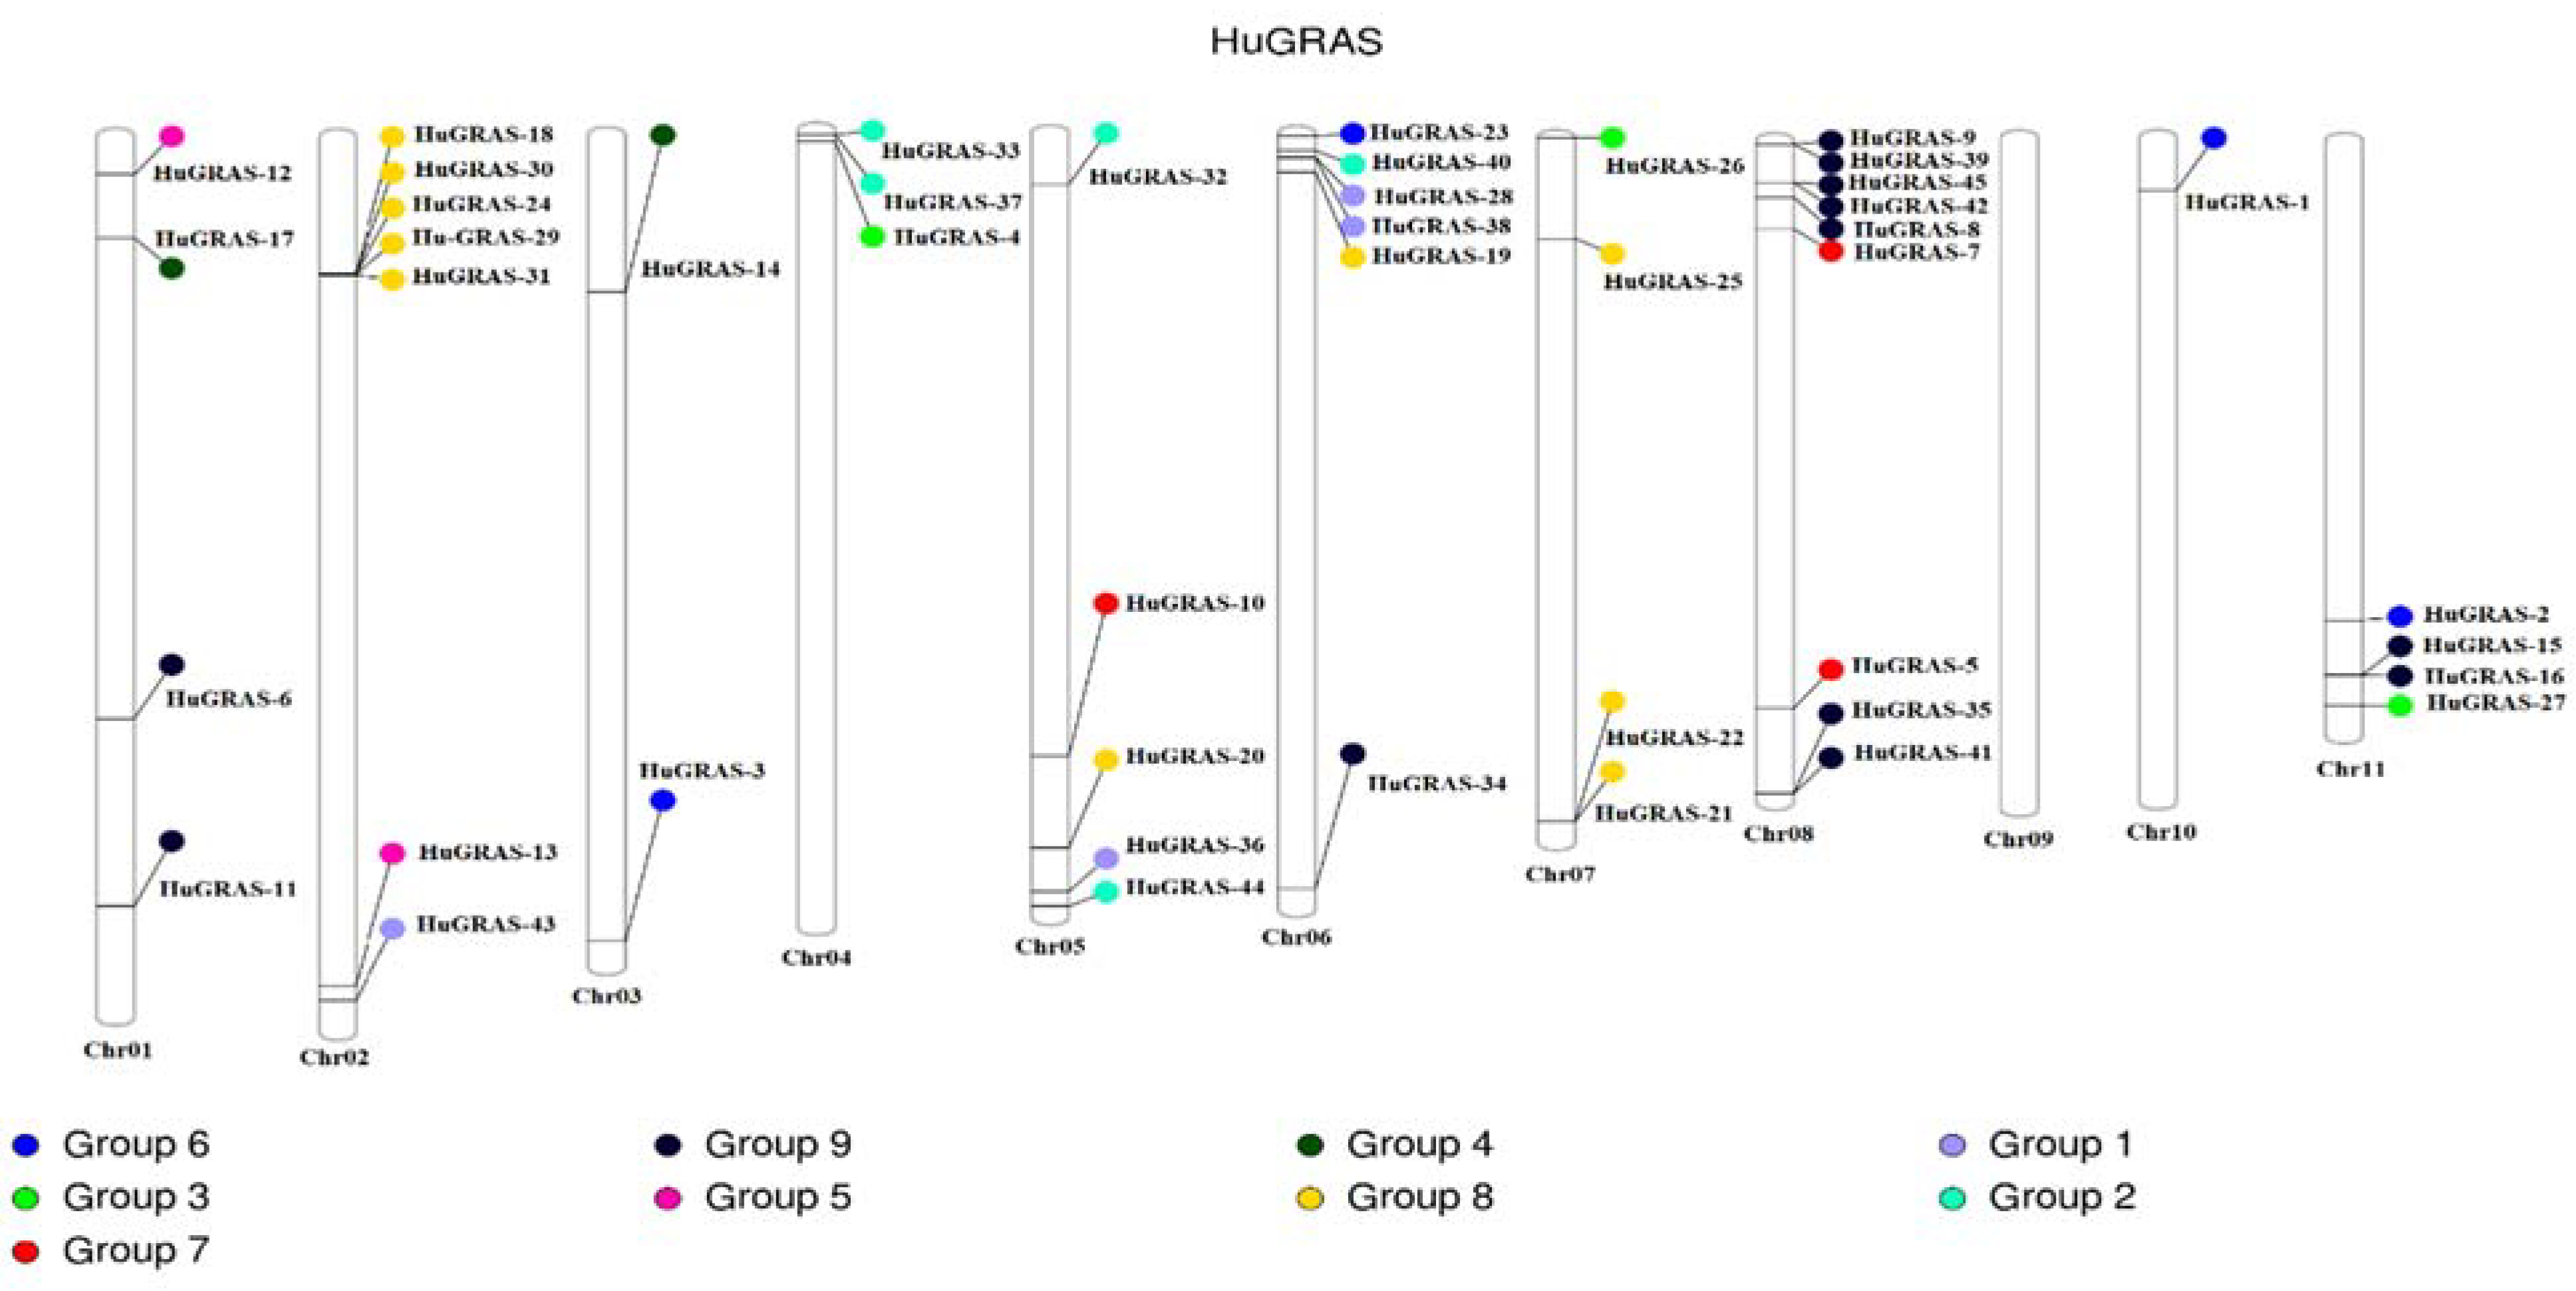
2.4. HuGRAS Genes Distribution on Pitaya Chromosomes

All 45 GRAS genes’ data and genomic DNA were obtained from the pitaya genome database, http://www.pitayagenomic.com/ (accessed on 1 September 2022) [56]. Chromosome length was calculated using TBTools “FASTA stats” [59]. Then, a chr ideogram was created using the PhenoGram plot tool, http://visualization.ritchielab.org/phenograms/plot (accessed on 1 September 2022). The output image thereof was used to mention all HuGRAS genes on the chromosome.

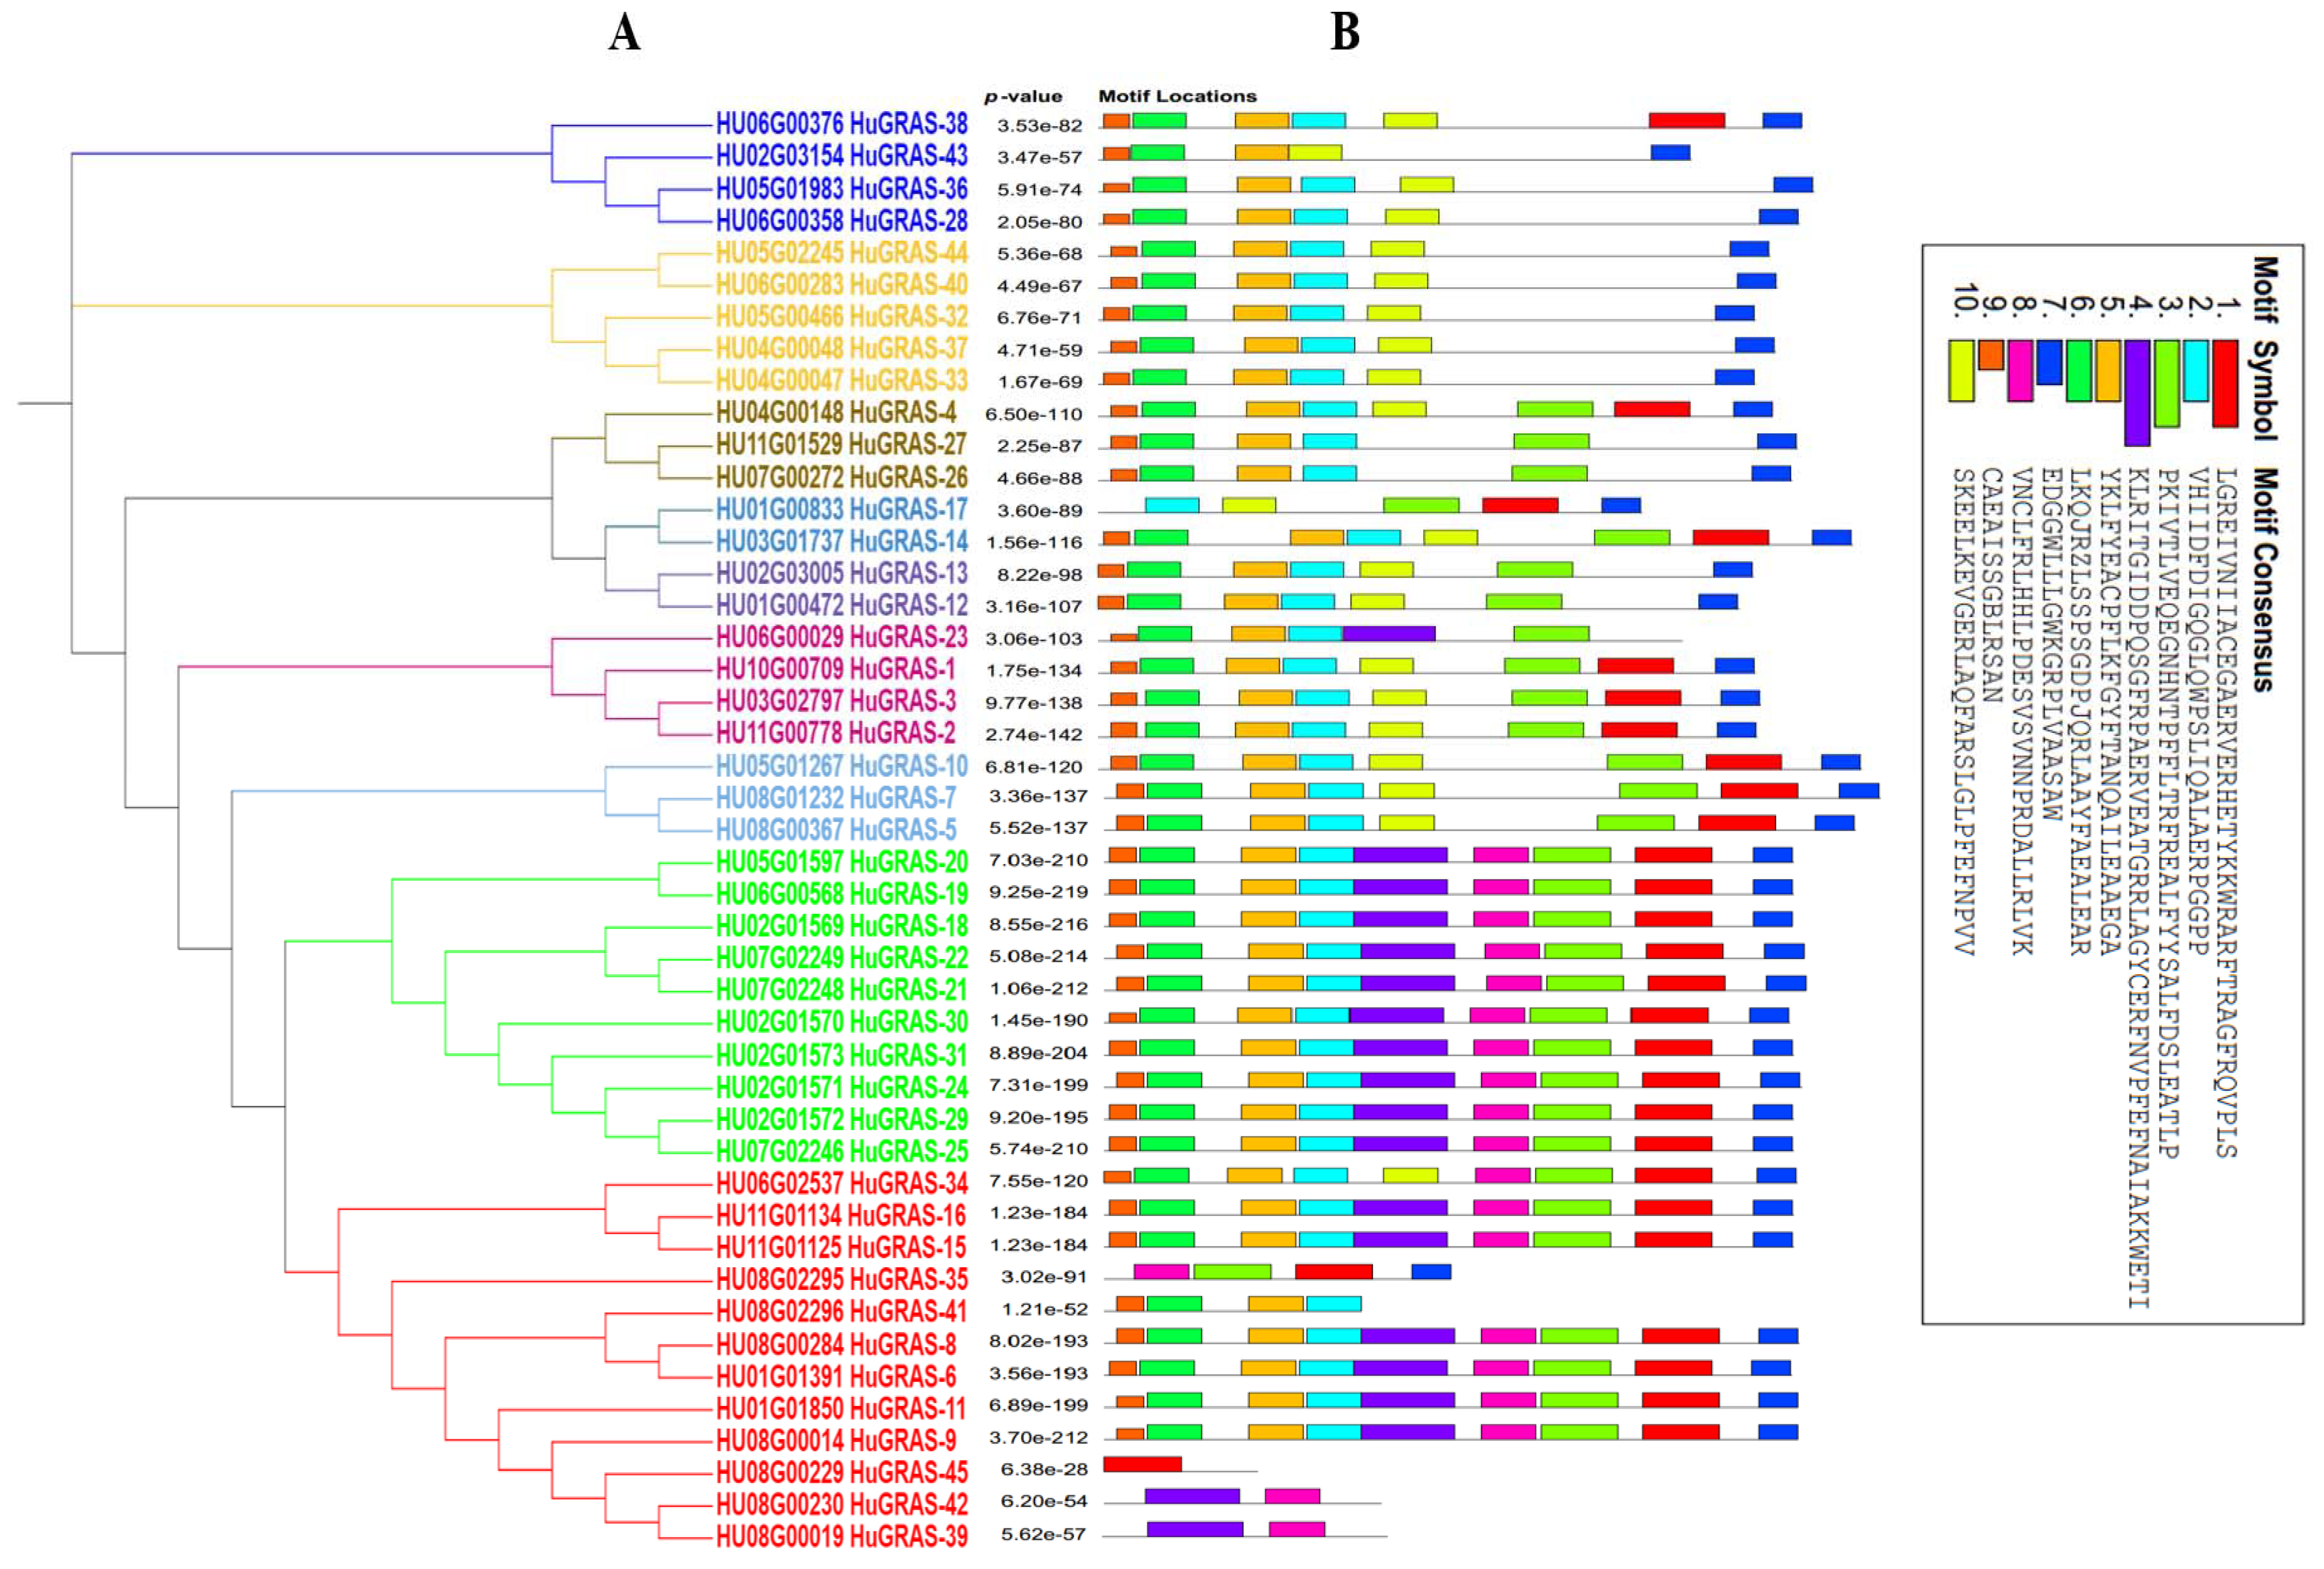
2.5. Pattern and Distribution of Conserved Motifs

The MEME suite program was used to analyze the 45 HuGRAS genes and identify conserved motifs. The default parameters were used to identify the maximum 10 motifs at https://meme-suite.org/meme/tools/meme (accessed on 13 October 2022).

2.6. Expression Analysis of HuGRAS Genes

The expression pattern of the HuGRAS gene family was found via the pitaya genome database (http://www.pitayagenomic.com/ (accessed on 17 October 2022)) [56]. All 45 HuGRAS genes’ expression levels were determined using different tissues of the plants, including four stages of flower buds (FB1, FB2, FB3, FB4), five stages of flower (F1, F2, F3, F4, F5), three stages of pericarp (PeriC-45d, PeriC-65d, PeriC-85d) and three stages of fruit pulp (Pulp-29d, Pulp-35d, Pulp-49d).

2.7. Network Analysis of HuGRAS Proteins

All 45 HuGRAS genes were subjected to collection of their interactions with other genes using the pitaya genome website, http://www.pitayagenomic.com/coexpression (accessed on 30 October 2022) [56]. The Cytoscape tool was used to build the network using information from all of the identified and interacting genes [62].

2.8. Cis-Acting Element Analysis in HuGRAS Promoter Sequences

Promoter sequences were retrieved from the pitaya genome file using TBTools (2000 bp upstream of the start codon) [59]. The PlantCARE database was used to retrieve cisacting regulatory elements [63].

2.9. Plant Materials

The “Shuangse Dahong” pitaya variety was used in this experiment, and flower buds were collected from the germplasm resource of Hainan-Shengda Modern Agriculture Development Company, Qionghai, Hainan, China. All plants were grown in field conditions.

2.10. RNA Isolation and Real-Time Quantitative PCR Expression Analysis

Utilizing the RNAprep Pure Plant Kit, total RNA was extracted (TIANGEN, Beijing, China). The plant material used for RNA extraction included stems (one-month-old stems, one-year-old stems and two-year-old stems, designated S1Ms, S1Ys and S2Ys, respectively), flower buds (FBs), pericarp (PeriC) and pulp. A NanoDrop 2000C spectrophotometer was used to measure the concentration of the samples (Thermo Fisher Scientific, Waltham, MA, USA). DNase I was used to remove genomic DNA from a total of 1 g of RNA from each sample before being utilized as a template for reverse transcription to create the desired amount of cDNA (QuantiTect Reverse Transcription Kit; Qiagen, Shanghai, China). The RNA sample for each qRT-PCR was standardized using the actin-gene-expression level in S. undatus L. Three biological and three technical replications of each sample were used in the qPCR, with ACTIN serving as the internal control. The SYBER Green Master Mix (Novogene, Shanghai, China) was used, along with the LightCycler 480 real-time PCR system (Applied Biosystem, St. Louis, MO, USA). qRT-PCR results were analyzed using the double-delta CT method [64,65].

3. Results

3.1. Genome-Wide Identification of the GRAS Family in Pitaya

Through genome-wide analysis, 45 candidate genes were retrieved from the pitaya genome, and these genes were designated HuGRAS-1 to HuGRAS-45. Basic physical and chemical properties of the HuGRAS genes, including each gene’s chromosome number, position on the chromosome, CDS length, protein length, protein molecular weight, isoelectric point (pI) and GRAVY, are summarized in Table 1. Protein length and molecular weight varied greatly, ranging from 97 (HU08G00229.1) to 809 AA (HU01G00472.1), and molecular weight ranged from 15–95 kDa. All 45 pitaya HuGRAS proteins were predicted to be hydrophilic because their representative GRAVY values were less than 0, ranging from −0.006 (HU06G00376.1) to −0.436 (HU02G01570.1). All HuGRAS proteins comprised varying degrees of pI values, ranging from 5.4 (HU10G00709.1) to 9.5 (HU08G00229.1), with an average value of 7.2.
Furthermore, domain-based analysis was carried out for all 45 HuGRAS proteins using an NCBI domain search, and the retrieved data and TBTools were further used to draw the structure of the domain. This domain-based analysis confirmed the presence of the GRAS family on 45 selected protein sequences (Figure 1).

3.2. Phylogenetic Analysis of the GRAS Gene Family

To construct a phylogenetic tree, protein sequences from the characterized species were retrieved from previous studies, including those on Arabidopsis, Medicago truncatula, tomatoes, rice, soybeans and maize. Characterized GRAS protein sequences from six species and the Phytozome website were used to retrieve all GRAS proteins from their respective genomes. Collectively, 380 protein sequences were used to draw a phylogenetic tree, including the 45 HuGRAS protein sequences from the pitaya genome and 335 protein sequences from the other six species (Supplementary File S1). In the resulting phylogenetic tree, the GRAS genes were divided into nine subfamilies: PAT1, SHR, LISCL, HAM, SCR, RGL, LAS, DELLA and SCL3 (Figure 2). All 45 HuGRAS proteins were grouped as follows: twelve in PAT1; ten in LISCL; five in HAM; four each in SHR, SCL3 and SCR; three in DELLA; two in LAS; and one in RGL. The PAT1 subfamily contained 12 types of HuGRAS protein and was the largest subfamily of GRAS protein, while RGL had only one type of HuGRAS protein and was one of the smallest subfamilies of GRAS protein.

3.3. HuGRAS-Protein Sequence Alignments and Conserved Motifs

A conserved-motif analysis of each GRAS protein was carried out using the MEME tool. Ten conserved motifs were identified. The C terminal regions of the HuGRAS proteins contained highly conserved domains. Motif 2, motif 6 and motif 7 were found in almost all of the HUGRAS proteins. However, motif 5 was not found in HuGRAS-35, HuGRAS-39, HuGRAS-42 or HuGRAS-45 (Figure 3). Most of the GRAS proteins carried similar motifs within the group, with very few motif differences. These findings also helped us to understand the close evolutionary relationships of the same protein group. The known-motif of the amino-acid-sequence is exhibited in Figure S1.

3.4. Gene Structure and Distribution of HuGRAS Genes on Chromosomes

To find the gene structures, the intron and exon structures of all of the HuGRAS genes were aligned (Figure S2). Among all 45 HuGRAS genes, most of the HuGRAS gene sequences showed two sequences of introns and one sequence of exons. The majority of the HuGRAS genes had a similar pattern of exons, indicating the phylogeny and evolution of their gene family, except for HuGRAS-8 and HuGRAS-42.
The HuGRAS genes were physically located on 11 chrs in the pitaya genome. All GRAS genes were mapped on pitaya chrs based on the information available at the pitaya genome website, http://www.pitayagenomic.com/ (accessed on 1 September 2022). The chr length and position of each gene of the pitaya genome is presented in Supplementary File S2. Forty-five HuGRAS genes were unevenly distributed on 11 chrs. Most of the HuGRAS genes were found on chr 02 and chr 08. Chr 10 had one GRAS gene but chr 09 had no HuGRAS genes (Figure 4).

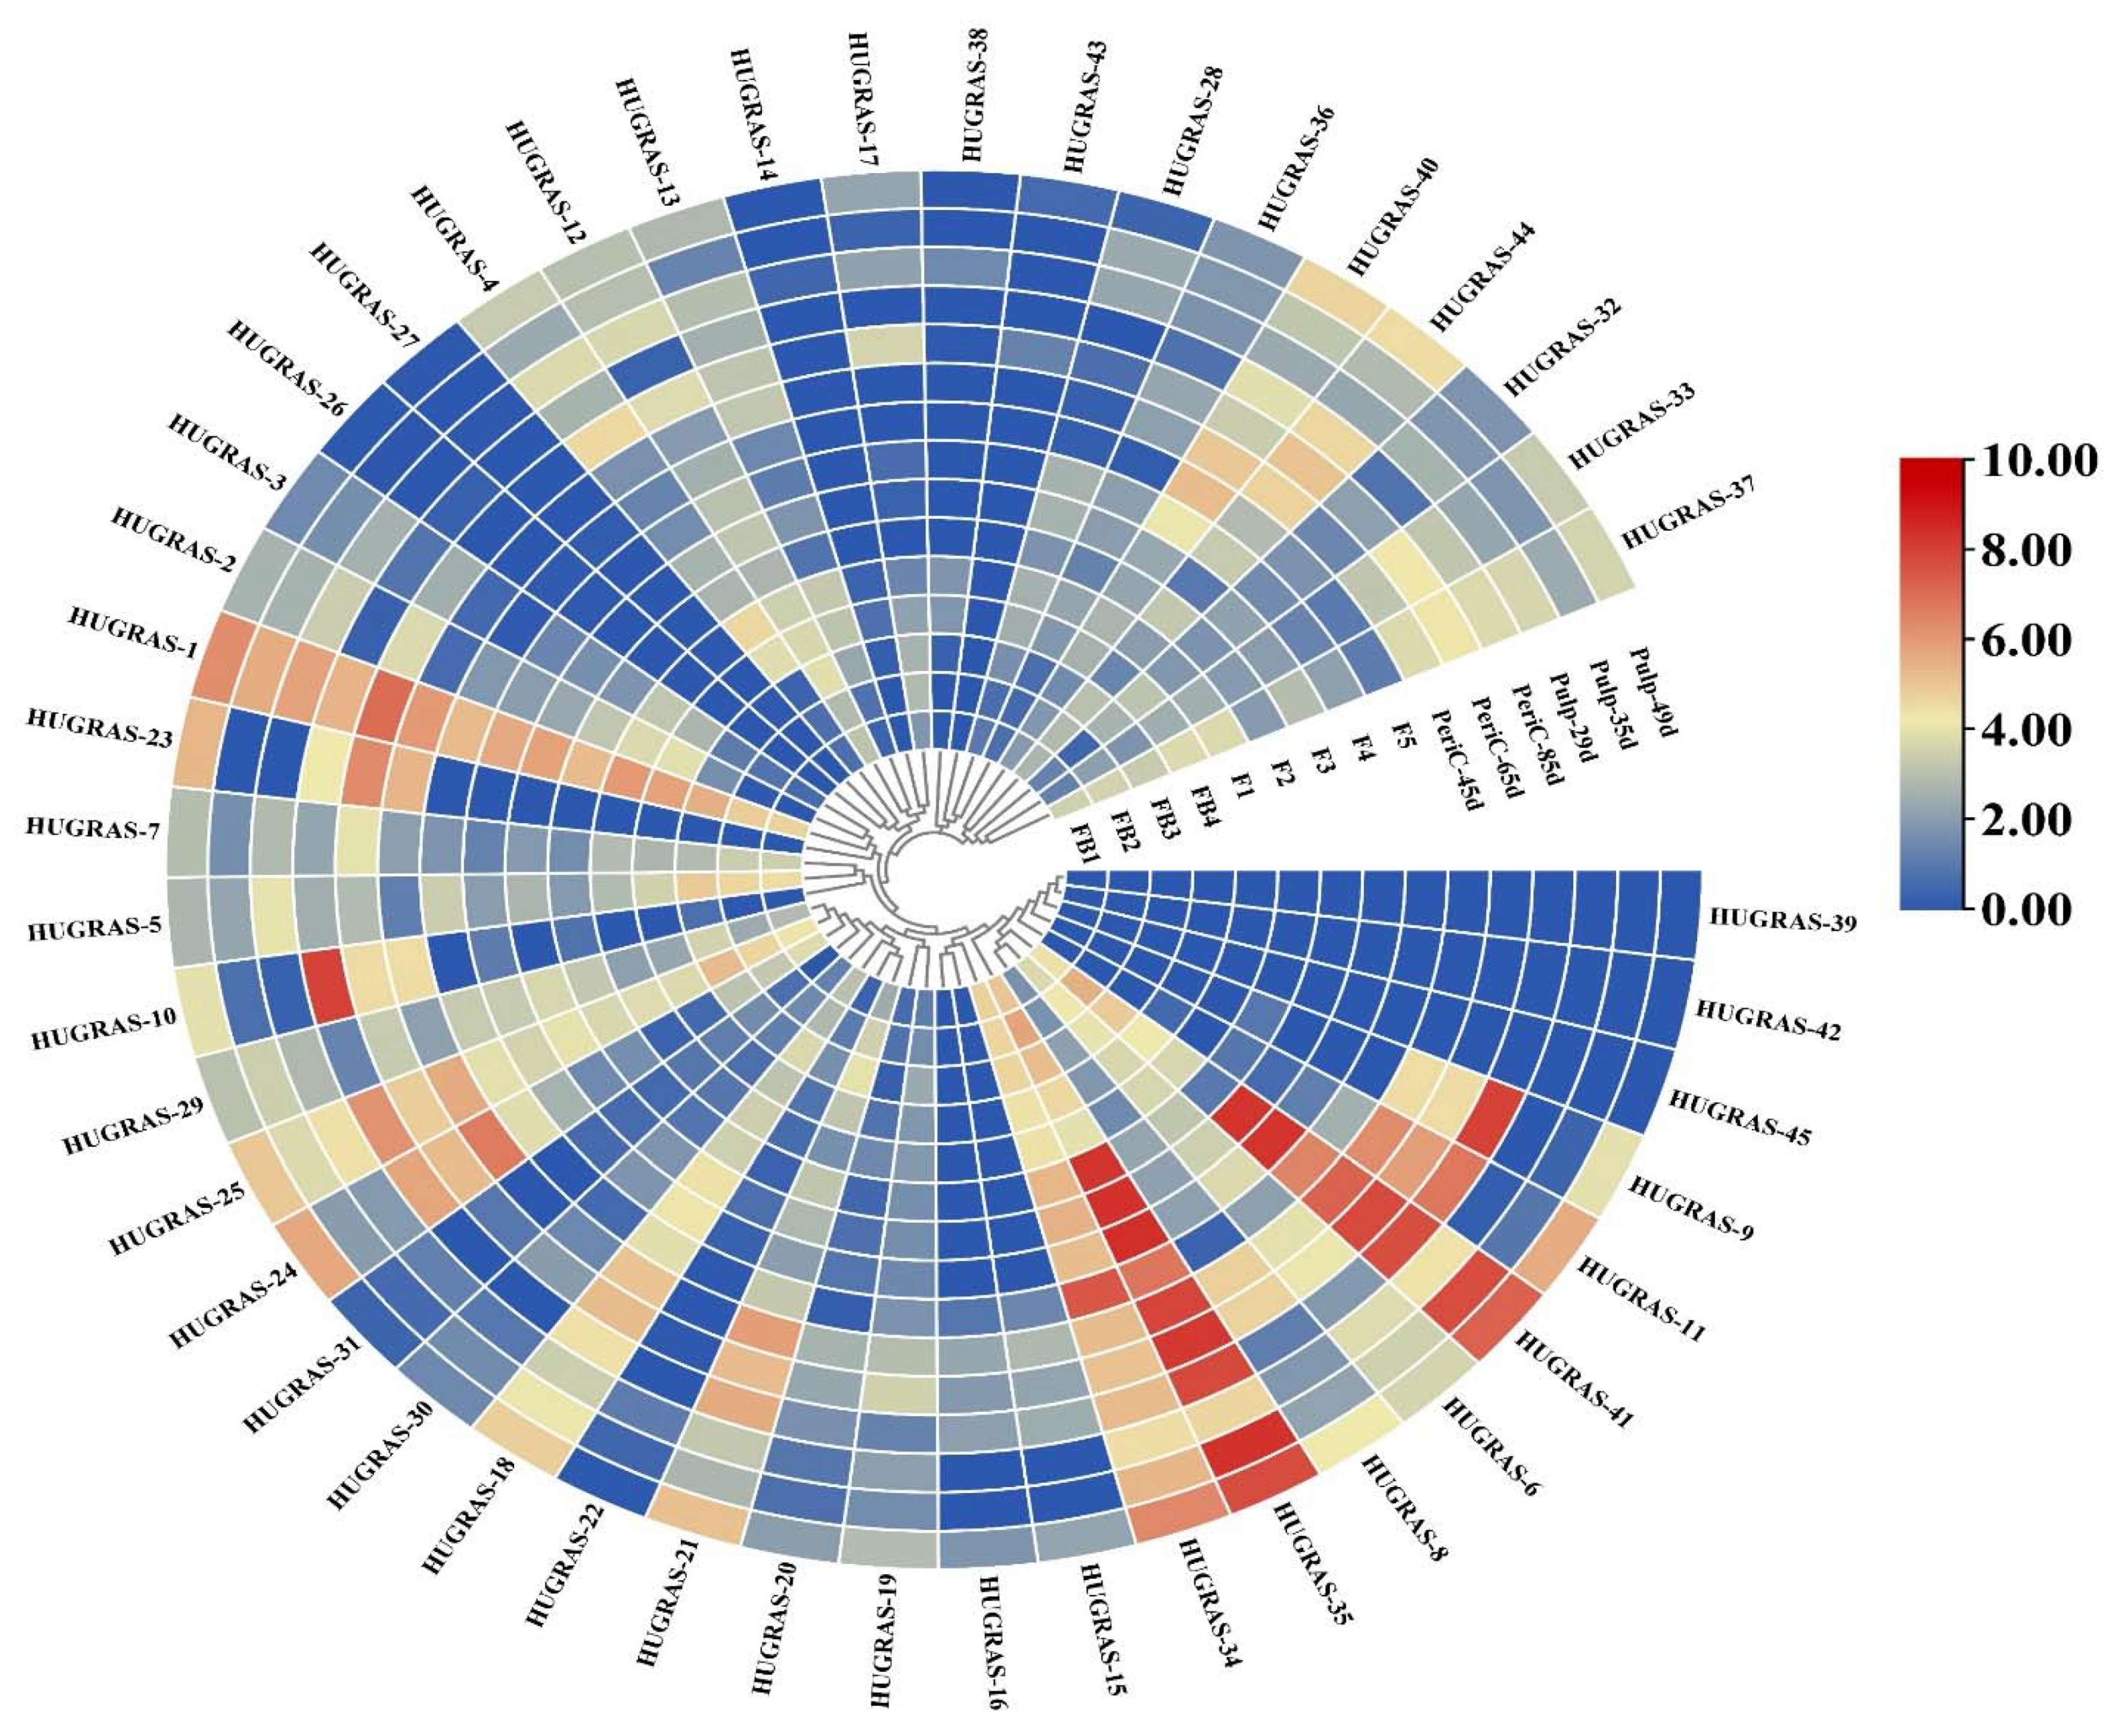
3.5. Expression Analysis of HuGRAS Genes in Different Tissues of Pitaya

GRAS TFs and GRAS subfamily members, including DELLA, HAM, LAS, LISCL, PAT1, SCR, SCL3, SHR and RGL, play important roles in plant growth and development, axillary meristem formation, root radial patterning, cell maintenance and proliferation, defense response and stress tolerance. The genes in each tissue play central roles in pitaya development. The expression of GRAS genes in the pitaya plant comprises 15 tissues, including flower buds (four stages—FB1 to FB4), flowers (five stages—F1 to F5), pericarp (three stages—45 days, 65 days, 85 days) and the pulp of the fruit (three stages—29 days, 35 days, 49 days). Of the 45 HuGRAS genes, most were not expressed (Figure 5). We choose 12 genes that showed significant differential expression in all tissues: HuGRAS-1, HuGRAS-6, HuGRAS-7, HuGRAS-12, HuGRAS-18, HuGRAS-21, HuGRAS-25, HuGRAS-29, HuGRAS-34, HuGRAS-35, HuGRAS-37 and HuGRAS-41.

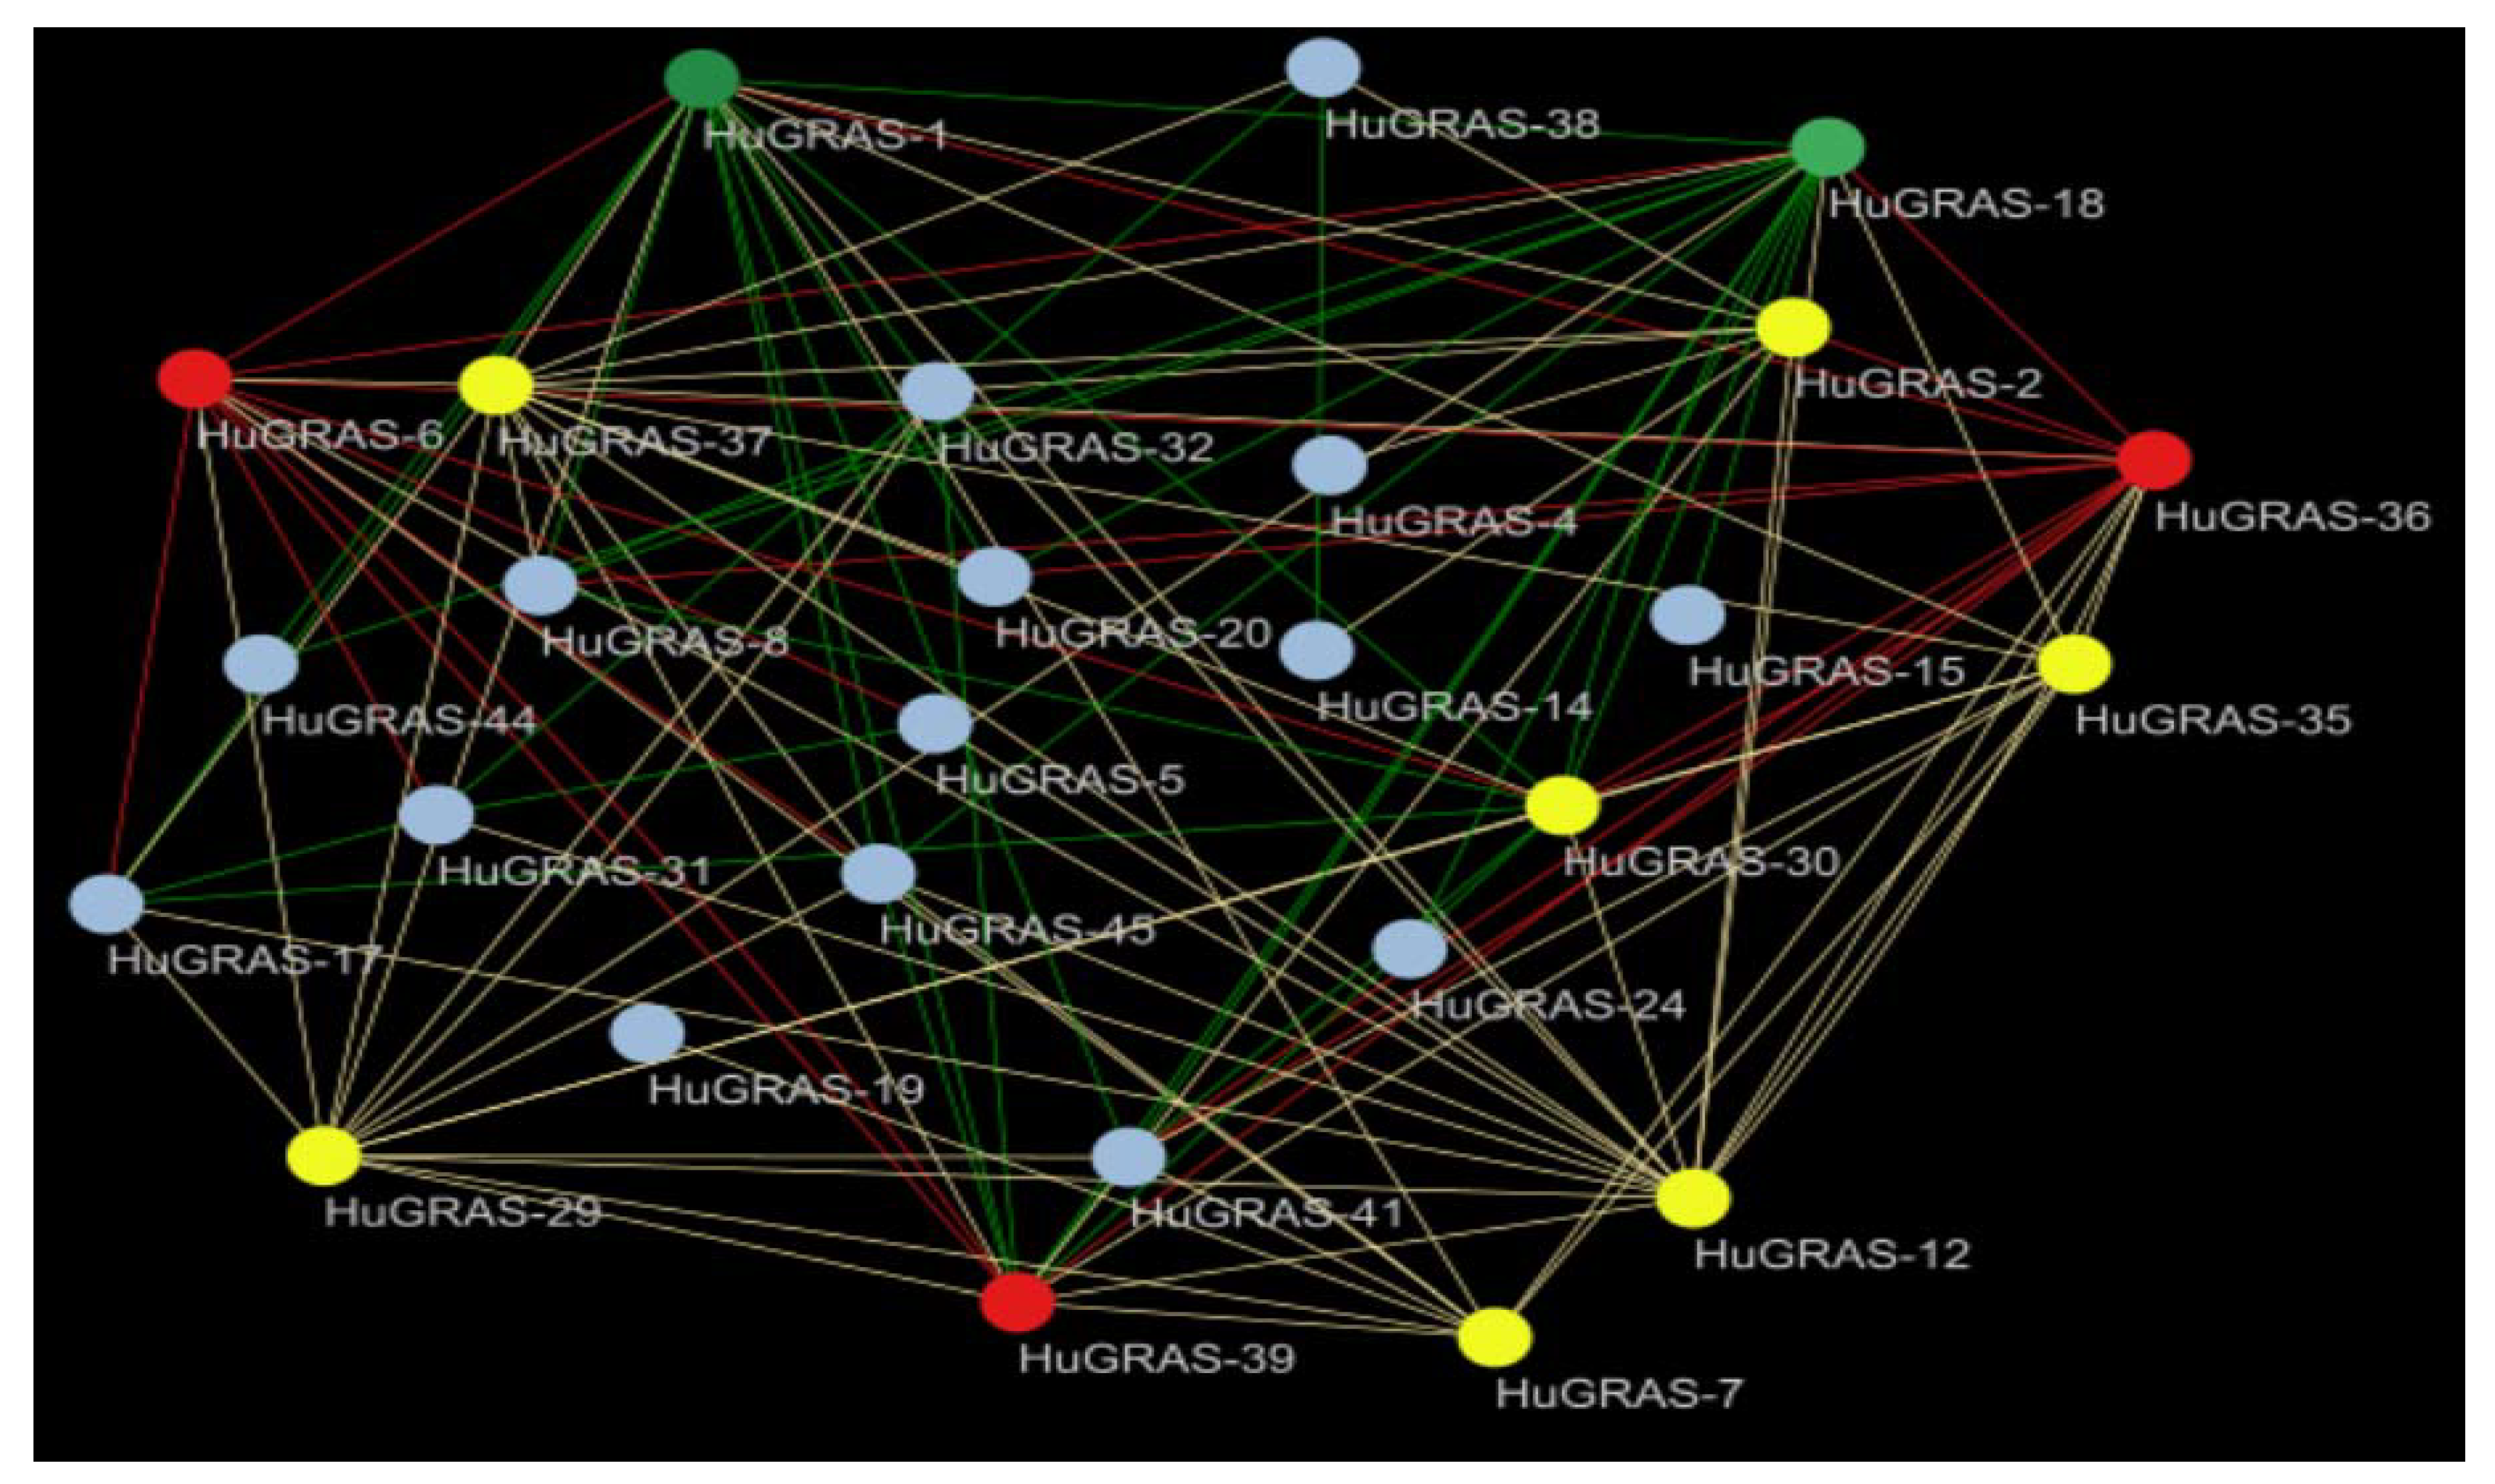
3.6. HuGRAS Proteins Network Analysis

The HuGRAS proteins and their interaction network revealed that the number of proteins regulated by each predicted gene is significantly different. Among the 45 HuGRAS genes, 27 genes were involved in 215 possible interactions. Based on network analysis, we divided the interacting genes into four categories: gray (2–5 interactions), yellow (6–10 interactions), red (11–15 interactions) and green (16–20 interactions). Based on the maximum interaction, we identified HuGRAS-1, HuGRAS-18, HuGRAS-6, HuGRAS-36 and HuGRAS-39 as hub genes, shown with green and red color (Figure 6). In the yellow category, we found that HuGRAS-12, HuGRAS-29, HuGRAS-35 and HuGRAS-37 interacted significantly with other genes.

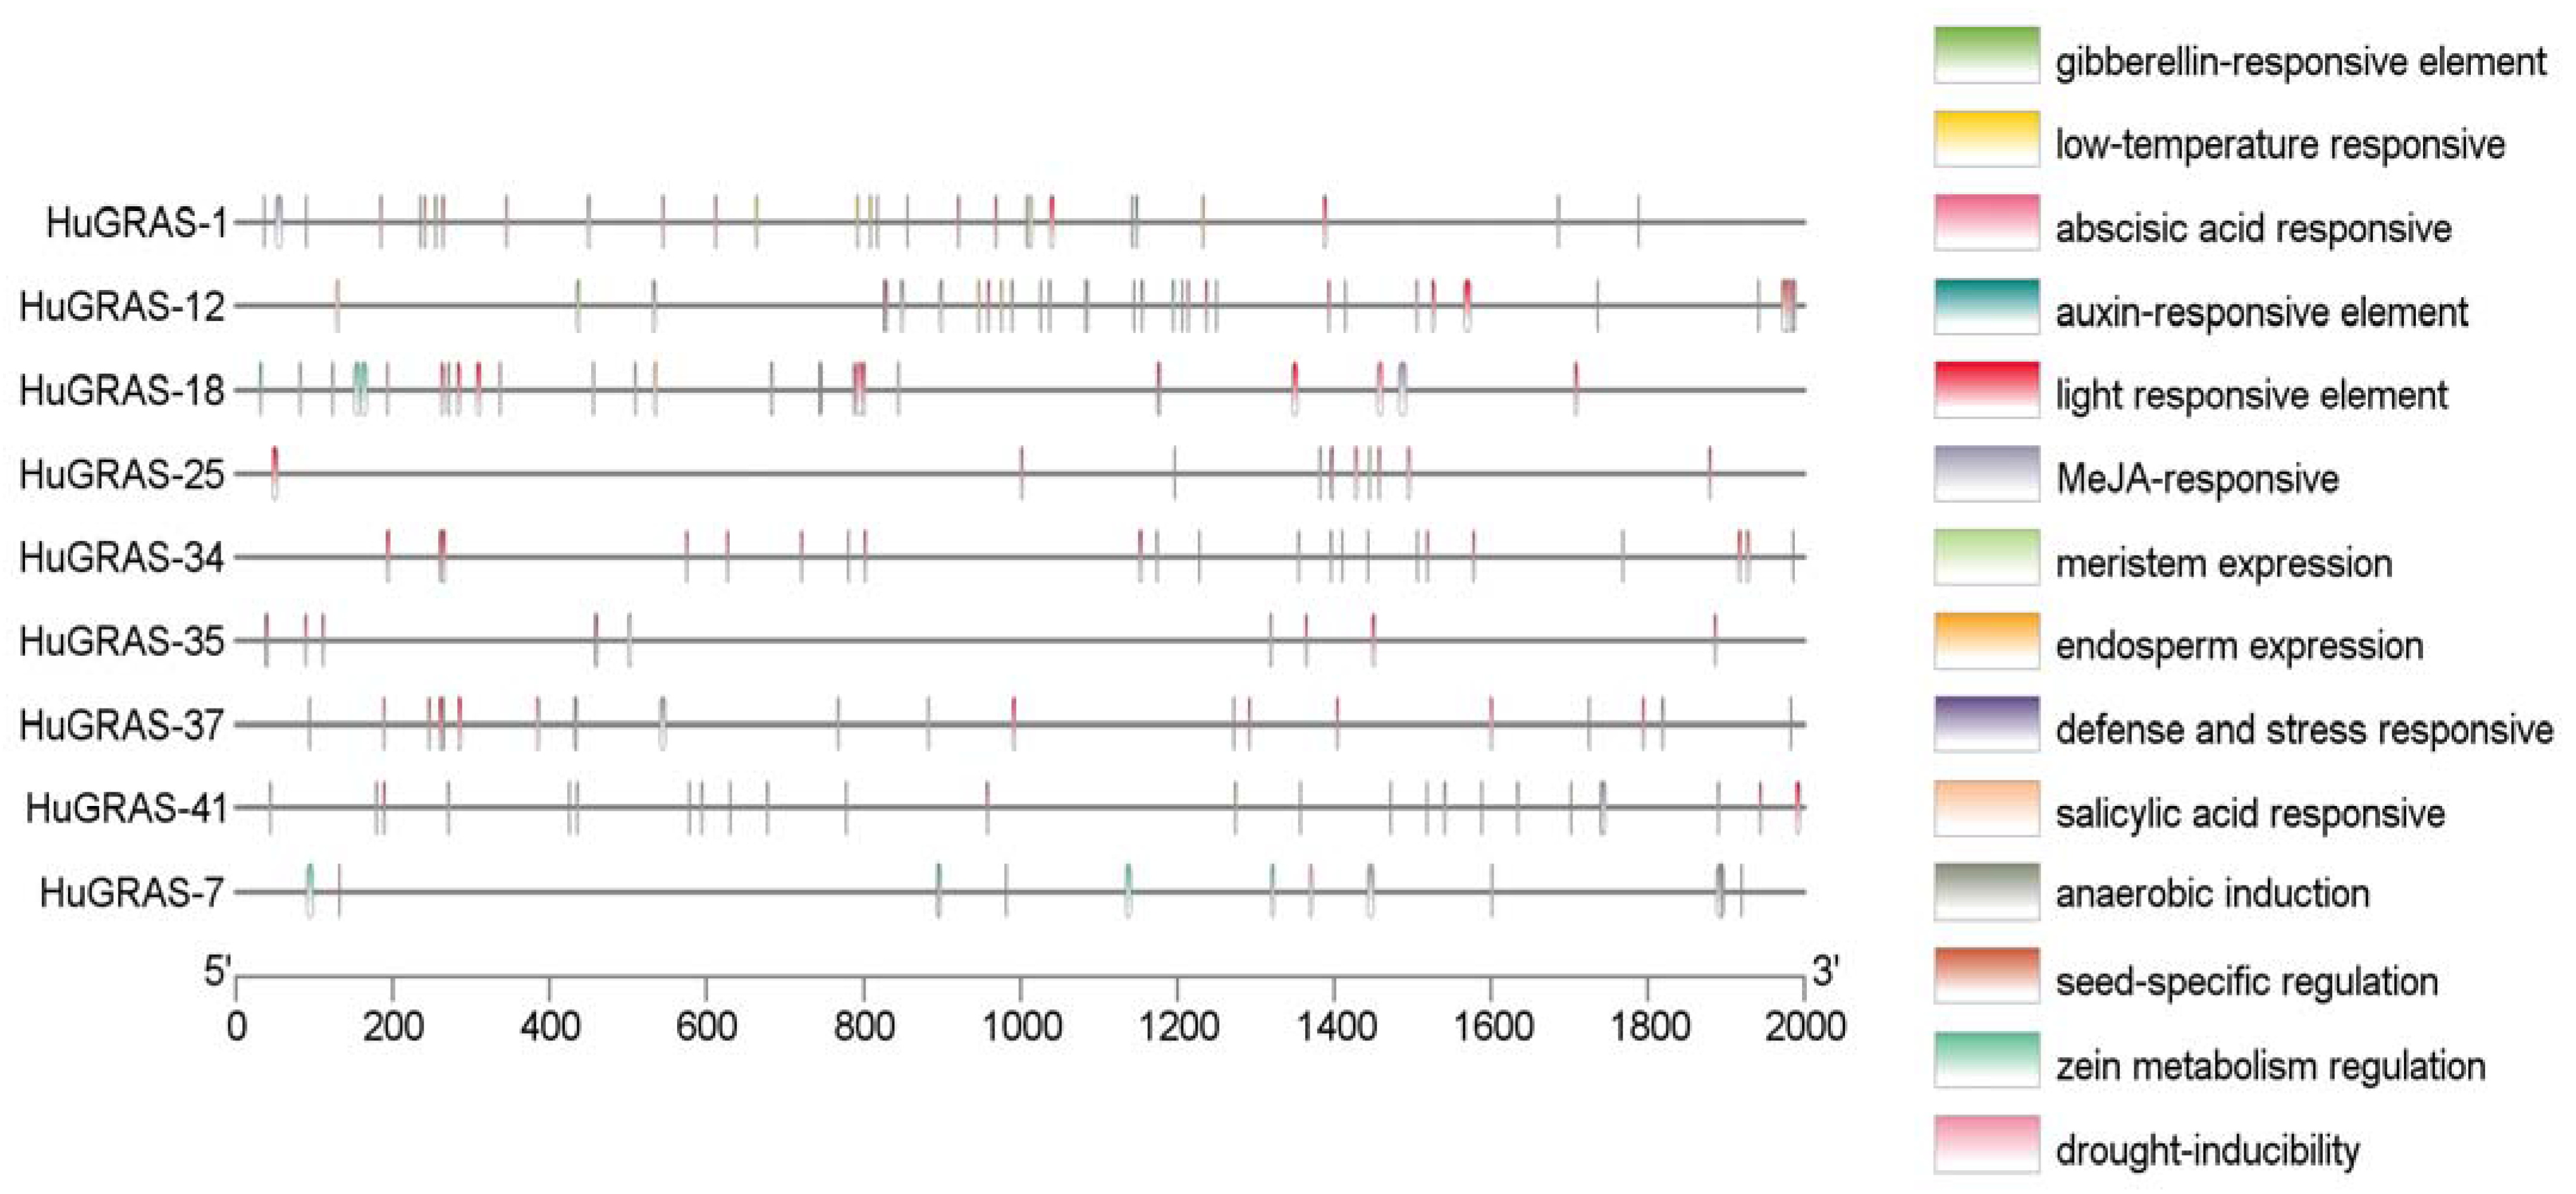
3.7. Identification of Cisacting Elements in HuGRAS Promoter Sequences

To identify the biological functions (stress response, growth and development) of the HuGRAS genes, all 45 HuGRAS gene sequences (2000 bp upstream of start codon) were selected for cis-element analysis using the PlantCARE web tool (Supplementary File S3). In total, 17 cis-elements were recorded in this study (Figure S3). The cis-regulatory elements of 45 GRAS proteins are shown in Figure S3. Nine genes that exhibited higher expression among the GRAS gene family in the pitaya plant exhibited various cis-acting regulatory elements, as shown in Figure 7. Fourteen cis-acting elements were categorized into four groups: light-responsive elements, growth and development elements, stress- and defense-responsive elements and hormone-responsive elements.

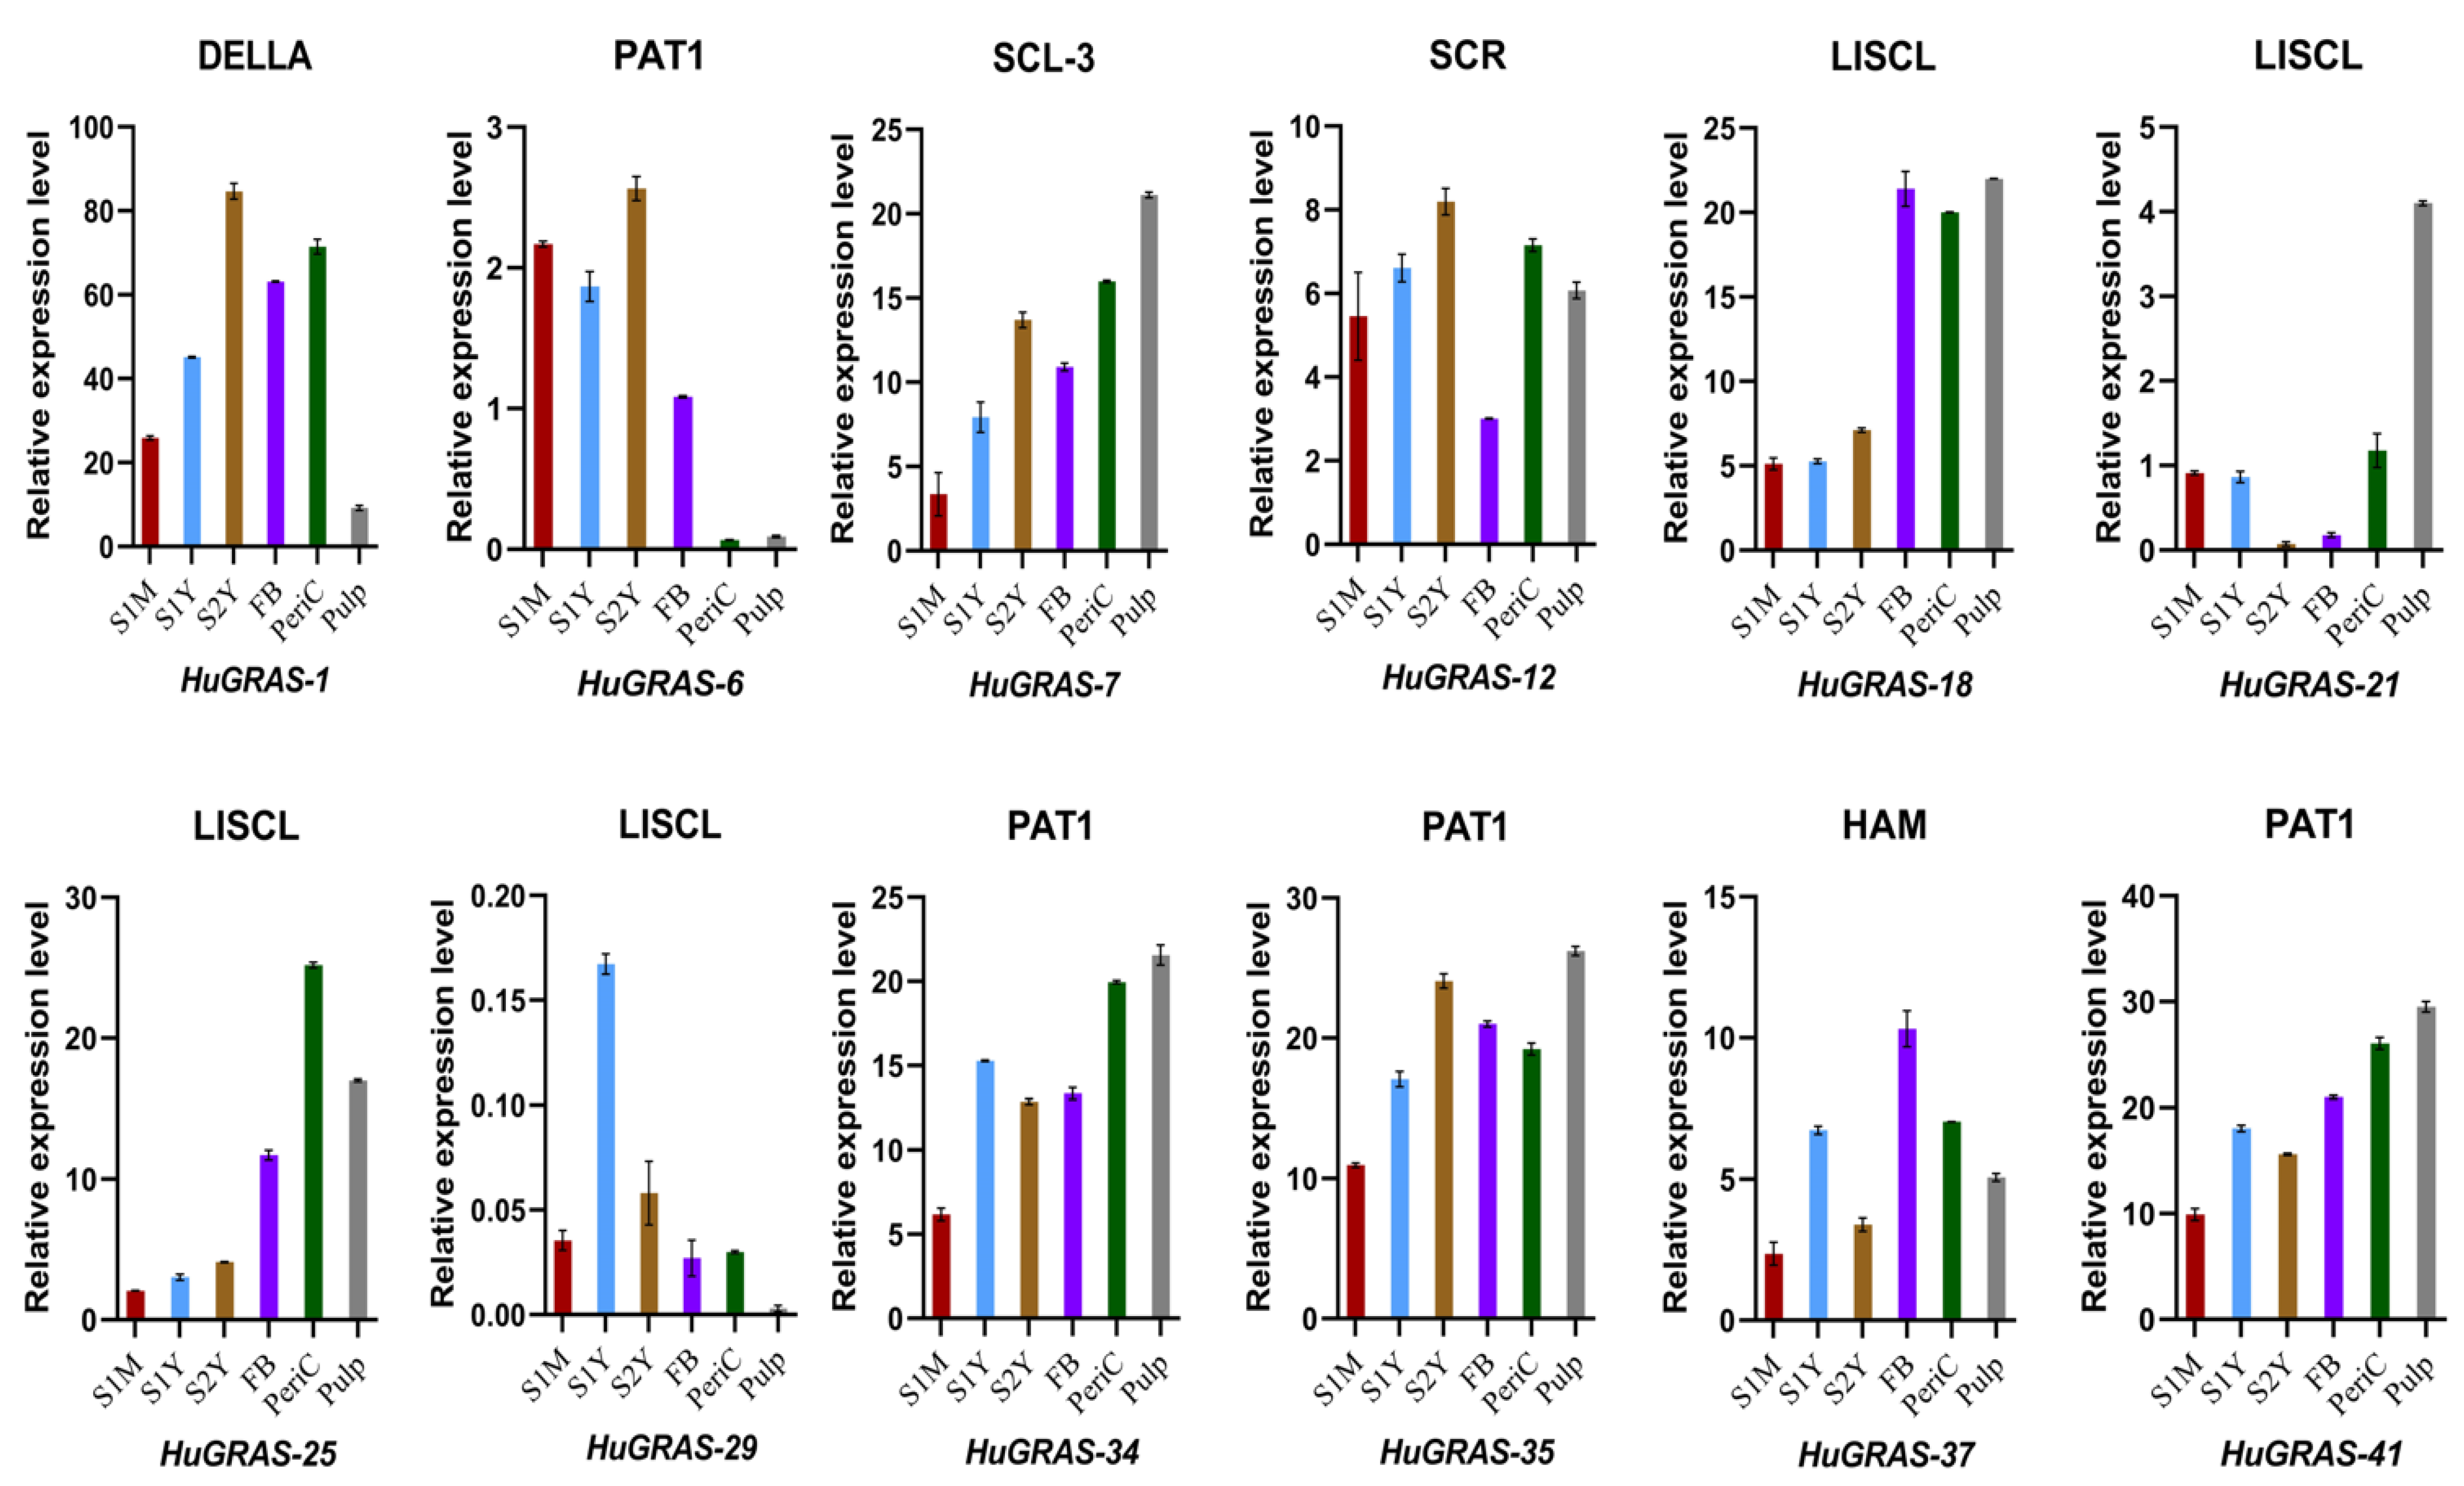
3.8. Expression of HuGRAS Genes at Developmental Stages of Pitaya

To confirm the expressions of the predicted genes from the transcriptome data, we conducted qRT-PCR for HuGRAS-1, HuGRAS-6, HuGRAS-7, HuGRAS-12, HuGRAS-18, HuGRAS-21, HuGRAS-25, HuGRAS-29, HuGRAS-34, HuGRAS-35, HuGRAS-41 and HuGRAS-37. We designed primers for the 12 candidate genes, categorized in six GRAS subfamilies (Supplementary File S4). The results thereof exhibited that HuGRAS-1, HuGRAS-7, HuGRAS-12, HuGRAS-18, HuGRAS-25, HuGRAS-34, HuGRAS-35, HuGRAS-41 and HuGRAS-37 showed higher levels of expression across the tissues (Figure 8). The expression levels of the HuGRAS members varied widely in different tissues. The HuGRAS-1 gene, categorized in the DELLA subfamily, was significantly expressed across the tissues, including the stems, FBs and pericarp. However, relatively weaker expression was observed in the pulp of the fruit. Among the PAT1 subfamily members, HuGRAS-34, HuGRAS-35 and HuGARS-41 exhibited strong expression in the plant tissues as compared to HuGRAS-6, which exhibited weak expression in the pericarp and the pulp. HuGRAS-7, which belongs to the SCL-3 subfamily, was expressed at a low level in the one-month-old stem cells but abundant in other tissues. HuGRAS-12, a gene categorized in the SCR subfamily, was expressed at a higher level in other tissues than the flower buds. HuGRAS-21 and HuGRAS-29, members of the LISCL subfamily, were expressed at lower levels than the HuGRAS-18 and HuGRAS-25 grouped in the same subfamily, which were expressed at higher levels in the flower buds, the pericarp and the pulp of the pitaya plant. HuGRAS-37, grouped into the HAM subfamily, was highly expressed in the flower buds but weakly expressed in the one-month-old stems. Nine genes, which were categorized into six subfamilies, exhibited higher expression levels and might play key roles in the growth and development of the pitaya plant.

4. Discussion

Pitaya (S. undatus L.) is a tropical fruit, typically cacti, evergreen, and consists of cladodes (a modified stem replaces the leaves for photosynthesis function) which perform its functioning as a leaf. The flowers and fruits are edible, and the pericarp and pulp of S. undatus are white in color. The fruits are highly enriched with polyphenols, tannis, betalains and nonbetalainic and antioxidant compounds [66]. Due to the importance of the pitaya tropical fruit, the present study was carried out to explore the growth and the developmental process of the plant. The GRAS TF is being explored in other crop species, such as Arabidopsis [55], Medicago truncatula [48], pepper [54], cotton [50], soybeans [27], tomatoes [67], Chinese cabbage [16] and tropical fruit such as litchi [28], but we could not find any research studies about the GRAS gene family in S. undatus L. GRAS proteins have been recognized as important TF, playing different functions in plant growth and development, including patterning of roots and shoots, responses to various kinds of stresses, stem-cell initiation and maintenance [35], light signaling and the gibberellic-acid signal-transduction pathway [21,68].
With the availability of the pitaya reference genome [2] and pitaya tissue expression data via the pitaya genome and multiomics database [56], we performed a genome-wide identification of the GRAS gene family members in the pitaya genome. In the current study, we found 45 GRAS gene family members in this genome, named HuGRAS-1 to HuGRAS-45; they were widely distributed on 11 chromosomes (Figure 4). Most of the HuGRAS genes were found were on the ends of these chromosomes, which is in accordance with other plant species, such as watermelon, potatoes, rice and Arabidopsis [69]. The conserved motif structures (Figure 3) and HuGRAS gene sequences (Figure S2) exhibited the same pattern of conserved motifs and exon–intron sequences, respectively, suggesting that these genes may have similar functions to those reported in previous studies [21].
In accordance with phylogenetic analysis, we compared the 45 HuGRAS gene sequences with 335 sequences of GRAS proteins from maize, soybeans, Medicago truncatula, rice, Arabidopsis and tomatoes. HuGRAS genes were divided into nine subfamilies based on clade support values: PAT1, SHR, LISCL, HAM, SCR, RGL, LAS, DELLA and SCL3 (Figure 2). Each subfamily carried varying numbers of HuGRAS genes, and the PAT1 subfamily contained the largest number of HuGRAS genes. The protein sequences and differential expression profiles of pitaya tissues aid in the identification of the genes that play key roles in growth and development. Expression and network analysis provide a clue to locating genes that exhibit high levels of expression (Figure 5) and interact with many other genes (Figure 6). With the help of expression analysis and network analysis, 12 selected genes were categorized into their respective subfamilies, as predicted in the phylogenetic tree (Figure 2). All genes were placed in their respective GRAS families: HuGRAS-1 in the DELLA subfamily; HuGRAS-6, HuGRAS-34, HuGRAS-35 and HuGRAS-41 in the PAT1 subfamily; HuGRAS-7 in the SCL-3 subfamily; HuGRAS-12 in the SCR subfamily; HuGRAS-18, HuGRAS-21, HuGRAS-25 and HuGRAS-29 in the LISCL subfamily; and HuGRAS-37 in the HAM subfamily. qRT-PCR was carried out for the predicted gene subfamilies (Figure 8) to confirm their expressions in different stages of the plant. The HuGRAS-1 gene, categorized in the DELLA subfamily, was significantly expressed across the tissues, as the DELLA subfamily is involved in the growth and development of the plant [41]. In the absence of gibberellic acid, DELLA proteins interact with light-responsive TFs, including phytochrome-interacting factors (PIFs), to form inactive complexes [70], while higher expression of gibberellic acid degrades DELLA proteins and initiates the growth rate [71]. Our network analysis revealed that the HuGRAS-1 gene interacts with almost 20 other proteins, so our results are consistent with the prediction of Hirsch and Oldroyd, 2009 [41] that DELLA proteins interact with other PIF families and make complexes with them. This DELLA–PIF TF complex is possibly competitive but a common mechanism for DELLAs to make complexes for light- and gibberellic-acid-signaling to alter environmental conditions [41]. DELLA proteins also regulate immune responses by regulating the jasmonic- and salicylic-acid pathways. The PAT1 subfamily members, HuGRAS-34, HuGRAS-35 and HuGARS-41, exhibited strong expressions in plant tissues as compared to HuGRAS-6, which was weakly expressed. PAT1 is a specific member of the GRAS family that interacts with light signaling via phytochrome A to regulate the plant developmental process, including de-etiolation and hypocotyl elongation [45]. HuGRAS-7, which belongs to the SCL-3 subfamily, was expressed at a low level in one-month-old stem cells but exhibited higher expression abundantly in other tissues. The SCL-3 subfamily acts antagonistically, downstream to gibberellic-acid DELLA responses and upstream to gibberellic-acid-biosynthesis pathways, during plant growth and development [47]. HuGRAS-12 was categorized in the SCL-3 subfamily and was expressed at a higher level in other tissues than flower buds. HuGRAS-37 is grouped into the HAM subfamily and was highly expressed in flower buds but weakly expressed in one-month-old stems. The SCR and HAM subfamilies play key roles in root/shoot patterning and cell differentiation in shoot meristem maintenance [72]. HuGRAS-21 and HuGRAS-29, members of the LISCL subfamily, were expressed at lower levels than the HuGRAS-18 and HuGRAS-25 genes of the same subfamily, which were expressed at a higher level in the flower buds, the pericarp and the pulp of the pitaya plant. Higher levels of expression of LISCL genes (HuGRAS-18 and HuGRAS-25) may predict their role in flower development and fruit ripening. The LISCL subfamily of the GRAS protein has been reported to play a role in another development, of Lilium longiflorum L. [73]. Previous studies have revealed that redundancy of relative expression and phytohormones in different parts of the reproductive tissue (panicle) can lead to defects in growth. Similarly, varying expression levels of GRAS-family genes might also have different functions in different pitaya tissues [74,75].
In this study, we analyzed the GRAS TF family in the pitaya plant (S. undatus L.) and six other species, including maize, soybeans, Medicago truncatula, rice, Arabidopsis and tomatoes. A total of 380 GRAS genes were analyzed in this research, in addition to 45 genes that were predicted from the pitaya genome. We categorized these genes into nine subfamilies based on phylogenetics and previous studies of other crops. Among the nine subfamilies of GRAS, few genes showed higher expression in different tissues of pitaya plant. These genes were categorized into six sub-families including DELLA (HuGRAS-1), SCL-3 (HuGRAS-7), PAT1 (HuGRAS-34, HuGRAS-35, HuGRAS-41), HAM (HuGRAS-37), SCR (HuGRAS-12) and LISCL (HuGRAS-18, HuGRAS-25) which may have potential key role in the growth and development of the pitaya plant. Their roles were also confirmed using in silico cis-acting analysis (Figure S3). As we could see, cis-acting elements, including gibberellin, auxin, ABA, jasmonic-acid and salicylic-acid-responsive elements were abundantly present in the HuGRAS promoters. These genes can be used to study the regulatory pathways of specific plant traits. Positive and negative regulators can be identified from the pathways; then the CRISPR system can be used to produce a transgene-free pitaya plant. Previously, many crops have been improved using the latest genome editing technique [76,77]. Collectively, our results lay a theoretical foundation for the role of GRAS genes in pitaya growth and development. It provides valuable information to improve the pitaya breeding program.

5. Conclusions

This study is the first comprehensive genome-wide identification of the GRAS gene family in pitaya (S. undatus L.). This research might aid in the interpretation of the GRAS genes function, protein interactions, signaling-pathway regulations and expression patterns in different tissues. The comparative study between the GRAS families of six species, the phylogenetic tree, the expression pattern and the gene network analysis will lay a foundation for the functional characterization of the genes in pitaya. Understanding the possible roles of nine predicted genes (HuGRAS-1, HuGRAS-7, HuGRAS-12, HuGRAS-18, HuGRAS-25, HuGRAS-34, HuGRAS-35, HuGRAS-37, HuGRAS-41) from the six subfamilies of GRAS gene and their expression patterns in different tissues provides insightful information for the development of pitaya fruit’s economic, agronomic and ecological benefits. Altogether, the current study is the first report on the GRAS gene family in pitaya tropical fruit. The identification of the genes will assist in clarifying the molecular genetic basis and aid in improving the genotypes in the breeding program.

Supplementary Materials

The following supporting information can be downloaded at: https://www.mdpi.com/article/10.3390/biology12010011/s1.

Author Contributions

Conceptualization, Q.U.Z.; methodology, Q.U.Z.; formal analysis, Q.U.Z.; investigation, Q.U.Z., M.A.H., L.U.K. and H.-F.W.; data curation, Q.U.Z.; writing—original draft preparation, Q.U.Z.; writing—review and editing, Q.U.Z., M.A.H., L.U.K., J.-P.C., D.K., L.H. and W.L. supervision, H.-F.W.; project administration, H.-F.W. All authors have read and agreed to the published version of the manuscript.

Funding

This study was funded by the Hainan Province Science and Technology Special Fund (ZDYF2022XDNY190), the Project of Sanya Yazhou Bay Science and Technology City (Grant Number: SCKJ-JYRC-2022-83) and the Hainan Provincial Natural Science Foundation of China (421RC486).

Institutional Review Board Statement

Not applicable.

Informed Consent Statement

Not applicable.

Data Availability Statement

The data generated and analyzed in this study are available in the Supplementary Materials.

Acknowledgments

The authors thank all of the subjects who participated in this study.

Conflicts of Interest

The authors declare no conflict of interest.

References

  1. Mercado-Silva, E.M. Pitaya-Hylocereus undatus (Haw). In Exotic Fruits; Rodrigues, S., de Oliveira Silva, E., de Brito, E.S., Eds.; Academic Press: Cambridge, MA, USA, 2018; pp. 339–349. [Google Scholar] [CrossRef]
  2. Chen, J.Y.; Xie, F.F.; Cui, Y.Z.; Chen, C.B.; Lu, W.J.; Hu, X.D.; Hua, Q.Z.; Zhao, J.; Wu, Z.J.; Gao, D.; et al. A chromosome-scale genome sequence of pitaya (Hylocereus undatus) provides novel insights into the genome evolution and regulation of betalain biosynthesis. Hortic. Res. 2021, 8, 164. [Google Scholar] [CrossRef] [PubMed]
  3. Cai, X.; Zhang, L.; Xiao, L.; Wen, Z.; Hou, Q.; Yang, K. Genome-wide identification of GRF gene family and their contribution to abiotic stress response in pitaya (Hylocereus polyrhizus). Int. J. Biol. Macromol. 2022, 223, 618–635. [Google Scholar] [CrossRef] [PubMed]
  4. Paśko, P.; Galanty, A.; Zagrodzki, P.; Ku, Y.G.; Luksirikul, P.; Weisz, M.; Gorinstein, S. Bioactivity and cytotoxicity of different species of pitaya fruits-A comparative study with advanced chemometric analysis. Food Biosci. 2021, 40, 100888. [Google Scholar] [CrossRef]
  5. Song, Y.; Cui, H.; Shi, Y.; Xue, J.; Ji, C.; Zhang, C.; Yuan, L.; Li, R. Genome-wide identification and functional characterization of the Camelina sativa WRKY gene family in response to abiotic stress. BMC Genom. 2020, 21, 786. [Google Scholar] [CrossRef] [PubMed]
  6. Xia, H.; Liu, X.; Lin, Z.; Zhang, X.; Wu, M.; Wang, T.; Deng, H.; Wang, J.; Lin, L.; Deng, Q.; et al. Genome-wide identification of MYB transcription factors and screening of members involved in stress response in Actinidia. Int. J. Mol. Sci. 2022, 23, 2323. [Google Scholar] [CrossRef] [PubMed]
  7. Lakhwani, D.; Vikarm Dhar, Y.; Singh, S.; Pandey, A.; Kumar Trivedi, P.; Hasan Asif, M. Genome wide identification of MADS box gene family in Musa balbisiana and their divergence during evolution. Gene 2022, 836, 146666. [Google Scholar] [CrossRef]
  8. Pratt, I.S.; Zhang, B. Genome-wide identification of ARF transcription factor gene family and their expression analysis in sweet potato. Int. J. Mol. Sci. 2021, 22, 9391. [Google Scholar] [CrossRef]
  9. Yamada, Y.; Nishida, S.; Shitan, N.; Sato, F. Genome-wide identification of AP2/ERF transcription factor-encoding genes inCalifornia poppy (Eschscholzia californica) and their expression profiles in response to methyl jasmonate. Sci. Rep. 2020, 10, 18066. [Google Scholar] [CrossRef]
  10. Li, Y.; Zhu, Y.; Yao, J.; Zhang, S.; Wang, L.; Guo, C.; van Nocker, S.; Wang, X. Genome-wide identification and expression analyses of the homeobox transcription factor family during ovule development in seedless and seeded grapes. Sci. Rep. 2017, 7, 12638. [Google Scholar] [CrossRef]
  11. Zhou, Q.; Zhang, S.; Chen, F.; Liu, B.; Wu, L.; Li, F.; Zhang, J.; Bao, M.; Liu, G. Genome-wide identification and characterization of the SBP-box gene family in petunia. BMC Genom. 2018, 19, 193. [Google Scholar] [CrossRef]
  12. Manzoor, M.A.; Manzoor, M.M.; Li, G.; Abdullah, M.; Han, W.; Wenlong, H.; Shakoor, A.; Riaz, M.W.; Rehman, S.; Cai, Y. Genome-wide identification and characterization of bZIP transcription factors and their expression profile under abiotic stresses in Chinese pear (Pyrus bretschneideri). BMC Plant Biol. 2021, 21, 413. [Google Scholar] [CrossRef] [PubMed]
  13. Raza, A.; Sharif, Y.; Chen, K.; Wang, L.; Fu, H.; Zhuang, Y.; Chitikineni, A.; Chen, H.; Zhang, C.; Varshney, R.K.; et al. Genome wide characterization of ascorbate peroxidase gene family in peanut (Arachis hypogea L.) revealed their crucial role in growth and multiple stress tolerance. Front. Plant Sci. 2022, 13, 962182. [Google Scholar] [CrossRef] [PubMed]
  14. Kumari, P.; Gahlaut, V.; Kaur, E.; Singh, S.; Kumar, S.; Jaiswal, V. Genome-Wide Identification of GRAS Transcription Factors and Their Potential Roles in Growth and Development of Rose (Rosa chinensis). J. Plant Growth Regul. 2022, 1–17. [Google Scholar] [CrossRef]
  15. Ni, L.; Wang, Z.; Liu, X.; Wu, S.; Hua, J.; Liu, L.; Yin, Y.; Li, H.; Gu, C. Genome-wide study of the GRAS gene family in Hibiscus hamabo Sieb. et Zucc and analysis of HhGRAS14-induced drought and salt stress tolerance in Arabidopsis. Plant Sci. 2022, 319, 111260. [Google Scholar] [CrossRef] [PubMed]
  16. Song, X.M.; Liu, T.K.; Duan, W.K.; Ma, Q.H.; Ren, J.; Wang, Z.; Li, Y.; Hou, X.L. Genome-wide analysis of the GRAS gene family in Chinese cabbage (Brassica rapa ssp. pekinensis). Genomics 2014, 103, 135–146. [Google Scholar] [CrossRef] [Green Version]
  17. Wang, X.; Li, G.; Sun, Y.; Qin, Z.; Feng, P. Genome-wide analysis and characterization of GRAS family in switchgrass. Bioengineered 2021, 12, 6096–6114. [Google Scholar] [CrossRef]
  18. Zhang, H.; Liu, X.; Wang, X.; Sun, M.; Song, R.; Mao, P.; Jia, S. Genome-wide identification of GRAS gene family and their responses to abiotic stress in Medicago sativa. Int. J. Mol. Sci. 2021, 22, 7729. [Google Scholar] [CrossRef]
  19. Shan, Z.; Luo, X.; Wu, M.; Wei, L.; Fan, Z.; Zhu, Y. Genome-wide identification and expression of GRAS gene family members in cassava. BMC Plant Biol. 2020, 20, 46. [Google Scholar] [CrossRef] [Green Version]
  20. Liu, S.; Wang, X.; Wang, H.; Xin, H.; Yang, X.; Yan, J.; Li, J.; Tran, L.S.P.; Shinozaki, K.; Yamaguchi-Shinozaki, K.; et al. Genome wide analysis of ZmDREB genes and their association with natural variation in drought tolerance at seedling stage of Zea mays L. PLoS Genet. 2013, 9, e1003790. [Google Scholar] [CrossRef]
  21. Wang, T.T.; Yu, T.F.; Fu, J.D.; Su, H.G.; Chen, J.; Zhou, Y.B.; Chen, M.; Guo, J.; Ma, Y.Z.; Wei, W.L.; et al. Genome-wide analysis of the GRAS gene family and functional identification of GmGRAS37 in drought and salt tolerance. Front. Plant Sci. 2020, 11, 604690. [Google Scholar] [CrossRef]
  22. Dutta, M.; Saha, A.; Moin, M.; Kirti, P.B. Genome-wide identification, transcript profiling and bioinformatic analyses of GRAS transcription factor genes in rice. Front. Plant Sci. 2021, 12, 777285. [Google Scholar] [CrossRef] [PubMed]
  23. Wang, S.; Duan, Z.; Yan, Q.; Wu, F.; Zhou, P.; Zhang, J. Genome-wide identification of the GRAS family genes in Melilotus albus and expression analysis under various tissues and abiotic stresses. Int. J. Mol. Sci. 2022, 23, 7403. [Google Scholar] [CrossRef] [PubMed]
  24. Liu, Y.; Wang, W. Characterization of the GRAS gene family reveals their contribution to the high adaptability of wheat. Peer J. 2021, 9, e10811. [Google Scholar] [CrossRef]
  25. Guo, P.; Wen, J.; Yang, J.; Ke, Y.; Wang, M.; Liu, M.; Ran, F.; Wu, Y.; Li, P.; Li, J.; et al. Genome-wide survey and expression analyses of the GRAS gene family in Brassica napus reveals their roles in root development and stress response. Planta 2019, 250, 1051–1072. [Google Scholar] [CrossRef] [PubMed] [Green Version]
  26. Fan, Y.; Wei, X.; Lai, D.; Yang, H.; Feng, L.; Li, L.; Niu, K.; Chen, L.; Xiang, D.; Ruan, J.; et al. Genome-wide investigation of the GRAS transcription factor family in foxtail millet (Setaria italica L.). BMC Plant Biol. 2021, 21, 508. [Google Scholar] [CrossRef] [PubMed]
  27. Wang, L.; Ding, X.; Gao, Y.; Yang, S. Genome-wide identification and characterization of GRAS genes in soybean (Glycine max). BMC Plant Biol. 2020, 20, 415. [Google Scholar] [CrossRef]
  28. Chen, J.; Yan, Q.; Li, J.; Feng, L.; Zhang, Y.; Xu, J.; Xia, R.; Zeng, Z.; Liu, Y. The GRAS gene family and its roles in seed deve opment in litchi (Litchi chinensis Sonn). BMC Plant Biol. 2021, 21, 423. [Google Scholar] [CrossRef]
  29. Peng, J.; Carol, P.; Richards, D.E.; King, K.E.; Cowling, R.J.; Murphy, G.P.; Harberd, N.P. The Arabidopsis GAI gene defines a signaling pathway that negatively regulates gibberellin responses. Genes Dev. 1997, 11, 3194–3205. [Google Scholar] [CrossRef] [Green Version]
  30. Guo, Y.; Wu, H.; Li, X.; Li, Q.; Zhao, X.; Duan, X.; An, Y.; Lv, W.; An, H. Identification and expression of GRAS family genes in maize (Zea mays L.). PLoS ONE 2017, 12, e0185418. [Google Scholar] [CrossRef]
  31. Silverstone, A.L.; Ciampaglio, C.N.; Sun, T. The arabidopsis RGA gene encodes a transcriptional regulator repressing the gibberellin signal transduction pathway. Plant Cell 1998, 10, 155–169. [Google Scholar] [CrossRef] [Green Version]
  32. Di Laurenzio, L.; Wysocka-Diller, J.; Malamy, J.E.; Pysh, L.; Helariutta, Y.; Freshour, G.; Hahn, M.G.; Feldmann, K.A.; Benfey, P.N. The SCARECROW gene regulates an asymmetric cell division that is essential for generating the radial organization of the Arabidopsis root. Cell 1996, 86, 423–433. [Google Scholar] [CrossRef] [PubMed] [Green Version]
  33. Gallagher, K.L.; Benfey, P.N. Both the conserved GRAS domain and nuclear localization are required for SHORT-ROOT mov ment. Plant J. 2009, 57, 785–797. [Google Scholar] [CrossRef] [PubMed] [Green Version]
  34. Hakoshima, T. Structural basis of the specific interactions of GRAS family proteins. FEBS Lett. 2018, 592, 489–501. [Google Scholar] [CrossRef] [PubMed] [Green Version]
  35. Bolle, C. The role of GRAS proteins in plant signal transduction and development. Planta 2004, 218, 683–692. [Google Scholar] [CrossRef] [PubMed]
  36. Mayrose, M.; Ekengren, S.K.; Melech-Bonfil, S.; Martin, G.B.; Sessa, G. A novel link between tomato GRAS genes, plant disease resistance and mechanical stress response. Mol. Plant Pathol. 2006, 7, 593–604. [Google Scholar] [CrossRef] [PubMed]
  37. Cui, H.; Levesque, M.P.; Vernoux, T.; Jung, J.W.; Paquette, A.J.; Gallagher, K.L.; Wang, J.Y.; Blilou, I.; Scheres, B.; Benfey, P.N. An evolutionarily conserved mechanism delimiting SHR movement defines a single layer of endodermis in plants. Science 2007, 316, 421–425. [Google Scholar] [CrossRef] [Green Version]
  38. Liu, X.; Widmer, A. Genome-wide comparative analysis of the GRAS gene family in Populus, Arabidopsis and Rice. Plant Mol. Biol. Rep. 2014, 32, 1129–1145. [Google Scholar] [CrossRef]
  39. Liu, M.; Sun, W.; Li, C.; Yu, G.; Li, J.; Wang, Y.; Wang, X. A multilayered cross-species analysis of GRAS transcription factors uncovered their functional networks in plant adaptation to the environment. J. Adv. Res. 2021, 29, 191–205. [Google Scholar] [CrossRef]
  40. Lee, M.H.; Kim, B.; Song, S.K.; Heo, J.O.; Yu, N.I.; Lee, S.A.; Kim, M.; Kim, D.G.; Sohn, S.O.; Lim, C.E.; et al. Large-scale analysis of the GRAS gene family in Arabidopsis thaliana. Plant Mol. Biol. 2008, 67, 659–670. [Google Scholar] [CrossRef]
  41. Hirsch, S.; Oldroyd, G.E. GRAS-domain transcription factors that regulate plant development. Plant Signal Behav. 2009, 4, 698–700. [Google Scholar] [CrossRef] [Green Version]
  42. Geng, Y.; Zhou, Y. HAM gene family and shoot meristem development. Front. Plant Sci. 2021, 12, 2931. [Google Scholar] [CrossRef]
  43. Raatz, B.; Eicker, A.; Schmitz, G.; Fuss, E.; Müller, D.; Rossmann, S.; Theres, K. Specific expression of LATERAL SUPPRESSOR is controlled by an evolutionarily conserved 3’ enhancer. Plant J. 2011, 68, 400–412. [Google Scholar] [CrossRef] [PubMed]
  44. Keller, T.; Abbott, J.; Moritz, T.; Doerner, P. Arabidopsis REGULATOR OF AXILLARY MERISTEMS1 controls a leaf axil stemcell niche and modulates vegetative development. Plant Cell 2006, 18, 598–611. [Google Scholar] [CrossRef] [PubMed] [Green Version]
  45. Bolle, C.; Koncz, C.; Chua, N.H. PAT1, a new member of the GRAS family, is involved in phytochrome A signal transduction. Genes Dev. 2000, 14, 1269–1278. [Google Scholar] [CrossRef] [PubMed]
  46. Pysh, L.D.; Wysocka-Diller, J.W.; Camilleri, C.; Bouchez, D.; Benfey, P.N. The GRAS gene family in Arabidopsis: Sequence characterization and basic expression analysis of the SCARECROW-LIKE genes. Plant J. 1999, 18, 111–119. [Google Scholar] [CrossRef] [PubMed]
  47. Zhang, Z.L.; Ogawa, M.; Fleet, C.M.; Zentella, R.; Hu, J.; Heo, J.O.; Lim, J.; Kamiya, Y.; Yamaguchi, S.; Sun, T.P. Scarecrow-like 3 promotes gibberellin signaling by antagonizing master growth repressor DELLA in Arabidopsis. Proc. Natl. Acad. Sci. USA 2011, 108, 2160–2165. [Google Scholar] [CrossRef] [PubMed] [Green Version]
  48. Zhang, H.; Cao, Y.; Shang, C.; Li, J.; Wang, J.; Wu, Z.; Ma, L.; Qi, T.; Fu, C.; Bai, Z.; et al. Genome-wide characterization of GRAS family genes in Medicago truncatula reveals their evolutionary dynamics and functional diversification. PLoS ONE 2017, 12, e0185439. [Google Scholar] [CrossRef] [PubMed] [Green Version]
  49. Zhu, X.; Wang, B.; Wei, X. Genome wide identification and expression pattern analysis of the GRAS family in quinoa. Funt. Plant Biol. 2021, 48, 948–962. [Google Scholar] [CrossRef] [PubMed]
  50. Zhang, B.; Liu, J.; Yang, Z.E.; Chen, E.Y.; Zhang, C.J.; Zhang, X.Y.; Li, F.G. Genome-wide analysis of GRAS transcription factor gene family in Gossypium hirsutum L. BMC Genom. 2018, 19, 348. [Google Scholar] [CrossRef]
  51. To, V.T.; Shi, Q.; Zhang, Y.; Shi, J.; Shen, C.; Zhang, D.; Cai, W. Genome-wide analysis of the GRAS gene family in barley (Hordeum vulgare L.). Genes 2020, 11, 553. [Google Scholar] [CrossRef]
  52. Sidhu, N.S.; Pruthi, G.; Singh, S.; Bishnoi, R.; Singla, D. Genome-wide identification and analysis of GRAS transcription factors in the bottle gourd genome. Sci. Rep. 2020, 10, 14338. [Google Scholar] [CrossRef] [PubMed]
  53. Zhang, H.; Mi, L.; Xu, L.; Yu, C.; Li, C.; Chen, C. Genome-wide identification, characterization, interaction network and ex pression profile of GRAS gene family in sweet orange (Citrus sinensis). Sci. Rep. 2019, 9, 2156. [Google Scholar] [CrossRef] [PubMed]
  54. Liu, B.; Sun, Y.; Xue, J.; Jia, X.; Li, R. Genome-wide characterization and expression analysis of GRAS gene family in pepper (Capsicum annuum L.). Peer J. 2018, 6, e4796. [Google Scholar] [CrossRef] [PubMed] [Green Version]
  55. Tian, C.; Wan, P.; Sun, S.; Li, J.; Chen, M. Genome-wide analysis of the GRAS gene family in rice and Arabidopsis. Plant Mol. Biol. 2004, 54, 519–532. [Google Scholar] [CrossRef]
  56. Chen, C.; Li, F.; Xie, F.; Chen, J.; Hua, Q.; Chen, J.; Wu, Z.; Zhang, Z.; Zhang, R.; Zhao, J.; et al. Pitaya genome and multiomics database (PGMD): A comprehensive and integrative resource of Selenicereus undatus. Genes 2022, 13, 745. [Google Scholar] [CrossRef]
  57. Goodstein, D.M.; Shu, S.; Howson, R.; Neupane, R.; Hayes, R.D.; Fazo, J.; Mitros, T.; Dirks, W.; Hellsten, U.; Putnam, N.; et al. Phytozome: A comparative platform for green plant genomics. Nucleic Acids Res. 2011, 40, D1178–D1186. [Google Scholar] [CrossRef]
  58. Niu, Y.; Zhao, T.; Xu, X.; Li, J. Genome-wide identification and characterization of GRAS transcription factors in tomato (Solnum lycopersicum). Peer J. 2017, 5, e3955. [Google Scholar] [CrossRef] [Green Version]
  59. Chen, C.; Chen, H.; Zhang, Y.; Thomas, H.R.; Frank, M.H.; He, Y.; Xia, R. TBtools: An integrative toolkit developed for inte active analyses of big biological data. Mol. Plant 2020, 13, 1194–1202. [Google Scholar] [CrossRef]
  60. Tamura, K.; Stecher, G.; Kumar, S. MEGA11: Molecular evolutionary genetics analysis version 11. Mol. Biol. Evol. 2021, 38, 3022–3027. [Google Scholar] [CrossRef]
  61. Letunic, I.; Bork, P. Interactive tree of life (iTOL) v4: Recent updates and new developments. Nucleic Acids Res. 2019, 47, W256–W259. [Google Scholar] [CrossRef] [Green Version]
  62. Shannon, P.; Markiel, A.; Ozier, O.; Baliga, N.S.; Wang, J.T.; Ramage, D.; Amin, N.; Schwikowski, B.; Ideker, T. Cytoscape: A software environment for integrated models of biomolecular interaction networks. Genome Res. 2003, 13, 2498–2504. [Google Scholar] [CrossRef] [PubMed]
  63. Lescot, M.; Déhais, P.; Thijs, G.; Marchal, K.; Moreau, Y.; Van de Peer, Y.; Rouzé, P.; Rombauts, S. PlantCARE, a database of plant cis-acting regulatory elements and a portal to tools for in silico analysis of promoter sequences. Nucleic Acids Res. 2002, 30, 325–327. [Google Scholar] [CrossRef] [PubMed]
  64. Zaman, Q.U.; Wen, C.; Yuqin, S.; Mengyu, H.; Desheng, M.; Jacqueline, B.; Baohong, Z.; Chao, L.; Qiong, H. Characterization of SHATTERPROOF homoeologs and crispr-cas9-mediated genome editing enhances pod-shattering resistance in Brassica napus L. Crispr J. 2021, 4, 360–370. [Google Scholar] [CrossRef]
  65. Livak, K.J.; Schmittgen, T.D. Analysis of relative gene expression data using real-time quantitative PCR and the 2−ΔΔCT Method. Methods 2021, 25, 402–408. [Google Scholar] [CrossRef] [PubMed]
  66. Bhat, R.; Paliyath, G. Fruits of tropical climates: Dietary importance and health benefits. In Encyclopedia of Food and Health; Caballero, B., Finglas, P.M., Toldrá, F., Eds.; Academic Press: Oxford, UK, 2016; pp. 144–149. [Google Scholar]
  67. Huang, W.; Xian, Z.; Kang, X.; Tang, N.; Li, Z. Genome-wide identification, phylogeny and expression analysis of GRAS gene family in tomato. BMC Plant Biol. 2015, 15, 209. [Google Scholar] [CrossRef] [Green Version]
  68. Dill, A.; Jung, H.S.; Sun, T.P. The DELLA motif is essential for gibberellin-induced degradation of RGA. Proc. Natl. Acad. Sci. USA 2001, 98, 14162–14167. [Google Scholar] [CrossRef] [Green Version]
  69. Lv, G.; Zheng, X.; Duan, Y.; Wen, Y.; Zeng, B.; Ai, M.; He, B. The GRAS gene family in watermelons: Identification, characte ization and expression analysis of different tissues and root-knot nematode infestations. Peer J. 2021, 9, e11526. [Google Scholar] [CrossRef]
  70. de Lucas, M.; Davière, J.M.; Rodríguez-Falcón, M.; Pontin, M.; Iglesias-Pedraz, J.M.; Lorrain, S.; Fankhauser, C.; Blázquez, M.A.; Titarenko, E.; Prat, S. A molecular framework for light and gibberellin control of cell elongation. Nature 2008, 451, 480–484. [Google Scholar] [CrossRef] [Green Version]
  71. Feng, S.; Martinez, C.; Gusmaroli, G.; Wang, Y.; Zhou, J.; Wang, F.; Chen, L.; Yu, L.; Iglesias-Pedraz, J.M.; Kircher, S.; et al. Coordinated regulation of Arabidopsis thaliana development by light and gibberellins. Nature 2008, 451, 475–479. [Google Scholar] [CrossRef]
  72. Stuurman, J.; Jäggi, F.; Kuhlemeier, C. Shoot meristem maintenance is controlled by a GRAS-gene mediated signal from di ferentiating cells. Genes Dev. 2002, 16, 2213–2218. [Google Scholar] [CrossRef] [Green Version]
  73. Morohashi, K.; Minami, M.; Takase, H.; Hotta, Y.; Hiratsuka, K. Isolation and characterization of a novel GRAS gene that regulates meiosis-associated gene expression. J. Biol. Chem. 2003, 278, 20865–20873. [Google Scholar] [CrossRef] [PubMed] [Green Version]
  74. Ali, A.; Wu, T.; Zhang, H.; Xu, P.; Zafar, S.A.; Liao, Y.; Chen, X.; Zhou, H.; Liu, Y.; Wang, W.; et al. A putative SU TILISIN-LIKE SERINE PROTEASE 1 (SUBSrP1) regulates anther cuticle biosynthesis and panicle development in rice. J. Adv. Res. 2022, 42, 273–287. [Google Scholar] [CrossRef] [PubMed]
  75. Ali, A.; Wu, T.; Xu, Z.; Riaz, A.; Alqudah, A.M.; Iqbal, M.Z.; Zhang, H.; Liao, Y.; Chen, X.; Liu, Y.; et al. Phytohormones and transcriptome analyses revealed the dynamics involved in spikelet abortion and inflorescence development in rice. Int. J. Mol. Sci. 2022, 23, 7887. [Google Scholar] [CrossRef] [PubMed]
  76. Zaman, Q.U.; Li, C.; Cheng, H.; Hu, Q. Genome editing opens a new era of genetic improvement in polyploid crops. Crop J. 2019, 7, 141–150. [Google Scholar] [CrossRef]
  77. Zaman, Q.U.; Chu, W.; Hao, M.; Shi, Y.; Sun, M.; Sang, S.F.; Mei, D.; Cheng, H.; Liu, J.; Li, C.; et al. CRISPR/Cas9-mediate multiplex genome editing of JAGGED gene in Brassica napus L. Biomolecules 2019, 9, 725. [Google Scholar] [CrossRef]
Figure 1. GRAS-family protein domains. All 45 HuGRAS sequences (HuGRAS-1 to HuGRAS-45) contained GRAS domains.
Biology 12 00011 g001
Figure 2. Characterized sequences of six species (maize, soybeans, Arabidopsis, Medicago truncatula, tomatoes and rice) were used to draw this phylogenetic tree with the pitaya GRAS genes. The GRAS proteins were divided into nine subfamilies, exhibited with different colors: PAT1 (red), SHR (navy blue), LISCL (lime), HAM (light orange/wheat color), SCR (violet), RGL (pea green), LAS (teal), DELLA (magenta pink) and SCL3 (gray).
Biology 12 00011 g002
Figure 3. Distribution of putative motifs in each HuGRAS protein sequence. (A) The rectangular phylogenetic tree of 45 HuGRAS proteins was constructed using MEGA-11 software based on the maximum likelihood method, with a bootstrap value of 1000 replicates. (B) Conserved motifs of pitaya, named HuGRAS-1 to HuGRAS-45, that were predicted using the MEME program and plotted in TBTools software. Motif 1 to motif 10 are shown in differently colored boxes.
Biology 12 00011 g003
Figure 4. Distribution of 45 HuGRAS genes on 11 pitaya (S. undatus L.) chromosomes. Gene names are mentioned in black. HuGRAS genes are divided into nine groups on the basis of their domain structures.
Biology 12 00011 g004
Figure 5. The expression heatmap of HuGRAS genes in different pitaya tissues. In this heatmap, 15 rows represent the expressions of different tissues, and 45 columns represent the genes. Four flower bud stages are shown as FB1 to FB4, and five flower stages are shown as F1 to F5. Three pericarp stages are shown as periC-45d, periC-65d and periC-85d, and three pulp stages are shown as pul-29d, pul-35d and pul-49d. Color changes from light blue to dark blue show less or no expression of HuGRAS genes. Light yellow to a dark red color shows less expression to a high level of expression of these genes.
Biology 12 00011 g005
Figure 6. Protein interaction network. Green and red genes are designated as hub genes because they interact with more than 10 genes. Different colors show the interactions of the genes as follows: green (16–20), red (11–15), yellow (6–10) and gray (2–5).
Biology 12 00011 g006
Figure 7. The cis-acting elements of the promoter regions (2000 bp upstream of start codon) of nine HuGRAS genes.
Biology 12 00011 g007
Figure 8. qRT-PCR expression analysis of 12 genes in six tissues of the pitaya (S. undatus L.) plant. The X-axis represents the plant tissues, including one-month-old stem (S1M), one-year-old stem (S1Y), two-year-old stem (S2Y), flower bud (FB), pericarp (PeriC) and pulp. Error bars represent the standard deviations for the three replicates.
Biology 12 00011 g008
Table 1. Physical and chemical properties of GRAS genes in pitaya (S. undatus L.).
Transcript IDRenamed IDChr. No.Start–End PositionCDS (bp)Protein Length (AA)Protein Mol. Weight (kDa)pIGRAVY
HU10G00709.1HuGRAS-1108,621,296-8,623,893175558440.145.44−0.055
HU11G00778.1HuGRAS-21178,577,603-78,578,866117639139.906.630.105
HU03G02797.1HuGRAS-33132,126,059-132,127,531147349040.396.23−0.027
HU04G00148.1HuGRAS-441,819,377-1,821,914205568442.265.89−0.221
HU08G00367.1HuGRAS-5814,545,649-14,547,799135044944.776.09−0.13
HU01G01391.1HuGRAS-6195,463,256-95,466,959162354041.206.9−0.101
HU08G01232.1HuGRAS-7893,024,447-93,026,894139246346.256.31−0.086
HU08G00284.1HuGRAS-889,185,291-9,193,945153351041.505.91−0.067
HU08G00014.1HuGRAS-98524,930-530,436177959241.798.7−0.234
HU05G01267.1HuGRAS-105102,083,025-102,085,852133244346.945.99−0.12
HU01G01850.1HuGRAS-111126,187,756-126,191,336174358041.776.3−0.167
HU01G00472.1HuGRAS-1216,212,129-6,216,403243080938.495.76−0.016
HU02G03005.1HuGRAS-132138,909,434-138,911,167122740839.466.44−0.017
HU03G01737.1HuGRAS-14325,880,385-25,881,812142847546.226.57−0.19
HU11G01125.1HuGRAS-151187,396,169-87,400,880170456741.587.1−0.142
HU11G01134.1HuGRAS-161187,665,022-87,669,731170456741.587.1−0.142
HU01G00833.1HuGRAS-17116,765,953-16,767,335138346034.076.36−0.213
HU02G01569.1HuGRAS-18222,485,375-22,488,601228376042.058.6−0.24
HU06G00568.1HuGRAS-1966,285,841-6,289,986231377042.099.09−0.239
HU05G01597.1HuGRAS-205117,157,311-117,159,569225975242.179.46−0.236
HU07G02248.1HuGRAS-217112,127,788-112,125,521226875542.859.24−0.295
HU07G02249.1HuGRAS-227112,130,817-112,133,676226575442.538.96−0.298
HU06G00029.1HuGRAS-236372,597-376,546169856535.316.3−0.092
HU02G01571.1HuGRAS-24222,556,900-22,559,249200166642.228.95−0.18
HU07G02246.1HuGRAS-257112,113,563-112,116,265140446742.539.15−0.333
HU07G00272.1HuGRAS-2672,834,842-2,836,221138045942.875.5−0.18
HU11G01529.1HuGRAS-271192,622,998-92,624,392139546443.245.73−0.171
HU06G00358.1HuGRAS-2863,831,873-3,833,640145848542.915.98−0.24
HU02G01572.1HuGRAS-29222,590,054-22,592,716206168642.189.43−0.274
HU02G01570.1HuGRAS-30222,492,850-22,495,255240680142.688.1−0.436
HU02G01573.1HuGRAS-31222,646,432-22,648,477204668142.359.17−0.367
HU05G00466.1HuGRAS-3258,309,337-8,311,578177058939.796.860.143
HU04G00047.1HuGRAS-334727,912-731,196231076939.786.330.157
HU06G02537.1HuGRAS-346123,795,575-123,798,959228976240.487.86−0.138
HU08G02295.1HuGRAS-358106,955,054-106,955,63858519421.768.89−0.617
HU05G01983.1HuGRAS-365124,288,256-124,289,817145548444.225.84−0.235
HU04G00048.1HuGRAS-374739,383-742,094201667141.566.590.059
HU06G00376.1HuGRAS-3864,097,194-4,098,474128142643.015.10.006
HU08G00019.1HuGRAS-398594,594-594,87572624116.986.93−0.151
HU06G00283.1HuGRAS-406594,594-602,896137145640.788.540.127
HU08G02296.1HuGRAS-418106,955,745-106,956,67793331015.397.010.115
HU08G00230.1HuGRAS-4286,804,389-6,812,672 72324016.677.95−0.181
HU02G03154.1HuGRAS-432141,447,089-141,448,403118539437.685.870.42
HU05G02245.1HuGRAS-445126,702,616-126,704,494161753840.338.520.201
HU08G00229.1HuGRAS-4586,804,079-6,804,3722949795.159.56−0.032
Disclaimer/Publisher’s Note: The statements, opinions and data contained in all publications are solely those of the individual author(s) and contributor(s) and not of MDPI and/or the editor(s). MDPI and/or the editor(s) disclaim responsibility for any injury to people or property resulting from any ideas, methods, instructions or products referred to in the content.

