Simple Summary
Alzheimer’s disease (AD) is a progressive neurodegenerative disorder and represents the most common cause of dementia among elderly people. It is characterized by the deterioration of brain cells and is linked to problems with energy production, cell metabolism, and harmful oxidative stress. Our study focused on two proteins called NCX1 and NCX3, which play a role in controlling calcium and sodium levels in cells. We wanted to understand whether these proteins may be involved in AD development when brain cells are exposed to metabolic impairment. To investigate this, we used a laboratory cell model and treated the cells with a substance called glyceraldehyde (GA) to mimic the metabolic dysfunction seen in AD. We used a technique called RNA interference to silence the expression of either NCX1 or NCX3 in the cells. We found that when NCX3 was silenced, the cells showed improved viability, increased energy production, and reduced damage from oxidative stress. Additionally, the levels of abnormal proteins associated with AD, such as Aβ and pTau, were decreased. However, silencing NCX1 did not have the same positive effects, except for increased energy production. These findings suggest that targeting NCX3 may be a potential strategy to prevent the development of AD associated with metabolic dysfunction. Considering the paucity of pharmacological therapies, this knowledge could be valuable for identifying new potential treatments for AD.
Abstract
Alzheimer’s disease (AD) is a widespread neurodegenerative disorder, affecting a large number of elderly individuals worldwide. Mitochondrial dysfunction, metabolic alterations, and oxidative stress are regarded as cooperating drivers of the progression of AD. In particular, metabolic impairment amplifies the production of reactive oxygen species (ROS), resulting in detrimental alterations to intracellular Ca2+ regulatory processes. The Na+/Ca2+ exchanger (NCX) proteins are key pathophysiological determinants of Ca2+ and Na+ homeostasis, operating at both the plasma membrane and mitochondria levels. Our study aimed to explore the role of NCX1 and NCX3 in retinoic acid (RA) differentiated SH-SY5Y cells treated with glyceraldehyde (GA), to induce impairment of the default glucose metabolism that typically precedes Aβ deposition or Tau protein phosphorylation in AD. By using an RNA interference-mediated approach to silence either NCX1 or NCX3 expression, we found that, in GA-treated cells, the knocking-down of NCX3 ameliorated cell viability, increased the intracellular ATP production, and reduced the oxidative damage. Remarkably, NCX3 silencing also prevented the enhancement of Aβ and pTau levels and normalized the GA-induced decrease in NCX reverse-mode activity. By contrast, the knocking-down of NCX1 was totally ineffective in preventing GA-induced cytotoxicity except for the increase in ATP synthesis. These findings indicate that NCX3 and NCX1 may differently influence the evolution of AD pathology fostered by glucose metabolic dysfunction, thus providing a potential target for preventing AD.
1. Introduction
Alzheimer’s disease (AD) is a progressive neurological disorder, and by far is considered the most common form of dementia in the elderly [1]. Despite the impressive effort in deciphering cause-and-effect trajectories at work, AD pathogenesis is still ill-defined and, thereby, its treatment remains a major healthcare challenge [2]. AD is characterized by irreversible memory loss and cognitive impairment along with widespread neuronal degeneration. The pathognomonic hallmarks of AD are senile plaques, primarily composed by insoluble aggregates of amyloid β (Aβ) peptides, and neurofibrillary tangles consisting of the hyperphosphorylated form of Tau protein (pTau). AD has a complex and multifactorial nature [3], in which various molecular and cellular pathways cooperate to shape its course [4,5]. Bioenergetic dysfunction can be considered as the common underlying thread that links the many dimensions of AD pathology. An adequate glucose metabolism is important to support neuronal activity and guarantee cognitive resilience of healthy aging [6], whereas decreases in brain glucose uptake take place during the preclinical stage of AD and contribute to the onset and progression of the disease [7,8,9,10,11]. Interestingly, dysregulations of the glycolytic flux are typically observed in AD patients [12], being associated with the increase in the deposition of senile plaques and neurofibrillary tangles and cognitive decline [13]. In this framework, metabolic impairment will feed the generation of reactive oxygen species (ROS) and disrupt cellular Ca2+ homeostasis, thus creating a self-reinforcing loop of neurodegeneration. In this line, it has been recently demonstrated that, in rat cortical neurons spurred with glyceraldehyde (GA) to alter glucose metabolism [14], an antioxidant treatment improves cell viability by: (i) reducing the increase in Aβ and pTau levels, (ii) recovering the reduction of ATP content, and (iii) counteracting the perturbation of cellular Ca2+ homeostasis within both cytoplasmic and mitochondrial compartments [14]. Given the crucial role of Ca2+ in the regulation of neuronal physiology at multiple levels, it is not surprising that even subtle perturbation of Ca2+ homeostasis may dramatically challenge neuronal functions and survival [15,16,17]. On the one hand, dysregulation in Ca2+ signaling influences Aβ aggregation and deposition and Tau phosphorylation [18], and in more general terms, incites the longitudinal progression of AD pathology [19]. On the other hand, activation of the amyloidogenic pathway has the potential to remodel neuronal Ca2+ signaling and alter Ca2+ homeostasis, contributing to learning and memory impairment [20,21,22,23,24]. Therefore, restoring a balanced control over Ca2+ homeostasis may promote survival of neurons that would otherwise succumb to AD injury.
Among the ionic transporters that provide significant contributions to the Ca2+ homeostasis of brain cells there is the Na+/Ca2+ exchanger (NCX). In particular, the NCX plays a critical role in regulating Ca2+ and Na+ homeostasis at both plasma membrane and mitochondrial levels [25]. As a secondary active transport, the NCX can operate either in the forward mode (Na+ influx/Ca2+ efflux) or in the reverse mode (Na+ efflux/Ca2+ influx) depending on the electrochemical ion gradients [26]; although, exchange activity proceeds under constant control of redundant regulatory inputs [27]. Three isoforms have been described, NCX1, NCX2, and NCX3, which are differentially expressed in a tissue-specific manner [28]. The ionic and electrical outputs generated by NCX proteins are modified by and can influence the evolution of pathological paradigms in many cell types [29]. In particular, interest has been shown in exploring their functions in AD pathology [30], but the specific role(s) played by NCXs in the metabolic derangements that incite AD evolution remain(s) poorly defined.
As far as NCX1 and NCX3 are concerned, these two exchangers are key determinants of intracellular Ca2+ homeostasis in excitable cells, like neurons and cardiomyocytes, especially in pathological settings where energy balance is significantly compromised [26]. In the past few years, significant attention has been focused on NCX3, since reductions of its activity or expression have been associated with poor cell survival in different models of excitotoxicity-induced cell damage and cerebral ischemia [30,31,32,33,34,35]. Interestingly, our previous studies revealed that, in energy metabolism-compromised states like cardiac and neuronal hypoxia/reoxygenation injury and neurodegenerative models such as AD and Parkinson’s disease (PD), NCX1 plays an essential role for the metabolic use of glutamate to sustain mitochondrial ATP production and guarantee improved survival [36,37,38]. However, it has been also observed that in a setting of cardiac ischemia/reperfusion (I/R) injury, NCX1 can play a dual role since its inhibition during I/R is crucial for cell survival, while its activity is strongly involved in providing protection during ischemic preconditioning [39]. Therefore, NCX isoforms may exert diverse roles that strictly depend on the specific pathologic conditions under which the exchanger works [29,32,40,41].
In light of this evidence and the fact that alteration of Ca2+ handling is a central driver of AD progression, in the present study, we aimed to elucidate the role of NCX1 and NCX3 in an in vitro model of retinoic-acid (RA) differentiated SH-SY5Y cells, where the exposure to GA induces a glucose metabolism impairment [14,36]. The hypometabolism condition that this model simulates is associated with mitochondrial dysfunction and redox imbalance that are typical early alterations of AD.
2. Materials and Methods
2.1. Cell Culture and Treatments
The SH-SY5Y cell line, derived from human neuroblastoma, was purchased from the American Type Culture Collection (CRL-2266). The cells were cultivated in Dulbecco’s Modified Eagle Medium (DMEM; Corning, New York, NY, USA) supplemented with 10% fetal bovine serum (FBS, Corning), 100 U/mL penicillin, and 100 µg/mL streptomycin (Corning). They were maintained in an incubator at 37 °C with a 5% CO2 atmosphere. In order to induce their differentiation into neuron-like cells, they were exposed to 10 µM all-trans retinoic acid (RA) for 6 days. Prior to treatment with GA for 24 h, the cells were initially subjected to siRNA-mediated silencing (as described in the subsequent paragraph) [14]. Furthermore, alongside GA, the cells were treated with SN6, a compound known as 2-[[4-[(4Nitrophenyl) methoxy] phenyl] methyl]-4-thiazolidinecarboxylic acid ethyl ester (3 µM) for 24 h. At the end of the experimental protocol, the cells were collected for subsequent analysis.
2.2. Silencing of NCX1 and NCX3
To knock-down the expression of NCX1 and NCX3 in SH-SY5Y cells, RNA interference (RNAi) technique was performed. The HiPerfect Transfections Kit from Qiagen (Hilden, Germany) was used along with FlexiTube siRNA designed for NCX1 (Qiagen, Hs_SLC8A1_9, 5′-CAGGCCATCTTCTAAGACTGA-3′) and FlexiTube siRNA for NCX3 (Qiagen, Hs_SLC8A3_7, 5′- ACCATTGGTCTCAAAGATTCA-3′) [40]. It should be noted that NCX2 is not expressed in either the undifferentiated or RA-differentiated states of SH-SY5Y cells [42], making them a valuable tool to focus on NCX1 and NCX3. In brief, following RA differentiation, SH-SY5Y cells were incubated with siRNA oligonucleotides and transfection reagents for a period of 48 h. Once the silencing process was complete, the cells were exposed to specific treatments, and cell viability, ATP content, mitochondrial ROS production, AD biomarkers, and NCX activity were evaluated.
2.3. Viability Assay
Cell viability was assessed by the MTT assay and by determining the amount of lactate dehydrogenase (LDH) released from damaged cells into the culture medium. The MTT assay evaluates the capacity of mitochondria to metabolize the yellow tetrazolium salt 3-(3,4-dimethylthiazol-2-yl)-2,5-diphenyltetrazolium bromide (MTT) resulting in the formation of insoluble purple formazan crystals. Following incubation with MTT solution (0.5 mg/mL in PBS) for 1 h in a dark environment at 37 °C and 5% CO2, the formazan crystals were dissolved in dimethyl sulfoxide (DMSO). The quantity of formazan generated was directly proportional to the mitochondrial activity of the cells, and the absorbance value was measured at a wavelength of 540 nm employing a Victor Multilabel Counter plate reader from Perkin Elmer (Waltham, MA, USA). A decline in mitochondrial activity led to a decrease in the absorbance value observed. As for LDH activity, following the experimental procedure, 50 µL of the culture medium were collected and transferred to a 96-well plate. Then, the medium was incubated with the Cytotoxicity Detection Kit reaction mixture from Roche (Basilea, Switzerland) for a duration of 30 min. Subsequently, the absorbance was read at 490 nm using a Victor Multilabel Counter plate reader. The obtained results were expressed as percentages in relation to the control value.
2.4. ATP Assay
Intracellular ATP levels were measured using a luciferase-luciferin system (ATPlite, Perkin Elmer, Waltham, MA, USA) [36]. SH-SY5Y were plated and differentiated onto a 96-well View Plate from Perkin Elmer. At the end of indicated treatments, the cells were lysed, and the ATP assay was carried out as per manufacturer’s instructions. The levels of ATP were quantified utilizing a luminescence-based Victor Multilabel Counter plate reader from Perkin Elmer. These values were then normalized to the corresponding protein content. The results were expressed as a percentage relative to the control value.
2.5. Evaluation of Mitochondrial ROS Production
Mitochondrial ROS levels were determined using MitoTracker CM-H2XRos (Invitrogen Life Technologies, Carlsbad, CA, USA), as previously described [36]. RA-differentiated SH-SY5Y cells were seeded onto coverslips and subjected to the experimental protocol. Subsequently, the cells were loaded with a dye concentration of 300 nM for a duration of 30 min at 37 °C. Confocal images were obtained using a 510 LSM microscope (Carl Zeiss, Milan, Italy) equipped with a META detection system. For visualization of MitoTracker CM-H2XRos, the dye was excited at 560 ± 10 nm, and its emission was measured at 620 ± 20 nm. Images were captured at 5 s intervals, allowing for the monitoring of basal ROS levels over approximately 200 s. Following image acquisition, the fluorescence intensity was analyzed offline. The fluorescence values were expressed as a percentage relative to the control value.
2.6. Immunofluorescence Experiments
2.6.1. Primary Antibodies
Aβ1–42 peptides were detected using a mouse monoclonal IgG1 antibody (clone 12F4, Cat. 805501, Biolegend, San Diego, CA, USA, dilution 1:100 in PBS with 1% BSA). pTau protein was evaluated by using a human PHF-Tau monoclonal IgG antibody (clone AT100, Cat. MN1060, recognizing Thr212 and Ser214, Thermo Scientific, Milano, Italy, dilution 1:1000 in PBS with 1% BSA). NCX1 protein was detected by using a rabbit polyclonal antibody (π 11-13, Swant, Switzerland, dilution 1:100 in PBS with 1% BSA). The expression of NCX3 protein was evaluated by using a rabbit polyclonal antibody (95209, Swant, Switzerland, dilution 1:100 in PBS with 1% BSA).
2.6.2. Immunofluorescence Staining
Following the experimental procedures, cells were exposed to 300 nM MitoTracker Red CMXRos (excitation/emission wavelengths: 579/599 nm) (Invitrogen Life Technologies) for 30 min, at 37 °C. Subsequently, the cells were fixed using 3.7% formaldehyde in phosphate-buffered saline at room temperature (RT) for 30 min, followed by permeabilization with 0.1% Triton X-100 at RT for 5 min [36]. Afterwards, the cells were incubated with primary antibodies (Aβ1–42, pTau AT100, and NCX1-3) for 1 h at RT, and then treated with Alexa anti-mouse 488 conjugated secondary antibody, (excitation/emission wavelengths: 499/520 nm) (Cat. A11059 Thermo Scientific, diluted 1:200), to visualize immunoreactivity. Protein fluorescence images were acquired using the LSM 510 confocal system from Carl Zeiss at 5 s intervals, the fluorescence values were monitored for approximately 20 s. Following image acquisition, the fluorescence intensity was analyzed offline, and the resulting values were expressed as percentages relative to the control value.
2.7. NCX Activity
2.7.1. Analysis of NCX Activity
Solutions: Ca-PSS was composed of (in mM): 140 NaCl; 5 KCl; 1 MgCl2; 10 glucose; 2 CaCl2; and 20 HEPES, buffered to pH 7.4 with Tris. Na-PSS (Ca2+-free solution) was composed of (in mM): 140 NaCl; 5 KCl; 1 MgCl2; 10 glucose; 0.1 EGTA; and 20 HEPES, buffered to pH 7.4 with Tris. K-PSS was composed of (in mM): 140 KCl; 1 MgCl2; 10 glucose; 0.1 CaCl2; and 20 HEPES, buffered to pH 7.4 with Tris.
2.7.2. Experimental Protocol
The levels of intracellular Ca2+ were determined using an LSM 510 confocal system from Carl Zeiss through computer-assisted video imaging on a single-cell basis. SH-SY5Y cells were treated onto 25 mm coverslips according to the experimental protocol. Following that, the cells were loaded with 4 µM Fluo-4/AM (Molecular Probe, Eugene, OR, USA) dissolved in Ca-PSS supplemented with 0.08% pluronic acid (Molecular Probe) for 40 min in darkness at RT. Cells were rinsed once with Na-PSS and subsequently treated with 1 μM thapsigargin in Na-PSS for 10 min [40]. By switching Na-PSS to K-PSS, we assessed the uptake of Ca2+ via the reverse mode. A peristaltic pump was used to change bath solutions, and images were captured every 5 s. A heated microscope stage and climate box from PeCon GmbH were employed to maintain the cells and perfusion solutions at 37 °C. An argon laser at 488 nm provided the excitation light, and the emission in the range of 505–530 nm was recorded in a time-lapse manner. Following image acquisition, we conducted the fluorescence intensity analysis offline, following the previously described methodology [40].
2.8. Drugs and Chemicals
SN6 was obtained from Tocris (Bristol, UK). All other chemicals were of analytical grade and were purchased from Sigma (Milan, Italy).
2.9. Data Analysis
Data were reported as the mean ± standard error of the mean (S.E.M.). GraphPad Prism® 5 software (San Diego, CA, USA) was used for the statistical analyses of the results. One-way ANOVA analysis followed by Dunnett’s post hoc test were applied to determine the differences between the experimental groups. Differences were considered statistically significant when p < 0.05.
3. Results
3.1. Role of NCX1 and NCX3 in the Perturbation of Cell Viability and ATP Production in GA-Challenged Cells
To mimic hypometabolism associated with AD, RA-differentiated SH-SY5Y cells were exposed for 24 h to GA (1 mM), as previously described [14,36]. To obtain further insights on the involvement of the exchangers in this experimental model, we initially used a pharmacological approach based on the NCX inhibitor 2-[[4-[(4Nitrophenyl) methoxy] phenyl] methyl]-4-thiazolidinecarboxylic acid ethyl ester (SN6, 3 µM), which was added together with GA to the cells. At this concentration, SN6 is expected to inhibit NCX1, with a weak blocking effect on NCX3 [43]. Strikingly, we observed that GA-exposed cells to SN6 did not improve viability (Figure 1A,B), as assessed by both MTT and LDH assays (Figure 1A,B), while it significantly rescued the intracellular ATP levels to the control value (Figure 1C). To further dissect the specific role of NCX1 and NCX3, we then selectively silenced their expression by using an RNA interference (RNAi)-mediated approach [40]. Interestingly, while NCX1 silencing was not accompanied by any improvement in cell viability (Figure 2B,D), the knocking-down of NCX3 expression was able to fully counteract the negative effects of GA on cell viability (Figure 2A,C). Of note, the intracellular ATP levels were restored by both NCX1 and NCX3 silencing (Figure 2E,F).
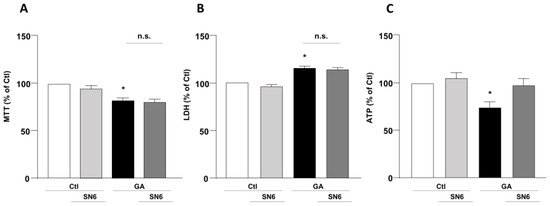
Figure 1.
Effect of SN6 on cell viability and intracellular ATP levels in RA-differentiated SH-SY5Y cells challenged with GA. (A) Effect of SN6 (3 µM) on cell viability assessed by MTT assay; (B) extracellular LDH release; and (C) ATP production. The cells were exposed to a combination of SN6 (3 µM) and GA (1 mM) for a duration of 24 h. In each experiment, MTT reduction, extracellular LDH release, and ATP levels were expressed as percentage of the control. Each column represents the mean ± S.E.M. of at least 3 experiments performed in triplicate. Significant differences were evaluated by one-way ANOVA followed by Dunnett’s post hoc test. A F (3, 16) = 9.330. * Significant vs. control groups (p < 0.01 vs. Ctl, p < 0.05 vs. SN6). B F (3, 14) = 20.44. * Significant vs. control groups (p < 0.001 vs. Ctl, p < 0.0001 vs. SN6). C F (3, 20) = 5.318. * Significant vs. all groups (p < 0.05 vs. Ctl and GA + SN6, p < 0.01 vs. SN6). Ctl control, GA glyceraldehyde, n.s. not significant.
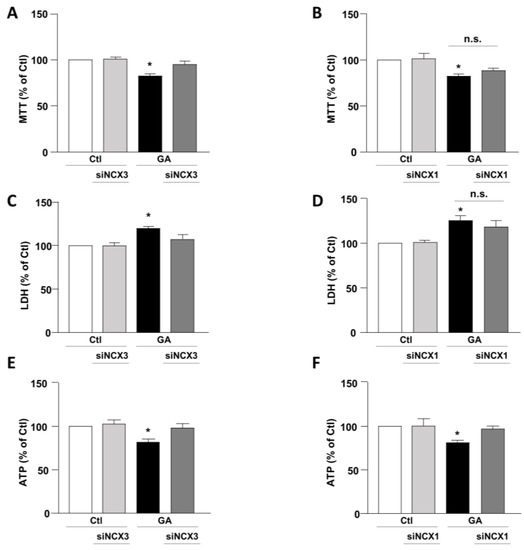
Figure 2.
Effect of NCX1 and NCX3 silencing on cell survival and intracellular ATP levels in RA-differentiated SH-SY5Y cells exposed to GA. Following the silencing of either NCX3 or NCX1, the cells were subjected to GA treatment (1 mM) for 24 h. Cell viability results, as determined by MTT assay (A,B) or LDH assay (C,D), and measurements of intracellular ATP levels (E,F) are graphed in the column charts and reported as percentages relative to the respective control group. Each column represents the mean ± S.E.M. of at least 4 experiments performed in triplicate. Significant differences were evaluated by one-way ANOVA followed by Dunnett’s post hoc test. A F (3, 18) = 11.72. * Significant vs. all groups (p < 0.001 vs. Ctl and siNCX3, p < 0.01 vs. and GA + siNCX3); B F (3, 22) = 6.147. * Significant vs. control groups (p < 0.01 vs. Ctl, p < 0.05 vs. siNCX3); C F (3, 16) = 8.034. * Significant vs. all groups (p < 0.01 vs. Ctl and siNCX3, p < 0.05 vs. GA + siNCX3); D F (3, 24) = 8.046. * Significant vs. control groups (p < 0.01 vs. Ctl and siNCX1). E F (3, 16) = 5.532. * Significant vs. all groups (p < 0.05 vs. Ctl and GA + siNCX3, p < 0.01 vs. siNCX3); F F (3, 18) = 6.503. * Significant vs. all groups (p < 0.01 vs. Ctl and siNCX1, p < 0.05 vs. GA + siNCX1). siNCX1 siRNA for NCX1, siNCX3 siRNA for NCX3.
3.2. NCX3 Silencing Reduced the Production of Mitochondrial ROS Induced by GA
The above-mentioned findings suggested that contributions of NCXs to the GA-induced cellular alterations are isoform-specific, thus leading us to hypothesize that, even though both NCX1 and NCX3 are involved in the GA-induced decrease in the intracellular ATP content, their differential impacts on GA-induced cell injury rely on additional responses. Therefore, we sought to further explore the specific contribution of NCX1 and NCX3 to the various cellular alterations that underlie GA toxicity and that can predispose the cells to develop an AD-like phenotype [14]. Among those, we firstly considered the production of ROS. Our previous research demonstrates that GA increases the production of ROS at the mitochondrial level [14]. Therefore, we attempted to understand whether either NCX1 or NCX3 could have a role in this specific setting. As expected, GA increased mitochondrial ROS production (Figure 3). We found that by silencing NCX3, ROS levels were significantly reduced in cells challenged with GA (Figure 3A,B), while NCX1 silencing had no effect at all (Figure 3C,D). Under resting conditions, either NCX1 or NCX3 silencing did not produce any significant changes in the formation of ROS.
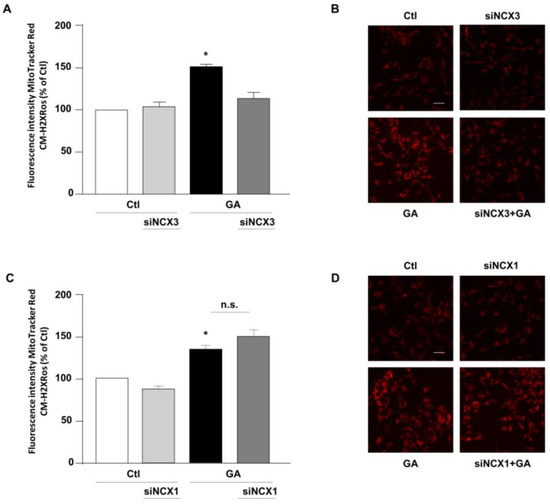
Figure 3.
Effect of NCX3 and NCX1 silencing on the generation of ROS within the mitochondria of RA-differentiated SH-SY5Y cells challenged with GA. (A,C) MitoTracker Red CM-H2XRos fluorescence, indicative of mitochondrial ROS levels, was evaluated after silencing NCX3 (A) and NCX1 (C) in cells exposed to GA (1 mM) for 24 h and reported as percentages relative to the respective control group. Each column represents the mean ± S.E.M. of at least 3 experiments performed in triplicate. Images displaying mitochondrial ROS fluorescence levels are shown for NCX3 silencing (B) and NCX1 silencing (D) and are representative of at least 3 experiments (50–100 cells for each experimental group were analyzed). Scale bar 50 µM. Significant differences were evaluated by one-way ANOVA followed by Dunnett’s post hoc test. A F (3, 8) = 25.83. * Significant vs. all groups (p < 0.001 vs. Ctl and siNCX3, p < 0.01 vs. GA + siNCX3); C F (3, 11) = 14.28. * Significant vs. control groups (p < 0.05 vs. Ctl, p < 0.01 vs. siNCX1).
3.3. NCX3 Silencing Significantly Reduced Aβ and pTau Levels in RA-Differentiated SH-SY5Y Cells
Accumulation of Aβ and hyperphosphorylated tau are characteristic lesions of AD brains. Findings from our previous studies show that when cells are treated with GA, the overall cellular injury is accompanied by sustained alterations of these two biomarkers [14,36]. Treatments that normalize both Aβ and pTau levels significantly improve cell viability [14], suggesting that such changes are negatively related to cell viability. Therefore, considering the different role exerted by NCX1 and NCX3 on the GA-induced cell damage, we sought to investigate whether this effect could be related to a different influence of NCX1 and NCX3 on the deposition of Aβ and/or on the phosphorylation of pTau. Interestingly, we observed that the knocking-down of NCX3 significantly reduced the accumulation of both Aβ (Figure 4A,B) and pTau, whose levels were significantly increased after GA challenge (Figure 5A,B). The silencing of NCX1 did not modify Aβ (Figure 4C,D) or pTau levels (Figure 5C,D), further adding ground to the distinct roles played by the two isoforms in a context of deranged metabolism.
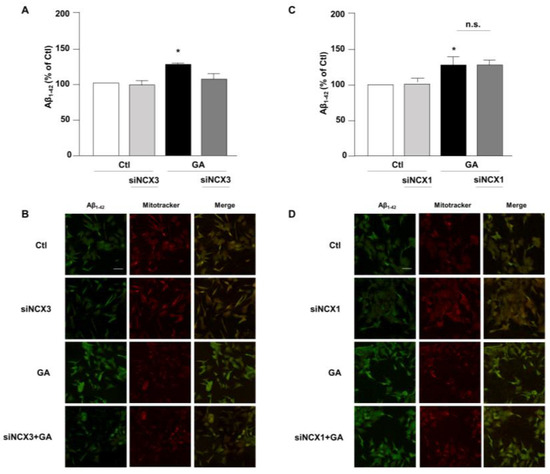
Figure 4.
Evaluation of Aβ1–42 expression in RA-differentiated SH-SY5Y cells after knocking-down of NCX3 and NCX1 expression and GA treatment. (A,C) Quantitative analysis and (B,D) representative images depicting the expression of Aβ1–42. Scale bar 50 µM. Images were representative of at least 3 experiments (50–100 cells for each experimental group were analyzed). Differences among means were evaluated by one-way ANOVA followed by Dunnett’s post hoc test. A F (3, 11) = 21.36. (A,C) Each column represents the mean ± S.E.M. obtained from at least 4 experiments performed in triplicate. * Significant vs. all groups (p < 0.01 vs. Ctl and siNCX3, p < 0.05 vs. GA + siNCX3); C F (3, 11) = 8.238. * Significant vs. control groups (p < 0.01 vs. Ctl, p < 0.05 vs. siNCX1).
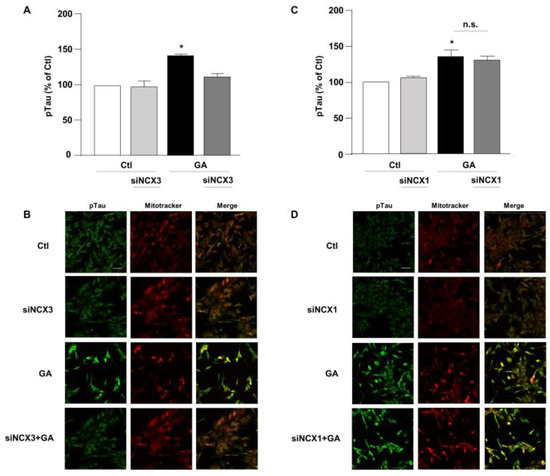
Figure 5.
Evaluation of pTau expression in RA-differentiated SH-SY5Y cells after knocking-down of NCX3 and NCX1 expression and GA treatment. (A,C) Quantitative analysis and (B,D) representative images depicting the expression of pTau. Scale bar 50 µM. Each column represents the mean S.E.M. obtained from at least 3 experiments (50–100 cells for each experimental group were analyzed). Differences among means were evaluated by one-way ANOVA followed by Dunnett’s post hoc test. A F (3, 11) = 21.36. (A,C) Each column represents the mean ± S.E.M. of at least 3 experiments performed in triplicate. * Significant vs. all groups (p < 0.0001 vs. Ctl, p < 0.001 vs. siNCX3 and p < 0.05 vs. GA + siNCX3); C F (3, 11) = 8.238. * Significant vs. control groups (p < 0.01 vs. Ctl, p < 0.05 vs. siNCX1).
3.4. NCX3 Silencing Normalizes NCX Activity after GA Challenge in RA-Differentiated SH-SY5Y Cells
Once established that NCX1 and NCX3 might have a different role in controlling the overall cellular derangement induced by GA and considering that Ca2+ homeostasis can be significantly affected by the metabolic alterations induced in this specific experimental setting [14], we lastly examined the impact of NCX1 and NCX3 activities. The activity of the exchanger was assessed by measuring the uptake of Ca2+, which is dependent on the Na+ gradient in cells that were loaded with Fluo-4, using fluorescence signals as a monitoring tool [40]. During the analysis, we monitored the reverse-mode activity by gradually reducing the extracellular Na+ (replaced by K+) at the end of the experimental protocol. As summarized in Figure 6, when the NCX reverse mode was triggered, Ca2+ uptake was significantly lower (∼30%) in GA-treated cells rather than in controls, as revealed by the decrease in fluorescence signal. When NCX3 was silenced, NCX reverse-mode activity was recovered towards control values (Figure 6A,B), while the silencing of NCX1 was completely ineffective in restoring the exchanger activity (Figure 6C,D). Interestingly, neither NCX3 nor NCX1 silencing produced any significant change under control conditions. Furthermore, the observed changes in the NCXs activity were not accompanied by alterations in protein expression, in all the tested experimental conditions (Figure S1).
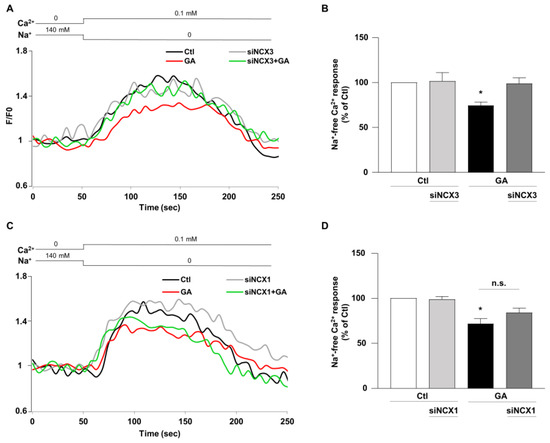
Figure 6.
Effect of NCX3 and NCX1 knocking-down on NCX activity after GA challenge in RA-differentiated SH-SY5Y cells. (A,C) Representative records of Ca2+ response to Na+ free after incubation were obtained under different conditions: control (black line), siNCX1 and siNCX3 (grey line), GA treatment (red line) and GA treatment in combination with siRNA (siNCX3 and siNCX1, green line). (B,D) Quantitative analyses were performed at the end of the experimental protocol. The fluorescence intensity values were normalized to the resting fluorescence (F/F0), and the activity of NCX was expressed as the percentage increase in fluorescence (Δ% fluorescence increase). The bar plot represents the mean ± S.E.M. of the fluorescence increase induced by the Na+ free pulse. For each experimental group, Δ% values used for statistical analysis were derived from a minimum of 4 experiments performed in triplicate, with 100–150 cells recorded in each session. Each column represents the mean ± S.E.M. of at least 4 experiments performed in triplicate. Differences among means were evaluated by one-way ANOVA followed by Dunnett’s post hoc test. B F (3, 17) = 4.62. * Significant vs. all groups (p < 0.05 vs. Ctl, siNCX3 and GA + siNCX3). D F (3, 25) = 12.53. * Significant vs. control groups (p < 0.0001 vs. Ctl, p < 0.001 vs. siNCX1).
4. Discussion
Numerous evidence supports the multifactorial nature of AD. Over the years, it has been recognized that metabolic alterations are crucial for this neurodegenerative disorder. In this study we focused on the metabolic defects that may create an environment suitable for AD development by using an in vitro model mimicking the alteration of glucose metabolism in RA-differentiated SH-SY5Y cells [14,36,44]. To mimic bioenergetic alterations (i.e., hypometabolism, mitochondrial dysfunction and redox imbalance [14]), which are regarded as early pathological events of AD neurodegenerative spiral, we exposed cells to GA [14]. GA cytotoxicity is also related to the alteration of Ca2+ homeostasis [14,36], another element that significantly contributes in giving rise to a vicious cycle capable of increasing the levels of Aβ and pTau and of activating cell death pathways [24]. In line with this so called “Ca2+ hypothesis in AD”, we aimed to investigate the implication of NCX1 and NCX3 in a context of metabolic deficit that may precede AD and lay its foundations. We focused on NCX1 and NCX3, since they are crucially involved in pathological settings where metabolic derangements have a prominent role. We have recently characterized the existence of a functional connection between NCX1 activity and metabolic substrates utilization, with particular reference to glutamate, in different in vitro pathological settings, such as cardiac and neuronal ischemia, PD and AD [36,40]. Under our culture conditions SH-SY5Y cells do not express the NCX2 isoform, either when undifferentiated or after differentiation with RA [42]. Therefore, the sequential silencing of the two isoforms allowed us to specifically assess the role of each one in this specific experimental setting. In this context, we found an isoform-specific contribution to the GA-induced cell damage. In particular, the knocking-down of NCX3 was capable of halting the neuronal damage progression, improving cell viability along with a full recovery of ATP levels and of mitochondrial ROS production to control values. In addition, NCX3 silencing completely counteracted the incremental shifts of Aβ and pTau levels provoked by GA. In stark contrast, NCX1 silencing solely prevented the GA-dependent reduction in ATP levels, having neutral effects on the other variables and markers used for cell damage and AD-related injury. We found an overall significant reduction in exchangers’ activity, monitored as Ca2+ uptake, following GA treatment. The activity was normalized towards control levels when NCX3 expression was silenced. Conversely, the knocking- down of NCX1 was totally ineffective. It is interesting to note that these effects were not related to any changes in the expression of the exchangers, suggesting that the derangement of Ca2+ levels following NCX reverse mode stimulation were mainly due to a modification of the transport activity rather than to a decreased expression of the exchangers, or alternatively, to a redistribution of the surface fraction of the exchangers; both hypotheses deserve further evaluations. A similar result has been observed in RA-differentiated SH-SY5Y cells exposed to hypoxia/reoxygenation (H/R) insult, which alters cell metabolism as well [40]. It is possible to speculate that this overall modification of the exchangers activity may follow a global ionic dysregulation resulting from the drop of ATP intracellular content. As aforementioned, the expression pattern of the exchangers in the SH-SY5Y cell line allowed us to dissect the role of NCX1 and NCX3. The knocking-down of NCX3 implied that NCX1 was the only “available” isoform potentially capable of modulating Ca2+ levels in this specific context; conversely, the knocking-down of NCX1 allowed NCX3 to mainly handle Ca2+ dynamics. In this view, data obtained by knocking-down NCX3 disclosed a prominent and detrimental role of this isoform, as its elimination positively affected GA-related cell outcomes. It seems more likely to hypothesize a negative role of NCX3 rather than a protective one of NCX1, since the knocking-down of the latter did not produce any changes in GA-related effects; in particular, we did not observe a worsening of the overall cellular response to GA, suggesting a neutral role of NCX1. This observation is in line with the neutral role of NCX1 in the above-mentioned H/R setting [40]. The only cellular response that seemed to rely on both NCX1 and NCX3 was the production of ATP. Consistent with this hypothesis, the use of the pharmacological inhibitor SN6, which is slightly selective for the NCX1 isoform [43], did not produce any effect on GA-related outcomes, except for the increase in ATP levels.
It must be highlighted that the experimental setting used in this work attempts to reproduce a condition that precedes the manifestation of the disease, rather than a situation where cells already show the main AD hallmarks; therefore, our data are not in conflict with the available literature on the role of NCX3 in AD. To date, different studies provide evidence for a protective role of NCX3 in various AD models [33,35,45,46,47]. First, in 1991, Colvin and colleagues observed an increase in NCX activity in surviving neurons of AD patients, suggesting that it may confer protection against AD neurodegenerative processes [45]. Later on, it has been observed that Aβ overproduction may promote the calpain-mediated cleavage of NCX3 in AD brain, supporting the contribution of NCX3 in limiting the intracellular Ca2+ overload and preserving cell viability [35]. Further, the reduction of both NCX2 and NCX3 expression seems to be related to cognitive decline in hippocampal CA1 neurons of APP transgenic mice [46]. All the above-mentioned studies focused on investigating the role of NCX3 during a clearly established neuronal damage, while our aim was to gain further insights on the mechanisms underlying the early stage of AD, often characterized by a defective metabolism as a main hallmark. In line with our findings, available data demonstrate that in pathological settings where metabolic dysfunctions prevail, NCX3 may play a central role in promoting neurotoxicity [32,34]. For instance, in cortical neurons subjected to severe transient ischemic and excitotoxic insults, NCX3 knocking-down is shown to ameliorate cell viability. Moreover, a neurotoxic role of NCX3 was observed in BHK cells stably transfected with NCX3 exposed to the fungicide ziram, a pesticide known to increase the risk of developing PD by altering the cellular redox status [48,49] and disrupting mitochondrial activity. In particular, BHK-NCX3 were more vulnerable to ziram-induced intracellular Ca2+ overload and mitochondrial dysfunction than BHK wild type cells, suggesting that NCX3 leads to a worsening of cell damage during ziram neurotoxicity [34].
It should be emphasized that the data related to NCX activity are widely debated and strongly linked to the specific context the exchangers are working in. The proposed model is based on the use of SH-SY5Y, which is a human neuroblastoma cell line; here, we observed a global decline of the NCXs’ activity. However, in a previous study, we observed that in primary rat cortical neurons, GA induced an increase in the overall NCX activity [36]. The apparent discrepancy can be explained considering two main issues: (1) the different nature of the experimental models (human vs. rat); (2) the expression of NCX2 isoform in rat cortical neurons. Further studies are needed to better clarify the actual contribution of each single NCX isoform in this setting, which is characterized by several complexities. Despite the different impact of GA on the exchangers’ activity, it seems quite obvious that such a metabolic alteration can perturb intracellular Ca2+ dynamics, with deleterious consequences on neuronal activities, ranging from mitochondrial dysfunction, oxidative stress, deposition of Aβ, and hyperphosphorylation of Tau protein. While RA-differentiated SH-SY5Y cells are a simple and easy to handle in vitro model, we have to consider that it does not involve glial cells, which are well known to sustain neuronal functions, with main regard to the metabolism and substrates utilization [50]. A denser accumulation of astrocytes colocalized with AGEs has been observed in patients with AD [51,52,53], suggesting a role of surrounding astrocytes in triggering a cascade of events that may affect the neighboring neurons [54], preparing for a shift in perspective of the disease pathogenesis that deserve further investigations.
In conclusion, our work demonstrated that: (1) NCX1 and NCX3 can operate in different ways strictly depending on the specific environmental settings, and that (2) NCX3 has a strong impact on GA-induced cytotoxicity, since NCX3 knocking-down appears to increase ATP production, rescue the intracellular Ca2+ perturbation, reduce the accumulation of both Aβ and pTau, and mitigate oxidative damage thus promoting cell survival. Overall, these findings highlight the importance of NCX3 in setting the conditions to trigger neurodegeneration, providing a potential target for slowing down or preventing AD.
Supplementary Materials
The following supporting information can be downloaded at: https://www.mdpi.com/article/10.3390/biology12071005/s1, Figure S1: Expression of NCX1 and NCX3 in RA-differentiated SH-SY5Y cells after NCX3 and NCX1 silencing and GA-challenge.
Author Contributions
Conceptualization: S.M., V.L. and S.P.; methodology: S.P., A.P., T.S., G.C., V.T. and S.M.; validation: S.P., A.P., T.S., G.C., A.V., M.O., V.T., S.A., V.L. and S.M.; formal analysis: S.P., A.P., T.S., G.C., V.T. and S.M.; investigation: S.P., A.P. and S.M.; resources: S.A., S.M. and V.L.; data curation: S.P., A.P. and S.M.; writing—original draft preparation: S.P., A.P., A.V., S.M. and V.L.; visualization: S.P., A.P., T.S., G.C., A.V., M.O., V.T., S.A., V.L. and S.M.; supervision: S.M.; project administration: S.M., V.L. and S.A.; funding acquisition: S.A., S.M. and V.L. All authors have read and agreed to the published version of the manuscript.
Funding
This study was funded by “Ministero dell’Istruzione, dell’Università e della Ricerca” (MIUR) to S.A. (PRIN 2017 grant no. 2017YH3SXK) and “Ricerca Scientifica di Ateneo” Grant (RSA 2021-2022).
Institutional Review Board Statement
Not applicable.
Informed Consent Statement
Not applicable.
Data Availability Statement
The data presented in this study are available on request from the corresponding author.
Acknowledgments
We wish to thank Gerardo Galeazzi for his invaluable technical assistance.
Conflicts of Interest
The authors declare no conflict of interest.
References
- GBD 2019 Dementia Forecasting Collaborators. Estimation of the global prevalence of dementia in 2019 and forecasted prevalence in 2050: An analysis for the Global Burden of Disease Study 2019. Lancet Public Health 2022, 7, e105–e125. [Google Scholar] [CrossRef]
- van der Flier, W.M.; de Vugt, M.E.; Smets, E.M.A.; Blom, M.; Teunissen, C.E. Towards a future where Alzheimer’s disease pathology is stopped before the onset of dementia. Nat. Aging 2023, 3, 494–505. [Google Scholar] [CrossRef] [PubMed]
- Pimplikar, S.W. Neuroinflammation in Alzheimer’s disease: From pathogenesis to a therapeutic target. J. Clin. Immunol. 2014, 34 (Suppl. S1), S64–S69. [Google Scholar] [CrossRef] [PubMed]
- Guo, T.; Zhang, D.; Zeng, Y.; Huang, T.Y.; Xu, H.; Zhao, Y. Molecular and cellular mechanisms underlying the pathogenesis of Alzheimer’s disease. Mol. Neurodegener. 2020, 15, 40. [Google Scholar] [CrossRef] [PubMed]
- Yan, X.; Hu, Y.; Wang, B.; Wang, S.; Zhang, X. Metabolic Dysregulation Contributes to the Progression of Alzheimer’s Disease. Front. Neurosci. 2020, 14, 530219. [Google Scholar] [CrossRef]
- Hammond, T.C.; Lin, A.L. Glucose Metabolism is a Better Marker for Predicting Clinical Alzheimer’s Disease than Amyloid or Tau. J. Cell Immunol. 2022, 4, 15–18. [Google Scholar]
- Hoyer, S. The effect of age on glucose and energy metabolism in brain cortex of rats. Arch. Gerontol. Geriatr. 1985, 4, 193–203. [Google Scholar] [CrossRef]
- Butterfield, D.A.; Halliwell, B. Oxidative stress, dysfunctional glucose metabolism and Alzheimer disease. Nat. Rev. Neurosci. 2019, 20, 148–160. [Google Scholar] [CrossRef]
- Strom, A.; Iaccarino, L.; Edwards, L.; Lesman-Segev, O.H.; Soleimani-Meigooni, D.N.; Pham, J.; Baker, S.L.; Landau, S.M.; Jagust, W.J.; Miller, B.L.; et al. Cortical hypometabolism reflects local atrophy and tau pathology in symptomatic Alzheimer’s disease. Brain 2022, 145, 713–728. [Google Scholar] [CrossRef]
- Calsolaro, V.; Edison, P. Alterations in Glucose Metabolism in Alzheimer’s Disease. Recent Pat. Endocr. Metab. Immune Drug Discov. 2016, 10, 31–39. [Google Scholar] [CrossRef]
- Dewanjee, S.; Chakraborty, P.; Bhattacharya, H.; Chacko, L.; Singh, B.; Chaudhary, A.; Javvaji, K.; Pradhan, S.R.; Vallamkondu, J.; Dey, A.; et al. Altered glucose metabolism in Alzheimer’s disease: Role of mitochondrial dysfunction and oxidative stress. Free Radic. Biol. Med. 2022, 193, 134–157. [Google Scholar] [CrossRef] [PubMed]
- Cisternas, P.; Zolezzi, J.M.; Martinez, M.; Torres, V.I.; Wong, G.W.; Inestrosa, N.C. Wnt-induced activation of glucose metabolism mediates the in vivo neuroprotective roles of Wnt signaling in Alzheimer disease. J. Neurochem. 2019, 149, 54–72. [Google Scholar] [CrossRef] [PubMed]
- An, Y.; Varma, V.R.; Varma, S.; Casanova, R.; Dammer, E.; Pletnikova, O.; Chia, C.W.; Egan, J.M.; Ferrucci, L.; Troncoso, J.; et al. Evidence for brain glucose dysregulation in Alzheimer’s disease. Alzheimers Dement. 2018, 14, 318–329. [Google Scholar] [CrossRef] [PubMed]
- Piccirillo, S.; Preziuso, A.; Amoroso, S.; Serfilippi, T.; Miceli, F.; Magi, S.; Lariccia, V. A new K+ channel-independent mechanism is involved in the antioxidant effect of XE-991 in an in vitro model of glucose metabolism impairment: Implications for Alzheimer’s disease. Cell Death Discov. 2022, 8, 391. [Google Scholar] [CrossRef]
- Mattson, M.P.; Barger, S.W.; Cheng, B.; Lieberburg, I.; Smith-Swintosky, V.L.; Rydel, R.E. β-Amyloid precursor protein metabolites and loss of neuronal Ca2+ homeostasis in Alzheimer’s disease. Trends Neurosci. 1993, 16, 409–414. [Google Scholar] [CrossRef] [PubMed]
- Nikoletopoulou, V.; Tavernarakis, N. Calcium homeostasis in aging neurons. Front. Genet. 2012, 3, 200. [Google Scholar] [CrossRef]
- Marambaud, P.; Dreses-Werringloer, U.; Vingtdeux, V. Calcium signaling in neurodegeneration. Mol. Neurodegener. 2009, 4, 20. [Google Scholar] [CrossRef]
- Guan, P.P.; Cao, L.L.; Wang, P. Elevating the Levels of Calcium Ions Exacerbate Alzheimer’s Disease via Inducing the Production and Aggregation of β-Amyloid Protein and Phosphorylated Tau. Int. J. Mol. Sci. 2021, 22, 5900. [Google Scholar] [CrossRef]
- Webber, E.K.; Fivaz, M.; Stutzmann, G.E.; Griffioen, G. Cytosolic calcium: Judge, jury and executioner of neurodegeneration in Alzheimer’s disease and beyond. Alzheimers Dement. 2023. [Google Scholar] [CrossRef]
- Demuro, A.; Parker, I.; Stutzmann, G.E. Calcium signaling and amyloid toxicity in Alzheimer disease. J. Biol. Chem. 2010, 285, 12463–12468. [Google Scholar] [CrossRef]
- Itkin, A.; Dupres, V.; Dufrene, Y.F.; Bechinger, B.; Ruysschaert, J.M.; Raussens, V. Calcium ions promote formation of amyloid β-peptide (1–40) oligomers causally implicated in neuronal toxicity of Alzheimer’s disease. PLoS ONE 2011, 6, e18250. [Google Scholar] [CrossRef] [PubMed]
- Green, K.N.; LaFerla, F.M. Linking calcium to Aβ and Alzheimer’s disease. Neuron 2008, 59, 190–194. [Google Scholar] [CrossRef] [PubMed]
- Ahmad, A.; Muzaffar, M.; Ingram, V.M. Ca2+, within the physiological concentrations, selectively accelerates Aβ42 fibril formation and not Aβ40 in vitro. Biochim. Biophys. Acta 2009, 1794, 1537–1548. [Google Scholar] [CrossRef]
- Ge, M.; Zhang, J.; Chen, S.; Huang, Y.; Chen, W.; He, L.; Zhang, Y. Role of Calcium Homeostasis in Alzheimer’s Disease. Neuropsychiatr. Dis. Treat. 2022, 18, 487–498. [Google Scholar] [CrossRef]
- Rodrigues, T.; Piccirillo, S.; Magi, S.; Preziuso, A.; Dos Santos Ramos, V.; Serfilippi, T.; Orciani, M.; Maciel Palacio Alvarez, M.; Luis Dos Santos Tersariol, I.; Amoroso, S.; et al. Control of Ca2+ and metabolic homeostasis by the Na+/Ca2+ exchangers (NCXs) in health and disease. Biochem. Pharmacol. 2022, 203, 115163. [Google Scholar] [CrossRef]
- Blaustein, M.P.; Lederer, W.J. Sodium/calcium exchange: Its physiological implications. Physiol. Rev. 1999, 79, 763–854. [Google Scholar] [CrossRef]
- Lariccia, V.; Piccirillo, S.; Preziuso, A.; Amoroso, S.; Magi, S. Cracking the code of sodium/calcium exchanger (NCX) gating: Old and new complexities surfacing from the deep web of secondary regulations. Cell Calcium 2020, 87, 102169. [Google Scholar] [CrossRef]
- Quednau, B.D.; Nicoll, D.A.; Philipson, K.D. Tissue specificity and alternative splicing of the Na+/Ca2+ exchanger isoforms NCX1, NCX2, and NCX3 in rat. Am. J. Physiol. 1997, 272, C1250–C1261. [Google Scholar] [CrossRef] [PubMed]
- Khananshvili, D. The SLC8 gene family of sodium-calcium exchangers (NCX)—Structure, function, and regulation in health and disease. Mol. Asp. Med. 2013, 34, 220–235. [Google Scholar] [CrossRef]
- Pannaccione, A.; Piccialli, I.; Secondo, A.; Ciccone, R.; Molinaro, P.; Boscia, F.; Annunziato, L. The Na+/Ca2+ exchanger in Alzheimer’s disease. Cell Calcium 2020, 87, 102190. [Google Scholar] [CrossRef]
- Bano, D.; Young, K.W.; Guerin, C.J.; Lefeuvre, R.; Rothwell, N.J.; Naldini, L.; Rizzuto, R.; Carafoli, E.; Nicotera, P. Cleavage of the plasma membrane Na+/Ca2+ exchanger in excitotoxicity. Cell 2005, 120, 275–285. [Google Scholar] [CrossRef] [PubMed]
- Cross, J.L.; Meloni, B.P.; Bakker, A.J.; Sokolow, S.; Herchuelz, A.; Schurmans, S.; Knuckey, N.W. Neuronal injury in NCX3 knockout mice following permanent focal cerebral ischemia and in NCX3 knockout cortical neuronal cultures following oxygen-glucose deprivation and glutamate exposure. J. Exp. Stroke Transl. Med. 2009, 2, 3–9. [Google Scholar] [CrossRef]
- Sokolow, S.; Luu, S.H.; Headley, A.J.; Hanson, A.Y.; Kim, T.; Miller, C.A.; Vinters, H.V.; Gylys, K.H. High levels of synaptosomal Na+-Ca2+ exchangers (NCX1, NCX2, NCX3) co-localized with amyloid-β in human cerebral cortex affected by Alzheimer’s disease. Cell Calcium 2011, 49, 208–216. [Google Scholar] [CrossRef] [PubMed]
- Jin, J.; Lao, A.J.; Katsura, M.; Caputo, A.; Schweizer, F.E.; Sokolow, S. Involvement of the sodium-calcium exchanger 3 (NCX3) in ziram-induced calcium dysregulation and toxicity. Neurotoxicology 2014, 45, 56–66. [Google Scholar] [CrossRef] [PubMed]
- Atherton, J.; Kurbatskaya, K.; Bondulich, M.; Croft, C.L.; Garwood, C.J.; Chhabra, R.; Wray, S.; Jeromin, A.; Hanger, D.P.; Noble, W. Calpain cleavage and inactivation of the sodium calcium exchanger-3 occur downstream of Aβ in Alzheimer’s disease. Aging Cell 2014, 13, 49–59. [Google Scholar] [CrossRef]
- Magi, S.; Piccirillo, S.; Maiolino, M.; Lariccia, V.; Amoroso, S. NCX1 and EAAC1 transporters are involved in the protective action of glutamate in an in vitro Alzheimer’s disease-like model. Cell Calcium 2020, 91, 102268. [Google Scholar] [CrossRef]
- Piccirillo, S.; Magi, S.; Preziuso, A.; Castaldo, P.; Amoroso, S.; Lariccia, V. Gateways for Glutamate Neuroprotection in Parkinson’s Disease (PD): Essential Role of EAAT3 and NCX1 Revealed in an In Vitro Model of PD. Cells 2020, 9, 2037. [Google Scholar] [CrossRef]
- Maiolino, M.; Castaldo, P.; Lariccia, V.; Piccirillo, S.; Amoroso, S.; Magi, S. Essential role of the Na+-Ca2+ exchanger (NCX) in glutamate-enhanced cell survival in cardiac cells exposed to hypoxia/reoxygenation. Sci. Rep. 2017, 7, 13073. [Google Scholar] [CrossRef]
- Castaldo, P.; Macri, M.L.; Lariccia, V.; Matteucci, A.; Maiolino, M.; Gratteri, S.; Amoroso, S.; Magi, S. Na+/Ca2+ exchanger 1 inhibition abolishes ischemic tolerance induced by ischemic preconditioning in different cardiac models. Eur. J. Pharmacol. 2017, 794, 246–256. [Google Scholar] [CrossRef]
- Piccirillo, S.; Castaldo, P.; Macri, M.L.; Amoroso, S.; Magi, S. Glutamate as a potential “survival factor” in an in vitro model of neuronal hypoxia/reoxygenation injury: Leading role of the Na+/Ca2+ exchanger. Cell Death Dis. 2018, 9, 731. [Google Scholar] [CrossRef]
- Shenoda, B. The role of Na+/Ca2+ exchanger subtypes in neuronal ischemic injury. Transl. Stroke Res. 2015, 6, 181–190. [Google Scholar] [CrossRef]
- Iwamoto, T.; Kita, S. YM-244769, a novel Na+/Ca2+ exchange inhibitor that preferentially inhibits NCX3, efficiently protects against hypoxia/reoxygenation-induced SH-SY5Y neuronal cell damage. Mol. Pharmacol. 2006, 70, 2075–2083. [Google Scholar] [CrossRef]
- Iwamoto, T.; Inoue, Y.; Ito, K.; Sakaue, T.; Kita, S.; Katsuragi, T. The exchanger inhibitory peptide region-dependent inhibition of Na+/Ca2+ exchange by SN-6 [2-[4-(4-nitrobenzyloxy)benzyl]thiazolidine-4-carboxylic acid ethyl ester], a novel benzyloxyphenyl derivative. Mol. Pharmacol. 2004, 66, 45–55. [Google Scholar] [CrossRef]
- Koriyama, Y.; Furukawa, A.; Muramatsu, M.; Takino, J.; Takeuchi, M. Glyceraldehyde caused Alzheimer’s disease-like alterations in diagnostic marker levels in SH-SY5Y human neuroblastoma cells. Sci. Rep. 2015, 5, 13313. [Google Scholar] [CrossRef] [PubMed]
- Colvin, R.A.; Bennett, J.W.; Colvin, S.L.; Allen, R.A.; Martinez, J.; Miner, G.D. Na+/Ca2+ exchange activity is increased in Alzheimer’s disease brain tissues. Brain Res. 1991, 543, 139–147. [Google Scholar] [CrossRef] [PubMed]
- Moriguchi, S.; Kita, S.; Fukaya, M.; Osanai, M.; Inagaki, R.; Sasaki, Y.; Izumi, H.; Horie, K.; Takeda, J.; Saito, T.; et al. Reduced expression of Na+/Ca2+ exchangers is associated with cognitive deficits seen in Alzheimer’s disease model mice. Neuropharmacology 2018, 131, 291–303. [Google Scholar] [CrossRef] [PubMed]
- Pannaccione, A.; Secondo, A.; Molinaro, P.; D’Avanzo, C.; Cantile, M.; Esposito, A.; Boscia, F.; Scorziello, A.; Sirabella, R.; Sokolow, S.; et al. A new concept: Aβ1-42 generates a hyperfunctional proteolytic NCX3 fragment that delays caspase-12 activation and neuronal death. J. Neurosci. 2012, 32, 10609–10617. [Google Scholar] [CrossRef] [PubMed]
- Kanemoto-Kataoka, Y.; Oyama, K.; Oyama, T.M.; Ishibashi, H.; Oyama, Y. Ziram, a dithiocarbamate fungicide, exhibits pseudo-cytoprotective actions against oxidative stress in rat thymocytes: Possible environmental risks. Environ. Res. 2018, 160, 232–238. [Google Scholar] [CrossRef]
- Martin, C.A.; Myers, K.M.; Chen, A.; Martin, N.T.; Barajas, A.; Schweizer, F.E.; Krantz, D.E. Ziram, a pesticide associated with increased risk for Parkinson’s disease, differentially affects the presynaptic function of aminergic and glutamatergic nerve terminals at the Drosophila neuromuscular junction. Exp. Neurol. 2016, 275 Pt 1, 232–241. [Google Scholar] [CrossRef]
- Jha, M.K.; Morrison, B.M. Glia-neuron energy metabolism in health and diseases: New insights into the role of nervous system metabolic transporters. Exp. Neurol. 2018, 309, 23–31. [Google Scholar] [CrossRef]
- Wong, A.; Luth, H.J.; Deuther-Conrad, W.; Dukic-Stefanovic, S.; Gasic-Milenkovic, J.; Arendt, T.; Munch, G. Advanced glycation endproducts co-localize with inducible nitric oxide synthase in Alzheimer’s disease. Brain Res. 2001, 920, 32–40. [Google Scholar] [CrossRef] [PubMed]
- Luth, H.J.; Ogunlade, V.; Kuhla, B.; Kientsch-Engel, R.; Stahl, P.; Webster, J.; Arendt, T.; Munch, G. Age- and stage-dependent accumulation of advanced glycation end products in intracellular deposits in normal and Alzheimer’s disease brains. Cereb. Cortex 2005, 15, 211–220. [Google Scholar] [CrossRef] [PubMed]
- Prasad, K. AGE-RAGE stress: A changing landscape in pathology and treatment of Alzheimer’s disease. Mol. Cell Biochem. 2019, 459, 95–112. [Google Scholar] [CrossRef] [PubMed]
- Sollvander, S.; Nikitidou, E.; Brolin, R.; Soderberg, L.; Sehlin, D.; Lannfelt, L.; Erlandsson, A. Accumulation of amyloid-β by astrocytes result in enlarged endosomes and microvesicle-induced apoptosis of neurons. Mol. Neurodegener. 2016, 11, 38. [Google Scholar] [CrossRef] [PubMed]


Disclaimer/Publisher’s Note: The statements, opinions and data contained in all publications are solely those of the individual author(s) and contributor(s) and not of MDPI and/or the editor(s). MDPI and/or the editor(s) disclaim responsibility for any injury to people or property resulting from any ideas, methods, instructions or products referred to in the content. |
© 2023 by the authors. Licensee MDPI, Basel, Switzerland. This article is an open access article distributed under the terms and conditions of the Creative Commons Attribution (CC BY) license (https://creativecommons.org/licenses/by/4.0/).