
Analysis of Elimination Effects of Inbreeding on Genotype Frequency in Larval Stages of Chinese Shrimp

Abstract
Simple Summary
Abstract
1. Introduction
2. Materials and Methods
2.1. Research Population and Family Construction
2.2. Sequencing Library Construction
2.3. Data Processing and Genotyping
2.4. Genotype Frequency Analysis
2.5. Comparison of Genetic Parameters and Locus Frequencies
2.6. Statistical Analysis
3. Results
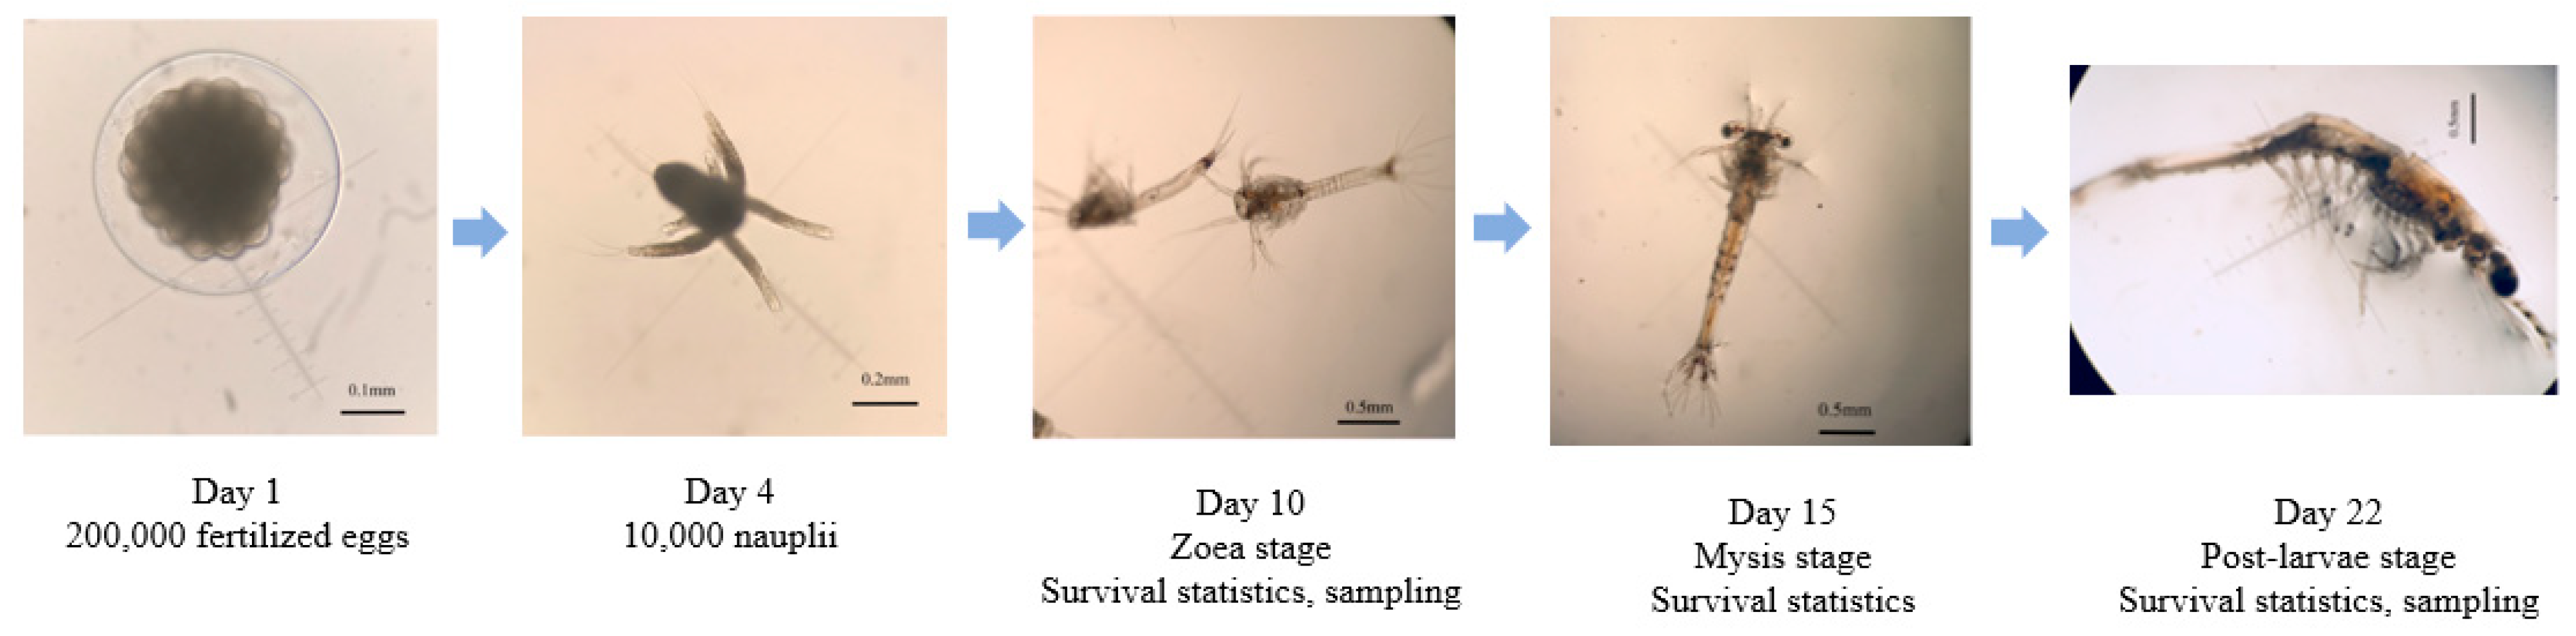
3.1. Descriptive Statistics of Larval Survival
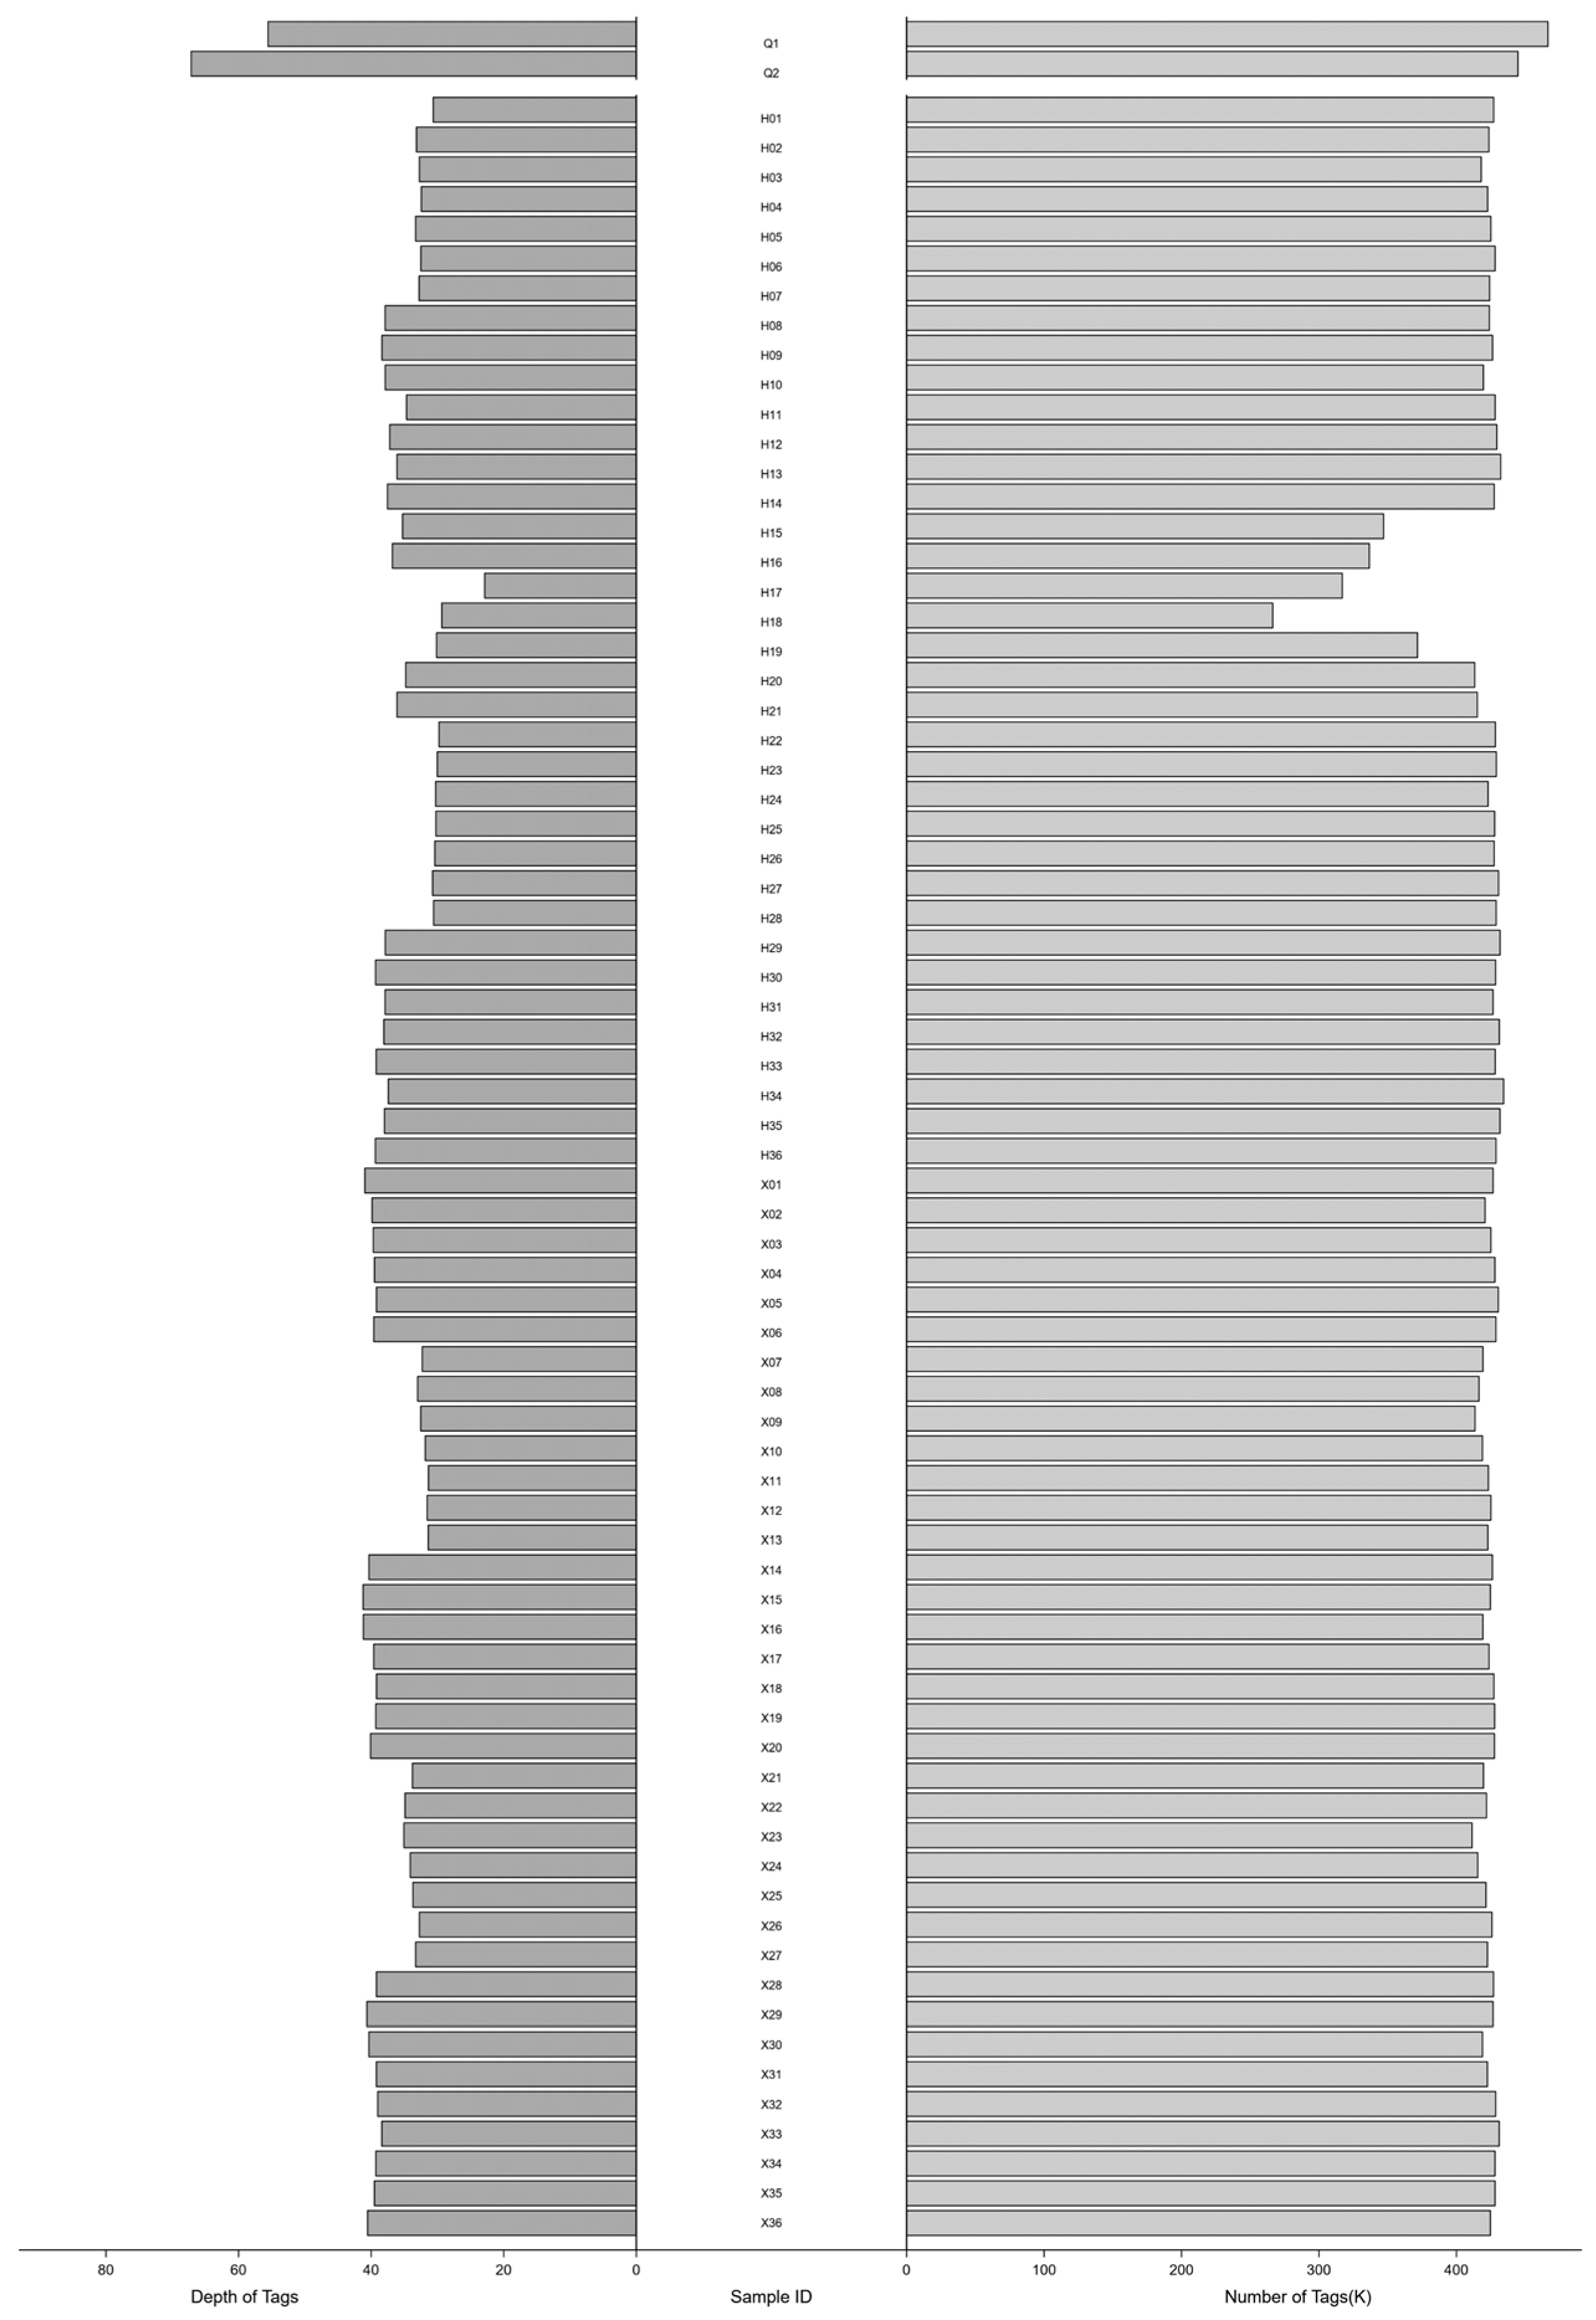
3.2. Sequencing Data Processing and Marker Development
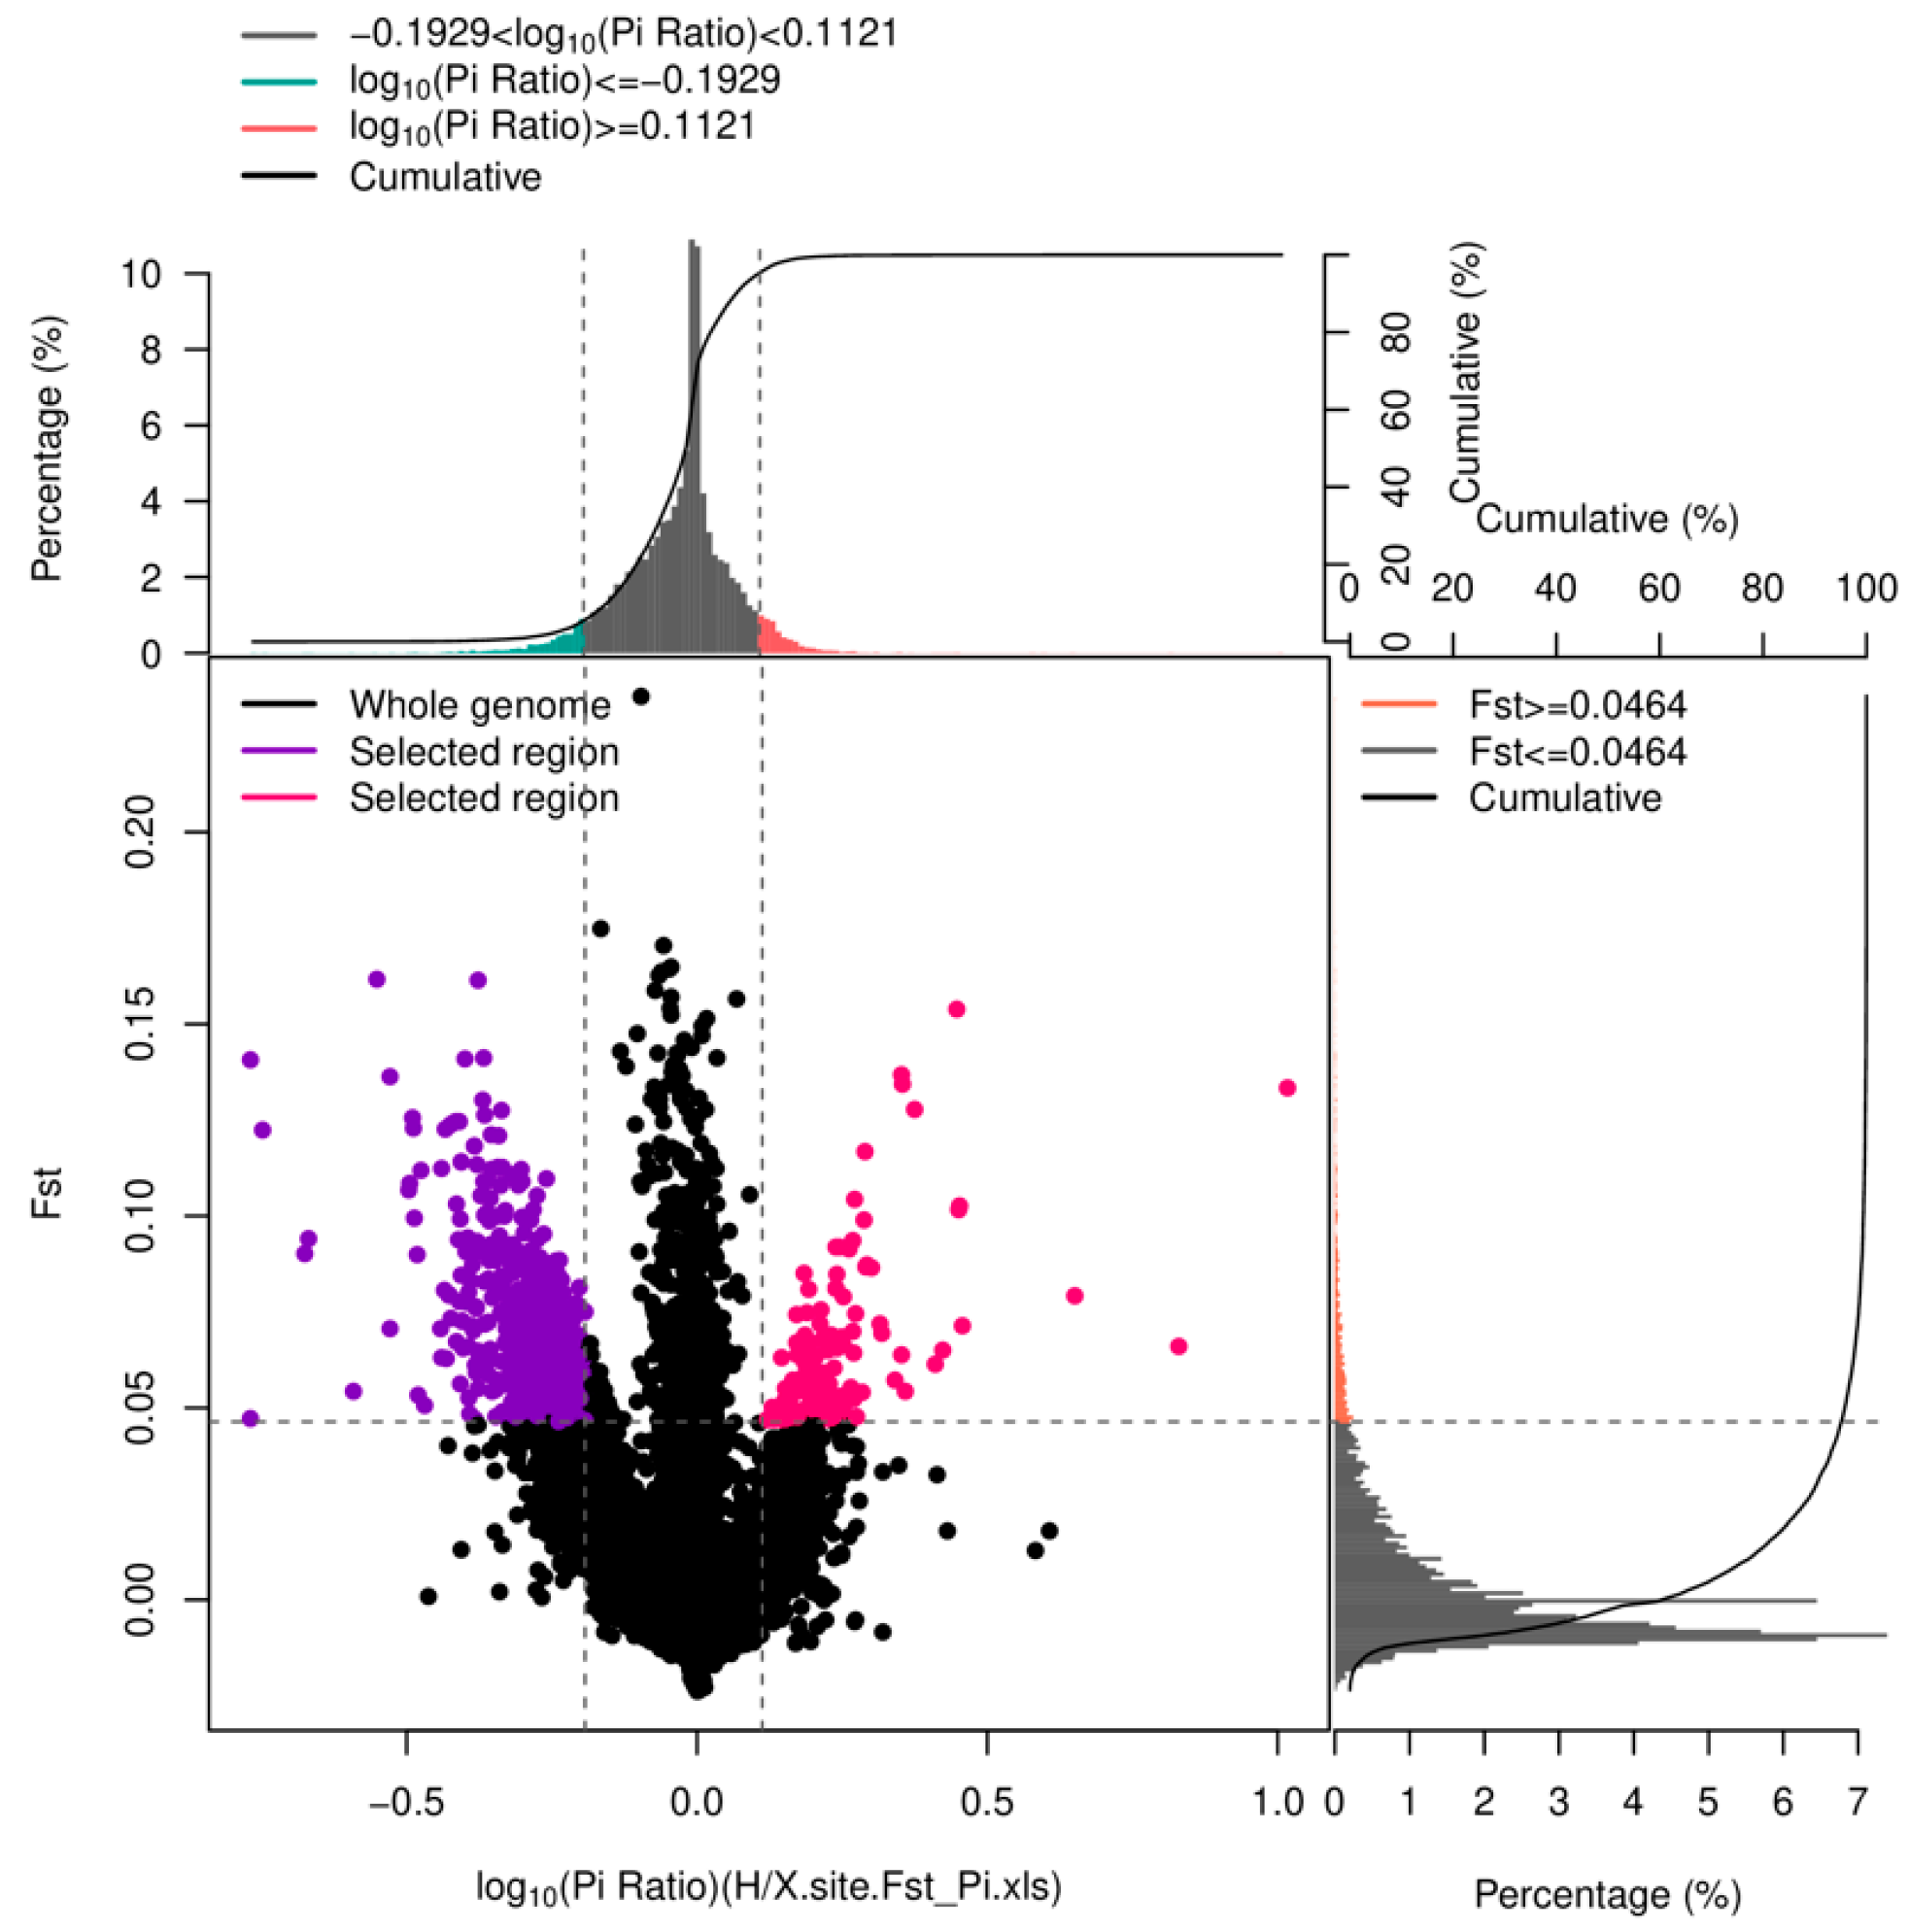
3.3. Changes in Genetic Diversity between the Two Stages
3.4. Overall Manifestation of Segregation Distortion in Larvae
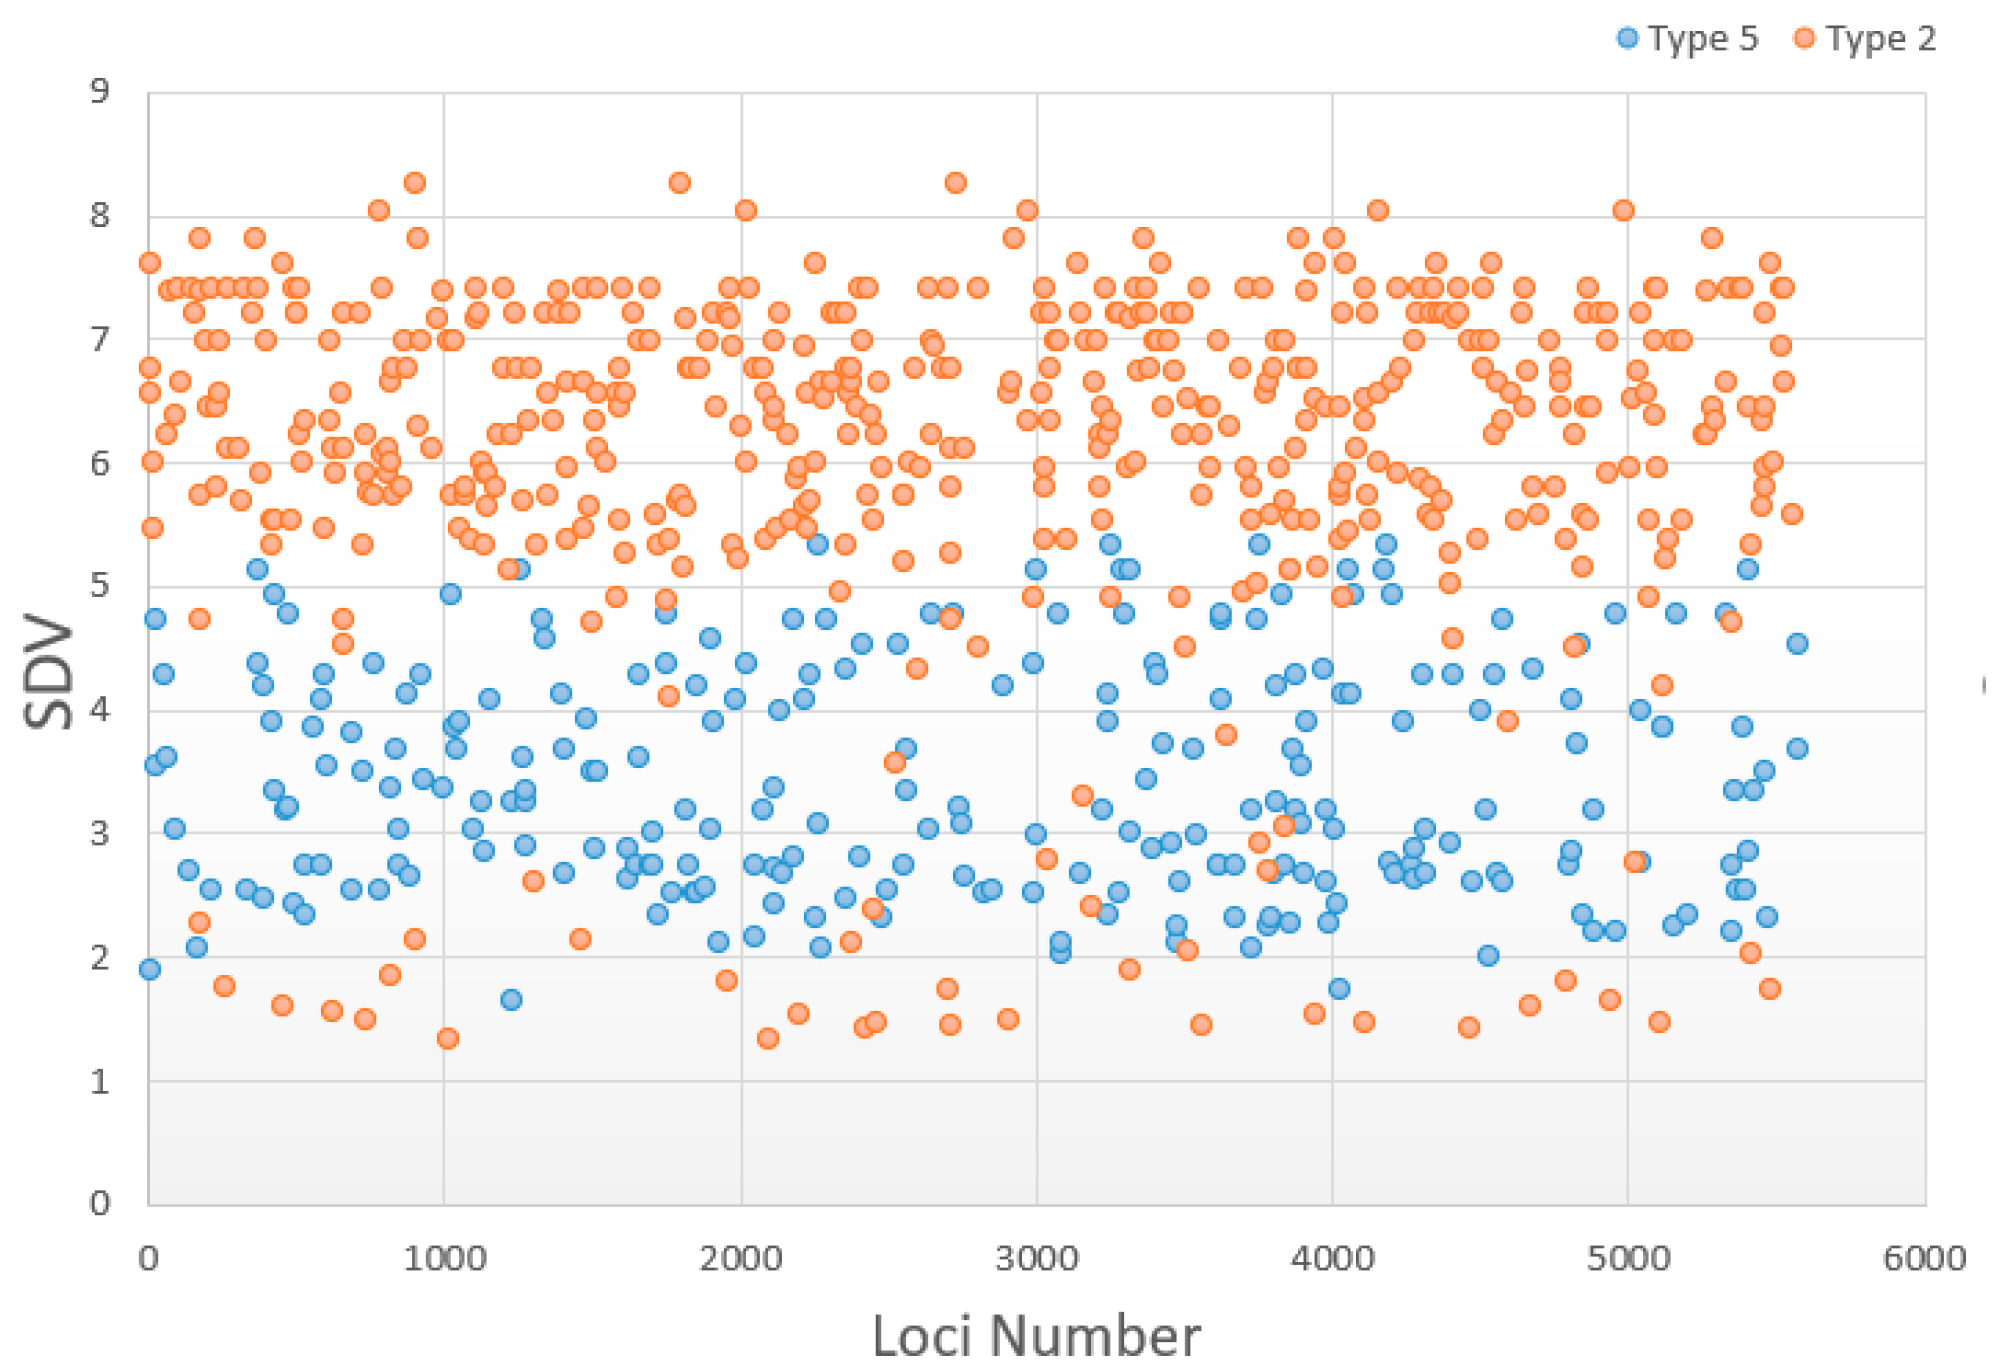
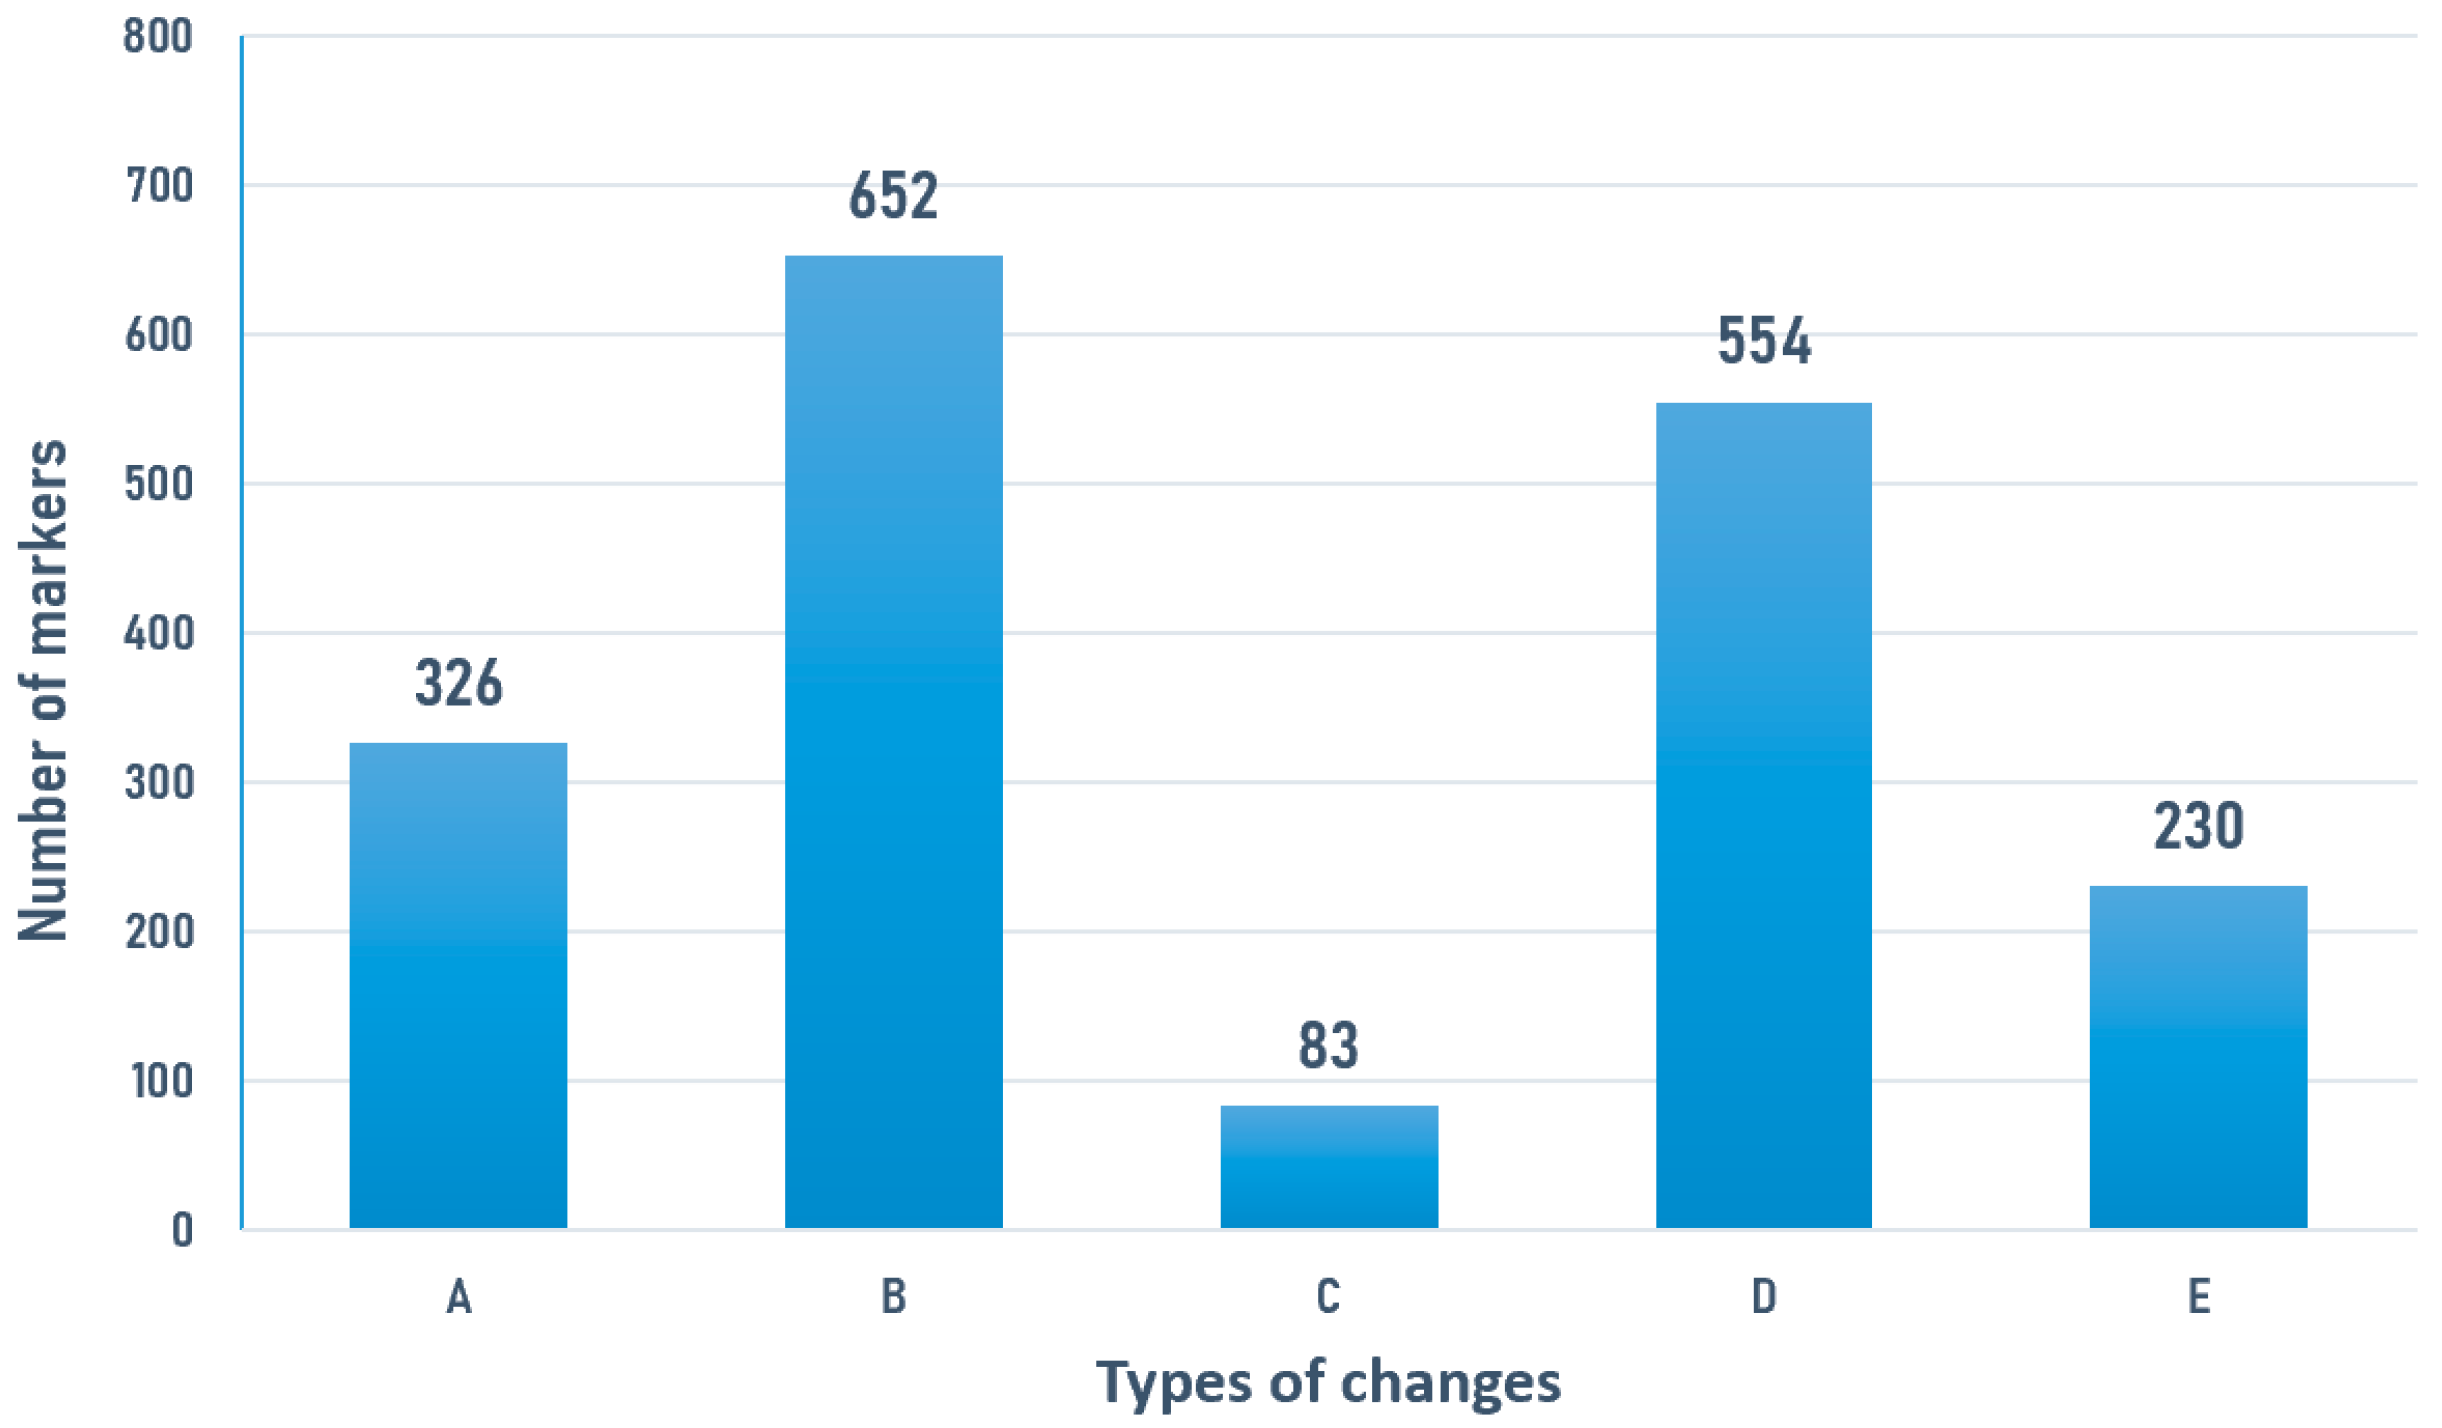
3.5. Change in Distorted Types
4. Discussion
5. Conclusions
Author Contributions
Funding
Data Availability Statement
Conflicts of Interest
References
- Bierne, N.; Beuzart, I.; Vonau, V.; Bonhomme, F.; Bédier, E. Microsatellite-associated heterosis in hatchery-propagated stocks of the shrimp Penaeus stylirostris. Aquaculture 2000, 184, 203–219. [Google Scholar] [CrossRef]
- Falconer, D.S. Introduction to quantitative genetics. Population 1962, 17, 1529. [Google Scholar] [CrossRef][Green Version]
- Keller, L.F. Inbreeding and its fitness effects in an insular population of song sparrows (Melospiza melodia). Evolution 1998, 52, 240–250. [Google Scholar] [CrossRef] [PubMed]
- Henter, H.J. Inbreeding depression and haplodiploidy: Experimental measures in a parasitoid and comparisons across diploid and haplodiploid insect taxa. Evolution 2003, 57, 1793–1803. [Google Scholar] [CrossRef] [PubMed]
- Haag, C.R.; Ebert, D. Genotypic selection in Daphnia populations consisting of inbred sibships. J. Evol. Biol. 2010, 20, 881–891. [Google Scholar] [CrossRef] [PubMed]
- Wright, S. Evolution and the Genetics of Populations; University of Chicago Press: Chicago, IL, USA, 1978; Volume 1. [Google Scholar] [CrossRef]
- Charlesworth, D.; Willis, J.H. The genetics of inbreeding depression. Nat. Rev. Genet. 2009, 10, 783–796. [Google Scholar] [CrossRef] [PubMed]
- Keller, L. Inbreeding effects in wild populations. Trends Ecol. Evol. 2002, 17, 230–241. [Google Scholar] [CrossRef]
- Moss, D.R.; Arce, S.M.; Otoshi, C.A.; Doyle, R.W.; Moss, S.M. Effects of inbreeding on survival and growth of Pacific white shrimp Penaeus (Litopenaeus) vannamei. Aquaculture 2007, 272 (Suppl. S36), S30–S37. [Google Scholar] [CrossRef]
- Hedgecock, D.; I Pudovkin, A. Sweepstakes Reproductive Success in Highly Fecund Marine Fish and Shellfish: A Review and Commentary. Bull. Mar. Sci. 2011, 87, 971–1002. [Google Scholar] [CrossRef]
- Wang, S.; Hard, J.J.; Utter, F. Salmonid inbreeding: A review. Rev. Fish Biol. Fish. 2002, 11, 301–319. [Google Scholar] [CrossRef]
- Bucklin, K.A. Analysis of the Genetic Basis of Inbreeding Depression in the Pacific Oyster Crassostrea Gigas. Ph.D. Thesis, University of California Davis, Davis, CA, USA, 2002; 140p. [Google Scholar]
- Evans, F.; Matson, S.; Brake, J.; Langdon, C. The effects of inbreeding on performance traits of adult Pacific oysters (Crassostrea gigas). Aquaculture 2004, 230, 89–98. [Google Scholar] [CrossRef]
- Keys, S.J.; Crocos, P.J.; Burridge, C.Y.; Coman, G.J.; Davis, G.P.; Preston, N.P. Comparative growth and survival of inbred and outbred Penaeus (Marsupenaeus) japonicus, reared under controlled environment conditions: Indications of inbreeding depression. Aquaculture 2004, 241, 151–168. [Google Scholar] [CrossRef]
- Luo, K.; Kong, J.; Luan, S.; Meng, X.-H.; Zhang, T.-S.; Wang, Q.-Y. Effect of inbreeding on survival, WSSV tolerance and growth at the postlarval stage of experimental full-sibling inbred populations of the Chinese shrimp Fenneropenaeus chinensis. Aquaculture 2014, 420–421, 32–37. [Google Scholar] [CrossRef]
- Ríos-Pérez, L.d.L.; Campos-Montes, G.R.; Martínez-Ortega, A.; Castillo-Juárez, H.; Montaldo, H.H. Inbreeding Effects on Body Weight at Harvest Size and Grow-out Survival Rate in a Genetic Selected Population of Pacific White Shrimp Penaeus (Litopenaeus) vannamei. J. World Aquac. Soc. 2015, 46, 53–60. [Google Scholar] [CrossRef]
- Wang, J.; Li, J.; Ge, Q.; Chen, Z.; Li, J. Effects of Inbreeding on Genetic Characteristic, Growth, Survival Rates, and Immune Responses of a New Inbred Line of Exopalaemon carinicauda. Int. J. Genom. 2020, 2020, 5735968. [Google Scholar] [CrossRef] [PubMed]
- Fu, Q.; Meng, X.; Luan, S.; Chen, B.; Cao, J.; Li, X.; Kong, J. Segregation distortion: High genetic load suggested by a Chinese shrimp family under high-intensity selection. Sci. Rep. 2020, 10, 21820. [Google Scholar] [CrossRef] [PubMed]
- Sui, J.; Luan, S.; Luo, K.; Meng, X.; Cao, B.; Liu, N.; Li, W.; Lu, X.; Chai, Z.; Kong, J. Genetic parameters and response to selection of harvest body weight of the Chinese shrimp Fenneropenaeus chinensis after five generations of multi-trait selection. Aquaculture 2015, 452, 134–141. [Google Scholar] [CrossRef]
- Wang, S.; Meyer, E.; McKay, J.K.; Matz, M.V. 2b-RAD: A simple and flexible method for genome-wide genotyping. Nat. Methods 2012, 9, 808–810. [Google Scholar] [CrossRef] [PubMed]
- Wang, S.; Liu, P.; Lv, J.; Li, Y.; Cheng, T.; Zhang, L.; Xia, Y.; Sun, H.; Hu, X.; Bao, Z. Serial sequencing of isolength RAD tags for cost-efficient genome-wide profiling of genetic and epigenetic variations. Nat. Protoc. 2016, 11, 2189–2200. [Google Scholar] [CrossRef]
- Jiao, W.; Fu, X.; Dou, J.; Li, H.; Su, H.; Mao, J.; Yu, Q.; Zhang, L.; Hu, X.; Huang, X.; et al. High-Resolution Linkage and Quantitative Trait Locus Mapping Aided by Genome Survey Sequencing: Building Up an Integrative Genomic Framework for a Bivalve Mollusc. DNA Res. 2014, 21, 85–101. [Google Scholar] [CrossRef]
- Catchen, J.; Hohenlohe, P.A.; Bassham, S.; Amores, A.; Cresko, W.A. Stacks: An analysis tool set for population genomics. Mol. Ecol. 2013, 22, 3124–3140. [Google Scholar] [CrossRef] [PubMed]
- Fu, X.; Dou, J.; Mao, J.; Su, H.; Jiao, W.; Zhang, L.; Hu, X.; Huang, X.; Wang, S.; Bao, Z. RADtyping: An Integrated Package for Accurate De Novo Codominant and Dominant RAD Genotyping in Mapping Populations. PLoS ONE 2013, 8, e79960. [Google Scholar] [CrossRef] [PubMed]
- Lorieux, M.; Perrier, X.; Goffinet, B.; Lanaud, C.; de León, D.G. Maximum-likelihood models for mapping genetic markers showing segregation distortion. 2. F2 populations. Theor. Appl. Genet. 1995, 90, 81–89. [Google Scholar] [CrossRef] [PubMed]
- Rousset, F. genepop’007: A complete re-implementation of the genepop software for Windows and Linux. Mol. Ecol. Resour. 2008, 8, 103–106. [Google Scholar] [CrossRef] [PubMed]
- Winemiller, K.O.; Rose, K.A.; Pedersen, E.J.; Goto, D.; Gaeta, J.W.; Hansen, G.J.; Sass, G.G.; Zanden, M.J.V.; Cichosz, T.A.; Rypel, A.L.; et al. Patterns of Life-History Diversification in North American Fishes: Implications for Population Regulation. Can. J. Fish. Aquat. Sci. 1992, 49, 2196–2218. [Google Scholar] [CrossRef]
- Hedgecock, D. Does variance in reproductive success limit effective population sizes of marine organisms. Genet. Evol. Aquat. Org. 1994, 122, 122–134. [Google Scholar]
- DeRose, M.A.; Roff, D.A. A comparison of inbreeding depression in life-history and morphological traits in animals. Evolution 1999, 53, 1288–1292. [Google Scholar] [CrossRef]
- Zheng, H.; Li, L.; Zhang, G. Inbreeding depression for fitness-related traits and purging the genetic load in the hermaphroditic bay scallop Argopecten irradians irradians (Mollusca: Bivalvia). Aquaculture 2012, 366–367, 27–33. [Google Scholar] [CrossRef]
- Meng, X.; Fu, Q.; Luan, S.; Luo, K.; Sui, J.; Kong, J. Genome survey and high-resolution genetic map provide valuable genetic resources for Fenneropenaeus chinensis. Sci. Rep. 2021, 11, 7533. [Google Scholar] [CrossRef]
- Plough, L.V.; Hedgecock, D. Quantitative Trait Locus Analysis of Stage-Specific Inbreeding Depression in the Pacific Oyster Crassostrea gigas. Genetics 2011, 189, 1473–1486. [Google Scholar] [CrossRef]
- Tian, M.; Li, Y.; Jing, J.; Mu, C.; Du, H.; Dou, J.; Mao, J.; Li, X.; Jiao, W.; Wang, Y.; et al. Construction of a High-Density Genetic Map and Quantitative Trait Locus Mapping in the Sea Cucumber Apostichopus japonicus. Sci. Rep. 2015, 5, 14852. [Google Scholar] [CrossRef]
- Yu, Y.; Zhang, X.; Yuan, J.; Li, F.; Chen, X.; Zhao, Y.; Huang, L.; Zheng, H.; Xiang, J. Genome survey and high-density genetic map construction provide genomic and genetic resources for the Pacific White Shrimp Litopenaeus vannamei. Sci. Rep. 2015, 5, 15612. [Google Scholar] [CrossRef] [PubMed]
- Lyttle, T.W. Segregation distorters. Annu. Rev. Genet. 1991, 25, 511–581. [Google Scholar] [CrossRef] [PubMed]
- Wilson, K.; Li, Y.; Whan, V.; Lehnert, S.; Byrne, K.; Moore, S.; Pongsomboon, S.; Tassanakajon, A.; Rosenberg, G.; Ballment, E.; et al. Genetic mapping of the black tiger shrimp Penaeus monodon with amplified fragment length polymorphism. Aquaculture 2002, 204, 297–309. [Google Scholar] [CrossRef]
- Li, Y.; Byrne, K.; Miggiano, E.; Whan, V.; Moore, S.; Keys, S.; Crocos, P.; Preston, N.; Lehnert, S. Genetic mapping of the kuruma prawn Penaeus japonicus using AFLP markers. Aquaculture 2003, 219, 143–156. [Google Scholar] [CrossRef]
- Smith, J.M.; Haigh, J. The hitch-hiking effect of a favourable gene. Genet. Res. 1974, 23, 23–35. [Google Scholar] [CrossRef] [PubMed]
- Harr, B.; Kauer, M.; Schlötterer, C. Hitchhiking mapping: A population-based fine-mapping strategy for adaptive mutations in Drosophilamelanogaster. Proc. Natl. Acad. Sci. USA 2002, 99, 12949–12954. [Google Scholar] [CrossRef] [PubMed]
- Wang, C.; Liu, B.; Chen, M.; Ning, J.; Lu, X.; Wang, C. Mutations in Growth-Related Genes Induced by EMS Treatment in Scallops. Front. Genet. 2022, 13, 879844. [Google Scholar] [CrossRef]
- Su, X.-L.; Zhao, S.-S.; Xu, W.-J.; Shuang, L.; Zheng, G.-D.; Zou, S.-M. Efficiently whole-genomic mutagenesis approach by ARTP in blunt snout bream (Megalobrama amblycephala). Aquaculture 2022, 555, 738241. [Google Scholar] [CrossRef]
- Wakeley, J. The excess of transitions among nucleotide substitutions: New methods of estimating transition bias underscore its significance. Trends Ecol. Evol. 1996, 11, 158–162. [Google Scholar] [CrossRef]
- Charlesworth, B.; Charlesworth, D. The genetic basis of inbreeding depression. Genet. Res. 2000, 74, 329–340. [Google Scholar] [CrossRef] [PubMed]
- Charlesworth, B.; Hughes, K.A. The maintenance of genetic variation in life-history traits. In Evolutionary Genetics: From Molecules to Morphology; Cambridge University Press: Cambridge, UK, 2000; pp. 369–392. [Google Scholar]


| Test Formulae | Test of Significance | ||
|---|---|---|---|
| × | √ | √ | |
| √ | √ | × | |
| Selection type | Zygotic | Zygotic | Gametic |
| Hatching Rates | Larval Survival in Z | Larval Survival in M | Larval Survival in P3 | Larval Survival in P10 | |
|---|---|---|---|---|---|
| Control families | 0.78 ± 0.07 a | 0.91 ± 0.04 a | 0.65 ± 0.08 a | 0.53 ± 0.09 a | 0.48 ± 0.08 a |
| Inbred families | 0.59 ± 0.14 b | 0.89 ± 0.06 a | 0.46 ± 0.12 b | 0.29 ± 0.14 b | 0.27 ± 0.13 b |
| Inbreeding depression | 24.36% | 2.20% | 29.23% | 45.28% | 43.75% |
| Developmental Stage | He | Ho | PIC | Ne | Pi |
|---|---|---|---|---|---|
| Zoea | 0.3641 | 0.4735 | 0.2935 | 1.6075 | 0.3703 |
| Post-larvae | 0.3826 | 0.5087 | 0.3060 | 1.6489 | 0.3886 |
| Marker | Type Specification | Number | Ratios of Distortion in Zoea | Ratios of Distortion in Post-Larvae |
|---|---|---|---|---|
| hk × hk | Biparental heterozygous | 5582 | 27.73% | 20.71% |
| lm × ll | Male heterozygous | 11,793 | 21.06% | 11.38% |
| nn × np | Female heterozygous | 12,060 | 26.84% | 10.67% |
| Total | 29,435 | 22.37% | 12.86% |
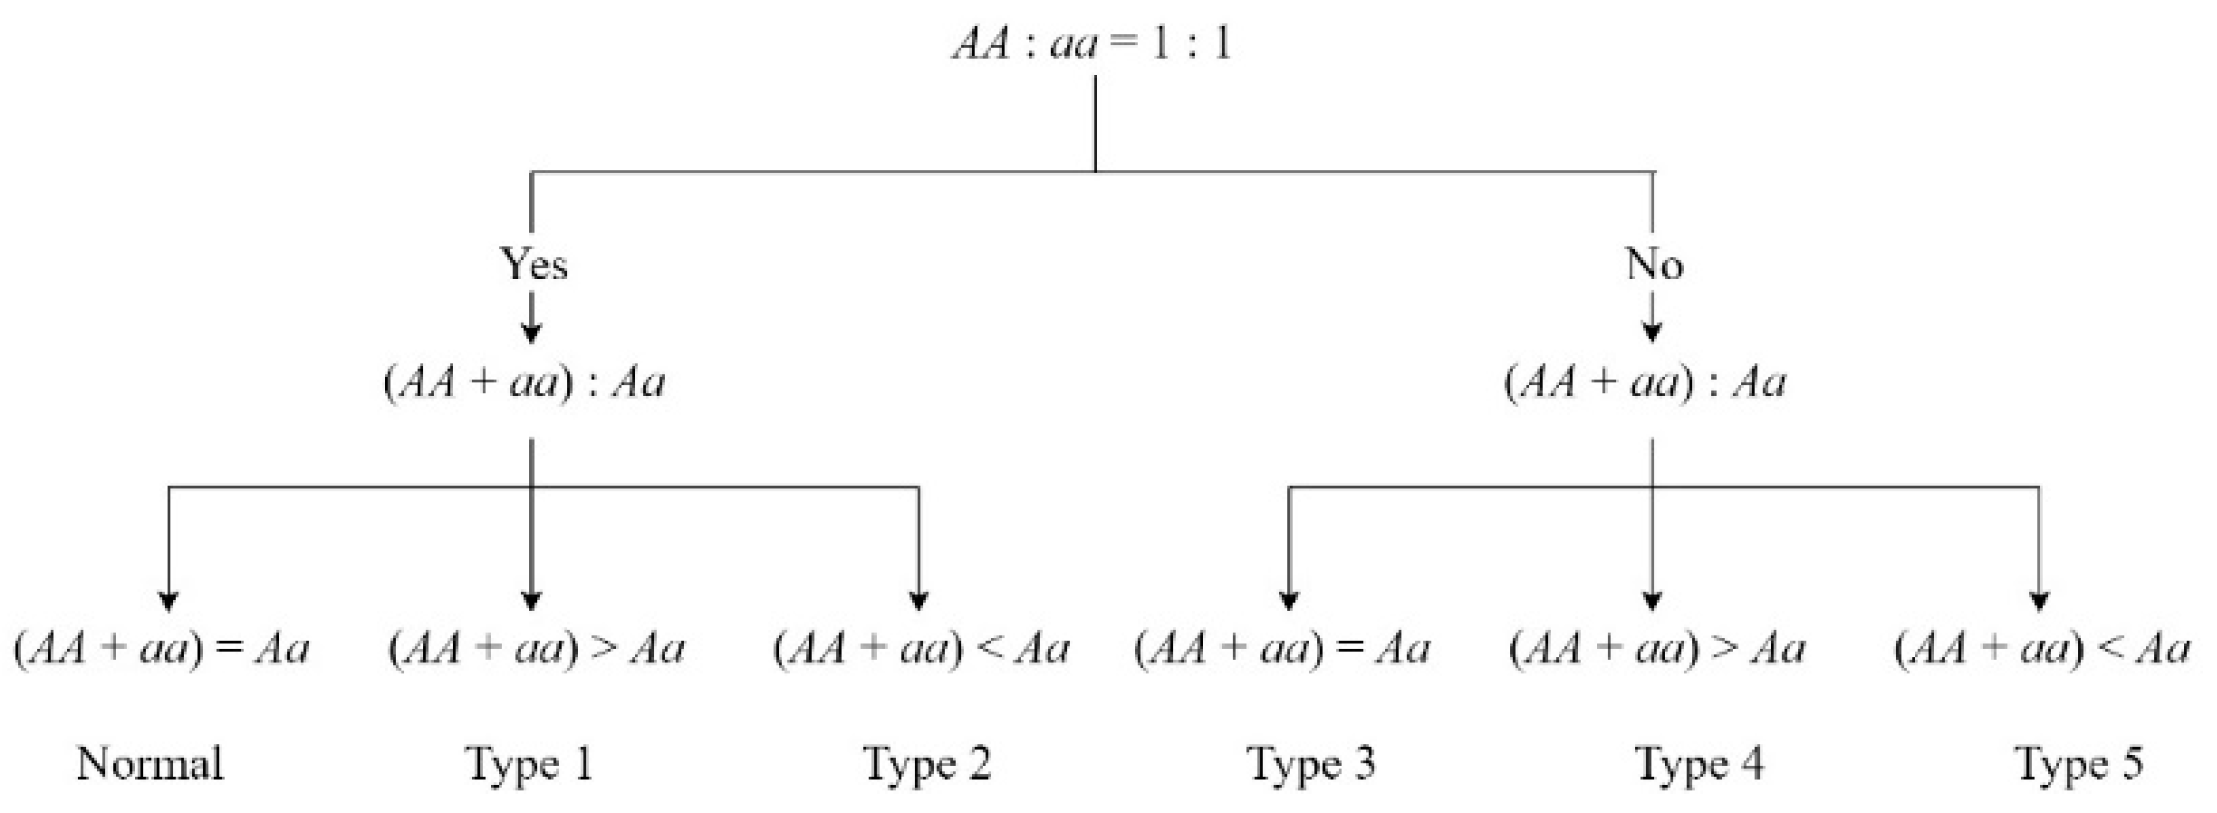
| Classification | Normal | Type 1 | Type 2 | Type 3 | Type 4 | Type 5 |
|---|---|---|---|---|---|---|
| Number in zoea | 3915 | 96 | 494 | 57 | 8 | 246 |
| Ratio in zoea | - | 10.65% | 54.83% | 6.33% | 0.89% | 27.30% |
| Number in post-larvae | 4349 | 38 | 554 | 49 | 1 | 230 |
| Ratio in post-larvae | - | 4.36% | 63.53% | 5.62% | 0.11% | 26.38% |
| Possible explanation | Mendelian segregation | Heterozygote deficiency | Heterozygote excess | Impact of partial recessive deleterious | Homozygous deficiency | |
| Type | Genotype under Elimination | Number/Ratio in Zoea | Number/Ratio in Post-Larvae |
|---|---|---|---|
| lm × ll | lm | 2339/94.16% | 1141/85.02% |
| ll | 145/5.84% | 201/14.98% | |
| nn × np | np | 2373/92.99% | 1090/84.69% |
| nn | 179/7.01% | 197/15.31% |
Disclaimer/Publisher’s Note: The statements, opinions and data contained in all publications are solely those of the individual author(s) and contributor(s) and not of MDPI and/or the editor(s). MDPI and/or the editor(s) disclaim responsibility for any injury to people or property resulting from any ideas, methods, instructions or products referred to in the content. |
© 2024 by the authors. Licensee MDPI, Basel, Switzerland. This article is an open access article distributed under the terms and conditions of the Creative Commons Attribution (CC BY) license (https://creativecommons.org/licenses/by/4.0/).
Share and Cite
Fu, Q.; Zhou, J.; Luan, S.; Dai, P.; Lyu, D.; Chen, B.; Luo, K.; Kong, J.; Meng, X. Analysis of Elimination Effects of Inbreeding on Genotype Frequency in Larval Stages of Chinese Shrimp. Biology 2024, 13, 268. https://doi.org/10.3390/biology13040268
Fu Q, Zhou J, Luan S, Dai P, Lyu D, Chen B, Luo K, Kong J, Meng X. Analysis of Elimination Effects of Inbreeding on Genotype Frequency in Larval Stages of Chinese Shrimp. Biology. 2024; 13(4):268. https://doi.org/10.3390/biology13040268
Chicago/Turabian StyleFu, Qiang, Jingxin Zhou, Sheng Luan, Ping Dai, Ding Lyu, Baolong Chen, Kun Luo, Jie Kong, and Xianhong Meng. 2024. "Analysis of Elimination Effects of Inbreeding on Genotype Frequency in Larval Stages of Chinese Shrimp" Biology 13, no. 4: 268. https://doi.org/10.3390/biology13040268
APA StyleFu, Q., Zhou, J., Luan, S., Dai, P., Lyu, D., Chen, B., Luo, K., Kong, J., & Meng, X. (2024). Analysis of Elimination Effects of Inbreeding on Genotype Frequency in Larval Stages of Chinese Shrimp. Biology, 13(4), 268. https://doi.org/10.3390/biology13040268