Abstract
China is striving to build a new dual-circulation development pattern with the aim of leading the coupling of science, technology, and innovation through the active role of financial factors, ultimately promoting the country’s optimal economic development. As a result, this paper constructs a coupled dual-circulation-STI (scientific and technological innovation) relationship model. The domestic and foreign components of the input–output relationship are used to portray the extent of the dual circulation, combined with Index DEA to measure the quality of science and technology innovation under the role of financial factors and the coupled coordination model to analyze the intrinsic correlation between the two. The study used an Index-DEA and value chain analysis model to measure each industry’s technological effectiveness and the degree of internal and external circulation, respectively. The coupled coordination model approach was used to measure the coordination relationship between the double-loop model and technological innovation. Based on the coordination assessment table, the degree of coupling and the natural state of science and technology innovation and dual cycle in each industry were assessed. The study found that the country’s dual-circulation pattern gradually strengthened from 2015–2019, with the financial element also driving an increase in STI. However, due to the twists and turns of the external environment, the coupling power of the dual-circulation STI weakened in some years. On this basis, the paper concludes that the quality of STI, driven by financial factors, has been increasing year on year, and the coupling with dual circulation has been trending upwards. Regarding policy implications, developing countries such as China should continue to invest more financially to create a healthy and sustainable innovation model. Through the innovation-dual-circulation development model, the country should eliminate the sloppy development model in construction and use the power of science and technology to lead social progress.
1. Introduction
In the context of the world’s unprecedented changes in the past century, the international system has been transformed and reshaped by the convergence of various systems, mechanisms, and institutions. As a result of the multi-dimensional elements of political multi-polarity, economic globalization, technological modernization, and diversity of thought, a new political, economic, social, cultural, and ecological landscape has emerged [1]. China is poised for a historical moment of significant development, based on a profound historical evolutionary trend and a hard-won extension of strategic opportunities. The milestone intersection of the century’s unprecedented changes and China’s remarkable development means that China must assume a leader’s role [2]. With a view to the new heights and depths of the human historical process, the government needs to form a distinctive and visionary judgment scheme for national development [3]. However, in the Western-dominated system of modernity, China has long been under the control of the “knowledge-rights” and “center-marginal” patterns [4], and its national image and development status are easily “othered”. The key to cracking the distortion of international perceptions, breaking the stranglehold of othering, and reversing the deviation of China’s image lies in the structural adjustment of China in open international cooperation and politics.
The open international cooperation and political system has shown evident declines and bottlenecks under the impact of epidemics and other “black swans”. However, behind this, there is more of a “semi-open” and “closed” cooperation motive led by developed countries. On the one hand, since the mid-1990s, developing countries represented by China have been gradually integrated into the global value chain activities with the industrial gradient shift of developed countries [5]. Based on marketing networks, international business channels, and other media, China’s development has gained strong “foreign” power to achieve the endogenous adjustment of the “Troika”. However, from a realistic point of view, the so-called “resources and capital” open transfer is only a way for developed countries to obtain low labor dividends and intercept the cost differential of production factors in core technology, key factors, and other areas that are still in a “closed to customers” state. On the other hand, under open system channels, economic development zones, export processing zones, and other “economic enclaves” have become foreign investment carriers in developed countries. However, this export-oriented model significantly squeezes the growth space of domestic firms [6]. Even monopolistic oligopoly produces entry barriers for nascent domestic firms, which affects the domestic market’s cultivation environment and is not conducive to the overall integration of domestic resources. With the impact of the export market, the domestic market is significantly more dependent on imported products. A continued decline in the “smile curve” at both ends of the face of developed countries, as well as technology and capital suppression from the side of the open system reflects the “closed” and “indifferent” nature of the system.
Against this background, accelerating the construction of a new development pattern with domestic-general-circulation and domestic-and-international-dual-circulation has emerged as China’s response to the development trend and a strategic decision to deal with the bottleneck of the open international cooperation and political system. As a model to support a new stage of high-level opening and high-quality development, dual circulation is not a “rejection” or “containment” of the open international cooperation and political system, but more an anti-driving approach that is taken because of the influence of the international system and power pattern. This approach refers to the overlap of internationalization headwinds with trade protection and economic and trade frictions, triggering a rethinking of China’s future development landscape. In the dual-circulation development pattern, China hopes to upgrade from a commodity and factor flow-based opening to a system-based opening [7] and eventually, through internal circulation, internal adjustment, and internal quality improvement, to lead China’s industries out of the “comparative advantage trap” [8]. In this process, the “new openness”, a dual-circulation development pattern, is promoted through institutionalized means such as domestic mechanism and system reform, regulation and governance system adjustment, business environment optimization, and factor market allocation [9]. The approach to achieving the new development pattern is to benchmark advanced international rules, establish rules and other forms of institutional openness, and make every effort to shape a circular governance model in which external opening and domestic reform, external demand, and domestic demand promote each other [10].
In general, the formation of the new pattern of dual-circulation is the “survival confusion” caused by the stagnation of the open international cooperation and political system, i.e., the low-end reluctance locking of industries and the lack of factor flow under the international-single-circulation [11]. Domestic-general-circulation has become the core of the strategy [12]. The new development pattern is based on the “opening up” of the domestic-general-circulation, guiding the entire domestic cycle of production, trade, and consumption to operate in an open environment. It also attracts multinational companies to transfer or retain high-quality industrial chains in China, share the Chinese market, tap its vast potential, and ultimately empower the domestic market’s supply quality. With the domestic market’s optimization, the second scenario of domestic-and-international-dual-circulation is subsequently triggered, breaking down the institutional barriers that link the internal and external circuits [13]. However, whether it is to avoid the disadvantages of international-single-circulation or create an autonomous development model of domestic-general-circulation, the key to improving the quality of the cycle is still technological innovation [14].
Against this background, accelerating the construction of a new development pattern with domestic-general-circulation and domestic-and-international-dual-circulation has emerged as China’s response to the development trend and a strategic decision to deal with the bottleneck of the open international cooperation and political system. As a model to support a new stage of high-level opening and high-quality development, dual circulation is not a “rejection” or “containment” of the open international cooperation and political system, but more an anti-driving approach because of the influence of the international system and power pattern. This approach refers to the overlap of internationalization headwinds with trade protection and economic and trade frictions, triggering a rethinking of China’s future development landscape. In the dual-circulation development pattern, China hopes to upgrade from a commodity and factor flow-based opening to a system-based opening [15] and eventually, through internal circulation, internal adjustment, and internal quality improvement, to lead China’s industries out of the “comparative advantage trap”. In this process, the “new openness”, a dual-circulation development pattern, is promoted through institutionalized means such as domestic mechanism and system reform, regulation and governance system adjustment, business environment optimization, and factor market allocation. The approach to achieving the new development pattern is to benchmark advanced international rules, establish rules and other forms of institutional openness, and make every effort to shape a circular governance model in which external opening and domestic reform, external demand, and domestic demand promote each other.
In general, the formation of the new pattern of dual-circulation is the “survival confusion” caused by the stagnation of the open international cooperation and political system, i.e., the low-end reluctance locking of industries and the lack of factor flow under the international-single-circulation. Domestic-general-circulation has become the core of the strategy [16]. The new development pattern is based on the “opening up” of the domestic-general-circulation, guiding the entire domestic cycle of production, trade, and consumption to operate in an open environment. It also attracts multinational companies to transfer or retain high-quality industrial chains in China, share the Chinese market, tap its vast potential, and ultimately empower the domestic market’s supply quality. With the domestic market’s optimization, the second scenario of domestic-and-international-dual-circulation is subsequently triggered, breaking down the institutional barriers that link the internal and external circuits [17]. However, whether it is to avoid the disadvantages of international-single-circulation or create an autonomous development model of domestic-general-circulation, the key to improving the quality of the cycle is still technological innovation [18].
Since the double cycle is the latest development policy in China, there is relatively little work related to its discussion. Li, as the representative of the academic school, mainly from a qualitative perspective, analyzes the significance of the contribution of the double-cycle strategy. Emphasis is placed on the driving force of the dual cycle for each industry and each place. Zhu and other scholars analyze the double-loop model from a quantitative perspective and consider its practical significance of the double-loop. Scholars mostly start with a particularly refined industry or region. This has led to the narrowness of the assessment of the dual-cycle strategy. From the existing studies, the concept of dual cycle is relatively new and lacks a complete and systematic research perspective. This study focuses on the necessity of building a new development pattern of double-loop and analyzes the impact of this pattern on reality and draws the need of the new pattern on innovation output. Considering the profound significance of the dual-cycle strategy, it highlights the intrinsic linkage between the new development pattern of the dual-cycle and the synergy of industries, identifies the linkage between the two sides, analyzes the changes in the development of both sides, and measures them. A solid analytical framework is constructed and explored to fill the gaps in the dual-cycle research.
By sorting out the background motivations, it is easy to see that China is trying its best to cater to the goal of high-quality development through the shaping of the dual-circulation model. However, the formation of the dual circulation needs to be driven by science and technology innovation. Therefore, it is necessary to analyze the two-way relationship between science and technology innovation and dual circulation as a complex system that is interconnected and to clarify the complex mechanisms involved. In the Chinese context, scholars emphasize that the complex linkage between the two stems from the need for sustainable national development: that is, China is undertaking green development goals, and the dual-circulation pattern is shaped to serve the flow of financial and capital factors for green development [19]. Through the extension of the internal and external circulation patterns, the various factors of production are iteratively renewed, inefficient operating mechanisms are eliminated [20], and the economy is driven to green and healthy development. China’s “technology-driven development” strategy is also essentially aimed at using advanced technologies to eliminate crude and polluting technologies and ultimately meet the needs of green construction [21]. From this perspective, dual-circulation and science and technology innovation share the same objectives and momentum, and both are realistic initiatives to serve China’s green development, and there is a significant coupling between the two in terms of connotation [22]. Based on a profound analysis of the connotation of the new pattern of dual-circulation and industrial science and technology innovation, this paper realizes the quantitative transformation of the two. It constructs the Index DEA-coupling coordination model to measure the coupling coordination degree between the new pattern of dual-circulation and science and technology innovation in 35 industries in China to explore. The aim is to explore the transformation path of the synergistic adjustment of industry science and technology under the new development pattern of dual circulation.
The main contributions of this study are: (1) the construction of a research model that is in line with China’s national conditions and meets the needs of China’s realistic green development, actively portraying the specific situation of the new development pattern of dual-circulation in each industry; (2) portraying the quality of science and technology innovation in each industry based on financial, capital, and financial elements; (3) effectively expanding the input–output research design, extending the available data through a predictive modeling approach and advancing the study to 2015–2019, thus covering the time points before and after the introduction of dual circulation, in order to ensure the validity of the study. Based on this research objective, this paper forms the organizational structure of the following research.
In the first part, the research design of building a new development pattern of a double cycle and industrial science and technology innovation is presented. The connotation of the double cycle and industrial science and technology innovation are analyzed. The connotation leads to clarifying the respective measurement ideas. Then, the research method is designed to match the research objectives. Index DEA measures the effectiveness results of industrial science and technology innovation. The model of structure industry cycle degree is measured through the industry production length through the world input–output table and general equilibrium research method. Finally, the coupled coupling coordination model is used to measure the degree of association and the coupling status of both.
In the second part, the empirical results are analyzed and discussed. First, each industry’s domestic and foreign circularity degrees are summarized, and the state of industrial circularity is analyzed. Secondly, the coupling degree of domestic and foreign circularity of each industry and the efficiency of science and technology innovation is analyzed to explain the circularity-innovation status of each industry. Finally, the coupling type of each industry is examined, and specific directions are indicated for its future development, cycle optimization, and innovation construction.
In the third part, conclusions and countermeasures are suggested. This section summarizes the forms of science and technology innovation construction under the new development pattern of China’s double cycle to provide a realistic basis for the optimized development of each industry.
2. Literature Review
Scholars mainly analyze dual-circulation and science and technology innovation in terms of connotation and portrayal methods. It is generally agreed that technological innovation is an effective force to complement the international single-cycle model: through autonomous technological innovation, filling the shortcomings of cutting-edge technologies, and breaking the scientific and technological blockade, countries master the primary discourse of the international cycle [23]. With the rising status of domestic circulation, the dual-circulation model effectively supports the construction of developing countries. Due to their historical position and transformation process, developing countries generally have a large base market and abundant factor resources [24]. In this model, innovation strategies lead to an innovation orientation that drives national resource allocation towards balanced economic development [25]. The shift from an international to a domestic cycle of interoperability, in which domestic products must replace foreign products and domestic technologies must replace foreign technologies, will undoubtedly also require an active role for science and technology innovation. Therefore, through the coupling between the two, science and technology innovation leads the establishment and operation of the double-loop model, and the double-loop model feeds science and technology innovation again through the extraction of external resources.
In studying science and technology innovation, researchers mostly start from the connotation and focus on innovation evaluation and development contribution. Xiao Renqiao and Ding Juan [26] measured the innovation efficiency of industrial enterprises in various provinces and cities using a super-efficient DEA model and used a spatial panel model to analyze the spatial spillover effects of green innovation efficiency. He et al. [27] analyzed the green development of manufacturing enterprises in the Pearl River Delta. They concluded that environmental regulations inhibit innovation performance at a certain level and that a balance should be struck between regulatory instruments and the investment efforts of innovation support policies. The improvement of green innovation power of enterprises and other micro-entities empowers the green development of industries and cities and promotes the achievement of high quality, high efficiency, and high level development in society [28]. However, some of the limitations of the above studies are that, for one, the driving mechanisms of financial, fiscal, and capital elements on STI outcomes are less considered; additionally, no coupled system mechanism study of STI has been designed.
In contrast, there has been less scholarly discussion due to the relatively recent introduction of dual circulation. Mainly, the quality of circularity is portrayed through evaluation instruments. Guo Aijun [29] measured and verified the level of circularity in China based on a Chinese-style decentralized system framework with a panel linkage equation and mediating effects model. Wu Chuanqing [30] used a super-efficient SBM model to measure the efficiency of economic cycles in the Yangtze River Economic Zone. The study found that over-intensifying resource inputs and undermining the coordination of the low-carbon cycle system may lead to an imbalance in the input–output ratio of the economic cycle [31]. The above studies provide a comprehensive analysis of the overall framework of the economic cycle. However, the cycle architecture is significantly spatially dependent, and ignoring its spatial relevance will not fully reveal the intrinsic relevance of the factor cycle to the spatial region [32]. In general, the studies mentioned above provide a good picture of the quality of the cycle, but they do not provide a complete explanation of the formation process of dual circulation in terms of its connotation. Therefore, it is necessary to find a quantitative model that can effectively measure the degree of circulation and is in line with the concept of circulation.
Furthermore, at the level of science and technology innovation, the solid technological advantage is the key to determining the quality and breakthrough of the double cycle. In the context of a knowledge-based economy, scientific and technological innovation capability has the role of leading social innovation and driving the development of the regional economy, and the rich talent resources, active innovation atmosphere, rapid flow of talents and knowledge and other characteristics establish the indispensable position of innovative power in the national factor cycle system [33]. International competition is increasingly reflected in the competition for strong technology and innovation, and the ability of scientific and technological progress to contribute to economic growth is growing, having surpassed the two traditional factors of production—namely, capital and labor [34]. Therefore, converting the power of science and technology innovation into the driving force of regional economic development is the key to transforming the development model and overcoming weak economic development in the context of the new economic normal, and it is also the top priority for China to pursue independent innovation and power. With the successful issuance of the State Council of the CPC Central Committee on deepening the reform of institutional mechanisms to accelerate the implementation of the innovation-driven development strategy, the General Office of the State Council is promoting reform initiatives related to supporting innovation and other essential documents on the innovation-driven promotion of industrial transformation and upgrading, and deepening the reform of the science and technology system to promote innovation development. Innovation is an efficient platform for cultivating innovative talents, creating and disseminating new technologies and knowledge, and is an essential cornerstone for improving science and technology and enhancing the national capacity for independent innovation [35]. It is also a pivotal force to guide the adequate flow of circulating factors.
In addition, a considerable number of scholars have focused on the curatorial attributes of science and technology innovation. Based on relevant research, Backhaus J [36] argues that relying on certain types of innovation resources with heterogeneous attributes can amplify the role of innovation in contributing to social progress, and along with the further categorization and heterogeneity of innovation resources, innovation achievements can penetrate various industrial fields and thus empower industries. With the development of the times, scholars have also examined the concept of innovation from different perspectives. For example, Rosenberg [37] proposed that innovation is a kind of advanced creative activity of human beings through the comparison of the concepts of innovation, creation, and invention and highlighted the characteristics of the “first creation” of innovation. According to Agasisti T [38], innovation has two meanings: one is to create new products, and the other is to introduce the created products into the enterprise production and management system or socio-economic system for the first time in a particular environment to obtain comprehensive benefits [39]. In fact, after the implementation of the innovation-driven development strategy, China has gradually attached importance to the source supply capacity of innovation-driven development, emphasizing the role of innovation in driving national productivity and focusing on enhancing the driving force of social growth under the source orientation of innovation. Furman J [40] proposed the critical elements of innovation curative power formation around the intersection of innovation and management, i.e., focusing on the combination of practices that gradually divest ineffective and non-marketable innovations, leading to sustainable, operational, and transformable realistic curative effects. At some level, STI itself is the “additive” of industry and development, and its coupling with the double cycle will determine the future quality of social development. Therefore, this paper explores the coupling mechanism between the double cycle and STI, which is conducive to optimizing the supply of innovation resources and promoting society to shape a new development model. Among them, the main findings and conclusions of the literature are shown in Table 1.

Table 1.
Core Research Findings.
3. Research Design
3.1. Dual-Circulation New Development Pattern and Quantitative Measurement of Industrial Science and Technology Innovation
Industrial science and technology innovation itself is an unstructured, multidimensional system of intertwined factors, so an objective evaluation based on a multidimensional indicator system can help obtain a more realistic picture of industrial science and technology innovation. The connotation of industrial science and technology innovation varies according to the industry’s orientation, nature, and tasks [41,42,43]. The STI financial factors, structure, and quality portray the overall STI of the industry. Combined with Table 2, it can be seen that STI financial elements, structure, and quality, as sub-dimensions of industrial STI, effectively support the competitiveness of each industry in the double-loop pattern. In particular, the financial elements of STI are essentially the supporting manifestations of science and technology finance. The realization of science and technology finance has been the critical external force behind the rapid development of science and technology in the 21st century. The combination of capital enables technological innovation to achieve large-scale development; the optimization of the structure of technological innovation helps to upgrade and transform the industrial development model, improve the efficiency of the use of internal resources, and adapt to the changes in the domestic and foreign development environment under the future double-cycle pattern; the improvement of the quality of technological innovation is the key driving force for the overall efficiency of the industry to advance, driving the construction of the new dual-circulation pattern to grow resiliently. As a result, this paper has formed an index system for evaluating the degree of industrial science and technology innovation, as shown in Table 2.
Table 2.
Industrial technology innovation degree evaluation index system.
Source: Drawn by the authors.
For the measurement of the dual-circulation development pattern, it is connoted as a new Marxian theory of social reproduction, where the original form of social reproduction consists of four small circulations of production, distribution, exchange, and consumption. In contrast, the dual-circulation development pattern forms two types of domestic and foreign circulation according to the circulation’s different fields. The domestic circulation is a circulation system that relies entirely on the domestic market and defines the four smaller circulations of production, distribution, exchange, and consumption as occurring within the country. In comparison, foreign circulation is a circulation system that relies on foreign markets and enables the four smaller circulations to interact abroad.
As shown in Figure 1, the mechanism of reproduction, regardless of the changes in distribution, exchange, and consumption, is essentially the process of circulation of the final product, which includes the process of circulation of raw materials and intermediate goods. Therefore, as far as the sources of production theory are concerned, the nature and changes in the final production domain can be characterized as the extent of domestic and foreign circulation.
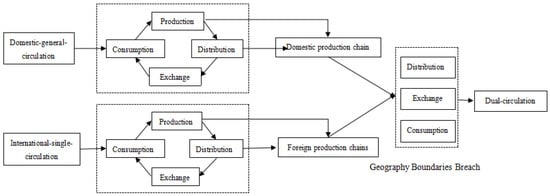
Figure 1.
Internal mechanism of the dual circulation.
3.2. Research Methodology
3.2.1. Index DEA
The industrial science and technology innovation system is a complex endogenous system, which is the final result of multiple factors based on a non-deterministic production function. Data envelopment analysis, as a non-parametric evaluation method based on multiple input and output data, is regarded as one of the optimal tools to solve the efficiency or evaluation results. In recent years, DEA has been widely used for portfolio efficiency evaluation, and traditional DEA and decentralized DEA are two common types of methods to solve this problem. The above two types of evaluation methods do not require assumptions about the effectiveness of the innovation environment, and they examine the variability of the scale factors. The relative evaluation is performed by combining each indicator of the factor combination. However, the input–output process derived from the above economic indicators has also been questioned by many scholars, who believe that these indicators cannot fully reflect the true input–output relationship of the portfolio. Therefore, in this paper, a new Index-DEA model is constructed based on the opportunity-constrained stochastic environment. On the one hand, this model considers the chance-constrained stochastic environment, and on the other hand, it strengthens the non-compensatory composite indicators and optimizes the intervention mechanism of weights. Combined with Cooper’s definition of randomly generated possible sets, the following stochastic sets are constructed.
Index-DEA is constructed and formed in this paper.
where α is the STI stochasticity, i.e., the probability that each element will generate an outcome or STI success. It can also be considered as the probability of allowing the violation of the chance constraint, and it is the decision unit efficiency value. Based on the random generation constraint, the weights of each element are generated naturally and conform to the most realistic element matching situation.
3.2.2. Industrial Production Length Measurement Model
Domestic value-added associated with global trade activities is related to the import and export of intermediate input products. The length of domestic value-added production is thus decomposed into domestic and foreign components, i.e., the length of domestic production (domestic circulation degree) and the length of foreign production (foreign circulation degree). Assuming that there are infinite stages of production, the domestic value-added resulting from the production of intermediate input products for export is:
where A is the matrix of input coefficients for each industry in each country based on the classical Leontief equation. Based on the local Leontief inverse matrix, this paper obtains AD and AF as the domestic input coefficient matrix and the import input coefficient matrix, respectively [40]. YD and YF are the end-use matrix for meeting domestic demand and the end-use matrix for meeting foreign demand (exports), respectively. is the diagonal matrix form of the value-added factor matrix V.
Using the length of domestic production at each stage of production as weights, domestic output induced by domestic value added can be obtained.
Thus, from Equations (2) and (3), the degree of domestic circulation is obtained as:
Similarly, domestic value added triggers foreign output as:
Thus, from Equations (2) and (5), the degree of foreign circulation is obtained as:
3.2.3. Coupling Coordination Model
Based on clarifying the connotation of the dual-circulation development pattern and the industrial science and technology innovation system, this paper uses the coupling coordination model of Duan [41] to precisely determine the coupling relationship between the dual-circulation development pattern and the industrial science and technology innovation system. The model is as follows.
C is the degree of system coordination relationship, based on the C value. It can initially determine the interrelationship between the dual-circulation development pattern and the industrial science and technology innovation system. U1 is the degree of domestic and foreign circulation of the dual-circulation development pattern. U2 is the degree of industrial science and technology innovation. Since both systems may have a low level of coupling, the degree of coordination relationship at this point is not sufficient to indicate the proper level of coupling between the two, so the adjustment model of Wang [42] is used to construct an optimal measurement model of system coupling. The formula for this is:
D is the coupling degree between the dual-circulation development pattern and the industrial science and technology innovation system, and T is the comprehensive evaluation index of the two systems. α and β are the coefficients of the comprehensive evaluation index, which satisfy the endogenous relationship of α + β = 1. Taking into account the mutually reinforcing and complementary roles of the dual-circulation development pattern and industrial science and technology innovation, the two are considered to be of equal importance, and α and β are taken to be 0.5, respectively. Through the measurement of the coupling coordination model, the final obtained coupling degree is quantified based on the uniform distribution function method, thus determining the coupling level between the dual-circulation development pattern and industrial science and technology innovation, and the judging criteria are shown in Table 3.
Table 3.
Judging criteria for the coupling of the dual-circulation development pattern and industrial science and technology innovation.
Among them, the coupling rubric in Table 4 is derived from an integrated analysis of coupled coordination models in academia. This level of division and normativity has been established. In this paper, we will strictly follow this judging structure to examine the intrinsic linkage between the industrial double cycle and science and technology innovation.
Table 4.
Domestic Circulation Degree by Industry in China, 2015–2019.
3.3. Data Collection
In this study, data from the world input–output tables are only integrated up to 2014. However, given the realistic timing of the proposed dual-circulation strategy and the rapidly growing size of China’s economy and distribution system, this study utilizes the trend extrapolation forecasting method. Using the data available up to 2014 and considering its development trends, the data are forecasted to fall further into the 2015–2019 range. The data are also used to analyze the dual-circulation situation under the new cycle in China. On the other hand, the yearbooks and other data materials have been temporarily updated to 2019. The main period of this study is thus set as 2015–2019. Of course, the sudden pandemic in 2020 also prevents the data projection of this study. The impact of the pandemic on international trade and global value chains has been enormous. It is likely to trigger significant data changes. The significance of the follow-up calculation is, therefore, more limited. Summing up all the above factors, we start a positive and correct study from 2015–2019. In the DEA calculation, we substitute the annual cross-sectional data separately. The final summary forms the efficiency of each province in each year.
4. Empirical Analysis
4.1. Domestic and Foreign Circulation Degree Analysis
Using the import–export trade relationship from the World Input-Output Database (WIOD), this paper analyses the scale of production–trade–final consumption in the domestic market. Based on Equations (2)–(6), this paper measures each industrial sector’s domestic and foreign circulation degrees in China from 2015–2019, as shown in Table 4 and Table 5. Our data come from the China Industry Yearbook. World input–output data are derived from international databases and their forecast sections.
Table 5.
China’s foreign circulation degree by industry, 2015–2019.
Source: Calculated by the authors.
As shown in Table 4, the degree of domestic recycling in China varies in a gradient across industries. The mean value of domestic circularity in the primary industry, with agriculture, hunting, forestry, and fishery as the core, is 2.419, indicating that agricultural products need to go through about 2.419 internal circular links in the process of domestic production and consumption, and the scale of domestic intermediate inputs is significantly larger. Moreover, compared to Liu’s portrayal of the 2008–2014 data period, the dual circulation enters a new circle that strengthens the domestic circularity force. The mean value of domestic circularity in the secondary sector, including food, textile, leather, wood, and construction, is 2.996, which is significantly more substantial than in the primary sector. Among them, the average value of domestic circularity for primary manufacturing industries such as industrial raw materials (textiles, leather, wood, pulp, coke, chemicals, rubber, and non-metallic minerals) was 2.854, which is slightly lower than the average value of domestic circularity for industries. This feeds back into the essential attributes of China’s resource power, with more pronounced redundancy and misallocation of resources in resource-driven industries. The average value of domestic circularity for important manufacturing industries such as industrial products (primary metals, machinery and electrical, optical equipment) was 2.669, which is 10.91% lower than the average value of domestic circularity for secondary industries and 6.48% lower than that of primary manufacturing industries, indicating that China’s crucial manufacturing industries are still relatively weak. This indicates that the shortcomings of China’s manufacturing circularity still exist, and the domestic fluency is not high. The lack of more technology matching channels limits the development of circularity in this area, making the overall quality of the manufacturing sector unevenly graded. The domestic circularity of pillar manufacturing industries such as transport and energy (electricity, gas, and water supply), on the other hand, is relatively outstanding, with an average value of 3.894, which is 23.06 percentage points above the manufacturing average. These industries are undeniably the mainstays of the domestic economy, and their grander scale of input and output allows them to participate actively in the domestic cycle, thus presenting a positive image of their role. The increased participation in the energy supply cycle also means that the country’s economic performance is active and robust.
The average value of domestic circulation in the tertiary sector was 2.311, indicating that the internal circulation of intangible goods takes about 2.311 steps, significantly lower than that of the secondary sector. However, retail and commerce have a mean domestic circulation of 3.82, much higher than other sectors, indicating that China’s efforts to expand domestic demand are increasingly successful. The increase in commercial activity as a high or low output of product terminals implies the active participation of the production sectors in all Chinese industries. The boom in the commodity sector has also led to an increase in the consumer’s ability to absorb economic activity, which feeds back into production and manufacturing activities from downstream of the industry to incentivize efficient performance by producers. The domestic circularity of national public safety industries such as social security and health is only 1.106, indicating that government-led industries are risk-averse in terms of multiple circularities and hoping to enhance public service output through stable and precise public management.
Table 5 portrays the foreign circulation in China by industry structure. Combined with Table 4, it can be seen that China’s foreign circulation is significantly lower than its domestic circulation. There are three reasons for this: first, China’s emphasis on autonomous development allows it to get rid of its dependence on foreign industries through the continued expansion of the domestic cycle; secondly, China is still in a developing stage, and the exclusion of foreign industrial and value chains is still evident, making it difficult for China to participate in them; thirdly, the technological level of some Chinese industries is insufficient, and the utility of resources is low, making it difficult for China to participate in the international circuit.
Specifically, although the average value of the industry’s foreign circularity is only 0.484, representing only 18.285% of the domestic circularity, it mainly occupies advanced or critical industries. Electrical and optical equipment, electricity, gas and water, wholesale economy, and inland transport have an industrial circularity of 0.8 or more, indicating a high degree of foreign capital or factor involvement in these industries. Moreover, some product processing links even originate from foreign scenes. This is highly likely to lead to industrial lifelines being controlled by other countries. Among them, the average value of the foreign circulation degree of our wholesale trade and commerce is as high as 0.831, which means that the core of our tertiary industry is equally dependent on the supply and processing of foreign products. The lack of products and weak processing capacity of the commodity industry is limiting the quality development of our country, and over time, our tertiary industry is facing the unfavorable situation of weak consumption and suppressed domestic demand.
4.2. Analysis of the Degree of Coupling between the a Dual-Circulation Development Pattern and Industrial Science and Technology Innovation
Using the coupling coordination model, through Equations (7) and (8), this paper sought to obtain the coupling degree between the dual-circulation development pattern and industrial science and technology innovation, and the results are shown in Table 6 and Table 7.
Table 6.
Coupling of domestic circulation degree and industrial science and technology innovation degree by industry in China, 2015–2019.
Table 7.
Coupling of foreign circulation degree and industrial science and technology innovation by industry in China, 2015–2019.
Source: Calculated by the authors.
As seen in Table 6, the coupling between domestic circulation and STI is slightly lower in China’s industries in 2015–2019, and most of them are within the mild dissonance and adaptation zone. However, some industries are close to 0, verifying the dysfunctional problem. The above industries are mainly concentrated in the tertiary industry, which indicates that the coupling between STI and domestic circulation in China presents an unbalanced coupling, and the overall quality is still insufficient.
Regarding the industry dimension, (i) the coupling between the domestic circulation and STI in the primary sector is fair, with an average annual coupling of 0.354, at a mildly dislocated level. This is mainly because, since 2015, China has further strengthened the Agricultural Science and Technology Development Plan (2006–2020). However, due to the restructuring of agriculture, some cutting-edge technologies have entered a period of delayed research. Around this, China has further proposed a rural revitalization strategy, hoping to lead development through the innovation of technological power. Therefore, this dislocation is short-lived and is a necessary part of the industrial transformation. In addition, China’s status as a major agricultural country remains unchanged, and, except for some agricultural industries that are dependent on imports, there is a long-standing trend towards an internal agricultural circulation. In this process, the strengthening of the internal circulation trend has effectively stimulated the kinetic energy of agricultural and rural subjects and fostered the leading force of agricultural and rural development, combined with the optimizing role of science and technology innovation for agricultural business subjects, the relationship between which needs to be further sorted out.
The average value of coupling in the secondary sector is 0.3 to 0.512, at the stage of mild dissonance and prior coordination. The scale of China’s manufacturing sector has proliferated, and the quality and length of the internal circulation have increased significantly. However, the rate of scale expansion of STI is significantly insufficient. This has led to a slight disconnect in the coupling of the two. Furthermore, the lack of momentum in cutting-edge manufacturing technology, the apparent lack of promotion of financial factors, and the formation of virtual industries such as the external ‘meta-universe’ have left the manufacturing industry system outside of science and technology innovation and internal circulation. It is undeniable that China’s manufacturing industry has long been at a disadvantage in the global division of value labor, yet it is the pillar industry of the domestic economic cycle system. The former means that the industry cannot part with the vast foreign market and is caught in the quagmire of low-end technology locking; the latter is at a disadvantage in the competition with foreign products due to the lack of core technology. It can be seen that, contrary to the domestic circularity, the average value of the coupling degree of pillar manufacturing industries such as transportation and recycling reaches 0.410. The average value of the coupling degree of important manufacturing industries such as industrial products is 0.741. Moreover, the average value of the coupling degree of primary manufacturing industries such as industrial raw materials is 0.648. These three show an inverted gradient change, indicating that China has focused on the problem of insufficient domestic circularity and effectively promoted the in-depth science and technology innovation strategy and has focused on tackling technically tricky areas.
The tertiary sector has a coupling degree in the range of 0.496, with a sizeable overall span. In recent years, China has been committed to innovation and change in the public sector, but due to its unique and secure nature, its internal circulation links have been inhibited, leading to a low degree of coupling and a state of dissonance. With the steady rise in domestic demand, the innovative adjustment of business models and service ideas, and the introduction of innovative industries, the coupling between the inner circle of the tertiary sector and science and technology innovation is set to rise again.
As shown in Table 7, China’s foreign circulation and industrial science and technology innovation coupling maintain a neutral coupling state, with an average annual coupling value of 0.339, which is in a mildly dislocated state. However, the average value of the coupling degree of the secondary industry reaches above 0.45, which is the highest value for each industry in the whole foreign circulation system. Furthermore, considering that the foreign circulation degree is generally much lower than the domestic, our manufacturing technology is more seriously dependent on foreign countries. The expansion of foreign circularity is led by advanced technology to meet the needs of domestic manufacturing. This means that China’s homogeneous coupling of industrial technology and foreign cycles is a reluctant move due to technological and developmental pressures. The fluctuations within the tertiary industry remain high, and the average value of industrial coupling also remains at around 0.2, in a state of moderate dissonance, with a poor overall coupling level. Overall, the level of science and technology innovation in China’s industries and foreign circularity required to maintain the same coupling changes and critical core technology research closely follow the changes in the international situation of the industry. China should, through the acceleration of science and technology innovation, smooth the docking channel between science and technology, finance and real industry and advanced foreign technology, open up the foreign circulation in all aspects of production, distribution, exchange, and consumption, and avoid the unfavorable risk of over-reliance on foreign technology and falling behind in science and technology innovation.
4.3. Analysis of the Type of Coupling between the a Dual-Circulation Development Pattern and Industrial Science and Technology Innovation
The domestic and foreign circulation degrees of each industry are standardized and, considering that there should be a difference between the circularity degree and the science and technology innovation degree of each industry (ΔU = 0, ΔU = U1 − U2), this paper further classifies the coupling degree of science and technology innovation of industries in the dual-circulation development pattern into three significant types (Zhu et al., 2019). When ΔU > 0.255, the industry shows a circulation overtaking state (S, i.e., STI lagging state). When ΔU is in the interval of [0.155, 0.255], the industry is in a synergy state (T, i.e., STI stable state). When ΔU < 0.155, the industry enters a circulation lag state (F, i.e., STI frontier state). The final calculation results are shown in Table 8 and Table 9.
Table 8.
Type of coupling between domestic circulation degree and industrial STI in China by industry in major years.
Table 9.
Type of coupling between the foreign circularity degree and the industrial science degree and technology innovation in Chinese industries in major years.
Source: Calculated by the authors.
As seen in Table 8, the domestic circulation-STI in China in the significant years showed an F-shaped coupling, with the apparent STI leading the domestic circulation. This is a positive pattern of STI, i.e., STI has effectively promoted the completion of the domestic circulation pattern. The coupling pattern varies widely across modes within industries, but most industries show less cross-sectional variation across years. The coupling pattern between the double-loop model and STI is relatively fixed, with less cross-sectional variation over the years, showing only fluctuating changes in the strength of the coupling within the same morphological framework. Vertically, there are few relatively stable coupling intermediate states (T), mostly showing coupling trends that are too extreme. Among the primary industries, agriculture develops rapidly. The absolute value of coupling gradually expands, indicating that the coupling equilibrium between agriculture and science and technology innovation is gradually broken, and the supreme power of science and technology innovation is gradually presented. In the secondary industry, primary manufacturing industries show a cyclical over-advancement state (S), i.e., the penetration of science and technology innovation into the upstream of the industry and the supply chain is limited, and efficient resource allocation and a strong science and technology innovation system still need to be further explored. Industrial products and other critical manufacturing industries, on the other hand, show an excellent frontier state of science and technology innovation (F), and the radiation of science and technology innovation to the domestic circulation has increased. The gap between the two has increased significantly in innovation power and vitality pull. Pillar manufacturing industries such as transport and energy also show an F-state coupling, but the strength of the coupling gradually decays with time, shifting towards the reverse state (S). On the other hand, the tertiary sector shows a non-equilibrium state with alternating F-states and S-states, with large fluctuations between and within industries across years.
As shown in Table 9, China’s industrial foreign circulation and science and technology innovation present an F and S type cross-coupling state, i.e., there is no positive co-directional coupling. Instead, the absolute leading state in which the circulation or STI overtakes is dominant. The shift of the primary industry from the F-state of the domestic cycle to the S-state indicates that the scale of China’s demand for foreign agricultural products is still significant, and this gap cannot be bridged by science and technology innovation in the short term. More than 50% of the primary manufacturing industries have shifted to the S-state in the secondary sector, and the tendency of foreign recycling in industries such as chemicals and coke has intensified. The support of science and technology innovation has weakened significantly, which further supports the gap between China’s advanced manufacturing industries and the world’s advanced level: the characteristics of China’s manufacturing industries as large but not strong have not changed, and there is a development gap in terms of independent innovation capacity and quality and efficiency. Except for the public service sector, which is under the control of the government, the rest of the tertiary sub-sectors are in a state of fluctuation and change. As new industries and new business models emerge, China’s service industries’ core model and strategic thinking need to be strengthened. The integration of innovative technologies and service paths has become the focus of industrial adjustment under the new double-circulation development pattern. On the whole, China’s industries are at a disadvantage in foreign circulation, the influence of scientific and technological innovation is minimal, and the extension and consolidation of innovative power are urgent.
5. Academic and Management Implications
Of course, there are certain research limitations in this paper. On the one hand, the research object is mainly based on extensive industrial categories, and some specific industries are not portrayed. On the other hand, the assessment of STI can be further optimized and the discussion of the coupling relationship between the two extended from the perspective of green development.
5.1. Academic Implications
This study enriches the endogenous theory of the new development pattern of the double cycle and science and technology innovation. Based on the research results, this paper proposes the following theoretical implications.
- (1)
- As an essential practice field of the new national economic model, the new dual-cycle development lacks a unified theoretical foundation in terms of origin, appearance, and connotation, and its portrayal process also lacks theoretical interpretation. In this paper, we analyze and propose the connotation of the link between the double cycle and the length of production in general equilibrium. It also identifies the internal and external circularity of the new development pattern of double-loop, which enriches the existing research in the field of double-loop and provides a theoretical reference for guiding local governments to focus on the construction of double-loop.
- (2)
- This paper proposes a more objective and quantitative evaluation system for the core connotation of industrial science and technology innovation. With the help of the improved Index DEA model, the degree of industrial science and technology innovation is fully portrayed, and the theoretical research on its evaluation and measurement is extended.
- (3)
- The verification idea and judgment method of coupling a double cycle and science and technology innovation are given. It also enriches the theoretical research on the type of coupling and provides the theoretical basis for industries to guide their behavior and strengthen the practice of science and technology effectiveness. This is accomplished through the formation of the analytical framework of science and technology innovation double cycle to help industry and government recognize the leading cooperation framework and synergy mode of science and technology innovation.
5.2. Management Insights
The government and industry should recognize the mechanism of the role of science and technology innovation on the double cycle. The primary conditions vary among industries, and the momentum brought by STI also differs. They should not blindly expand investment in science and technology innovation and stimulate the formation of a new model of a double cycle. There is an endogenous coupling relationship between the two. Therefore, from the management point of view, the main optimization strategies include: First, accelerating the optimization of market mechanisms. The economy and the science and innovation system are further opened internally. The accelerated cycle of domestic demand depends on more efficient and rapid allocation of scientific and technological resources, which requires further reducing the share of state-owned enterprises (both financial and non-financial) in the national economy and correspondingly increasing the share of more dynamic small, medium, and micro private enterprises, giving them a stronger market position and enabling them to enter more industrial fields, including monopolistic ones. Second, further improve the circulation system of commodities and production factors, break down regional, industrial, and hierarchical barriers in various fields such as technical talents, capital, land, scientific and technological goods and services, and form a unified, competitive, orderly, and open market circulation system. Third, accelerate the upgrading of the industrial structure. At present, China’s economy, and even the global economy, is in a critical point of industrial upgrading—namely, the information revolution or the outbreak of the fourth industrial revolution moment. China is already in the lead in this revolution and will accelerate the transformation to a piece of information or intelligent society in the future. This transformation has given rise to intelligent consumption and intelligent investment, which has given rise to and transformed a series of new industries and products. The derivatives include new electronic materials, electronic components, information equipment manufacturing, information infrastructure, intelligent machines, information facilities, and a series of information products. The transformation is “Internet+”, “Internet of Things,” and “Artificial Intelligence+”. That is, industries and products are transformed with the technologies and platforms of the Internet, Internet of Things, and artificial intelligence. Accelerating this transformation, that is, accelerating the upgrade of industrial structure to the direction of information technology and intelligence, will undoubtedly accelerate this cycle. Combined with the conclusion of this article’s analysis, the coupling of various industry cycles with technology is precisely the deep integration of this wisdom revolution technology. The superposition of new technology products fully reveals the effectiveness of scientific and technological innovation. In the final double-cycle model, it is necessary to drive the flow of elements.
6. Conclusions and Suggestions
Based on the Index DEA and coupling coordination model analysis, combined with the construction of a dual-circulation measurement model, this paper clarifies the coupling relationship between the dual-circulation development pattern and industrial science and technology innovation. This study finds that:
- (1)
- The quality of our domestic and foreign circulation is slightly better, but the pattern of domestic circulation dominance is excellent. Both dual-circulation lengths show a steady increase with the dual-circulation pattern proposed for 2015–2019. However, some industrial circulation is weaker, and the trend of industrial stratification is apparent.
- (2)
- All industries are coupled with science and technology innovation, but the direction and degree of coupling vary considerably. One of the critical technology industries is more dependent on foreign technology, and the domestic circulation requires more innovative technology and requires the financial element to expand the quality of innovation.
- (3)
- Compared to other developing countries, China has more effectively coupled science and technology innovation and the dual-circulation development model. The domestic circular structure cultivates autonomy and retains circular independence for industries with high technological claims; in the foreign circular structure, it actively extends the primary production chain and exposes part of the independent circular chain to the global value chain in order to obtain the right to participate and have a voice in global economic activities. Other countries such as India have faced difficulties in forming an utterly circular system due to the lack of complete industrial sectors, and therefore the double circular pattern is difficult to establish.
In view of this, the following recommendations are made in this paper.
- (1)
- Give local governments greater fiscal and taxation authority to expand their dual-circle dynamics. Optimize industrial management mechanisms, attach importance to the coordination of fiscal policies with other policies, revitalize asset efforts through fiscal restructuring, and activate the establishment of the dual-circulation model and the enhancement of science, technology, and innovation governance with the practical extension of fiscal support. Apply policies in different regions and precisely match the funding gap to construct the dual circulation and science, technology, and innovation to avoid industries facing significant debt risks in fiscal turnover.
- (2)
- By highlighting the dominant role of the internal circulation and leveraging the complementary power of the external circulation, we can achieve a greater connection between domestic and international markets. The cutting-edge technologies that have been developed or overcome are already profoundly imprinted in the industrial practices of various countries, but capturing technologies that have not yet been developed or discovering future industrial trends is the lifeblood of the future international environment and sustainable competitive advantage.
- (3)
- Accelerate the construction of an industrial-political, administrative, geographical, and economic-spatial interaction system conducive to coordinated development, promote the formation and improvement of a policy system for the free flow of factors, and lead the positive and high-quality development of the dual-circulation model through a division of labor pattern in which the advantages of science and technology innovation are complementary. Strengthen the support of factors, crack the problem of resources and growth potential limitations, and truly achieve the deep integration of science and technology innovation and industrial circulation.
Author Contributions
Conceptualization, S.L. and S.Z.; writing—original draft preparation, H.L.; writing—review and editing, S.Z. All authors have read and agreed to the published version of the manuscript.
Funding
This research was funded by Program of Shanghai Planning Office of Philosophy and Social Science of China (No. 2020BGL023).
Institutional Review Board Statement
Not applicable.
Informed Consent Statement
Not applicable.
Data Availability Statement
Not applicable.
Conflicts of Interest
The authors declare no conflict of interest.
References
- Liu, H.; Yao, P.; Wang, X.; Huang, J.; Yu, L. Research on the peer behavior of local government green governance based on seci expansion model. Land 2021, 10, 472. [Google Scholar] [CrossRef]
- Wang, H.; Chen, Z.; Wu, X.; Niea, X. Can a carbon trading system promote the transformation of a low-carbon economy under the framework of the porter hypothesis?—Empirical analysis based on the psm-did method. Energy Policy 2019, 129, 930–938. [Google Scholar] [CrossRef]
- Liu, H.; Zhang, J.; Zhang, X. China’s carbon emission responsibility and image from the perspective of global supply chain. Resour. Sci. 2021, 43, 652–668. [Google Scholar]
- Wang, M.; Feng, H. The Idea of a Community with a Shared Future for Mankind and the Shaping of the National Image. Youth J. 2019, 27, 30–31. [Google Scholar]
- Li, F. Dual Circulations of Domestic and International Economy: Theoretical Framework and Chinese Practice. J. Financ. Econ. 2021, 47, 4–18. [Google Scholar]
- Xia, X.; He, C. Spatial-Temporal Evolution of China’s Export-Oriented Foreign-Funded Enterprises’ Products from the Perspective of Trade Protection. Econ. Geogr. 2019, 39, 109–117. [Google Scholar]
- Li, H.; Niu, Z.; Zou, Z. The New Development Pattern of Dual Circulation and the Growth Efficiency of China’s Manufacturing Industry: An Analysis Based on Global Value Chain. Res. Financ. Econ. Issues 2021, 3, 38–48. [Google Scholar]
- Ge, Y.; Yin, Z. A Theoretical Analysis of my country’s Construction of “Double Cycle” New Development Pattern. Econ. Probl. 2021, 4, 1–6. [Google Scholar]
- Wang, Z.; Zhang, H.; Huang, B. Effective Governance Perspective: Building a Green, Low-Carbon, Cyclic Economic System in Modern Cities—A Study Based on Shenzhen Practice and Government-Enterprise Research. Contemp. Econ. Manag. 2021, 43, 63–71. [Google Scholar]
- Han, Y.; Yin, Z. Random thoughts on the development of China’s offshore trade and some policy advice. J. Int. Econ. Coop. 2021, 2, 22–28. [Google Scholar]
- Ren, J.; Huang, M. A Summary of Studies on “Double Cycle” New Development Pattern. Econ. Probl. 2021, 4, 7–15. [Google Scholar]
- Sun, J. Understanding of the ‘double circulation’ between international and domestic. Nankai J. Philos. Lit. Soc. Sci. Ed. 2021, 1, 21–22. [Google Scholar]
- Ma, F.; Li, J. A study on the decomposition of domestic value added of manufacturing products and their production length in China. J. Int. Econ. Coop. 2019, 4, 95–107. [Google Scholar]
- Li, Y.; Zhao, C. New development pattern of double circulation under the condition of science and technology innovation drive: Interpretation, misunderstanding and path. Theory J. 2021, 1, 32–41. [Google Scholar]
- Li, S.-M.; Guo, F.-L.; Tan, M. The mechanism of role and realization path of residents’ consumption upgrading for high-quality development of China’s economy under the new pattern of double cycle. Acad. Explor. 2022, 3, 110–119. [Google Scholar]
- Brunel, C. Green innovation and green Imports: Links between environmental policies, innovation, and production. JEMA 2019, 248, 109290. [Google Scholar]
- Zhu, S.; Zhang, G. Value chain location and enterprise innovation in the perspective of “double-loop”. Sci. Technol. Manag. Res. 2022, 42, 11–19. [Google Scholar]
- Furman, J.; Hayes, R. Catching up or Standing Still? National Innovative Productivity among Follower Countries. Res. Policy 2004, 33, 1329–1354. [Google Scholar] [CrossRef]
- Hwa, B.; Ning, B.; Sr, F. The impact of internet development on the health of Chinese residents: Transmission mechanisms and empirical tests. Socio-Econ. Plan. Sci. 2021, 81, 101178. [Google Scholar]
- Yan, H.; Wang, W.; Lv, W. Evaluation of the technological innovation capacity of provincial industries. Stat. Decis. 2016, 16, 61–64. [Google Scholar]
- Dagar, V.; Khan, M.K.; Alvarado, R. Impact of renewable energy consumption, financial development and natural resources on environmental degradation in OECD countries with dynamic panel data. Environ. Sci. Pollut. Res. 2021, 29, 18202–18212. [Google Scholar] [CrossRef] [PubMed]
- Qiu, W.; Zhang, J.W.; Wu, H.T. The role of innovation investment and institutional quality on green total factor productivity: Evidence from 46 countries along the “Belt and Road”. Environ. Sci. Pollut. Res. 2021, 29, 16597–16611. [Google Scholar] [CrossRef] [PubMed]
- Liu, Z. Demand-side reform: A new mission to promote a Dual-circulation development pattern. Southeast Acad. Res. 2021, 2, 79–85+247. [Google Scholar]
- Chen, J.; Yang, Z.; Yin, X. China’s Science and Technology Innovation Strategy under the New Development Pattern of “Dual Circulation”. Mod. Econ. Sci. 2021, 43, 1–9. [Google Scholar]
- Li, G.; Jiang, X. Green Development, Talent Clustering and Urban Innovation Enhancement—A Study Based on the Yangtze River Delta City Cluster. J. Anhui Univ. Philos. Soc. Sci. Ed. 2020, 44, 122–130. [Google Scholar]
- Xiao, R.; Ding, J. Green innovation efficiency of Chinese enterprises and its spatial spillover effects—A two-stage value chain perspective. J. Shanxi Univ. Financ. Econ. 2017, 39, 45–58. [Google Scholar]
- He, X.; Hung, S.; Chau, K. A Study on the Effect of Environmental Regulation on Green Innovation Performance: A Case of Green Manufacturing Enterprise Pearl River Delta in China. Ekoloji 2019, 28, 727–736. [Google Scholar]
- Li, M.; Huang, Q. Significance, Problems and Policy Suggestions of the Innovation-Driven Development Strategy under the “Dual Circulation” Development Pattern. Qinghai Soc. Sci. 2020, 6, 31–40. [Google Scholar]
- Guo, A.; Zhang, N.; Deng, J. Fiscal vertical imbalances, environmental governance and the efficiency of green development. Financ. Econ. 2020, 12, 72–82. [Google Scholar]
- Wu, C.; Zhou, X. Study on the spatial and temporal pattern evolution of green economic efficiency in the Yangtze River Economic Zone and its influencing factors. J. Macro-Qual. Res. 2020, 8, 120–128. [Google Scholar]
- Liu, H.; Wang, Q.; Yao, P.B. A study on the efficiency of pediatric healthcare services and its influencing factors in China—Estimation of a three-stage DEA model based on provincial-level data. Socio-Econ. Plan. Sci. 2022; 101315, in press. [Google Scholar] [CrossRef]
- Li, J.; Chen, P.; Wan, G. Spatial correlation of regional economic growth in China and its explanation—Based on a network analysis approach. Econ. Res. J. 2014, 49, 4–16. [Google Scholar]
- Chen, Y.S. The Driver of Green Innovation and Green Image—Green Core Competence. J. Bus Ethics 2008, 81, 531–543. [Google Scholar] [CrossRef]
- Caputo, M.; Lamberti, E.; Cammarano, A.; Michelino, F. Exploring the impact of open innovation on firm performances. Manag. Decis. 2016, 54, 1788–1812. [Google Scholar] [CrossRef]
- Backhaus, J.G. Joseph Alois Schumpeter: Entrepreneurship, Style and Vision; Springer Science & Business Media: Berlin/Heidelberg, Germany, 2003; Volume 25, pp. 33–34. [Google Scholar]
- Rosenberg, N. The Commercial Exploitation of Science by American Industry. In Studies on Science and the Innovation Process; World Scientific: Singapore, 1985. [Google Scholar]
- Yang, J.; Zeng, B.; Yuan, C. Marine Industrial Technological Innovation: Spatial Differences in Provinces, Causes and Countermeasures. J. Sichuan Univ. Sci. Eng. Soc. Sci. Ed. 2021, 36, 57–76. [Google Scholar]
- Zhang, X.; Ma, Y. Research on the Cooperative Development of “the Belt and Road” Initiative and Industrial Science and Technology Innovation in Western Ethnic Areas. Sci. Manag. Res. 2019, 37, 92–96. [Google Scholar]
- Lu, F.; Li, M. Research on the Influence of Government R&D Funding on Technological Innovation in High-tech Industry. Chin. Public Adm. 2018, 9, 92–96. [Google Scholar]
- Ma, X. Tapping the potential of domestic demand to open up a Dual-circulation mechanism. Frontline 2021, 3, 40–42. [Google Scholar]
- Duan, X.; Dai, S.; Liao, K. Coordinated effects of green economic development and government green governance and their dynamic relationship. Stat. Decis. 2020, 36, 119–123. [Google Scholar]
- Wang, J.; Ding, H.; Zheng, H. A Study on the Coordinated Development of Urbanization in Shandong Province Based on an Improved Coupled Coordination Model. Sci. Technol. Prog. Policy 2018, 35, 29–35. [Google Scholar]
- Liao, Z. Quantitaitve Judgement and Classification System for Coordinated Development of Environment Amd Economy—A Case Study of the City Group in the Pearl River Delta. Trop. Geogr. 1999, 2, 76–82. [Google Scholar]
Publisher’s Note: MDPI stays neutral with regard to jurisdictional claims in published maps and institutional affiliations. |
© 2022 by the authors. Licensee MDPI, Basel, Switzerland. This article is an open access article distributed under the terms and conditions of the Creative Commons Attribution (CC BY) license (https://creativecommons.org/licenses/by/4.0/).