Article

Green Public Finance and “Dual Control” of Carbon Emissions: New Evidence from China

1
School of Economics and Management, Nanchang University, Nanchang 330031, China
2
College of City Construction, Jiangxi Normal University, Nanchang 330022, China
*
Author to whom correspondence should be addressed.
Systems 2024, 12(4), 123; https://doi.org/10.3390/systems12040123
Submission received: 14 March 2024 / Revised: 3 April 2024 / Accepted: 4 April 2024 / Published: 7 April 2024

Abstract

:
In response to the escalating global climate change, countries are progressively adopting green public finance as a crucial instrument for achieving carbon neutrality. This study considers energy conservation and emission reduction (ECER) in demonstration cities’ construction as a natural experiment and verifies the effect of green public finance on total carbon emissions (TCEs) and carbon emission intensity (CEI) by using a difference-in-differences (DID) model with the help of the panel data of 276 Chinese cities from 2006 to 2019. The empirical results indicate that (1) the ECER policy effectively reduces CEs in the demonstration cities, resulting in a reduction of TCEs by 13.13% and CEI by 12.90%; (2) the ECER policy can help optimize energy structure, accelerate green technology innovation, and improve energy efficiency, thus promoting “dual control” of CEs; and (3) the CE reduction effect of the ECER policy is stronger in western cities, southern cities, lower-administrative-level cities, and cities with weaker financial strength, which has a typical “supporting the weak” effect. Based on this, we conclude that green public finance is conducive to promoting “dual control” of CEs. Our conclusions not only enrich the theoretical research on green public finance but also provide governments with empirical evidence to implement more effective green public finance policies and expedite carbon neutrality.

1. Introduction

Green public finance has increasingly become a valuable instrument for nations to deal with global climate change and promote carbon neutrality [1]. The European Union (EU) has been at the forefront of tackling climate change and adopted a series of critical documents, such as the “EU Strategic Long-Term Vision 2050” and “Fit for 55” in 2018, which formalized the long-term objective of creating a climate-neutral economy by 2050 [2]. During this phase, the EU has mainly supported member states in implementing CE reduction policies through fiscal measures, environmental taxes, CE trading mechanisms, energy taxes, and other aspects. As another example, Japan promulgated the “2050 Carbon Neutral Green Growth Strategy” in 2020, which encourages local governments to participate in CE reduction activities actively and mobilizes all sectors of society to develop a low-carbon economy through tax incentives and financial subsidies, thus promoting CE reduction and laying the foundation for achieving carbon neutrality. A consensus is emerging among the world’s leading economies on reaching global net zero emissions by mid-century. Based on the above, testing the effect of green public finance on low-carbon development has also become a research hotspot [3,4,5].
As an effective measure to promote energy conservation and pollution control, green public finance has also been widely used in China to promote CE reduction. As the world’s largest energy consumer and carbon emitter, China’s CO
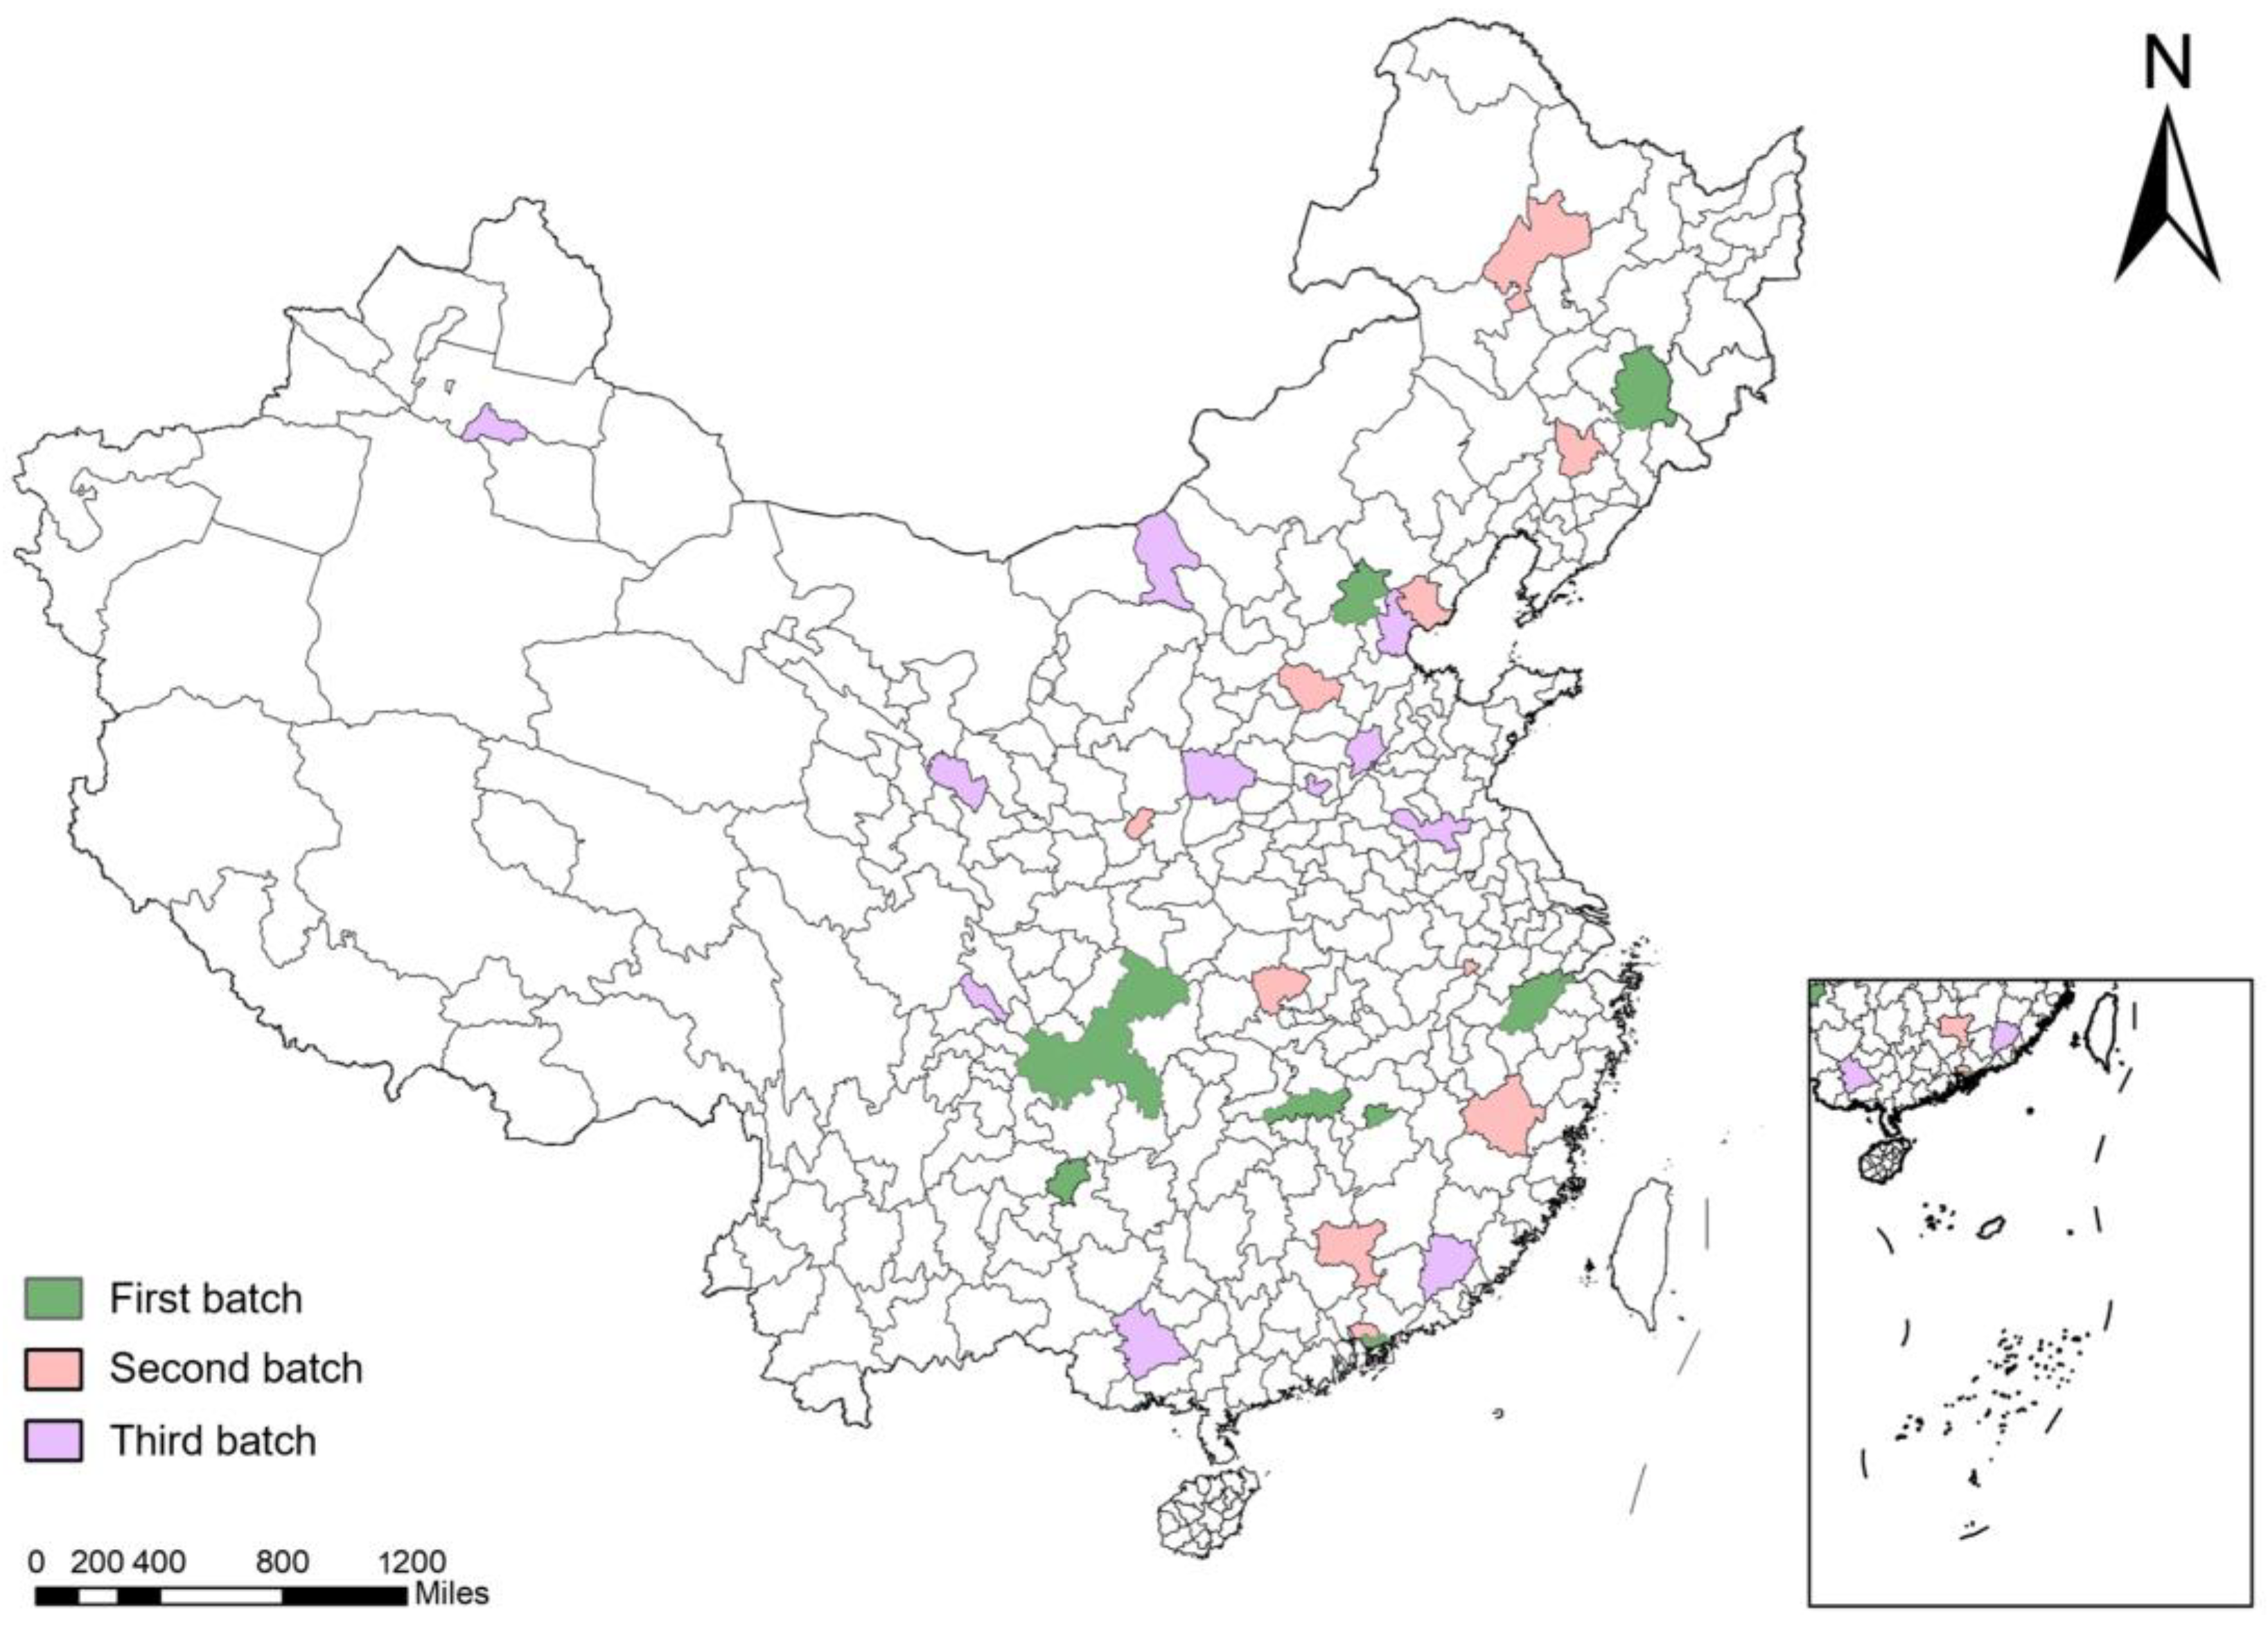
2 emissions account for a third of global emissions. The rate at which China can reduce emissions in the coming decades is an essential factor in whether the world will succeed in limiting global warming to 1.5 °C. To this end, the Chinese government regards green public finance as a critical measure to promote ECER. The Chinese government’s introduction of green public finance for the ECER demonstration cities’ construction in 2011 offers an opportunity to study the profound effect of green public finance on CEs of this work. The policy aims to play the role of a fiscal policy in fully promoting ECER systematically and holistically. In 2011, 2013, and 2014, the Chinese government selected three batches of 30 ECER demonstration cities to promote “dual control” of TCEs and CEI. The latest studies have also evaluated the effectiveness of the ECER policy, mainly focusing on the aspects of urban development [6], green technological innovation [7], pollution emissions [8], and energy consumption [9], but a mere fraction of studies have directly explored the CE reduction effect of it, especially the critical issue of whether the ECER demonstration cities’ construction can effectively promote “dual control” of CEs, which provides a valuable space for this study.
In the context of CE practices in China, prior to the proposal of “dual control” in the CE framework, the “dual control” of energy consumption was the predominant theme in the early energy assessments in China. In December 2020, China came up with ambitious targets for addressing climate change, which include peaking CEs by 2030, striving for carbon neutrality by 2060, reducing CEs per unit GDP by 18%, and implementing a system to control TCEs and CEI. In December 2021, the Chinese government emphasized the need to create conditions for the rapid shift from “dual control” of energy consumption to “dual control” of CEs, promoting the improvement of incentive and restraint policies for pollution reduction, developing green public finance, and expediting the adoption of low-carbon lifestyles, which was reiterated in 2022. In this context, a natural question is whether China’s formulated ECER new development model is environmentally friendly. Can it empower the “dual control” of CEs? Moreover, what are the internal operational mechanisms if green public finance can drive “dual control”? These are all issues worthy of discussion.
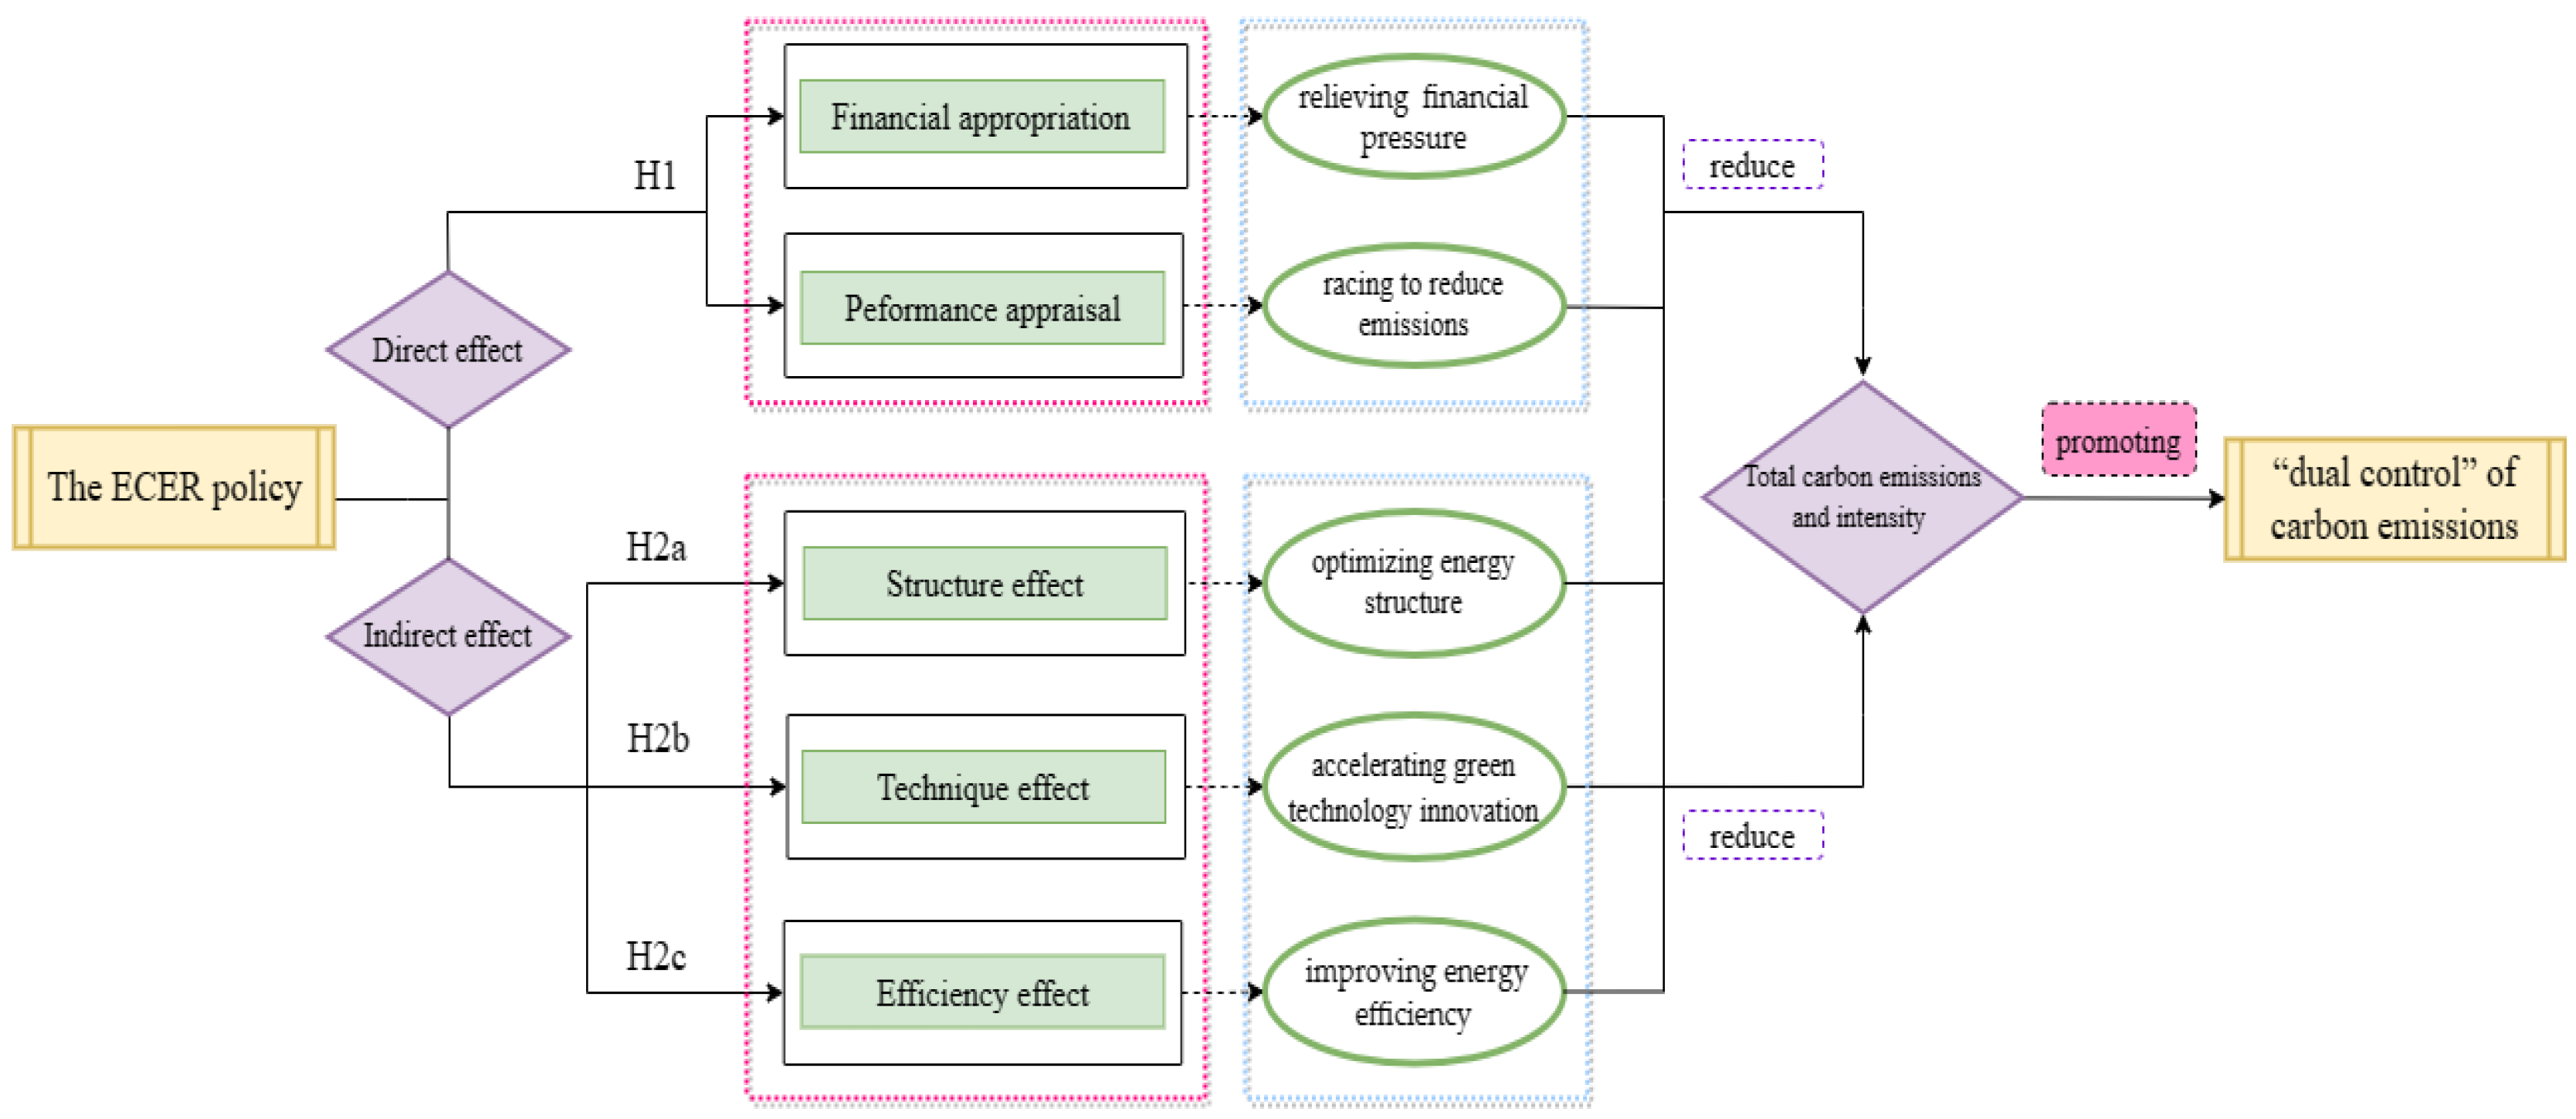
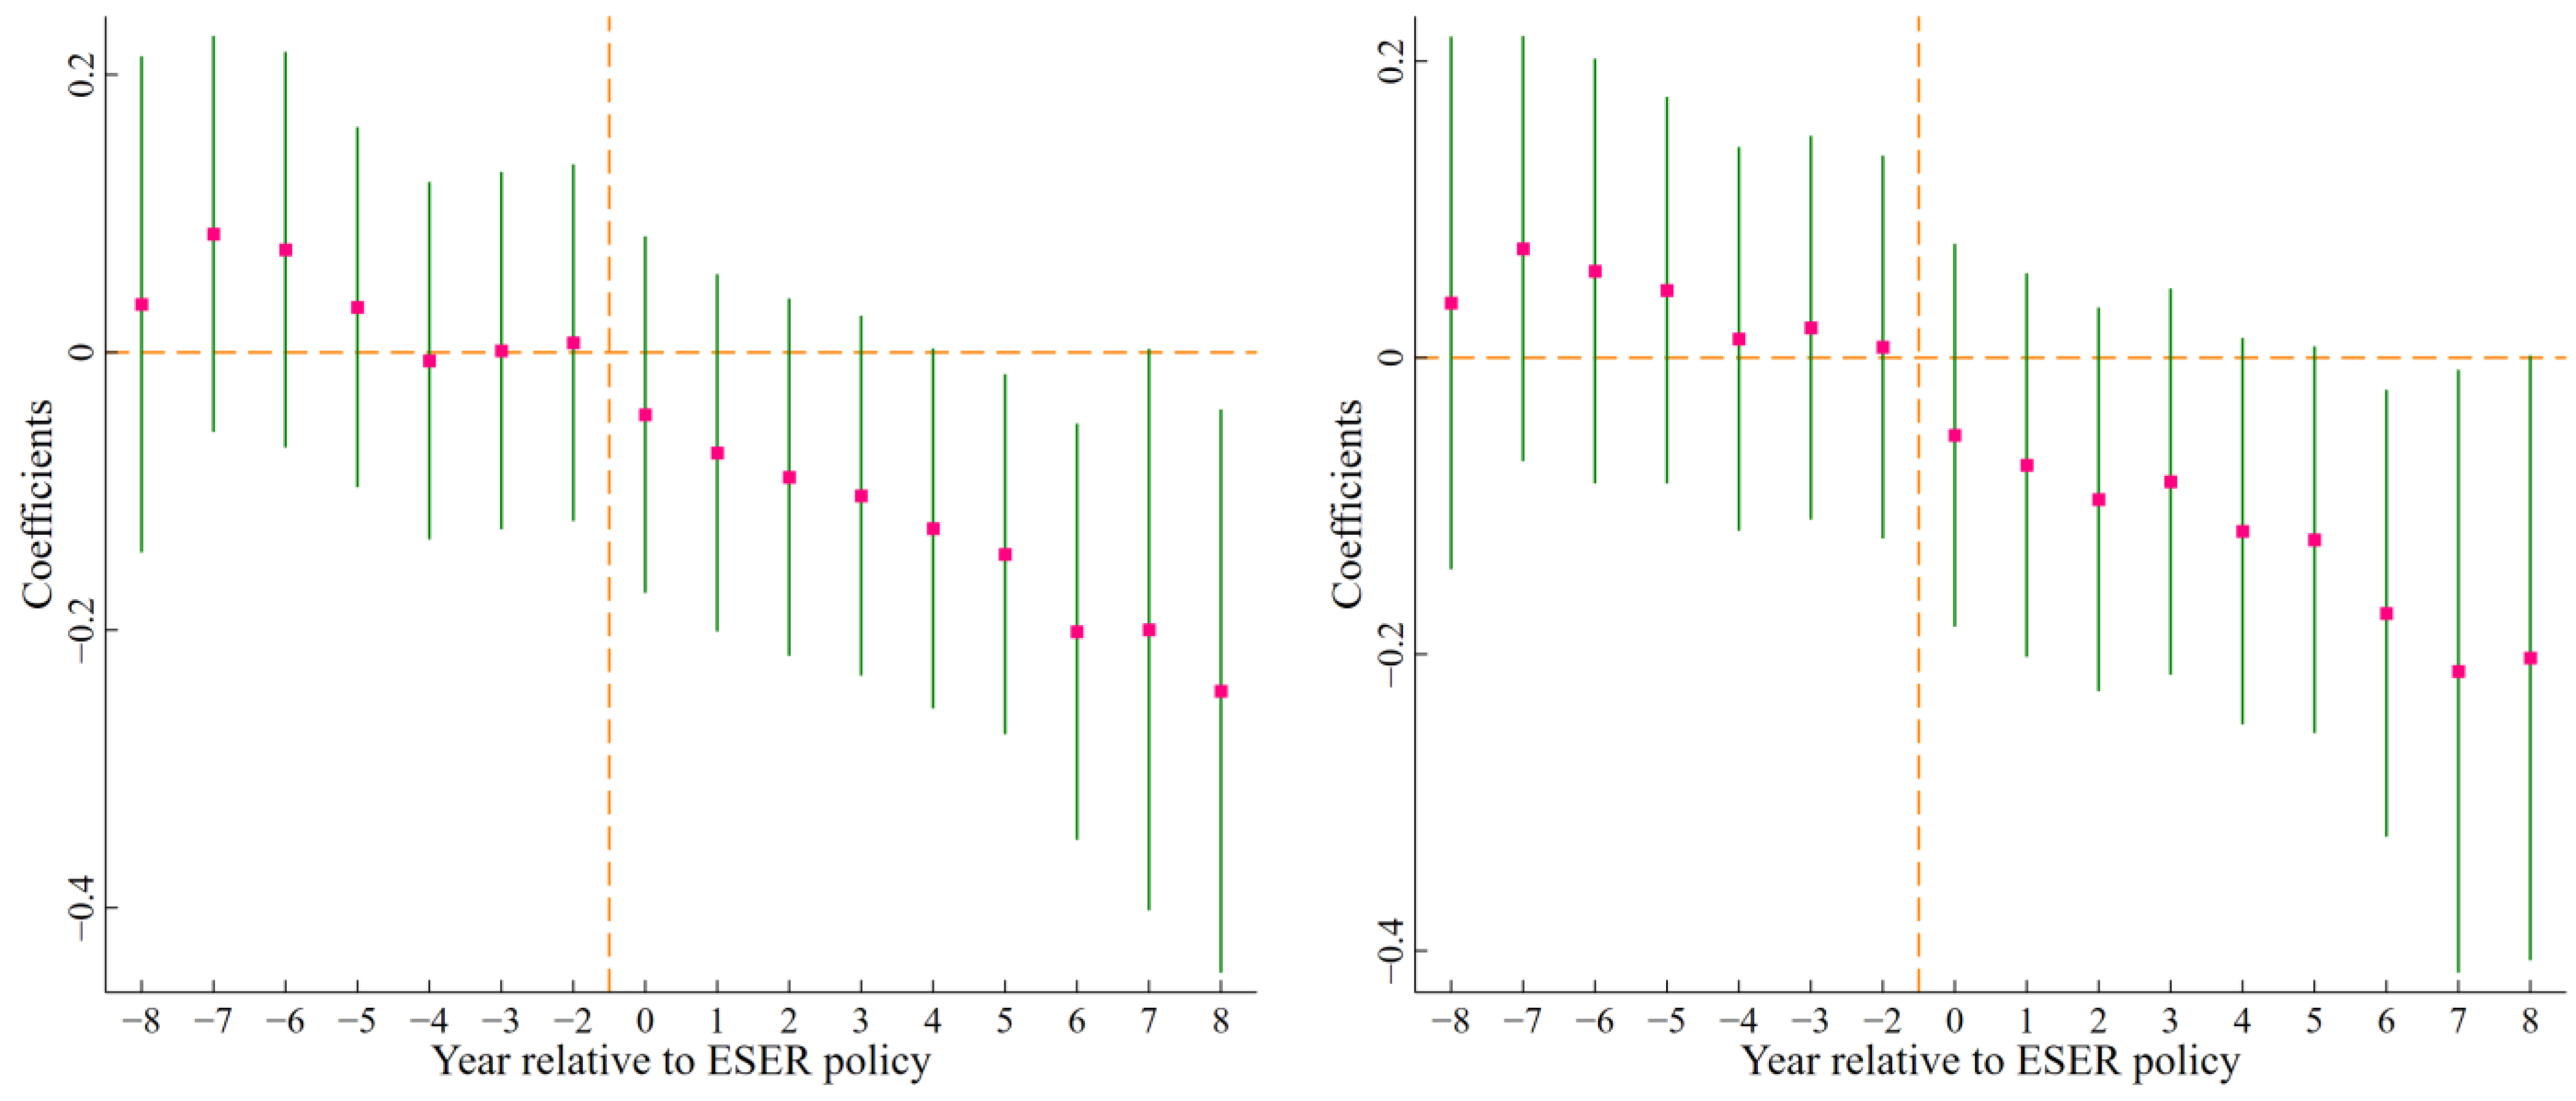
For this reason, this study takes three batches of ECER demonstration cities in China from 2006 to 2019 as quasi-natural experiments. A difference-in-differences (DID) model is used to analyze the effect and mechanism of the ECER policy on both TCEs and CEI. Based on reviewing relevant policies and theories, this study first puts forward four research hypotheses. Then, we take three batches of ECER demonstration cities as quasi-natural experiments to empirically examine the effect and mechanism of green public finance on CEs, especially in western cities, southern cities, lower-administrative-level cities, and cities with weaker financial strength. We found that the ECER policy has effectively promoted “dual control” of CEs. This conclusion still stands after conducting a battery of rigorous tests. Moreover, the mechanism tests show that optimizing energy structure, accelerating green technology innovation, and improving energy efficiency are the three ways the ECER policy promotes “dual control” of CEs.
In this study, we make three marginal contributions. First, with respect to the research perspective, this study further tests the effect of green public finance on the “dual control” of CEs based on the ECER policy. Most previous research has addressed the CE reduction effect of environmental policies, while only a few have approached the subject from the perspective of green public finance. Meanwhile, although many studies have discussed the effects of green public finance from various aspects, such as enterprise structure upgrading [10] and industrial agglomeration [11], only a few studies pay attention to its CE reduction effect, particularly from the perspective of “dual control”. Our work effectively adds a new research perspective and deepens the research on the effect of green public finance. Second, with respect to the research content, this study delves deeper into analyzing the mechanisms of the ECER policy from the structure effect, technique effect, and efficiency effect, which extend the existing literature and provide a scientific basis for applying green public finance to reduce CEs. Third, with respect to the significance of the research, we provide an update on the research evidence for promoting CE reduction through green public finance. In the context of the global trend to promote “carbon neutrality” actively, it provides environmental policymakers with empirical references.

2. Literature Review

2.1. The Influencing Factors of CEs

The scientific consensus affirms that the primary cause of climate change is excessive CO2 emissions [12,13]. Therefore, controlling these emissions is essential to achieving sustainable development [14]. The existing literature that explores the factors that influence CEs mainly focuses on environmental policy, technological factors, and economic reform. Specifically, it includes environmental regulations [15,16], the digital economy [17,18,19], green technology innovation [20,21,22], and green finance [23,24]. For example, Liu et al. quantified the level of a government’s attention to environmental issues (GEA) and found that the improvement of GEA effectively reduced corporate CEs [15]. Similarly, Zhao et al. explored the impact of digital inclusive finance (DIF) on urban CO2 emissions in China and found that DIF could significantly reduce them [17]. Su and Moaniba utilized a new reverse analysis method to examine how innovation responds to climate change and found that technological innovation is strongly responding to climate change [20]. Umar and Safi (2023) studied the trade-adjusted CO2 emissions of green finance and innovation and found that they significantly reduced CEs [23].
The impact of fiscal policies on green development has emerged as an important topic of discussion alongside environmental policies. Despite the absence of a consensus, some experts have opined that fiscal policy can positively affect carbon reduction. Notably, Miao et al. examined the relationship between fiscal policy and green growth in G7 countries from 1990 to 2020 and obtained findings that demonstrate the promoting effect of fiscal policy on green growth [25]. Similarly, Bai et al. scrutinized the corresponding relationship between fiscal policy, monetary policy, and CO2 emissions in China, using data from 1980 to 2022, and discovered that both sets of economic policies have a positive impact on CO2 emission reduction [3]. Furthermore, Chishti et al. modeled the relationship between macroeconomic policies and CO2 emissions in the BRICS during the period of 1985 to 2014 and demonstrated that tight fiscal policies have a mitigating effect in reducing the adverse impact of CO2, while expansionary fiscal policies exacerbate its harmful effects [26].
Several scholars have examined the impact of fiscal policy on environmental pollution and have arrived at varying conclusions. Li et al. employed a new panel asymmetric autoregressive distributed lag (ARDL) test to analyze data and found that government expenditure aggravated CO2 emissions, while tax revenue and renewable energy reduced them [4]. Kamal et al. investigated the relationship between fiscal policy and CO2 emissions in 105 countries between 1990 and 2016 and found that fiscal policy and globalization significantly contributed to environmental pollution [27]. However, other studies suggest that fiscal policy has no discernible effect on environmental pollution or presents a nonlinear relationship. For instance, Ahmed et al. investigated the impact of public renewable energy research and development budgets (RRDD) on CO2 emissions in the United States and found that both positive and negative changes in RRDD had no effect on environmental pollution [5]. Meanwhile, Lv et al. employed spatial econometric analysis to study the impact of fiscal decentralization on environmental pollution and found that fiscal decentralization had an inverted N-shaped relationship with TCEs and CEI [28].

2.2. The Impact of Green Public Finance

It is pertinent to note that a growing number of countries have embraced green public finance as a pragmatic tool to promote environmentally conscious economic development. Green public finance operates much like traditional fiscal mechanisms by supporting green development through revenues and expenditures.
Regarding green fiscal revenues, Dong et al. employed a spatial Dubin model to determine that green taxes are effective in reducing CEs [29]. Yamaguchi and Managi proposed that governments issue green national bonds with interest payments tied to green net national production (GNNP) to achieve green economic growth [30]. Wang and Yu found that environmental tax rates have a positive impact on pollution reduction and green innovation [31]. Concerning green fiscal expenditures, Fang and Chang conducted an empirical study based on data from E-7 economies and concluded that green fiscal expenditure is beneficial to green economic development [32]. Hussain et al. demonstrated that green government subsidies significantly decrease CEs and promote green development [33]. Sun and Razzaq investigated the connection between green fiscal revenues and expenditures and CEs in 32 OECD countries and discovered that green fiscal decentralization could notably curtail CEs [34].
The ECER policy has garnered the attention of several scholars who have explored its impact. It is widely believed that green public finance plays a vital role in reducing environmental pollution emissions. Lin and Zhu have concluded that the ECER policy has significantly improved urban eco-efficiency in China based on the policy proposed in 2011 [6]. Zhu et al. have estimated the effect of the ECER policy on pollution emissions using the sample period of 2003–2006 and have found that the policy has contributed significantly to reducing industrial SO2 emissions, thus effectively achieving the emission reduction targets [35]. Xu et al. have constructed the DID framework and found that the TCEs of pilot cities decreased relatively after the implementation of the ECER policy [36]. These findings underscore the importance of green public finance in mitigating environmental pollution emissions and the effectiveness of the ECER policy in achieving emission reduction goals.

2.3. Summary of the Literature

In summary, a considerable number of researchers have explored the various factors that influence CEs and the impact of green public finance. This exploration carries significant implications for this field. However, there is a noticeable gap in the literature on the impact of green public finance on the reduction of CEs based on China’s “carbon neutrality” promotion. Furthermore, though certain scholars have examined the CE reduction effect of the ECER policy, they have mainly focused on the single level of TCEs or CEI without conducting a comprehensive analysis from the perspective of “dual control”. This study aims to address this gap by taking the ECER demonstration cities’ construction as a typical green public finance implementation pilot and empirically examining the impact and mechanism of green public finance on the “dual control” of CEs. This study provides valuable insights into promoting low-carbon development and effectively fills a gap in the literature.

3. Policy Background and Research Hypothesis

3.1. The ECER Policy

Over the past few years, the Chinese government has given priority to the development of the ECER policy. To this end, China launched the ECER demonstration cities construction project in June 2011, selecting eight cities, including Beijing and Shenzhen. In 2013, ten additional cities, including Shijiazhuang, were designated as the second batch, followed by the selection of twelve more cities, including Tianjin, as the third batch in 2014.
The ECER demonstration cities’ construction is a new exploration of using urban areas as a platform for promoting energy efficiency and reducing emissions. Focusing on main tasks, such as the “low-carbon and modern service industry”, “large-scale use of renewable energy”, and “reduction of major pollutants”, the pilot governments fully play the role of implementing fiscal policies and promoting ECER systematically and holistically. At the same time, in addition to prioritizing demonstration cities in existing policies to support ECER, the central government offers substantial incentives to these cities, taking into account various factors, such as the level of project investment, local involvement, and the efficiency of ECER efforts. The ECER policy has positioned demonstration cities as leaders in promoting CE reduction within society, which has driven the adjustment of urban economic structures and fostered a shift in development patterns.

3.2. Research Hypothesis

3.2.1. The Direct Effect of the ECER Policy on “Dual Control” of CEs

The central government will maintain an annual investment in local governments in demonstration cities throughout the demonstration period. Furthermore, existing supportive policies prioritize demonstration cities, which not only directly relieve the financial pressure on local governments to develop green public finance and encourage local governments to reduce CEs but also support local governments to break their dependence on the “three high” industries in economic development.
The demonstration cities will also be subject to regular performance appraisals, with specific and clear assessment indicators set around the demonstration workload, the effect of ECER, and the construction of long-term mechanisms. The appraisal outcomes will inform the distribution of comprehensive incentive funds for the following year. If the overall performance assessment finds that a demonstration city has failed to meet the ECER targets outlined in the implementation program, the city’s demonstration status will be revoked. The overall performance appraisal primarily assesses the effectiveness of ECER through the five key indicators related to CEs. According to the target-setting theory [37], the demonstration cities will seek to improve their performance in the indicators above, ultimately reducing TCEs and CEI. Thus, we suggest our first research hypothesis:
H1: 
The ECER policy can effectively promote “dual control” of CEs.

3.2.2. The Indirect Effect of the ECER Policy on “Dual Control” of CEs

The ECER demonstration cities’ construction aims to foster green-, recycling, and low-carbon development by establishing an ECER pattern in which the government takes the lead, enterprises are the primary agents, and the market and broader society are actively involved. The six key tasks of the demonstration city construction are as follows: step up efforts to shift the industrial structure by focusing on low-carbon industries, transform the urban transportation system by focusing on sustainable transportation, encourage energy conservation in buildings by focusing on green buildings, drive the growth of the service industry by focusing on intensity and expansion, enhance the urban environment by focusing on the reduction of major pollutants, and optimize the energy configuration by focusing on the magnitude of renewable energy use.
The establishment of ECER demonstration cities can be instrumental in reducing CEs through three channels, the structure effect, the technique effect, and the efficiency effect, to achieve “dual control” over both TCEs and CEI.
First, the ECER policy can facilitate CE reduction by leveraging the structural effect. To achieve emission reduction targets, demonstration cities can foster strategic emerging energy industries and transform the energy structure while reducing dependence on high-pollution enterprises. On the one hand, to promote resource conservation and pollution reduction, pilot local governments are imposing heavy taxes on high-energy-consuming industries to curb CEs at the source [38]. In addition, to enhance CE reduction efficacy, a differentiated tax system and financial subsidies have been introduced [39]. At the same time, to encourage resource conservation, preferential policies, such as preferential loans and tax reductions, are provided to environmentally friendly industries [40]. On the other hand, local governments continue to promote sustainable energy practices, including boosting the proportion of non-fossil energy and implementing green mining and efficient coal utilization methods [41]. Moreover, implementing new energy through integrated application is vigorously promoted to optimize the energy supply system [42]. Based on these premises, we put forward Hypothesis 2a:
H2a: 
The ECER policy can promote “dual control” of CEs by optimizing the energy structure.
Second, the ECER policy can facilitate CE reduction by leveraging the technique effect. Technological innovations serve as positive catalysts for driving economic development and are instrumental in establishing a sustainable development system [43]. Studies have revealed that the integration of green technology innovations can be effective in reducing CEs [44]. Green technology innovation is primarily centered on delivering new products and services aimed at minimizing the consumption of natural resources. However, due to the technology spillover effect and environmental externalities of green technology, many enterprises lack enthusiasm to innovate and apply these technologies, resulting in a weak green technology base and a significant deficiency in investment in green technology innovation [45]. The setting of targets in the ECER policy can motivate local governments to allocate their fiscal resources towards green technology innovations. With comprehensive backing from both central and local government funding, businesses in pilot cities view the acceleration of green technology innovation as a pivotal strategy. Based on these premises, we put forward Hypothesis 2b:
H2b: 
The ECER policy can promote “dual control” of CEs by accelerating green technology innovation.
Third, the ECER policy can facilitate CE reduction by leveraging the efficiency effect. Energy efficiency improvement is a crucial driver of green development [46]. The establishment of demonstration cities can effectively improve energy efficiency by integrating capital and optimizing resource allocation such that the potential for redundant cross-funding is eliminated. By utilizing the city as a platform to streamline the integration of central and local fiscal funds associated with ECER, this prevents redundant cross-funding. For instance, one of the demonstration cities, Jingmen City, successfully integrates construction funds, such as urban construction, water conservancy, environmental protection, provincial matching funds, and comprehensive demonstration reward funds. Furthermore, the city actively attracts the participation of social capital through government–society cooperation to reshape the pattern and efficiency of resource allocation, ultimately achieving CE reduction [47]. Additionally, demonstration cities have also effectively promoted the overall planning and construction of industrial clusters and characteristic industrial parks and promoted the aggregation and development of advantageous industries. Moreover, these cities have facilitated the rational allocation of production factors through digital transformation and intelligent upgrading. The construction of a modern service industry concentration area integrates commerce, leisure, and residential areas. Based on these premises, we put forward Hypothesis 2c:
H2c: 
The ECER policy can promote “dual control” of CEs by improving energy efficiency.
Figure 1 describes the mechanism analysis framework of this study.

4. Research Design

4.1. Model Specification

Based on the principle of the DID framework, we construct the benchmark model as follows:
( C O 2 ) i t = β 0 + β 1 E C E R i t + β 2 X i t + μ i + η t + ε i t
where i and t, respectively, denote city and year; CO2 is the dependent variable, signifying the CE status; ECER is key core independent variable, referring to the ECER policy; Xit represents a set of control variables; μi and ηt denote city fixed effects (City FE) and year fixed effects (Year FE), respectively; and the error term is represented by εit.

4.2. Variables

4.2.1. Dependent Variable: CO2

We reconstruct a comprehensive index to measure the CEs of cities from two dimensions: CO2_total and CO2_intensity. Specifically, we represent the two dimensions using the logarithm of TCEs and CEI. In the existing literature, CE accounting generally involves quantifying urban CEs using data from the Chinese Research Data Services Platform [48,49]. The energy consumption from liquefied petroleum gas, natural gas, heat, and electricity is the most widely used method to account for the CEs of cities [50]. This study primarily utilizes this method to estimate the CEs in Chinese cities.

4.2.2. Independent Variable: The ECER Policy

As previously mentioned, the Chinese government approved 30 cities as ECER demonstration cities in 2012, 2013, and 2014, as depicted in Figure 2. In the event that a city is selected as an ECER demonstration city, the ECER for the year of selection and the subsequent years takes the value of 1. Otherwise, its value is 0.

4.2.3. Control Variables

To eliminate the potential influence that omitted variables may have on the urban TCEs and CEI, this study controls for the following urban characteristic variables, drawing on the existing literature:
(1) Economic development level: Economic development has diverse effects on CEs [51]. There may exist a nonlinear relationship between them [52].
(2) Industry structure: Adjusting the industry structure is crucial in low-carbon economy development [53].
(3) Government intervention: Existing studies have demonstrated that government interventions aimed at promoting CE reduction, such as implementing low-carbon subsidy policies, have an impact on the level of CE reduction [54].
(4) Human capital: Existing research indicates a significant long-term correlation between HC and CEs [55].
(5) Population size: Considering the influence of the population size on CEs, it is often observed that higher population sizes are associated with higher levels of CEs [56].
(6) Foreign direct investment: Existing research results indicate that financial development has a lasting impact on CEs [57].
(7) Financial development: Numerous researchers believe that there is a causal relationship between them [58].
(8) Infrastructure construction: Infrastructure construction activities consume significant amounts of non-renewable energy sources and have an impact on CEs [59].
Table 1 provides the specific measurement methods for each variable.

4.3. Data

The research samples in this study consist of panel data for 276 Chinese cities from 2006 to 2019 (see Table 2). The data primarily originate from the Chinese Research Data Services Platform.

5. Empirical Results and Analysis

5.1. Parallel Trend Test

To ensure that the difference-in-differences (DID) model is appropriate for the analysis, it is crucial that the parallel trend hypothesis is satisfied. To test this assumption, an event study methodology is employed initially. The specific model configuration is detailed below:
( C O 2 ) i t = α 0 + t = 8 2 β t × b e f o r e i t + t = 0 8 β t × a f t e r i t + φ X i t + μ i + η t + ε i t
where beforeit and afterit denote dummy variables and the remaining variables have equivalent definitions as described in Equation (1). The beforeit (afterit) takes on a value of 1 if the pilot city i is in the t year before (after) the policy implementation. Otherwise, it has a value of 0. Specifically, this study computes the estimation using 1st year before policy implementation as the base group (i.e., t = −1 is excluded).
Figure 3 illustrates the coefficients of beforeit and afterit, along with their 90% confidence intervals. None of the regression coefficients of beforeit are significant, suggesting no discernible disparity in the CE trends between ECER and non-ECER demonstration cities prior to policy implementation. Additionally, the coefficients of afterit are always negative and become significant only after the 5th year of the policy implementation, suggesting a delayed impact of the ECER policy on CE reduction.

5.2. Benchmark Regression

Table 3 displays the benchmark regression results from the DID model estimation. Columns (1) and (2) show that the regression coefficients of ECER are significantly negative with or without control variables, which confirms that demonstration city construction can effectively promote the decline of TCEs. The coefficients in Columns (3) and (4) are both significantly negative, which shows that demonstration city construction can reduce the CEI within these cities. Furthermore, from an economic perspective, Columns (2) and (4) show that the ECER policy is associated with a statistically significant reduction in TCEs and CEI. Specifically, the estimated reductions are 13.13% and 12.90%, respectively. The above results preliminarily validate Hypothesis 1 proposed in the previous section. The significant positive effect of ECER on CE reduction is consistent with the findings of Xu et al., who found that ECER had a significant effect on TCEs [36]. Meanwhile, this finding also expands existing studies on the effects of green public finance, such as those of Zhu et al., who found that ECER could significantly reduce SO2 emissions [35].

5.3. Robustness Test

5.3.1. PSM-DID Method

The benchmark regression results suggest that the ECER policy has a prominent CE reduction effect. However, there may be some non-randomness in the selection process, resulting in sample selection bias in the research results [60]. To solve this problem, we exploit the PSM-DID method. Specifically, this study takes the dependent variables as the result variables while treating the control variables as the covariate variables. As shown in Figure 4, the standardized deviations are below 10% in absolute values, and the mean differences are insignificant.
Table 4 displays the re-estimated results. The coefficients of ECER are still significantly negative, demonstrating that the benchmark regression result is valid.

5.3.2. Entropy Balancing Method

To further eliminate the differences in control variables related to ECER demonstration cities, we refer to Hainmueller to construct the entropy balancing method for testing, which has more advantages than PSM [61]. This method makes the probability score between the control and experimental groups similar without causing sample loss [62]. The coefficients of ECER remain significantly negative after using the samples processed by the entropy balancing method (see Table 5), providing additional evidence that the ECER policy effectively reduces both TCEs and CEI.

5.3.3. Placebo Test

We conduct a placebo test to overcome unseen factors interfering with the regression results and to obtain more accurate empirical results. Figure 5 displays the kernel density distribution of the coefficients of ECER. As we can see, it closely resembles a normal density distribution, which supports the fact that the research results are valid.

5.3.4. Controlling the Impact of Other Environmental Policies

This study explores the potential impact of other relevant policies on the empirical results, specifically focusing on the Carbon-Trading and Low-Carbon pilot policies, which are widely believed to contribute to ECER [53,63]. To alleviate the influence of these policies and obtain regression results that are closer to reality, this study employs the approach of Feng and Nie to construct two policy variables: CARBON_TRADING and LOW_CARBON [64]. Cities affected by the Carbon-Trading (Low-Carbon) policy are assigned a value of 1 for the variable CARBON_TRADING (LOW_CARBON) and 0 otherwise.
To gauge the potential impact of Low-Carbon and Carbon-Trading policies, the two policy variables are added to Equation (1). The regression analysis in Table 6 reveals that the coefficients of ECER remain significantly negative. The results suggest that the Carbon-Trading and Low-Carbon pilot policies do not have a confounding effect on the empirical results.

5.3.5. Controlling Additional Covariates

To further mitigate the bias issue that may arise due to the non-randomness of the sample, referring to Chakraborty and Chatterjee [65], we add the interaction term (t × Control variables) to the regression. Additionally, we further control for joint province–year fixed effects (Province–Year FE) to avoid the impact of policy factors and other random factors that change over time in each province. As we can see, the coefficients of ECER are still significant (see Table 7), which again shows the reliability of the research conclusions.

6. Further Analysis

6.1. Mechanism Tests

To explore the influence path of the ECER policy on the “dual control” of CEs, we construct a mediation effect model for testing. The specific model is outlined below:
( C O 2 ) i t = β 0 + β 1 E C E R i t + β 2 X i t + μ i + η t + ε i t
M E D i t = γ 0 + γ 1 E C E R i t + γ 2 X i t + μ i + η t + ε i t
( C O 2 ) i t = δ 0 + δ 1 E C E R i t + δ 2 M E D i t + δ 3 X i t + μ i + η t + ε i t
where MEDit represents the mediating variable, and the remaining variables have equivalent definitions as described in Equation (1). According to Hypothesis 2, we empirically test the structural effect, technique effect, and efficiency effect. The test steps are as follows. Firstly, Equation (3) is estimated to test the total effect β1 of the ECER policy on TCEs and CEI. If β1 is significant, we proceed to the second estimation step. In the second step, Equations (4) and (5) are estimated to observe the significance of the coefficients γ1 and δ2. If both of them are significant, we move on to the third estimation step. In the third step, we examine the coefficient δ1 in Equation (5). If δ1 is significant and shares the same sign as β1 while having a smaller absolute value than β1, we can conclude that the mediating effect exists.
Mediating variables are selected as follows: (1) structure effect: energy structure (ES); referring to Ye et al. [66], we apply the proportion of coal consumption to measure it; (2) technique effect: green technology innovation (GINNO); referring to Luo et al. [67], this study applies the number of patent applications for green invention per 104 people to measure it; and (3) efficiency effect: energy efficiency (EFF); referring to Feng and Nie [64], this study applies the electricity consumption per unit GDP to measure it.

6.1.1. Structure Effect

Table 8 shows the estimation results of ES as the mediating variable. From Column (1), we can see that the ECER policy helps promote the transformation of urban ES. The coefficients of ES in Columns (2) and (3) are significantly positive, indicating that optimizing the ES is conducive to promoting CE reduction. Furthermore, in Columns (2) and (3), the coefficients of ECER are 0.1226 and 0.1211 in absolute value, respectively, which is lower than those in benchmark regression, indicating that ES plays a partial mediating role in promoting CE reduction. This finding is consistent with the studies of Nie et al. and Zhu et al., which state that the policy acts on changing and upgrading the industrial structure to reduce emissions [7,35].

6.1.2. Technique Effect

Table 9 shows the estimation results of GINNO as the mediating variable. From Column (1), we can see that the ECER policy effectively stimulates urban GINNO. The coefficients of GINNO in Columns (2) and (3) are significantly negative, suggesting that the increase in GINNO helps to promote CE reduction. Furthermore, in Columns (2) and (3), the coefficients of ECER are 0.1279 and 0.1198 in absolute value, respectively, which is lower than those in benchmark regression, indicating that GINNO plays a partial mediating role in promoting CE reduction. Consistent with the research of Wang and Qiu, our findings reveal that the emission reduction utility of the policy can be driven by the improvement of technological innovation capability [8].

6.1.3. Efficiency Effect

Table 10 shows the estimation results of EFF as a mediating variable. From Column (1), we can see that the ECER policy significantly contributes to EFF. The coefficients of EFF in Columns (2) and (3) are significantly negative, meaning that improving EFF is conducive to promoting CE reduction. Furthermore, in Columns (2) and (3), the coefficients of ECER are 0.0787 and 0.0706 in absolute value, respectively, which is lower than those in benchmark regression, indicating that EFF plays a partial mediating role in promoting CE reduction. This finding is consistent with the research conducted by Shi and Wang, which suggests that improving the energy utilization rate can realize the CE reduction effect of ECER policy [68].

6.2. Heterogeneity Analyses

Due to the variation in characteristics of demonstration cities, the effect of the ECER policy on the “dual control” of CEs may also vary. Exploring the heterogeneous impacts of ECER demonstration cities’ construction on the “dual control” of CEs is conducive to a more comprehensive assessment of the ECER policy’s effectiveness and studying empirical implications of the ECER demonstration construction cities in the future.

6.2.1. Heterogeneity of Geographic Location (Eastern–Central–Western)

Based on horizontal differences in geographic location, we categorize our study samples into three sub-samples: eastern, central, and western cities (see Table 11). Compared with central and eastern cities, the ECER policy has a more prominent effect in western cities. This phenomenon can be attributed to the fact that central and eastern cities have historically experienced rapid economic growth that heavily relied on high energy consumption [69]. The results of our study highlight the importance of considering regional variations while formulating energy policies to ensure their effective implementation.

6.2.2. Heterogeneity of Geographic Location (Southern–Northern)

Furthermore, based on the vertical differences in geographical location, we divide the sample cities into two sub-samples: southern and northern cities (see Table 12). Compared with southern cities, the ECER policy has a more prominent effect in northern cities. This could be attributed to the fact that traditional manufacturing and energy-intensive heavy industries dominate the urban economic structure of northern China, which is in stark contrast to the southern cities [70].

6.2.3. Heterogeneity of Administrative Level

According to the differences in urban administrative level, we divide the sample cities into two sub-samples: high- and low-administrative-level cities (see Table 13). Compared with high-administrative-level cities, the ECER policy has a stronger effect in low-administrative-level cities. The possible reasons are as follows: first of all, lower-administrative-level cities are subject to relatively less policy preference, while the implementation of the ECER policy will give priority to demonstration cities, which significantly encourages the enthusiasm of low-administrative-level cities to achieve ECER targets; and, secondly, according to the promotion tournament hypothesis [71], we can infer that local government officials in low-administrative-level cities will invest more resources in the deployment and promotion of ECER and strive to be at the forefront of the ECER process due to the potential promotion opportunity.

6.2.4. Heterogeneity of Financial Strength

Additionally, according to the differences in urban financial strength, we classify our study samples into two sub-samples: cities with strong and weak financial strength (see Table 14). Compared with cities with strong financial strength, the ECER policy has a stronger effect in cities with weak financial strength. This may be attributed to the cities with weak financial strength having limited financial resources to invest in ECER projects, while the ECER policy can significantly relieve the financial pressure on cities with weak financial strength to promote CE reduction.
The findings of heterogeneity presented above are consistent with those of Xu et al. and Shi and Wang. The first study found that ECER policy effects are highly heterogeneous in terms of location, environmental constraints, fiscal autarky, resource endowments, and the distribution of CEs [36]. Another study reported that green public finance could effectively mitigate the financial constraints of local governments and motivate environmental protection behaviors, particularly in cities with weak financial strength [68]. These findings highlight the need for careful consideration of contextual factors when planning and implementing environmental policies, as well as the potential benefits of innovative financing mechanisms, such as green public finance.
In conclusion, we can find a common point based on the above four heterogeneity analyses of the ECER policy effect: demonstration cities significantly affected by the ECER policy are at a relative “disadvantage” compared with others. In other words, the ECER policy can better stimulate CE reduction work in cities with relatively weak economic environments and government governance, which has a typical “supporting the weak” effect.

7. Conclusions and Discussion

7.1. Research Findings

China is in the critical period of actively promoting “carbon neutrality”, and how to fully play the role of green public finance to achieve it is an important theoretical and practical question that needs to be answered urgently. With the help of 276 Chinese urban samples from 2006 to 2019, this study exploits a DID model to evaluate the effectiveness of the ECER policy on the “dual control” of TCEs and CEI from the perspective of green public finance. Our key findings are the following. First, the ECER policy has effectively reduced TCEs and CEI. This finding validates the study hypothesis H1. Second, the mechanism tests show that the ECER policy can facilitate the “dual control” of CEs by optimizing energy structure, accelerating green technology innovation, and improving energy efficiency. This finding validates the study Hypotheses H2a, H2b, and H2c. Third, the heterogeneity analyses find that only the western cities, southern cities, lower-administrative-level cities, and cities with weaker financial strength can significantly promote the “dual control” of CEs.

7.2. Theoretical Contributions

First, our study contributes to the literature on CE reduction drivers by identifying the critical role of the ECER policy. Although the existing research has provided rich discussions of the influencing factors of CEs, it mainly focuses on the impact of environmental policies, technological factors, and economic reform on CEs [15,16,17,18,19,20,21,22,23,24], and few studies have paid attention to the CE reduction utility of green public finance. On the other hand, the research on CEs in the current literature is limited to the measurement at a single level, that is, the TCEs or CEI [24,36]. This study also provides a new and reasonable research reference for comprehensively measuring the effect of CE reduction.
Second, we contribute to the literature on green public finance by studying the impact of ECER demonstration city construction on CEs. As a typical green public finance pilot policy in China, ECER policy is a new exploration to promote ECER with cities as the carriers, which is original and representative. As for the effect of the ECER policy, a few studies have evaluated it from the aspects of technological innovation and pollutant discharge [6,35] and found many meaningful insights. For example, the most relevant studies discussed the single impact of ECER policy on TCEs [36,68]. However, few studies have directly focused on the possible causal relationship between green public finance and the “dual control” of CEs. As a supplement and extension to these studies, this work analyzes the CE reduction effect of the ECER policy from the unique perspective of “dual control”.
Finally, we contribute to complementing existing theories by constructing a multidimensional theoretical analysis framework. Specifically, we further clarify the relationship between green public finance and CEs. Existing studies on whether fiscal policy is conducive to promoting low-carbon development and CE reduction have not reached a consensus [4,27,28]. Our research results show that green public finance can promote the “dual control” of CEs and creatively explore the mechanism of green public finance affecting CEs through three channels: the structural effect, the technique effect, and the efficiency effect. These theoretical discussions not only enrich the existing relevant research theories but also provide valuable theoretical references for future research.

7.3. Practical Implications

The implications of this study hold significant value for policymakers and local governments. First, they strengthen the leadership of ECER demonstration cities in promoting low-carbon development, especially by highlighting the ecological benefits of green public finance. According to the benchmark regression results, the ECER policy demonstrates a significant capability to achieve “dual control” of CEs. To ensure the continuous decline of CEs and provide an inexhaustible driving force for achieving “dual control”, it is imperative that we expand the scope of ECER demonstration cities. Furthermore, we should encourage demonstration cities at the forefront of ECER to expand new construction models, such as trying to carry out demonstration city construction at the county level.
Second, they accelerate formulating and deploying the overall development strategy guided by green public finance and exploring multiple channels to promote CE reduction. The mechanism tests show that the ECER policy primarily reduces CEs with the optimization of energy structure, the acceleration of green technology innovation, and the improvement of energy efficiency. Government departments should promote two-way agglomeration of technology and capital within the demonstration cities, optimize and upgrade industrial structure, and allocate resources rationally to provide the endogenous impetus for “dual control” of CEs.
Third, they expand the ECER demonstration cities’ construction and adhere to the development idea of “matching the medicine to the disease”. The heterogeneity analyses show that the CE reduction effect of the ECER policy varies in different cities. On the one hand, we should focus on expanding the breadth and depth of green public finance and promoting ECER demonstration construction cities in central, eastern, and northern regions. On the other hand, in line with the practical demands of the “carbon neutrality” strategy, the local governments of demonstration cities should promote the implementation of the ECER policy in light of their realities and the local conditions to add efforts to better the “dual control” of CEs.

7.4. Limitations and Future Directions

Although this study has important theoretical and practical implications, this study inevitably has some limitations. First, although our research results confirm that the ECER policy can promote CE reduction, this finding is based on China’s national conditions. Therefore, the conclusions of this study may lack applicability to and inclusiveness for other countries or regions. In future research, we can comprehensively consider the actual situation of each country to explain the relationship between the two from a more comprehensive perspective to make the research results universal. This limitation could be improved in future research as the concept and practice of ECER gradually evolve globally. Second, this study relies predominantly on city-level data, precluding a more comprehensive micro-level evaluation, particularly in terms of the impact of ECER policies on micro-enterprise CE reduction. Enterprises are fundamental constituents of a market economy, and a thorough understanding of how ECER policies promote ECER activities among them holds tremendous research value. In-depth exploration can be pursued in subsequent studies by analyzing microdata, which can provide valuable insights.

Author Contributions

Conceptualization, C.N., P.P. and Y.F.; methodology, C.N.; software, Y.F.; validation, C.N.; formal analysis, P.P.; investigation, P.P. and Y.F.; resources, Y.F.; data curation, C.N.; writing—original draft preparation, P.P.; writing—review and editing, C.N. and Y.F.; visualization, C.N.; supervision, P.P.; project administration, Y.F.; funding acquisition, P.P. All authors have read and agreed to the published version of the manuscript.

Funding

This research was funded by the National College Students’ Innovation and Entrepreneurship Training Program “Mechanism and Policy Research of Chinese-style Environmental Regulation Driving Synergies of the Reduction of Pollution and Carbon Emissions: Evidence from the Environmental Public Interest Litigation Pilot” [Grant Number: 202310403027].

Data Availability Statement

The datasets used in the current study are available from the corresponding author upon reasonable request.

Conflicts of Interest

The authors declare no conflicts of interest.

References

  1. Meo, M.S.; Abd Karim, M.Z. The role of green finance in reducing CO2 emissions: An empirical analysis. Borsa Istanb. Rev. 2022, 22, 169–178. [Google Scholar] [CrossRef]
  2. Capros, P.; Kannavou, M.; Evangelopoulou, S.; Petropoulos, A.; Siskos, P.; Tasios, N.; DeVita, A. Outlook of the EU energy system up to 2050: The case of scenarios prepared for European Commission’s “clean energy for all Europeans” package using the PRIMES model. Energy Strategy Rev. 2018, 22, 255–263. [Google Scholar] [CrossRef]
  3. Bai, X.; Zhong, J.; Huang, D. Economic instruments for natural resource efficiency: The role of carbon taxation and fiscal policy. Resour. Policy 2024, 89, 104614. [Google Scholar] [CrossRef]
  4. Li, S.; Samour, A.; Irfan, M.; Ali, M. Role of renewable energy and fiscal policy on trade adjusted carbon emissions: Evaluating the role of environmental policy stringency. Renew. Energy 2023, 205, 156–165. [Google Scholar] [CrossRef]
  5. Ahmed, Z.; Cary, M.; Shahbaz, M.; Vo, X.V. Asymmetric nexus between economic policy uncertainty, renewable energy technology budgets, and environmental sustainability: Evidence from the United States. J. Clean. Prod. 2021, 313, 127723. [Google Scholar] [CrossRef]
  6. Lin, B.; Zhu, J. Impact of energy saving and emission reduction policy on urban sustainable development: Empirical evidence from China. Appl. Energy 2019, 239, 12–22. [Google Scholar] [CrossRef]
  7. Nie, C.; Li, R.; Feng, Y.; Chen, Z. The impact of China’s energy saving and emission reduction demonstration city policy on urban green technology innovation. Sci. Rep. 2023, 13, 15168. [Google Scholar] [CrossRef] [PubMed]
  8. Wang, Z.; Qiu, S. Can “energy saving and emission reduction” demonstration city selection actually contribute to pollution abatement in China? Sustain. Prod. Consum. 2021, 27, 1882–1902. [Google Scholar] [CrossRef]
  9. Dong, Z.; Wang, S.; Zhang, W.; Shen, H. The dynamic effect of environmental regulation on firms’ energy consumption behavior-Evidence from China’s industrial firms. Renew. Sustain. Energy Rev. 2022, 156, 111966. [Google Scholar] [CrossRef]
  10. Feng, S.; Zhang, R.; Li, G. Environmental decentralization, digital finance and green technology innovation. Struct. Chang. Econ. Dyn. 2022, 61, 70–83. [Google Scholar] [CrossRef]
  11. Fan, W.; Wang, F.; Liu, S.; Chen, T.; Bai, X.; Zhang, Y. How does financial and manufacturing co-agglomeration affect environmental pollution? Evidence from China. J. Environ. Manag. 2023, 325, 116544. [Google Scholar] [CrossRef] [PubMed]
  12. Jorgenson, A.K.; Fiske, S.; Hubacek, K.; Li, J.; McGovern, T.; Rick, T.; Zycherman, A. Social science perspectives on drivers of and responses to global climate change. Wiley Interdiscip. Rev. Clim. Chang. 2019, 10, e554. [Google Scholar] [CrossRef]
  13. Chen, L.; Msigwa, G.; Yang, M.; Osman, A.I.; Fawzy, S.; Rooney, D.W.; Yap, P.S. Strategies to achieve a carbon neutral society: A review. Environ. Chem. Lett. 2022, 20, 2277–2310. [Google Scholar] [CrossRef] [PubMed]
  14. Safi, A.; Wei, X.; Sansaloni, E.M.; Umar, M. Breaking down the complexity of sustainable development: A focus on resources, economic complexity, and innovation. Resour. Policy 2023, 83, 103746. [Google Scholar] [CrossRef]
  15. Liu, X.; Cifuentes-Faura, J.; Zhao, S.; Wang, L. Government environmental attention and carbon emissions governance: Firm-level evidence from China. Econ. Anal. Policy 2023, 80, 121–142. [Google Scholar] [CrossRef]
  16. Li, J.; Dong, K.; Wang, K.; Dong, X. How does natural resource dependence influence carbon emissions? The role of environmental regulation. Resour. Policy 2023, 80, 103268. [Google Scholar] [CrossRef]
  17. Zhao, H.; Chen, S.; Zhang, W. Does digital inclusive finance affect urban carbon emission intensity: Evidence from 285 cities in China. Cities 2023, 142, 104552. [Google Scholar] [CrossRef]
  18. Zhang, L.; Mu, R.; Zhan, Y.; Yu, J.; Liu, L.; Yu, Y.; Zhang, J. Digital economy, energy efficiency, and carbon emissions: Evidence from provincial panel data in China. Sci. Total Environ. 2022, 852, 158403. [Google Scholar] [CrossRef] [PubMed]
  19. Lee, C.C.; Yuan, Y.; Wen, H. Can digital economy alleviate CO2 emissions in the transport sector? Evidence from provincial panel data in China. In Natural Resources Forum; Blackwell Publishing Ltd.: Oxford, UK, 2022; Volume 46, pp. 289–310. [Google Scholar] [CrossRef]
  20. Su, H.N.; Moaniba, I.M. Does innovation respond to climate change? Empirical evidence from patents and greenhouse gas emissions. Technol. Forecast. Soc. Chang. 2017, 122, 49–62. [Google Scholar] [CrossRef]
  21. Chen, H.; Yi, J.; Chen, A.; Peng, D.; Yang, J. Green technology innovation and CO2 emission in China: Evidence from a spatial-temporal analysis and a nonlinear spatial durbin model. Energy Policy 2023, 172, 113338. [Google Scholar] [CrossRef]
  22. Khattak, S.I.; Ahmad, M.; ul Haq, Z.; Shaofu, G.; Hang, J. On the goals of sustainable production and the conditions of environmental sustainability: Does cyclical innovation in green and sustainable technologies determine carbon dioxide emissions in G-7 economies. Sustain. Prod. Consum. 2022, 29, 406–420. [Google Scholar] [CrossRef]
  23. Umar, M.; Safi, A. Do green finance and innovation matter for environmental protection? A case of OECD economies. Energy Econ. 2023, 119, 106560. [Google Scholar] [CrossRef]
  24. Zhang, M.; Liu, Y. Influence of digital finance and green technology innovation on China’s carbon emission efficiency: Empirical analysis based on spatial metrology. Sci. Total Environ. 2022, 838, 156463. [Google Scholar] [CrossRef] [PubMed]
  25. Miao, N.; Sharif, A.; Ozturk, I.; Razzaq, A. How do the exploitation of natural resources and fiscal policy affect green growth? Moderating role of ecological governance in G7 countries. Resour. Policy 2023, 85, 103911. [Google Scholar] [CrossRef]
  26. Chishti, M.Z.; Ahmad, M.; Rehman, A.; Khan, M.K. Mitigations pathways towards sustainable development: Assessing the influence of fiscal and monetary policies on carbon emissions in BRICS economies. J. Clean. Prod. 2021, 292, 126035. [Google Scholar] [CrossRef]
  27. Kamal, M.; Usman, M.; Jahanger, A.; Balsalobre-Lorente, D. Revisiting the role of fiscal policy, financial development, and foreign direct investment in reducing environmental pollution during globalization mode: Evidence from linear and nonlinear panel data approaches. Energies 2021, 14, 6968. [Google Scholar] [CrossRef]
  28. Lv, Y.; Pang, Y.; Doğan, B. The role of Chinese fiscal decentralization in the governance of carbon emissions: Perspectives from spatial effects decomposition and its heterogeneity. Ann. Reg. Sci. 2022, 68, 635–668. [Google Scholar] [CrossRef]
  29. Dong, W.; Hou, X.; Qin, G. Research on the Carbon Emission Reduction Effect of Green Taxation under China’s Fiscal Decentralization. Sustainability 2023, 15, 4591. [Google Scholar] [CrossRef]
  30. Yamaguchi, R.; Managi, S. New financing for sustainable development: The case for NNP-or inclusive wealth–linked bonds. J. Environ. Dev. 2017, 26, 214–239. [Google Scholar] [CrossRef]
  31. Wang, Y.; Yu, L. Can the current environmental tax rate promote green technology innovation?-Evidence from China’s resource-based industries. J. Clean. Prod. 2021, 278, 123443. [Google Scholar] [CrossRef]
  32. Fang, M.; Chang, C.L. Nexus between fiscal imbalances, green fiscal spending, and green economic growth: Empirical findings from E-7 economies. Econ. Chang. Restruct. 2022, 55, 2423–2443. [Google Scholar] [CrossRef]
  33. Hussain, J.; Lee, C.C.; Chen, Y. Optimal green technology investment and emission reduction in emissions generating companies under the support of green bond and subsidy. Technol. Forecast. Soc. Chang. 2022, 183, 121952. [Google Scholar] [CrossRef]
  34. Sun, Y.; Razzaq, A. Composite fiscal decentralisation and green innovation: Imperative strategy for institutional reforms and sustainable development in OECD countries. Sustain. Dev. 2022, 30, 944–957. [Google Scholar] [CrossRef]
  35. Zhu, Y.; Han, S.; Zhang, Y.; Huang, Q. Evaluating the effect of government emission reduction policy: Evidence from demonstration cities in China. Int. J. Environ. Res. Public Health 2021, 18, 4649. [Google Scholar] [CrossRef] [PubMed]
  36. Xu, T.; Kang, C.; Zhang, H. China’s efforts towards carbon neutrality: Does energy-saving and emission-reduction policy mitigate carbon emissions? J. Environ. Manag. 2022, 316, 115286. [Google Scholar] [CrossRef] [PubMed]
  37. Locke, E.A.; Latham, G.P. Building a practically useful theory of goal setting and task motivation: A 35-year odyssey. Am. Psychol. 2002, 57, 705. [Google Scholar] [CrossRef] [PubMed]
  38. Li, H.; Wang, J.; Wang, S. The impact of energy tax on carbon emission mitigation: An integrated analysis using CGE and SDA. Sustainability 2022, 14, 1087. [Google Scholar] [CrossRef]
  39. Renström, T.I.; Spataro, L.; Marsiliani, L. Can subsidies rather than pollution taxes break the trade-off between economic output and environmental protection? Energy Econ. 2021, 95, 105084. [Google Scholar] [CrossRef]
  40. Zhang, D.; Vigne, S.A. The causal effect on firm performance of China’s financing–pollution emission reduction policy: Firm-level evidence. J. Environ. Manag. 2021, 279, 111609. [Google Scholar] [CrossRef]
  41. Chen, Y.; Shao, S.; Fan, M.; Tian, Z.; Yang, L. One man’s loss is another’s gain: Does clean energy development reduce CO2 emissions in China? Evidence based on the spatial Durbin model. Energy Econ. 2022, 107, 105852. [Google Scholar] [CrossRef]
  42. Kurramovich, K.K.; Abro, A.A.; Vaseer, A.I.; Khan, S.U.; Ali, S.R.; Murshed, M. Roadmap for carbon neutrality: The mediating role of clean energy development-related investments. Environ. Sci. Pollut. Res. 2022, 29, 34055–34074. [Google Scholar] [CrossRef] [PubMed]
  43. Yan, Z.; Sun, Z.; Shi, R.; Zhao, M. Smart city and green development: Empirical evidence from the perspective of green technological innovation. Technol. Forecast. Soc. Chang. 2023, 191, 122507. [Google Scholar] [CrossRef]
  44. Xu, L.; Fan, M.; Yang, L.; Shao, S. Heterogeneous green innovations and carbon emission performance: Evidence at China’s city level. Energy Econ. 2021, 99, 105269. [Google Scholar] [CrossRef]
  45. Ghisetti, C.; Rennings, K. Environmental innovations and profitability: How does it pay to be green? An empirical analysis on the German innovation survey. J. Clean. Prod. 2014, 75, 106–117. [Google Scholar] [CrossRef]
  46. Akram, R.; Chen, F.; Khalid, F.; Ye, Z.; Majeed, M.T. Heterogeneous effects of energy efficiency and renewable energy on carbon emissions: Evidence from developing countries. J. Clean. Prod. 2020, 247, 119122. [Google Scholar] [CrossRef]
  47. Wang, B.; Yu, M.; Zhu, Y.; Bao, P. Unveiling the driving factors of carbon emissions from industrial resource allocation in China: A spatial econometric perspective. Energy Policy 2021, 158, 112557. [Google Scholar] [CrossRef]
  48. Jing, Q.; Bai, H.; Luo, W.; Cai, B.; Xu, H. A top-bottom method for city-scale energy-related CO2 emissions estimation: A case study of 41 Chinese cities. J. Clean. Prod. 2018, 202, 444–455. [Google Scholar] [CrossRef]
  49. Shan, Y.; Guan, D.; Liu, J.; Mi, Z.; Liu, Z.; Liu, J.; Zhang, Q. Methodology and applications of city level CO2 emission accounts in China. J. Clean. Prod. 2017, 161, 1215–1225. [Google Scholar] [CrossRef]
  50. Liu, Z.; Guan, D.; Wei, W.; Davis, S.J.; Ciais, P.; Bai, J.; He, K. Reduced carbon emission estimates from fossil fuel combustion and cement production in China. Nature 2015, 524, 335–338. [Google Scholar] [CrossRef]
  51. Tao, M.; Sheng, M.S.; Wen, L. How does financial development influence carbon emission intensity in the OECD countries: Some insights from the information and communication technology perspective. J. Environ. Manag. 2023, 335, 117553. [Google Scholar] [CrossRef]
  52. Ahmad, N.; Du, L.; Lu, J.; Wang, J.; Li, H.Z.; Hashmi, M.Z. Modelling the CO2 emissions and economic growth in Croatia: Is there any environmental Kuznets curve? Energy 2017, 123, 164–172. [Google Scholar] [CrossRef]
  53. Shen, B.; Yang, X.; Xu, Y.; Ge, W.; Liu, G.; Su, X.; Ran, Q. Can carbon emission trading pilot policy drive industrial structure low-carbon restructuring: New evidence from China. Environ. Sci. Pollut. Res. 2023, 30, 41553–41569. [Google Scholar] [CrossRef] [PubMed]
  54. Razzaq, A.; Sharif, A.; Ozturk, I.; Yang, X. Central inspections of environmental protection and transition for low-carbon Chinese cities: Policy intervention and mechanism analysis. Energy Econ. 2023, 124, 106859. [Google Scholar] [CrossRef]
  55. Umar, M.; Mirza, N.; Hasnaoui, J.A.; Rochoń, M.P. The nexus of carbon emissions, oil price volatility, and human capital efficiency. Resour. Policy 2022, 78, 102876. [Google Scholar] [CrossRef]
  56. Zhang, Y.; Wang, F.; Zhang, B. The impacts of household structure transitions on household carbon emissions in China. Ecol. Econ. 2023, 206, 107734. [Google Scholar] [CrossRef]
  57. Balsalobre-Lorente, D.; Driha, O.M.; Halkos, G.; Mishra, S. Influence of growth and urbanization on CO2 emissions: The moderating effect of foreign direct investment on energy use in BRICS. Sustain. Dev. 2022, 30, 227–240. [Google Scholar] [CrossRef]
  58. Musah, M.; Mensah, I.A.; Alfred, M.; Mahmood, H.; Murshed, M.; Omari-Sasu, A.Y.; Coffie CP, K. Reinvestigating the pollution haven hypothesis: The nexus between foreign direct investments and environmental quality in G-20 countries. Environ. Sci. Pollut. Res. 2022, 29, 31330–31347. [Google Scholar] [CrossRef] [PubMed]
  59. Huang, L.; Krigsvoll, G.; Johansen, F.; Liu, Y.; Zhang, X. Carbon emission of global construction sector. Renew. Sustain. Energy Rev. 2018, 81, 1906–1916. [Google Scholar] [CrossRef]
  60. Nie, C.; Ye, S.; Feng, Y. Place-based policy and urban green technology innovation: Evidence from the revitalization of old revolutionary base areas in China. Econ. Anal. Policy 2024, 81, 1257–1272. [Google Scholar] [CrossRef]
  61. Hainmueller, J. Entropy balancing for causal effects: A multivariate reweighting method to produce balanced samples in observational studies. Political Anal. 2012, 20, 25–46. [Google Scholar] [CrossRef]
  62. Feng, Y.; Nie, C. The effect of government informatization construction on corporate digital technology innovation: New evidence from China. Bus. Ethics Environ. Responsib. 2024, 33, 1–20. [Google Scholar] [CrossRef]
  63. Zeng, S.; Jin, G.; Tan, K.; Liu, X. Can low-carbon city construction reduce carbon intensity? Empirical evidence from low-carbon city pilot policy in China. J. Environ. Manag. 2023, 332, 117363. [Google Scholar] [CrossRef] [PubMed]
  64. Feng, Y.; Nie, C. Re-examining the effect of China’s new-energy demonstration cities construction policy on environmental pollution: A perspective of pollutant emission intensity control. J. Environ. Plan. Manag. 2022, 65, 2333–2361. [Google Scholar] [CrossRef]
  65. Chakraborty, P.; Chatterjee, C. Does environmental regulation indirectly induce upstream innovation? New evidence from India. Res. Policy 2017, 46, 939–955. [Google Scholar] [CrossRef]
  66. Ye, Y.; Ye, S.; Yu, H. Can industrial collaborative agglomeration reduce haze pollution? City-level empirical evidence from China. Int. J. Environ. Res. Public Health 2021, 18, 1566. [Google Scholar] [CrossRef] [PubMed]
  67. Luo, Y.; Salman, M.; Lu, Z. Heterogeneous impacts of environmental regulations and foreign direct investment on green innovation across different regions in China. Sci. Total Environ. 2021, 759, 143744. [Google Scholar] [CrossRef] [PubMed]
  68. Shi, M.; Wang, Y. Do Green Transfer Payments Contribute to Carbon Emission Reduction? Sustainability 2023, 15, 4021. [Google Scholar] [CrossRef]
  69. Seto, K.C.; Davis, S.J.; Mitchell, R.B.; Stokes, E.C.; Unruh, G.; Ürge-Vorsatz, D. Carbon lock-in: Types, causes, and policy implications. Annu. Rev. Environ. Resour. 2016, 41, 425–452. [Google Scholar] [CrossRef]
  70. Liu, J.; Yang, Q.; Ou, S.; Liu, J. Factor decomposition and the decoupling effect of carbon emissions in China’s manufacturing high-emission subsectors. Energy 2022, 248, 123568. [Google Scholar] [CrossRef]
  71. Yu, J.; Zhou, L.A.; Zhu, G. Strategic interaction in political competition: Evidence from spatial effects across Chinese cities. Reg. Sci. Urban Econ. 2016, 57, 23–37. [Google Scholar] [CrossRef]
Figure 1. Theoretical analysis framework.
Systems 12 00123 g001
Figure 2. The distribution of ECER demonstration cities.
Systems 12 00123 g002
Figure 3. Parallel trend test of CO2_total (left) and CO2_intensity (right). Note: The pink squares denote the coefficients, and the green lines denote their 90% confidence intervals; the vertical orange line represents the base group (i.e., t = −1), and the horizontal orange line represents coefficient of 0.
Systems 12 00123 g003
Figure 4. PSM balance test results.
Systems 12 00123 g004
Figure 5. Placebo test of CO2_total (left) and CO2_intensity (right).
Systems 12 00123 g005
Table 1. Measurement methods for control variables.
Control VariablesDefinitionsMeasurement Methods
PGDPEconomic developmentLogarithm of real GDP per capita
PGDP2Square term of economic developmentSquare term of logarithm real GDP per capita
INDUSIndustrial structureAdded value of secondary industries/added value of tertiary industries
GOVGovernment interventionGovernment expenditure/GDP
HCHuman capitalNumber of college students per 104 people
POPPopulation sizeNature logarithm of urban population
FINFinancial developmentBalance of deposits and loans of financial institutions/GDP
FDIForeign direct investmentTotal foreign direct investment/GDP
ROADInfrastructure constructionRoad area per capita
Table 2. Descriptive statistics.
VariablesObsMeanSdMinMax
CO2_total38646.00151.15762.019010.0372
CO2_intensity3864−1.08410.8012−3.78314.3917
ECER38640.05380.22570.00001.0000
PGDP386410.26850.79767.922112.9535
PGDP23864106.077216.623862.7591167.7935
INDUS38640.91330.50110.09435.1683
GOV38640.17820.09590.04261.4852
HC3864176.4705232.84860.00001311.2407
POP38645.87990.69722.86858.1362
FIN38642.23481.14560.436921.3018
FDI38640.01850.01940.00000.2101
ROAD38644.54135.90190.181273.0424
Table 3. Benchmark regression.
(1)(2)(3)(4)
CO2_TotalCO2_TotalCO2_IntensityCO2_Intensity
ECER−0.1350 ***−0.1313 ***−0.1263 ***−0.1290 ***
(0.0313)(0.0317)(0.0324)(0.0319)
PGDP 1.3502 *** −0.9451 ***
(0.2326) (0.2339)
PGDP2 −0.0527 *** 0.0004
(0.0116) (0.0116)
INDUS −0.0080 0.0430
(0.0275) (0.0277)
GOV −0.0598 0.2960 **
(0.1412) (0.1420)
HC 0.0001 −0.0001
(0.0001) (0.0001)
POP 0.7610 *** −0.9363 ***
(0.1166) (0.1173)
FIN −0.0064 0.0335 ***
(0.0108) (0.0109)
FDI −1.3632 *** −0.9855 **
(0.4301) (0.4326)
ROAD 0.0011 −0.0007
(0.0029) (0.0030)
Constant5.5888 ***−6.8902 ***−0.6232 ***13.7733 ***
(0.0179)(1.6466)(0.0185)(1.6559)
City FE/Year FE
N3864386438643864
R20.34430.35980.40450.4495
Note: Robust standard errors in parentheses. ** p < 0.05, *** p < 0.01.
Table 4. PSM-DID estimation.
(1)(2)(3)(4)
CO2_TotalCO2_TotalCO2_IntensityCO2_Intensity
ECER−0.1130 ***−0.1207 ***−0.1180 ***−0.1229 ***
(0.0311)(0.0314)(0.0326)(0.0317)
Control variables
City FE/Year FE
N3720372037203720
R20.33840.35190.42280.4768
Note: Robust standard errors in parentheses. *** p < 0.01.
Table 5. Entropy balancing estimation.
(1)(2)(3)(4)
CO2_TotalCO2_TotalCO2_IntensityCO2_Intensity
ECER−0.1048 ***−0.0997 ***−0.0939 ***−0.0921 ***
(0.0149)(0.0151)(0.0166)(0.0153)
Control variables
City FE/Year FE
N3864386438643864
R20.96170.96250.86530.8899
Note: Robust standard errors in parentheses. *** p < 0.01.
Table 6. Controlling the impact of other environmental policies.
(1)(2)(3)(4)(5)(6)
CO2_TotalCO2_TotalCO2_TotalCO2_IntensityCO2_IntensityCO2_Intensity
ECER−0.1349 ***−0.1311 ***−0.1347 ***−0.1306 ***−0.1290 ***−0.1305 ***
(0.0319)(0.0318)(0.0319)(0.0321)(0.0319)(0.0321)
CARBON_TRADING0.0300 0.03150.0130 0.0137
(0.0292) (0.0296)(0.0293) (0.0298)
LOW_CARBON −0.0025−0.0061 −0.0014−0.0030
(0.0200)(0.0203) (0.0201)(0.0204)
Control variables
City FE/Year FE
N386438643864386438643864
R20.36000.35980.36000.44960.44950.4496
Note: Robust standard errors in parentheses. *** p < 0.01.
Table 7. Controlling additional covariates.
(1)(2)(3)(4)(5)(6)
CO2_TotalCO2_TotalCO2_TotalCO2_IntensityCO2_IntensityCO2_Intensity
ECER−0.1628 ***−0.1094 ***−0.1373 ***−0.1541 ***−0.1004 ***−0.1249 ***
(0.0336)(0.0322)(0.0338)(0.0335)(0.0321)(0.0335)
Control variables
t × Control variables
Province–Year FE
City FE/Year FE
N386438643864386438643864
R20.44560.36670.45310.53240.46370.5433
Note: Robust standard errors in parentheses. *** p < 0.01.
Table 8. Structure effect.
(1)(2)(3)
ESCO2_TotalCO2_Intensity
ECER−2.4755 ***−0.1226 ***−0.1211 ***
(0.8884)(0.0316)(0.0318)
ES 0.0035 ***0.0032 ***
(0.0006)(0.0006)
Control variables
City FE/Year FE
N386438643864
R20.13250.36590.4540
Note: Robust standard errors in parentheses. *** p < 0.01.
Table 9. Technique effect.
(1)(2)(3)
GINNOCO2_TotalCO2_Intensity
ECER0.2513 ***−0.1279 ***−0.1198 ***
(0.0802)(0.0318)(0.0318)
GINNO −0.0135 **−0.0369 ***
(0.0066)(0.0066)
Control variables
City FE/Year FE
N386438643864
R20.44710.36050.4543
Note: Robust standard errors in parentheses. ** p < 0.05, *** p < 0.01.
Table 10. Efficiency effect.
(1)(2)(3)
EFFCO2_TotalCO2_Intensity
ECER−0.0203 ***−0.0787 ***−0.0706 **
(0.0043)(0.0298)(0.0295)
EFF 2.5884 ***2.8776 ***
(0.1160)(0.1148)
Control variables
City FE/Year FE
N386438643864
R20.22590.43830.5320
Note: Robust standard errors in parentheses. ** p < 0.05, *** p < 0.01.
Table 11. Heterogeneity of geographic location (eastern–central–western).
(1)(2)(3)(4)(5)(6)
EasternCentralWesternEasternCentralWestern
CO2_TotalCO2_TotalCO2_TotalCO2_IntensityCO2_IntensityCO2_Intensity
ECER−0.0895 **−0.1021 **−0.2374 ***−0.0897 **−0.0953 **−0.2575 ***
(0.0390)(0.0467)(0.0846)(0.0400)(0.0468)(0.0833)
Control variables
City FE/Year FE
N140013441120140013441120
R20.52870.42140.30750.47590.65890.3734
Note: Robust standard errors in parentheses. ** p < 0.05, *** p < 0.01.
Table 12. Heterogeneity of geographic location (southern–northern).
(1)(2)(3)(4)
SouthernNorthernSouthernNorthern
CO2_TotalCO2_TotalCO2_IntensityCO2_Intensity
ECER−0.0431−0.2074 ***−0.0522−0.2231 ***
(0.0411)(0.0489)(0.0412)(0.0487)
Control variables
City FE/Year FE
N2086177820861778
R20.40200.34740.55800.3555
Note: Robust standard errors in parentheses. *** p < 0.01.
Table 13. Heterogeneity of administrative level.
(1)(2)(3)(4)
HighLowHighLow
CO2_TotalCO2_TotalCO2_IntensityCO2_Intensity
ECER−0.0079−0.1673 ***−0.0182−0.1354 ***
(0.0323)(0.0408)(0.0353)(0.0409)
Control variables
City FE/Year FE
N49033744903374
R20.58680.35250.79360.4130
Note: Robust standard errors in parentheses. *** p < 0.01.
Table 14. Heterogeneity of financial strength.
(1)(2)(3)(4)
StrongWeakStrongWeak
CO2_TotalCO2_TotalCO2_IntensityCO2_Intensity
ECER−0.0331−0.1490 ***−0.0131−0.1553 ***
(0.0663)(0.0351)(0.0666)(0.0351)
Control variables
City FE/Year FE
N1932193219321932
R20.35430.40900.41600.5182
Note: Robust standard errors in parentheses. *** p < 0.01.
Disclaimer/Publisher’s Note: The statements, opinions and data contained in all publications are solely those of the individual author(s) and contributor(s) and not of MDPI and/or the editor(s). MDPI and/or the editor(s) disclaim responsibility for any injury to people or property resulting from any ideas, methods, instructions or products referred to in the content.

