Article

Dynamic Mechanism of Destination Brand Diffusion: Agent-Based Modeling and Simulation

1
School of Economics and Management, University of Chinese Academy of Sciences, Beijing 100190, China
2
Sino-Danish College, University of Chinese Academy of Sciences, Beijing 100190, China
3
School of Economics and Management, Beijing Information Science and Technology University, Beijing 100192, China
*
Author to whom correspondence should be addressed.
Systems 2024, 12(4), 124; https://doi.org/10.3390/systems12040124
Submission received: 22 February 2024 / Revised: 23 March 2024 / Accepted: 3 April 2024 / Published: 7 April 2024
(This article belongs to the Section Systems Practice in Social Science)

Abstract

:
In recent years, social media has emerged as an important channel for the dissemination of destination branding. Despite the fact that the dissemination of information through social media enables a broader audience to become acquainted with destinations, the dissemination process of trending events exhibits variances. Consequently, the precise impact of the underlying mechanisms that govern the spread of information on the efficacy of disseminating destination brand trending events remains ambiguous. In an endeavor to bridge this gap, an improved SEIR model was developed in this research to investigate the dynamic dissemination mechanisms and influencing factors of destination trending events within social media. The model was applied to simulate the diffusion mechanism of destinations’ trending events. The results show that during the dissemination process of destination trending events on social media, the proportion of users affected at different stages influences the ultimate effectiveness of information propagation. In light of these insights, this research proposes a social media trending event dissemination strategy to aid in enhancing the propagation efficiency of destination brands through existing resources.

1. Introduction

The number of internet users is growing year by year due to the popularity of electronic devices such as computers and smart phones and the modernization of countries worldwide. By October 2023, the global count of internet users had reached 5.3 billion, constituting 65.7% of the worldwide population. Out of these, 4.95 billion people, accounting for 61.4% of the world’s population, were identified as active participants on various social media platforms [1]. The popularity of social media can be attributed to its capabilities in enabling connections, sharing information, creating communities, providing entertainment, offering business prospects, and supporting interactions in real time [2]. The core of information dissemination within the realm of social media is underpinned by its extensive user base. The popularity of social media has increased the effectiveness of information dissemination as well as the activity of the audience. Therefore, we need to pay attention to the mechanism of the dissemination of information in social media.
Social media platforms empower users to generate content and interact with each other on different topics [3]. There is a shift from traditional one-way communication between information and users to two-way communication among much more information and many users. Because social media contains so much information and so many users, it has become a prime destination for trending events to break out. Therefore, social media has ascended as a significant channel for many destinations to promote their brands. An increasing number of tourists are searching for information about destinations on social media [4]. According to a study by Statista, 75% of participants cited social media as a source of inspiration for their travel plans [5]. This illustrates the importance of social media communication for destination brand diffusion. Accordingly, understanding the information dissemination mechanism of social media helps destination brands to better utilize this online channel and combine it with the dissemination of hot events, which can strengthen the influence of the brands.
From a theoretical perspective, destinations serve as the fundamental setting for tourism-related activities, a domain that is attracting increasing scholarly attention [6]. While it has developed a variety of distinct research themes and lines of reasoning [7], it has branched out from tourism studies into adjacent fields like economics and management [8]. Marketing regarding research is an important convergence in this field, such as research of destination image [9], destination marketing [6], and destination branding [10]. Avila-Robinson et al. proposed that with the wide applications of digital platforms, social media-enabled marketing strategies are vital for destination branding [11]. As social media becomes more widespread, the role of information spread through these platforms in communicating destination brands has grown in importance.
However, the phenomenon of brand diffusion via social media is characterized by its complexity and dynamic nature, presenting a landscape that is both systematic and unforeseeable. Prior research has focused on the evolving and orderly shift in subjects [12]. These studies have paid attention to the diffusion of different events, but they have not yet analyzed how one hot event is disseminated at different stages when it is communicated. Moreover, a previous study also focused on the function of social media on brand diffusion [13]. The authors considered the influencing mechanism of social media. But they ignored the influences of social media users who generate the content and networks that provide valuable insights in social media.
Therefore, the research presented in this paper aims to create an agent-based model to replicate the spread of destination-related significant events on social media and identify the determinants at various phases of event distribution. To achieve this objective, an improved SEIR model considering the secondary dissemination was developed. This aligns with the laws of information dissemination on social media. Moreover, it has not been addressed in previous studies. With the improved simulation model, this article tries to answer the following research questions:
  • RQ1: How do destination hot events diffuse on social media?
  • RQ2: What is the influence of infected rates of communicators at different stages?
The driving force for this study is to fulfill the requirement of comprehending the diffusion of destination hot events and impact of social media users at different communication stages. This study aims to bridge a notable void in current academic work by providing a simulation model that yields essential insights, thereby enhancing a competitive brand image within the destination. The contributions of this research are to enrich the existing body of literature in multiple respects. Firstly, it aims to simulate the spread of significant destination events across social media platforms, offering key insights to improve the marketing effectiveness of such events. These insights deliver practical advice for spreading the branding of destinations. Moreover, the results bring innovative contributions to the spread of information on social media by developing an improved SEIR simulation model, representing a pioneering effort in this area. Secondly, this study introduces two research questions. These questions are crucial for understanding the dissemination of destination brand events on social media, especially regarding their propagation mechanisms and influencing factors.
According to the analysis above, the subsequent sections of this paper are structured as follows. Section 2 summarizes the research related to destination branding and destination brand diffusion, and we also conclude the model of information dissemination. Section 3 introduces the methodology used in this research and description of data. And then, Section 4 explains a diffusion model based on the laws of destination brand diffusion in social media. Section 5 investigates the factors that influence the dissemination outcomes as well as the degree of influence in the whole process of destination brand diffusion. Also, we further validate the model’s match in reality based on real cases. Finally, Section 6 summarizes the principal findings, which focus on analyzing the impact of the different stages of the model on brand diffusion and the shortcomings of this paper.

2. Literature Review

2.1. Destination Brand

The concept of a destination encompasses both geographical boundaries and management systems. There exists a competitive landscape among various destinations [14]. The construct of destination branding pertains to the application of marketing strategies for the promotion of a city or region, integrating these methodologies within the broader communicative efforts of the destination. According to Zenker and Braun, destination branding involves tourists’ perceptions of a location, including the objectives, values, messaging, and the collective culture of the destination’s stakeholders and designers [15]. This process is pivotal in crafting a distinct destination image and augmenting the competitive edge of the locale. A favorable brand image is instrumental in elevating the profile of the destination brand [16], with the destination’s image playing a crucial role in influencing tourists’ decision-making processes [17]. The establishment of a positive destination brand is contingent upon a strategic brand strategy that ensures robust brand positioning, thereby affording the region a unique competitive advantage and distinguishing it from rivals. Nevertheless, the endeavor of destination branding is rendered intricate by the intrinsic characteristics of destinations that diverge from conventional products or services [18]. The challenge for marketers, therefore, lies in the effective transmission of the destination’s message to forge a competitive brand identity, a task that presents significant complexities [19].
With the development of social media, the dissemination of information through these platforms has crystallized as a vital mechanism for the promotion of destination brands. Previous research has shown that the media plays an important role in building destination brands and forming relationship networks with tourists [20]. At present, social media has emerged as an effective tool for destination brands [21]. This attribute of social media facilitates unrestricted access to destination information, permitting users to engage with content irrespective of their physical location or the time [22]. Moreover, the interactive features of social media (e.g., likes, forwards, and comments) can potentiate the efficacy of information dissemination among users. This interaction fosters a diffusion network that accelerates the spread of information [23]. Information diffusion consists of a sequence of events related to specific topics that can impact the images of destination brands [24].
Scholars have paid close attention to information dissemination in social media when studying destination branding, including the utilization of social media micro-film marketing by destinations [25], an exploration of the characteristics and underlying motivations that propel the public to engage in the sharing of electronic word-of-mouth (eWOM) concerning destinations [26], and investigation into the evolution of destination image as shaped by social media commentary [27]. However, few studies have focused on the communication mechanisms of destination brand marketing events on social media platforms and the influencing factors, especially in-depth analyses of the dynamics of information dissemination based on the user perspective.

2.2. Destination Brand Diffusion

Social media has changed the modalities of information dissemination and the mechanisms through which users engage with such information. As a result, it provides new channels for brand communication [28]. In social media, users exchange information on the platform. On one hand, users express their opinions by posting information. On the other hand, users access requisite information ubiquitously and at their convenience. Therefore, users are both sharers and disseminators of information. This has led to an explosion of information within social media [29]. Furthermore, this also creates a diffusion network that accelerates the spread of information [23]. The diffusion of information through online social networks has emerged as a vibrant area of research encompassing disciplines such as computer science, psychology, sociology, and epidemiology, among others [30]. Typically, social networks consist of two primary elements: the user and the contagion they share. These are invariably linked with myriad factors that affect the process of information diffusion through online social networks [31,32]. Consequently, epidemiological models are frequently utilized in the field of information diffusion, particularly in the analysis of social media [33,34].
For destination brands, information diffusion is characterized by a series of events that may affect the image of the brands [24]. Due to the multiplicity of interaction points in social media and the difficulty of controlling them, it results in more uncertainty [13]. Therefore, in previous studies, scholars have mainly focused on the impact of brand events and factors that influence brand image, such as opinion leaders’ influence [35]. However, few studies have analyzed the construction of destination brands in terms of the dynamic process and mechanism of information diffusion. A thorough comprehension of the diffusion mechanism of information on social media, alongside the identification of influential factors can help destinations better utilize online platforms, can improve dissemination efficiency and establish a stronger brand image.

2.3. Information Dissemination Model

The key to studying the information dissemination process is to build appropriate models. Current models on information dissemination include SIR (susceptible infected removed), SIS [36] (susceptible infected susceptible), SI [37] (susceptible infected), SIRS (susceptible infected removed susceptible), and other epidemic models. The genesis of dynamic modeling in the context of information dissemination is attributed to the SIR model. It was proposed by Kermack and McKendrick in 1927 as a model primarily used to analyze the spread patterns of the Black Death [38]. In 1964, Goffman and Newill applied SIR to study the diffusion of communication [39]. Unlike epidemic spread, which is inexorable, the dissemination of information is subject to a multitude of subjective factors. With the progressive mature of the research in this field, scholars have evolved information dissemination models such as SEIR [40], SCIR [41], CSR [42], and SEIRS on the basis of classical models. The information dissemination mechanism of social media exhibits profound parallels to the transmission of epidemic diseases. Therefore, many scholars study the process and mechanism of information diffusion such as online public opinion, rumor dissemination, and topic dissemination based on the information dissemination dynamics model. And many related models are derived on this basis, further enriching the study of this subject.
The information dissemination dynamics model is mainly built with nonlinear dynamics methods. These models articulate the process of information dissemination and fluctuations in the population in various conditions by following the mechanism of epidemic disease diffusion. Classical SIR and SEIR models assume that individuals in a cluster are uniformly mixed. Each individual has an equal probability of being exposed to others—a premise that diverges from empirical reality [43]. In actuality, social networks exhibit both small-world and scale-free characteristics. This recognition has catalyzed a burgeoning interest among researchers to develop epidemic dynamics models based on complex networks.
In recent years the information dissemination dynamics model has gained prominence in the field of social media communication. Zhao et al. introduced the SI communication model focused on emergent blog topics. The study investigates the pattern of public opinion dissemination in emergent scenarios without considering the influence of the removers [44]. And Dong et al. used the SEIR model to study the rumor spreading process of Facebook [33]. Jiang and Yan developed a segmented SIR model to measure the velocity, breadth, and impact of the spread of online information dissemination. Their simulations revealed that the lasting influence of a message does not correlate proportionally with the quantity of its disseminators [45]. Si et al. presented the concepts of infection and incurable threshold, scrutinizing the user interaction through the lens of Bayesian updating rules [46]. Li et al. introduced a novel model for the evolution of public opinion, merging the HK (Hegselmann–Krause) opinion fusion model with the SEIR epidemic transmission model. User interests and opinion fusion are considered in the model [47]. Chen et al. integrated three distinct factors into the SEIR model and developed a model to elucidate individual state transitions to map the rumor spread process and devise containment strategies [48].
However, current approaches to modeling information dissemination have yet to adequately account for the dynamics of user engagement with trending events. This includes the probability of users beginning to engage with an event, potentially losing interest over time, and eventually disengaging from the social media environment, which translates into the dynamics of user ingress and egress. Moreover, such models overlook situations in which a decline in user interest in a trending event triggers the rise and eventual dominance of associated events, culminating in a secondary phase of dissemination for the initial event [49]. In response to these gaps, this paper proposes an improved SEIR model for the dissemination process of hot events in social media. It aims to delve into the dissemination mechanism of hot events and the influencing factors of the dissemination. This will provide a theoretical foundation for the analysis of hot event dissemination on social media.

3. Method and Data

3.1. Method

Agent-based modeling represents a research method focused on modeling and simulation from a bottom-up perspective, specifically for complex adaptive systems [50]. It is employed to mimic the behavior and interplay of autonomous agents, which may be individuals or collective entities like organizations or groups. The objective is to grasp the system’s behavior and the determinants of its outcomes [51,52].
This paper aims to scrutinize the dynamic dissemination mechanism of hot events on social media. Considering the importance of information dissemination as well as social media user interactions, it is appropriate to employ agent-based modeling approaches to explore these research questions. Accordingly, we propose an improved SEIR model based on the characteristics of hot events spreading on social media platforms. Subsequently, an agent-based model is constructed, which is able to simulate the interactions among users.

3.2. Data

In this study, we focus on the dissemination of destination brand and the diffusion patterns of related hot events on social media. We primarily collected the data of social media posts of popular tourist destinations and focused on user interactions of the events (such as likes, comments, and shares) and fluctuations in popularity. The data sources include major Chinese social media platforms such as TikTok.
With the development of social media, the magnitude of public opinion dissemination has also increased. To ensure the validity and comparability of the simulation results, we assumed a larger-scale total number of social media users, i.e., 100,000 users, potentially exposed to hot events. The initial parameters for the simulation are defined as follows: susceptible (S) at 9999, exposed (E) at 0, infected (I) at 1, recovered (R) at 0, and secondarily infected (I0) at 0. This setup aims to simulate a scenario where an hot event is disseminated in the initial stage. And based on the analysis of the diffusion cycle of hot events on social media, we set the simulation period to 10 days (240 h) to cover the lifecycle of a typical event on social media.

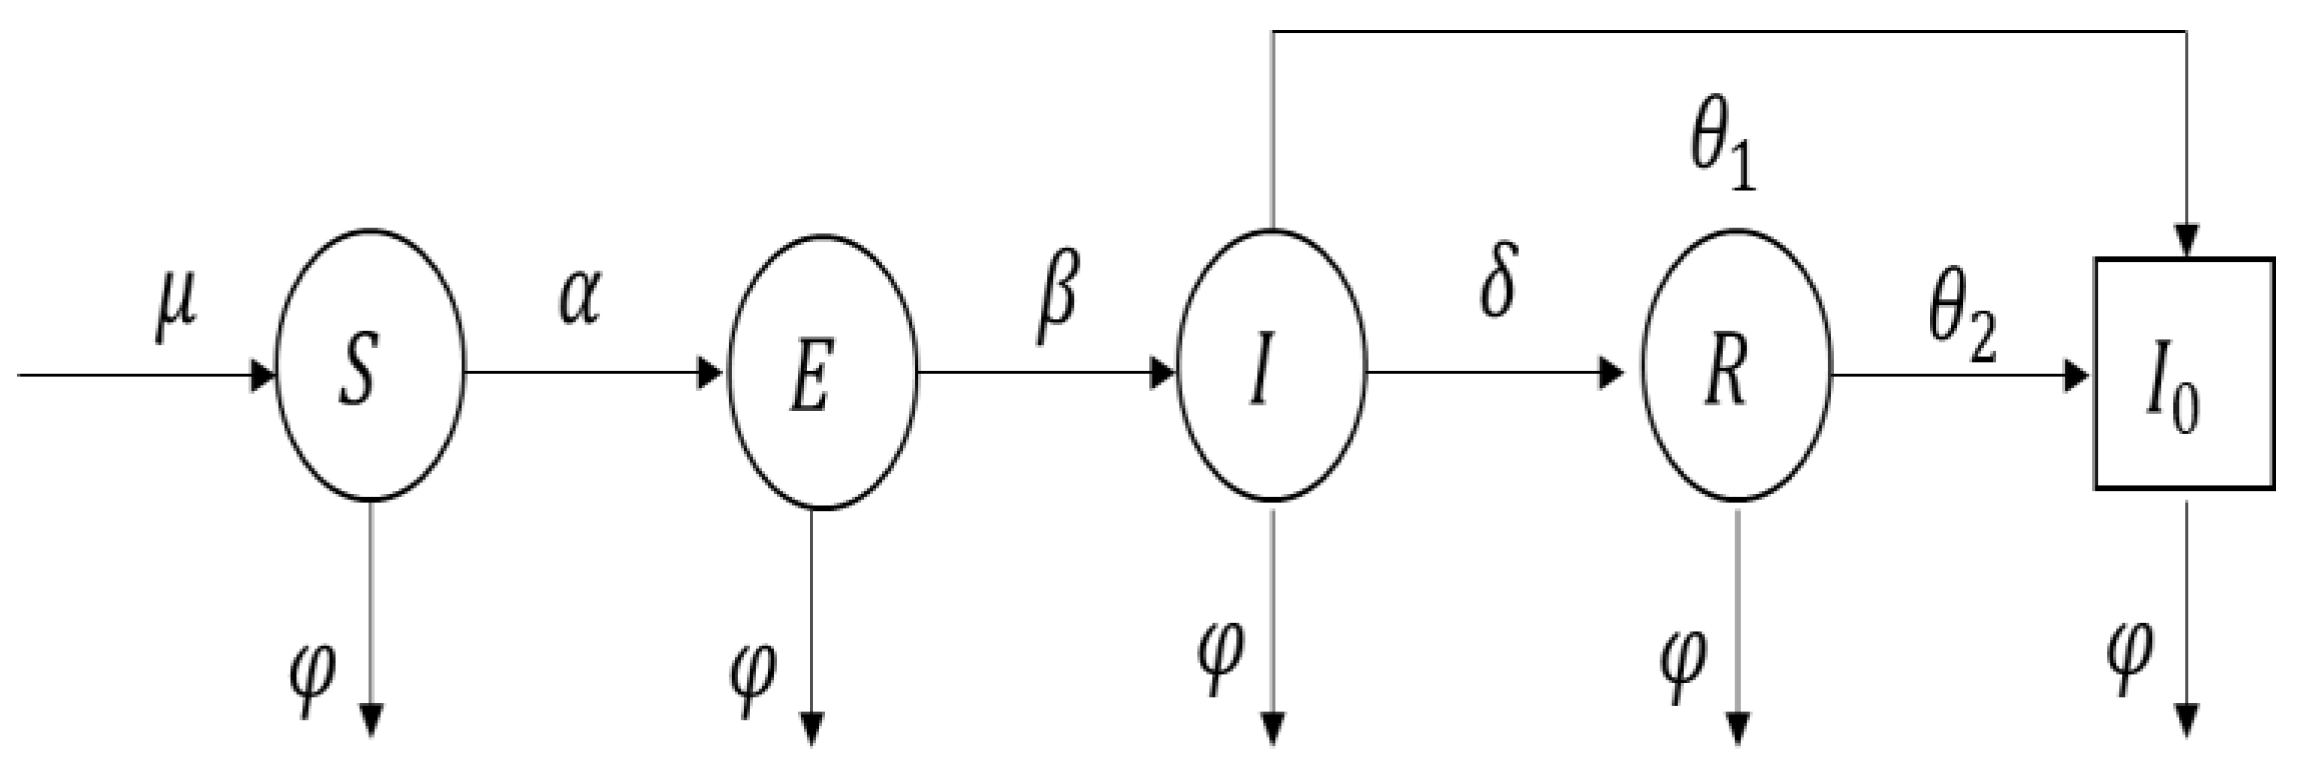
4. Model Description

In previous studies, scholars have mainly applied the SIR model to the domain of information dissemination on social media. The SIR model includes S (susceptible), I (infected), and R (recovered). The SEIR model incorporates the E (exposed) category in the SIR model. This category represents individuals who have encountered the infectious agent but have not yet commenced transmitting the information themselves. Both the SIR and SEIR models assume a certain total number of people, with the SEIR model articulating four states: S (susceptible), E (exposed), I (infected), and R (recovered). Within this model, α represents the infection rate, determining the spread rate and signifying the probability of transmission from an infectious individual to a susceptible one. β denotes the rate of incubation, indicating the speed at which latent individuals turn infectious. γ represents the recovery rate, determined by the mean period required for recovery. The diffusion path is shown in Figure 1.
Hot events may cause secondary dissemination in social media due to related events when they are spread. Moreover, the exposure of social media users to events may lead to user enrollment or exclusion. Based on this, this paper proposes an improved SEIR model. Table 1 shows how the key concepts in the SEIR model correspond to the concepts of hot event communication of destination in social media.
We assume that S(t), E(t), I(t), and R(t) are functions of t and indicate the number of users in each of the above four types of states. The number of users is assumed to be N in a certain period and remains constant throughout the information dissemination process. N ( t ) = S ( t ) + E ( t ) + I ( t ) + R ( t ) + I 0 ( t ) . Equation (1) represents the diffusion model of hot events related to destination brands on social media platforms.
S = μ N φ S α S I / N E = α S I / N ( β + φ ) E   I = β E ( θ 1 + δ + φ ) I R = δ I φ + θ 2 R I 0 = θ 1 I + θ 2 R φ I 0
The dissemination path based on the improved SEIR model is shown in Figure 2. Within this model, μ signifies the probability of users participating in social media per unit of time. φ denotes the per unit time probability of social media users disengaging from social media following exposure to the event, with such individuals not contributing to the dissemination of the trending event. In this model, α is defined as the probability of a susceptible user transitioning into lurker status. β represents the probability of a lurker evolving into a communicator and actively participating in the event dissemination. δ represents the probability of a communicator disengaging with the events and ceasing their involvement in the communication. In this research, secondary diffusion is considered. Secondary diffusion of information on social media describes the phenomenon in which information, once disseminated by an initial source, is then further shared or propagated by recipients who acquired it from the initial distribution point. This is very common on social media platforms. θ 1 represents the probability that a communicator becomes a communicator again. It means that infected individuals actively redistribute this information. This is a key characteristic of information dissemination on social media, as information can rapidly propagate among users in a recursive manner, leading to a “viral” spread of information. θ 2 represents the probability that the remover becomes a communicator for the second time. In social media, it is very common for information to be disseminated anew due to updates, the occurrence of related events, or the information becoming relevant again to users. This phenomenon often results in recovered individuals becoming infected individuals once more. Introducing θ 1 and θ 2 and considering the transition from infected and recovered individuals to secondarily infected ones allows the SEIR model to depict the dynamics of information dissemination on social media with greater precision.
In order to describe the pattern more realistically, this paper improves the SEIR model considering the user volume, network topology, and the characteristics of destination hot event dissemination in social media platforms. It is assumed that the destination hot event dissemination network can be summarized as a binary group G = (V, E). V = { v 1 , v 2 , v n }. It represents the set of nodes in the network; E = { e 1 , e 2 , , e n } . It represents the set of edges in the network. The average value of nodes is d ¯ . According to the definition of structure equivalence theory proposed by Burt, ω   ( ω = d p d I d ¯ ) is the probability that a random edge of the complex network comes from the communicator. p(d) is the degree distribution function of the network, representing the probability of an individual’s occurrence within the network. The weighted average degree of the network is d p d . Thus, the probability of a network node in the communicator state of the network system i can be determined. This model takes into account varying total population sizes and the phenomenon of secondary transmission, thereby offering a sophisticated framework for analyzing the dissemination dynamics of hot events in destination contexts.
In Equation (1), it is assumed that s = S / N ,   e = E / N , i = I / N ,   r = R / N , and i 0 = I 0 / N . They represent the proportion of users in each state. And s + e + i + r + i 0 = 1 . s ,   e ,   i ,   r ,   a n d   i 0 satisfy the following conditions:
s = μ μ s α i s e = α i s β + μ e i = β e δ + μ + θ 1 i r = δ i μ + θ 2 r i 0 = θ 1 i + θ 2 r μ i 0
The first four equations above are independent of the fifth equation. And i 0 = 1 s e i r .
And then the equilibrium points are considered. In this point, we study the closed set {( s , e , i , r , i 0 ) R , 0 s + e + i + r + i 0 1 )}. And Equation (2) is constant-positive. To study the balance point, the left side of Equation (2) is made to be 0, which is shown in Equation (3).
μ μ s α i s = 0 α i s β + μ e = 0 β e δ + μ + θ 1 i = 0 δ i μ + θ 2 r = 0 θ 1 i + θ 2 r μ i 0 = 0
Equation (4) can be derived from Equation (3).
i = ( μ μ s ) α s e = ( μ μ s ) ( β + μ ) i = β ( μ μ s ) β δ + β μ + β θ 1 + δ μ + μ 2 + μ θ 1 r = δ μ μ s α s μ + θ 2 i 0 = θ 1 i + θ 2 r μ = ( θ 1 + δ ) ( 1 s ) α s δ ( μ μ s ) α s ( μ + θ 2 )
Based on above analysis in Section 3.2, i 0 = 1 s e i r , and combing Equation (4), we have i 0 = ( θ 1 + δ ) ( 1 s ) α s δ μ μ s α s μ + θ 2 = 1 s ( μ μ s ) ( β + μ ) ( μ μ s ) α s δ μ μ s α s μ + θ 2 . And then, we obtain G(s) with regards to s, as shown in Equation (5).
G s = β β + μ δ + μ + θ 1 α s
Assuming that the set has s = 1 ,   e = 0 ,   i = 0 ,   r = 0 , and i o = 0 , we obtain Equation (6).
G s = β β + μ δ + μ + θ 1 α = δ + μ + θ 1 α β α β + μ δ + μ + θ 1 1 = δ + μ + θ 1 α ( R 0 1 )
In Equation (6), R 0 = β α β + μ δ + μ + θ 1 . From Equation (6), G(s) is monotonically increasing when R 0 > 1 . Since G s > 0 , G s = 0 has only positive roots in the interval (0, 1). Therefore, Equation (2) has a unique equilibrium point: s * . Two equilibrium points can be found from Equation (5):
s 0 = 1 ,     s * = 1 R 0 = β + μ δ + μ + θ 1 β α
We bring s * into Equation (4) to obtain Equation (7).
i * = μ α R 0 1 = μ β α μ ( β + μ ) ( δ + μ + θ 1 ) α ( β + μ ) ( δ + μ + θ 1 ) e * = μ β + μ 1 1 R 0 = μ β α μ ( β + μ ) ( δ + μ + θ 1 ) β α ( δ + μ + θ 1 ) r * = δ α R 0 1 = δ β α δ ( β + μ ) ( δ + μ + θ 1 ) α ( β + μ ) ( δ + μ + θ 1 ) i 0 * = ( θ 1 μ θ 2 δ ) α ( R 0 1 ) = ( θ 1 μ θ 2 δ ) β α ( β + μ ) ( δ + μ + θ 1 ) α ( β + μ ) ( δ + μ + θ 1 )
Therefore, the first equilibrium point of the improved SEIR model when no hot events are spread is C 0 = ( 1 ,   0 ,   0 ,   0 ,   0 ) . When R 0 > 1 ,   there will be a unique non-zero equilibrium point of the model: C * = ( s * , i * , e * , r * , i 0 * ).

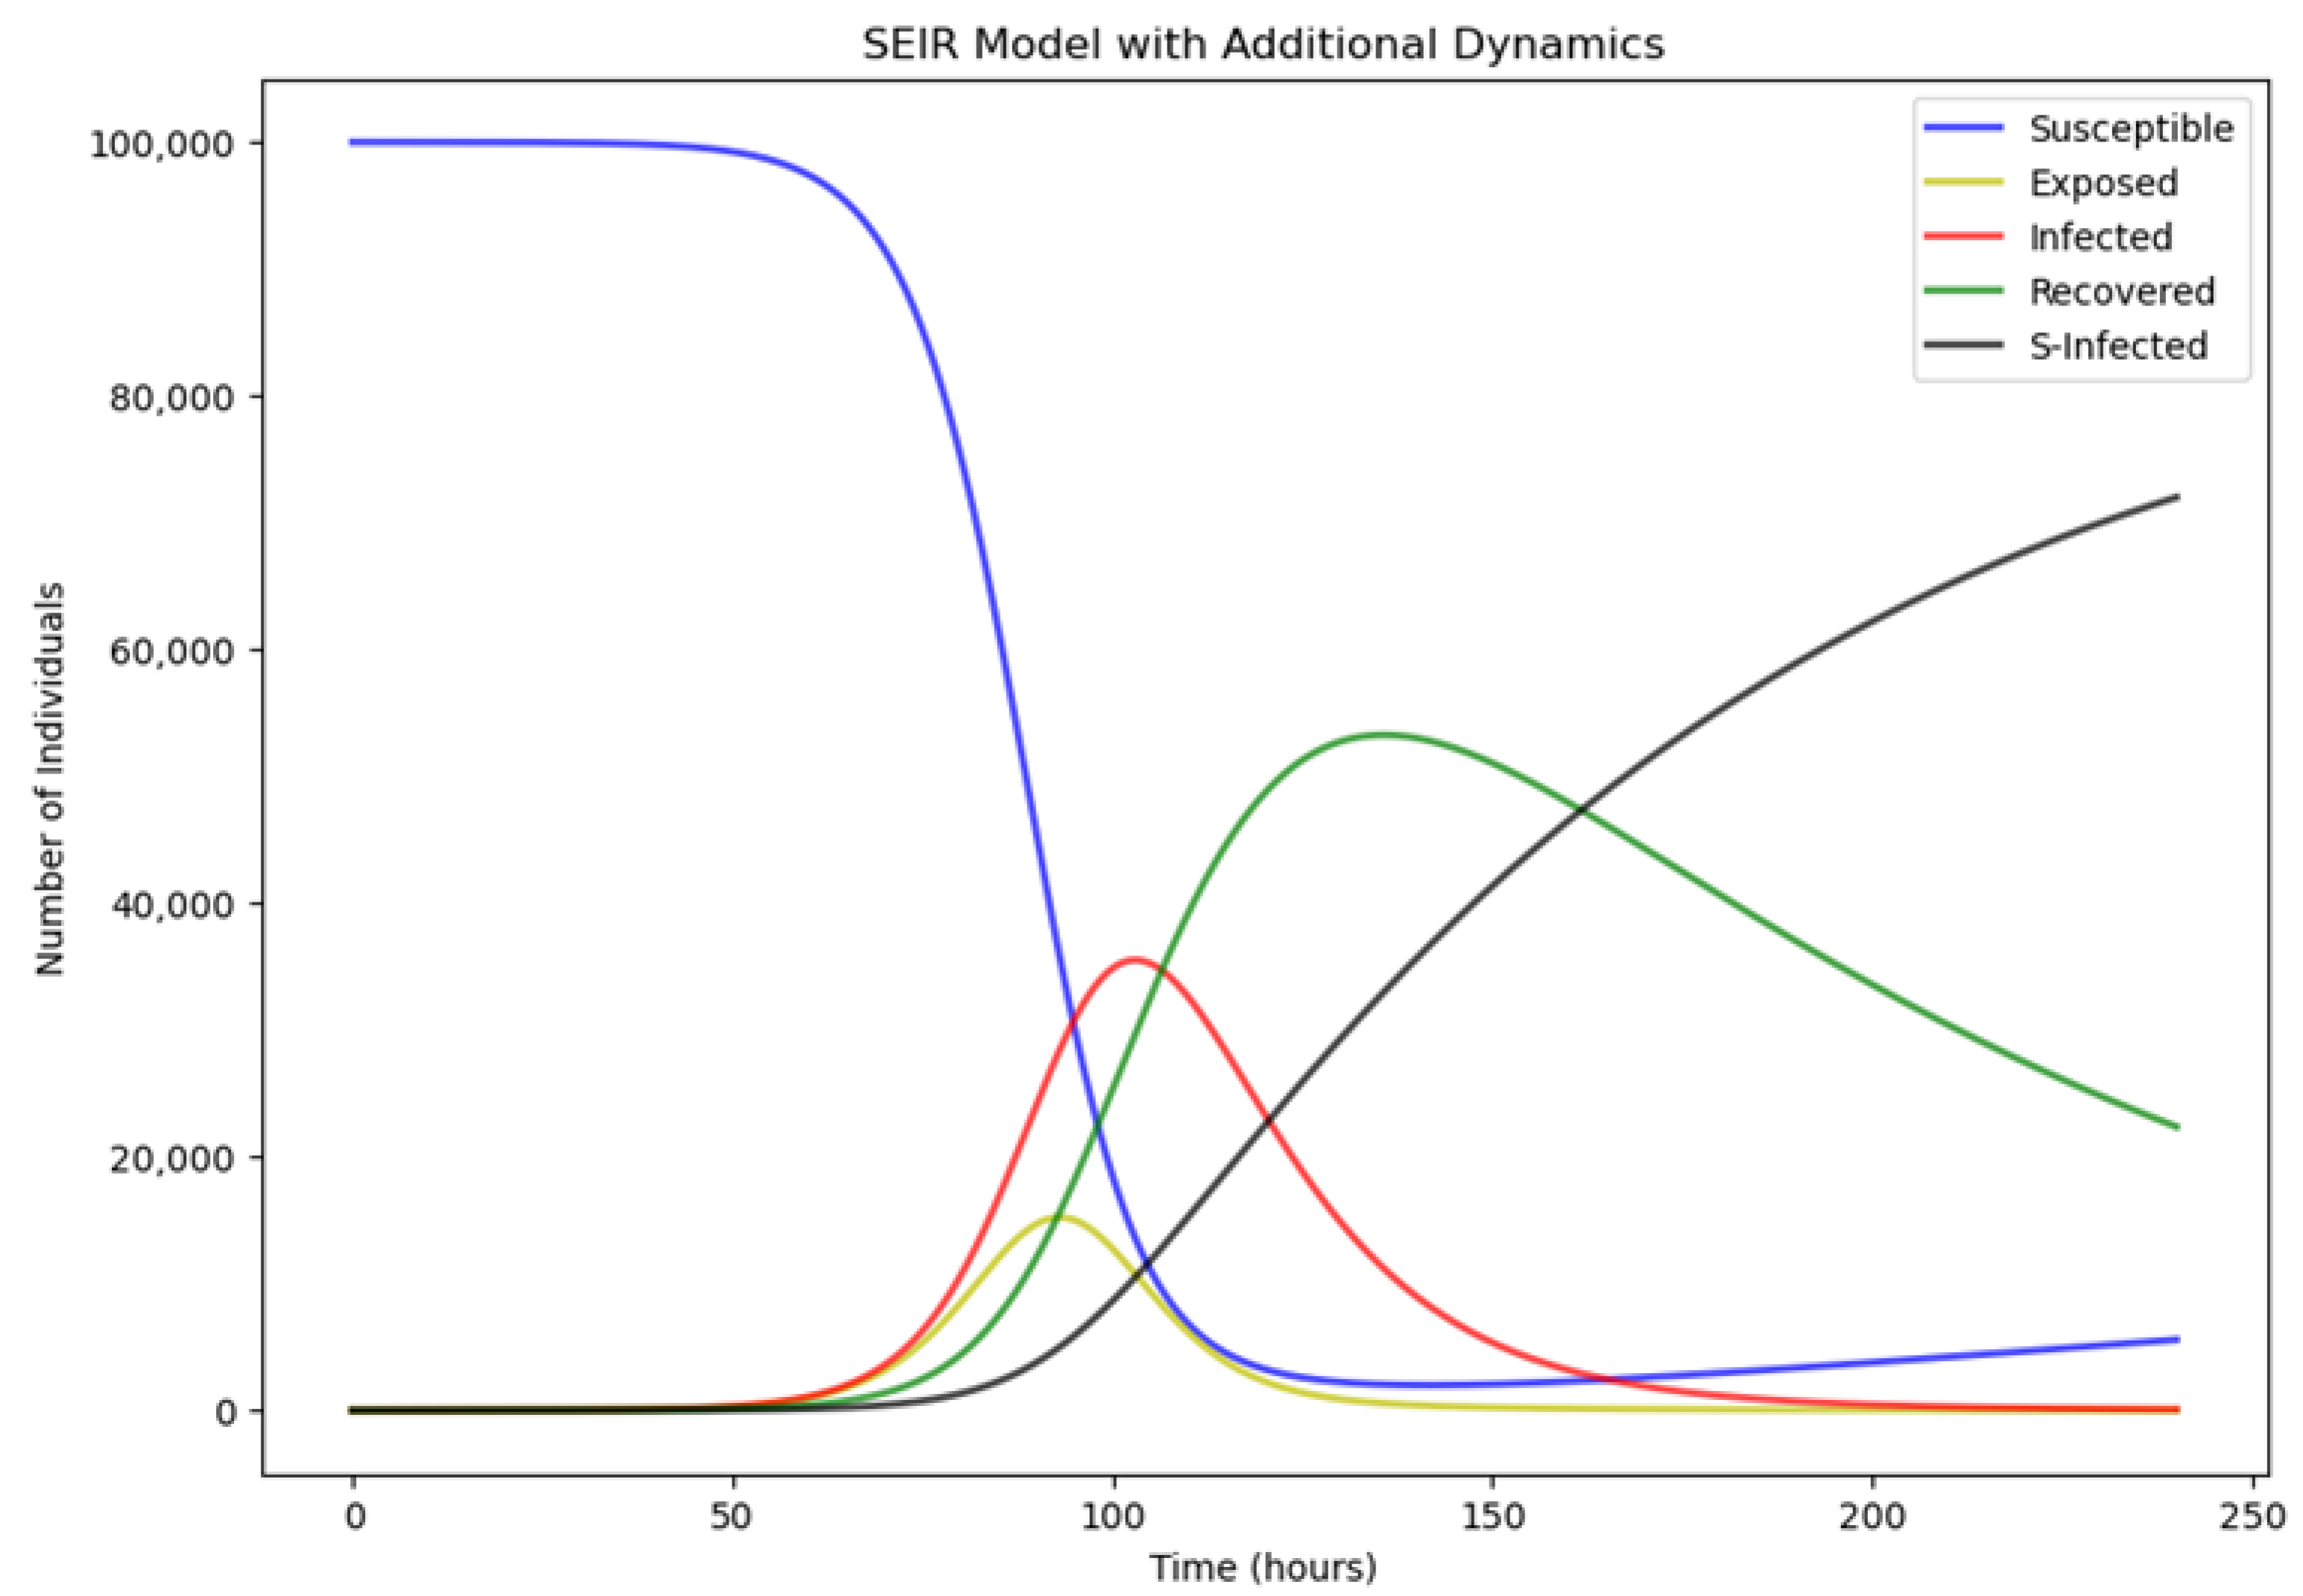
5. Simulation and Results

5.1. Parameter Settings

In this research, Python was utilized to conduct simulation experiments on the improved SEIR system dynamics model. And in this section, we set the parameters for the initial situation. We assume that the total number of users is 100,000. The time is in hours. At commencement of the information dissemination process, there is a single individual spreading the information, while other users on social media are susceptible to being influenced by this information, acting as susceptibles. During this phase, there are neither individuals in the exposed stage nor recovered individuals. Therefore, the initial value setting is S t = 99,999 ,   E t = 0 ,   I t = 1 ,   R t = 0 ,   a n d   I 0 = 0 . At the same time, the parameters are set to α = 0.3 ,   β = 0.2 ,   a n d   δ = 0.05 . In addition, considering that both infected and recovered individuals have been exposed to the hotspot event, it is hypothesized that the probability of secondary dissemination of the hotspot event is the same for both infected and recovered individuals. The initial assumption parameters are set to μ = 0.0005   a n d   θ 1 = θ 2 = 0.01 . As there is a certain hiding period from the occurrence of the hot event to the media coverage, it involves the issue of secondary dissemination. In this study, the time period was set to be 10 days, i.e.,  t = 240 h for display. Based on the above assumptions, we can simulate the social media destination hotspot event dissemination. The evolution paths of S, E, I, R, and I0 are shown in Figure 3.
Based on Figure 3, the susceptibility curve remains relatively smooth over extended time at first. This is due to the presence of a latency period in the dissemination of information. In the early stages of information spread, although the dissemination has commenced, the relatively small number of disseminators is insufficient to significantly impact the entire susceptible population, thereby not leading to a notable decrease in S. Subsequently, a pronounced decline in susceptible individuals is observed in the dissemination of social media destination hotspot events. The number of susceptible people rapidly tends to zero, converting to exposed individuals or users of other status. The number of the exposed individuals E(t) reaches the peak and then tends to fall within t = 50 90 . Within t = 90 120 , the number of exposed individuals rapidly decreases and eventually stabilizes near zero in the interval of t = 120–150. The number of infected individuals rises rapidly from 0. It peaks at about t = 100 and then declines slowly until it reaches 0 at t = 200 . It can be seen that there is initially no big difference between the exposed curve and the infected curve. And after 50 h, the infected curve experiences rapid growth, and the number of infected individuals is greater than exposed individuals until they become stable at the end. The reason lies in the rapid transmission of hot events on social media, where a relatively high dissemination rate will result in the number of infected individuals increasing swiftly, surpassing the number of exposed individuals. This is consistent with the information dissemination situation in social media. And as for the recovered curve, the number of recovered individuals rises slowly from 0, peaking around t = 140 , followed by a slow descent. The number of secondarily infected individuals increases slowly from t = 0 and continues to increase after the number of susceptible persons decreases to a minimum. When the dissemination of the entire event is over, all four users of statuses S, E, I, R, and I0 all reach stable values. The trend of the event’s dissemination on social media aligns with the theoretical behavior of the rumor spreading process for the SEIR model in the research by Dong et al. [33]. However, there are many factors influencing event dissemination within social media. Therefore, after setting the initial value, referring to the existing studies, we adjusted the parameters in a multiplicative relationship. The results are shown in Table 2. Understanding the impact of different factors on information diffusion will help improve the SEIR model. This will result in a more contextualized model of the spread of destination hot events on social media. And in the following section, we analyze the influences of these factors based on the chronological order of the diffusion of destination hot events.

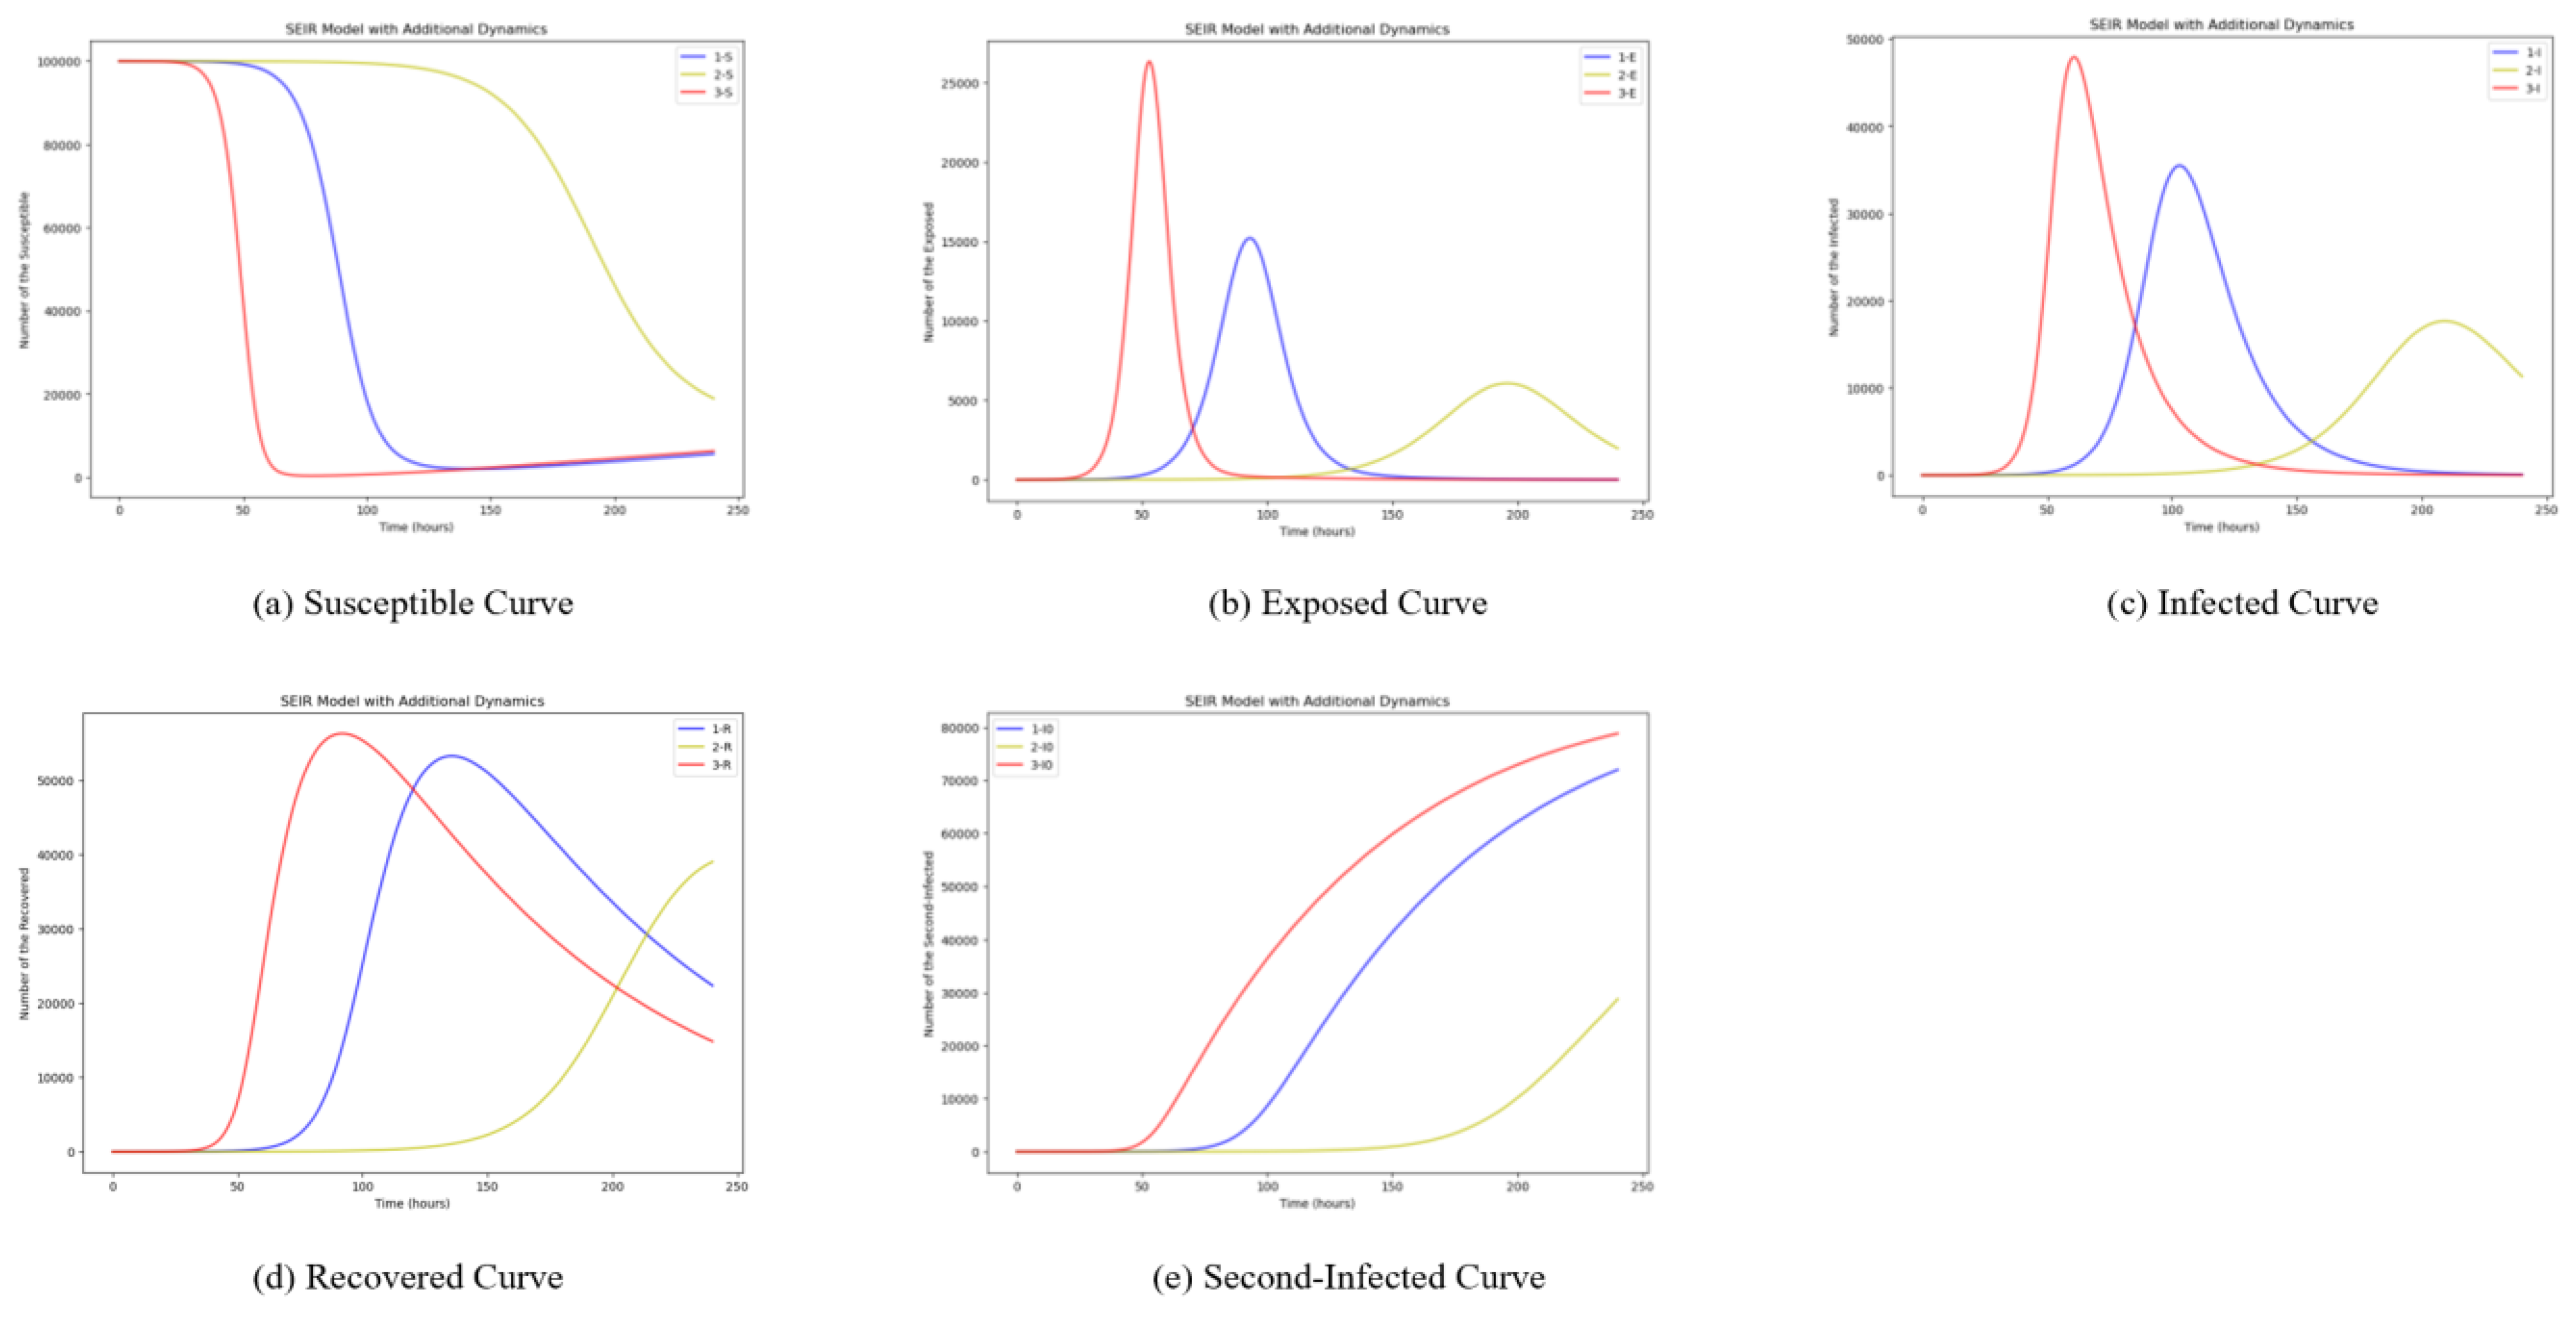
5.1.1. Impact of Changes in Infection Rate

The infection rate α is the probability that a user transforms from susceptible to exposed status in the destination information dissemination model. In this section, we aim to examine the impact of α on the spread of trending events. Hence, α is taken as 0.3, 0.15, and 0.6, respectively, to analyze how the diffusion mechanism is changed as α changes. Other initial set conditions are unchanged in the simulation experiment. The simulation results are shown in Figure 4, consisting of five pictures that represent the changes of the susceptible curve, exposed curve, infected curve, recovered curve, and secondarily infected curve. The blue curves show the diffusion mechanism initially when α is taken as 0.3. And the yellow curves show the situation when α is taken as 0.15, while the red lines show the situation when α is taken as 0.6.
The simulation outcomes show that the change of α is an important indicator that affects the trend of each result. Specifically, with an elevated infection rate (i.e., a higher α value), the user’s susceptible period is shorter. The number of exposed and infected individuals peaks earlier and reaches higher peaks. Conversely, a small α value corresponds with a slow spread of the event, and the impact is severely limited. Therefore, it is not enough to become a “hot” event. The higher the infection rate, the faster the susceptible people will pay attention to the information during the spread of the hot event. And more susceptible people become exposed users earlier. It is even possible that all users become exposed users to follow the development of the event and spread it further. Apparently, adopting α = 0.3 is more reasonable for describing the social media destination hot event dissemination. When a hot event outbreaks, susceptible users with sensitive status will follow the issues quickly and become the followers of the issues. Therefore, users occupy the susceptible status for shorter durations.

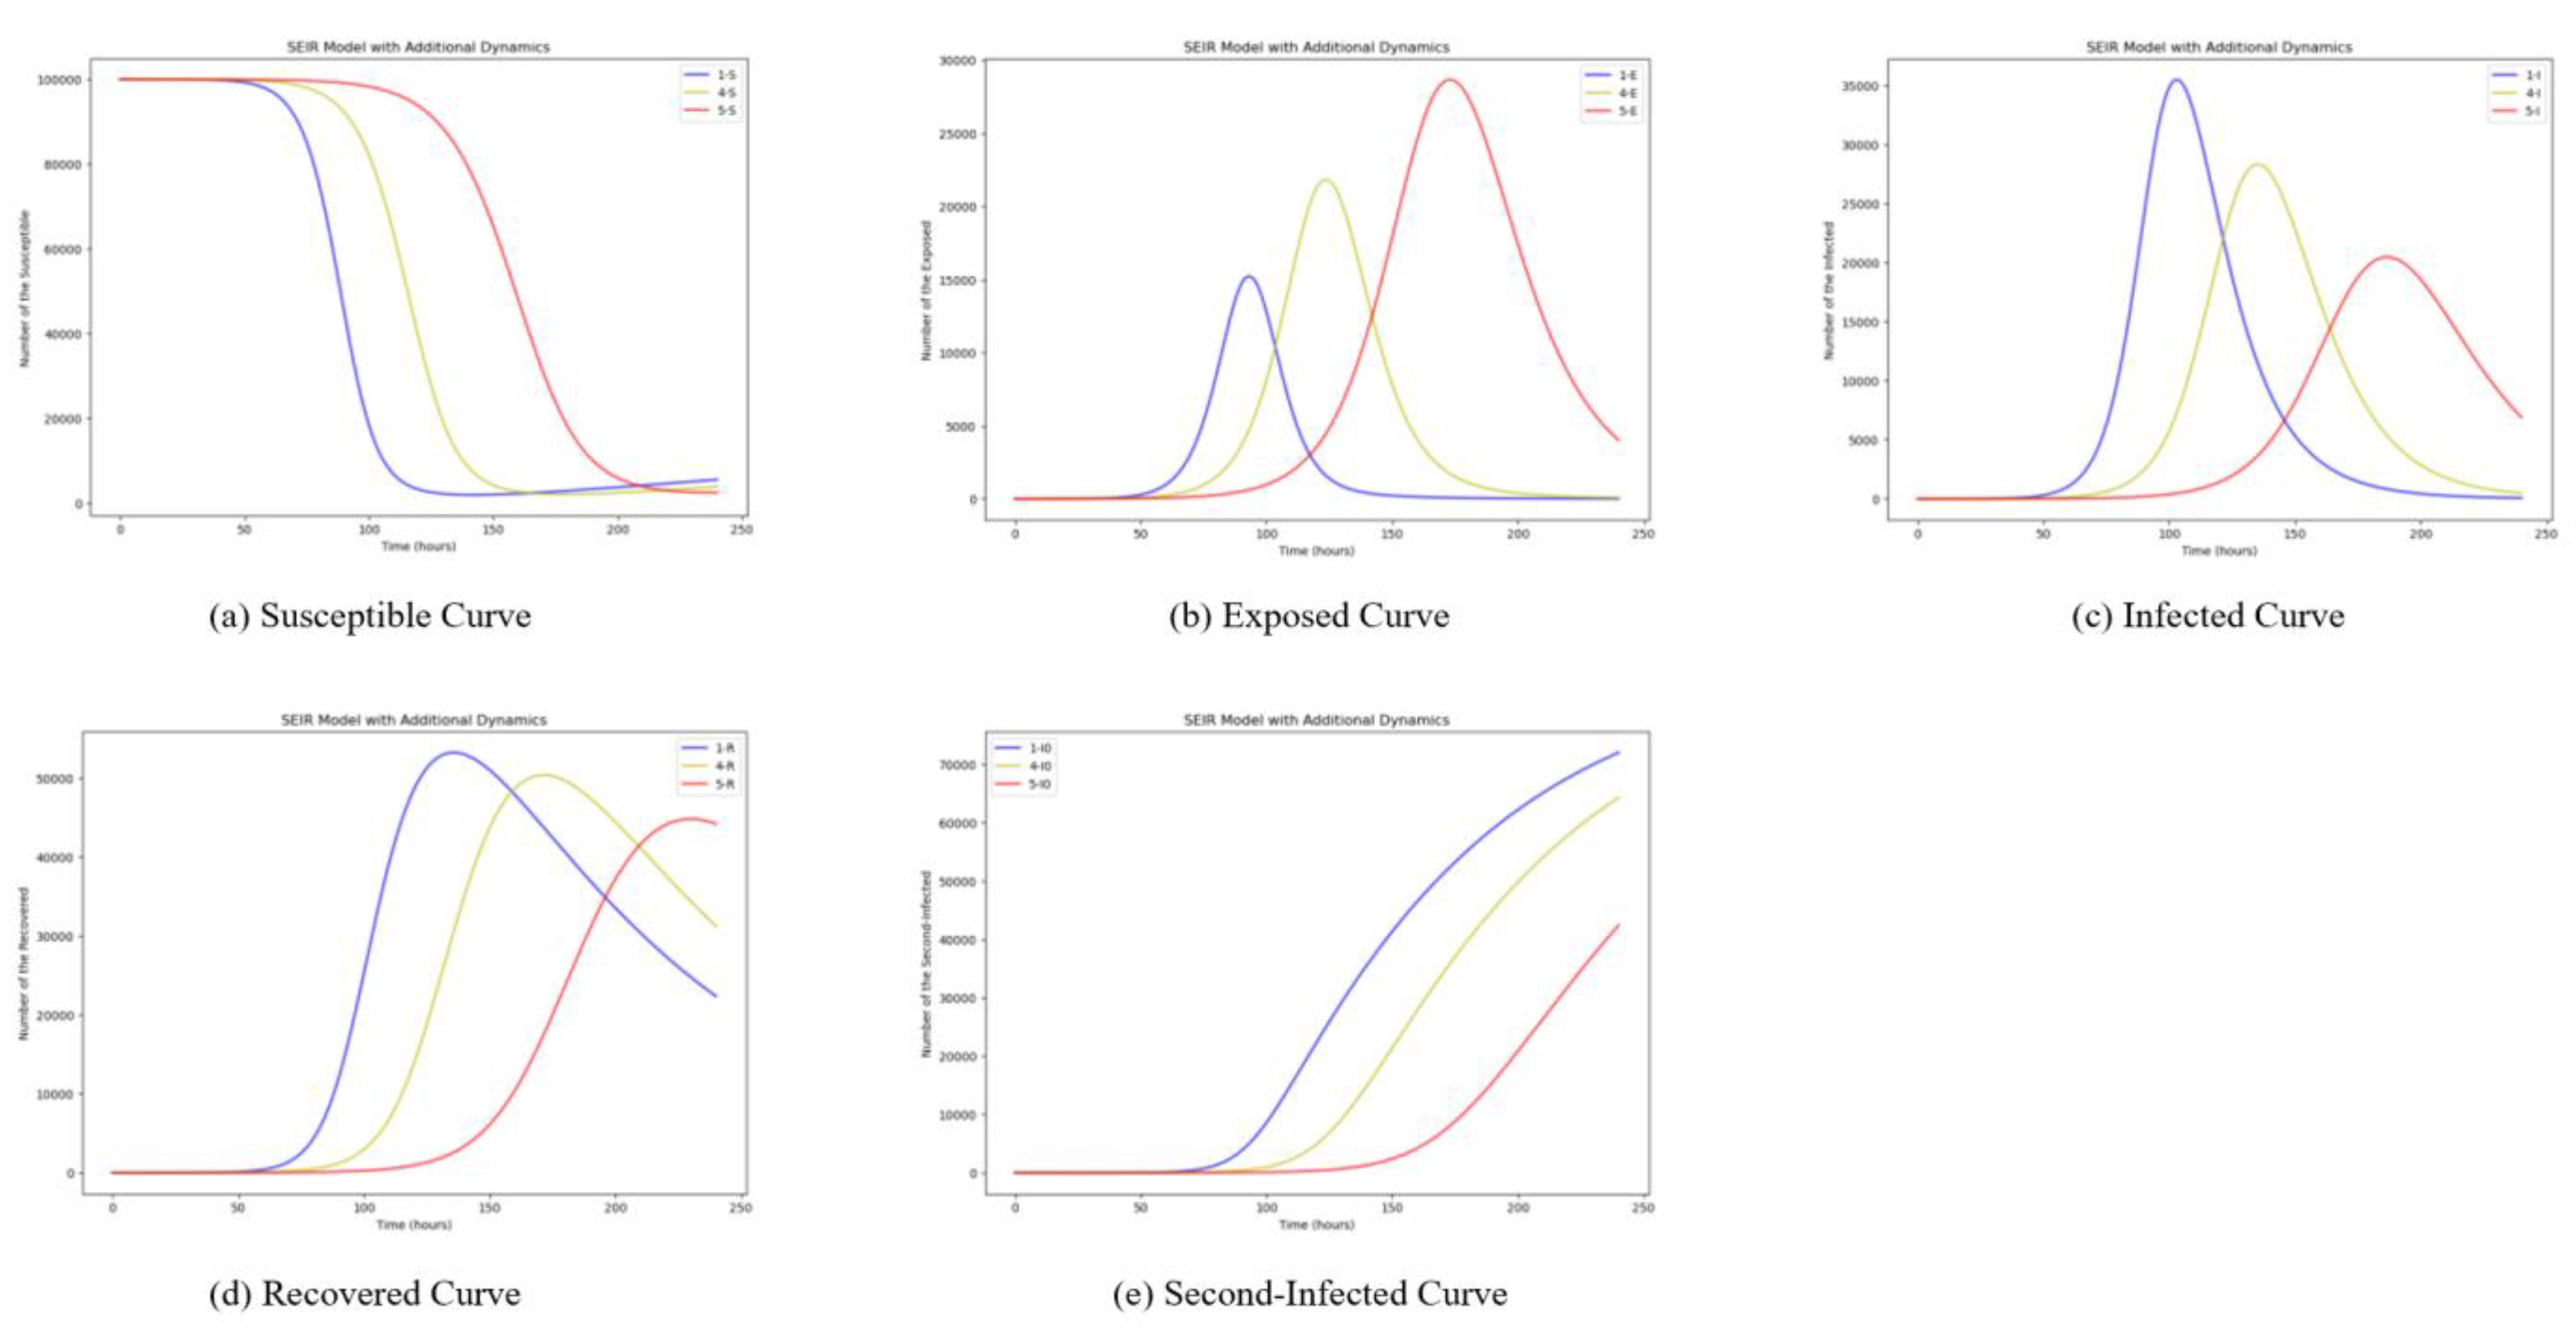
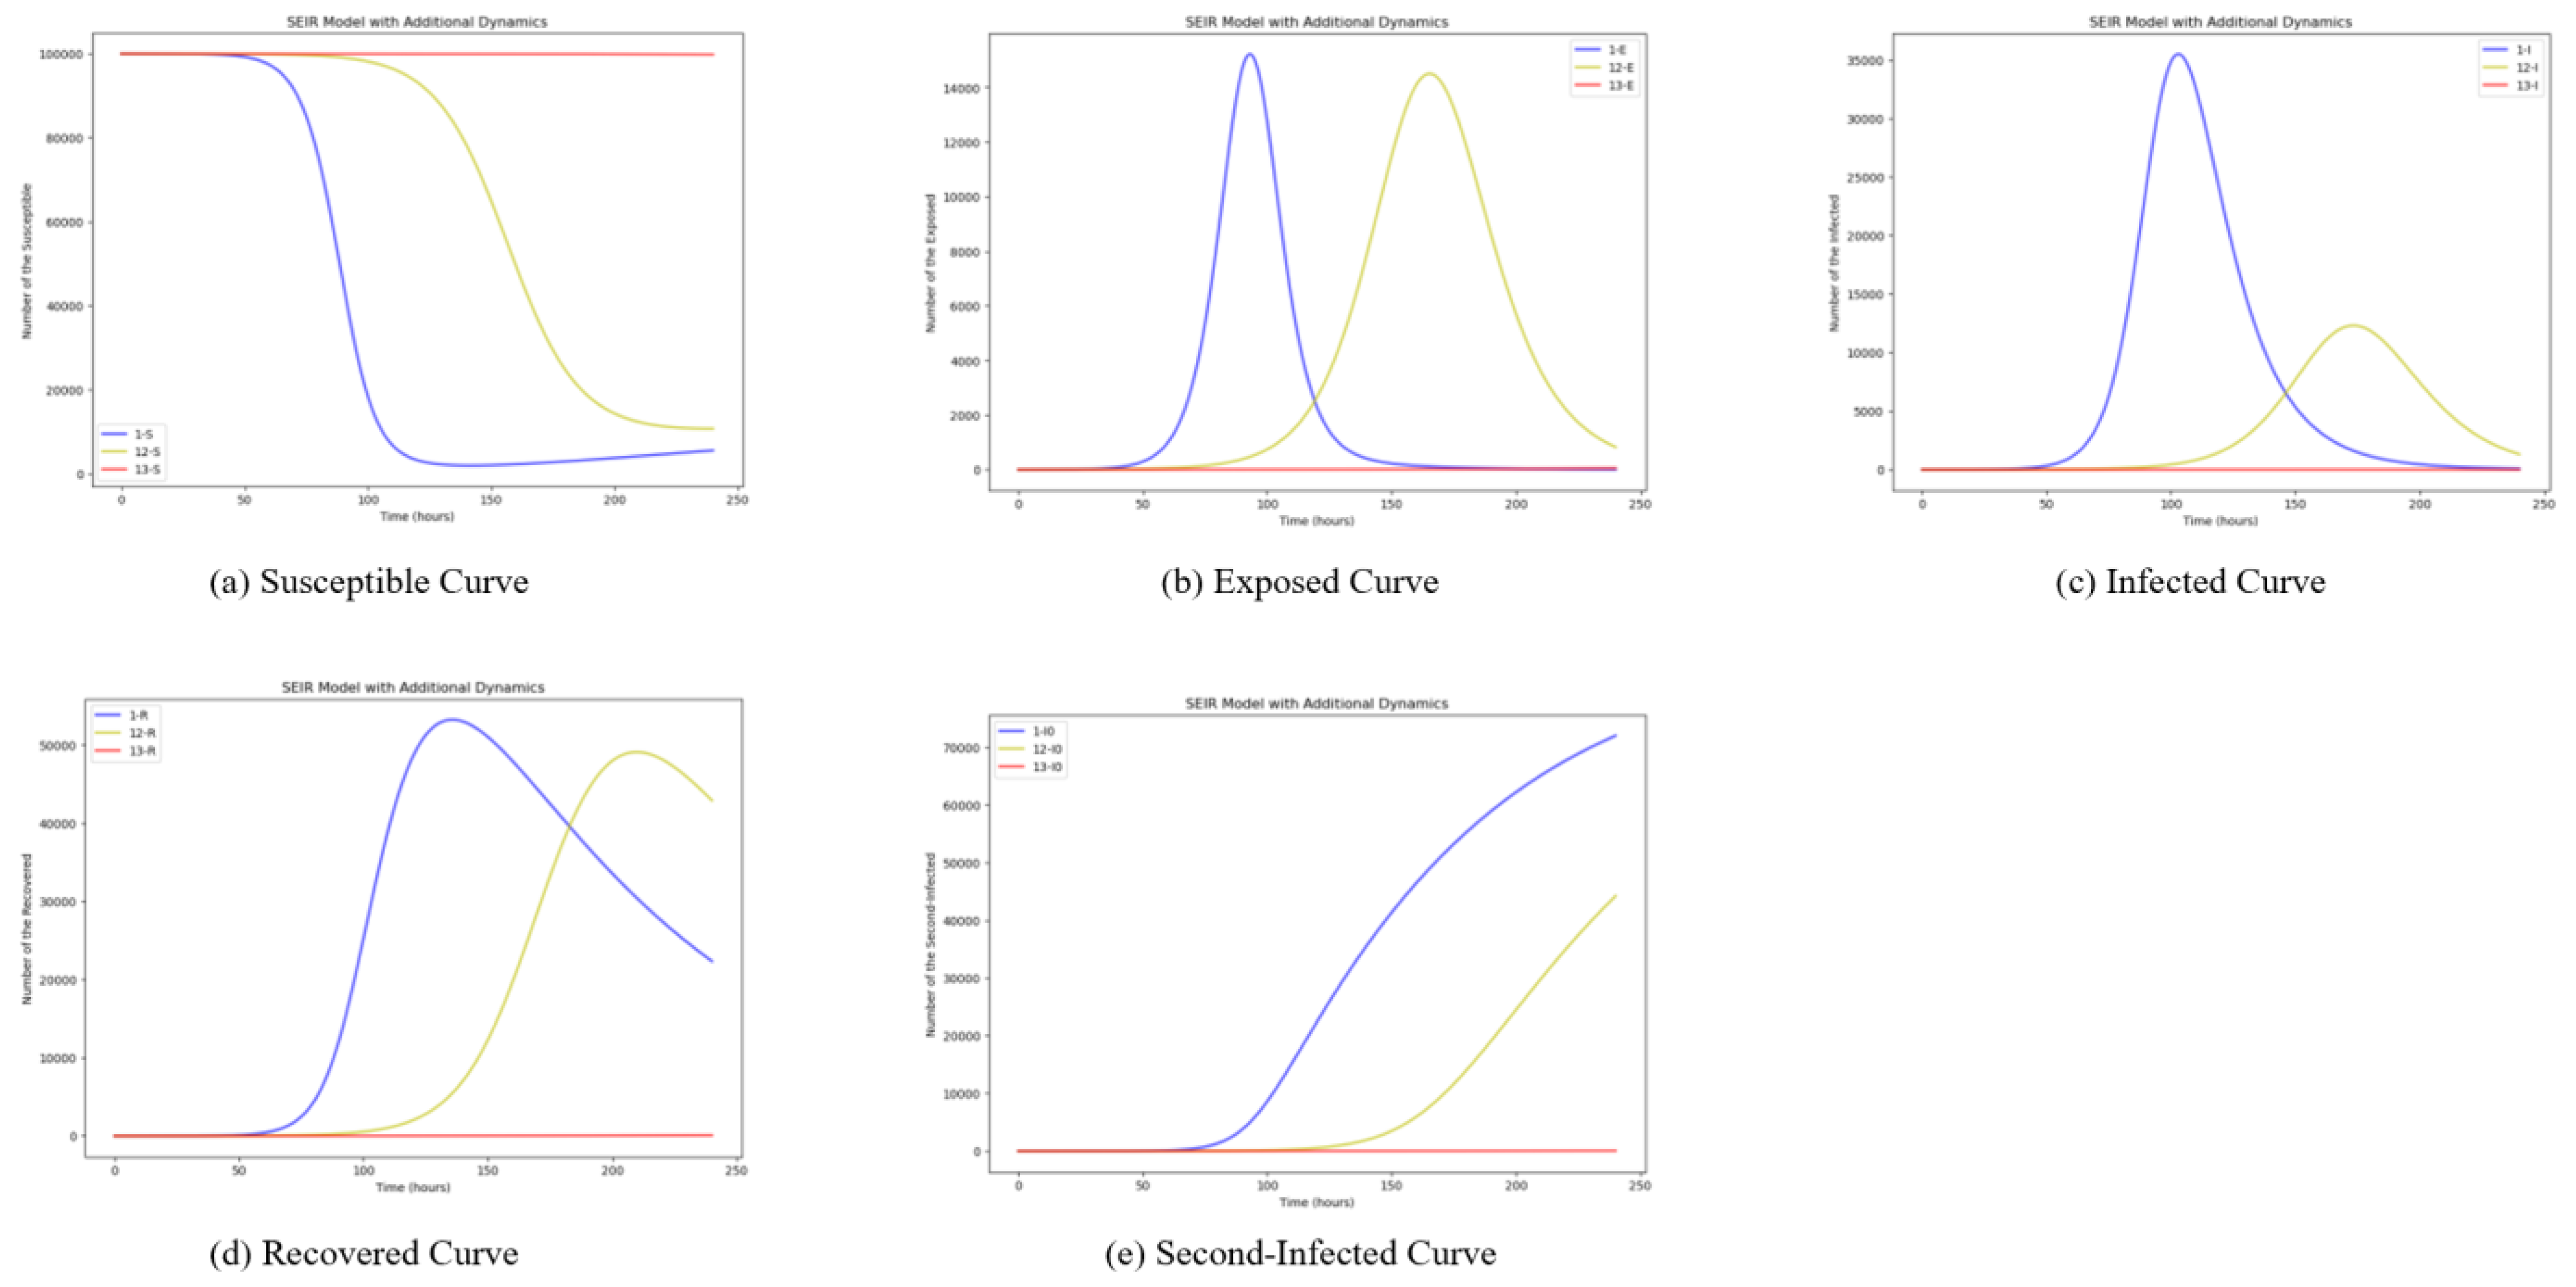
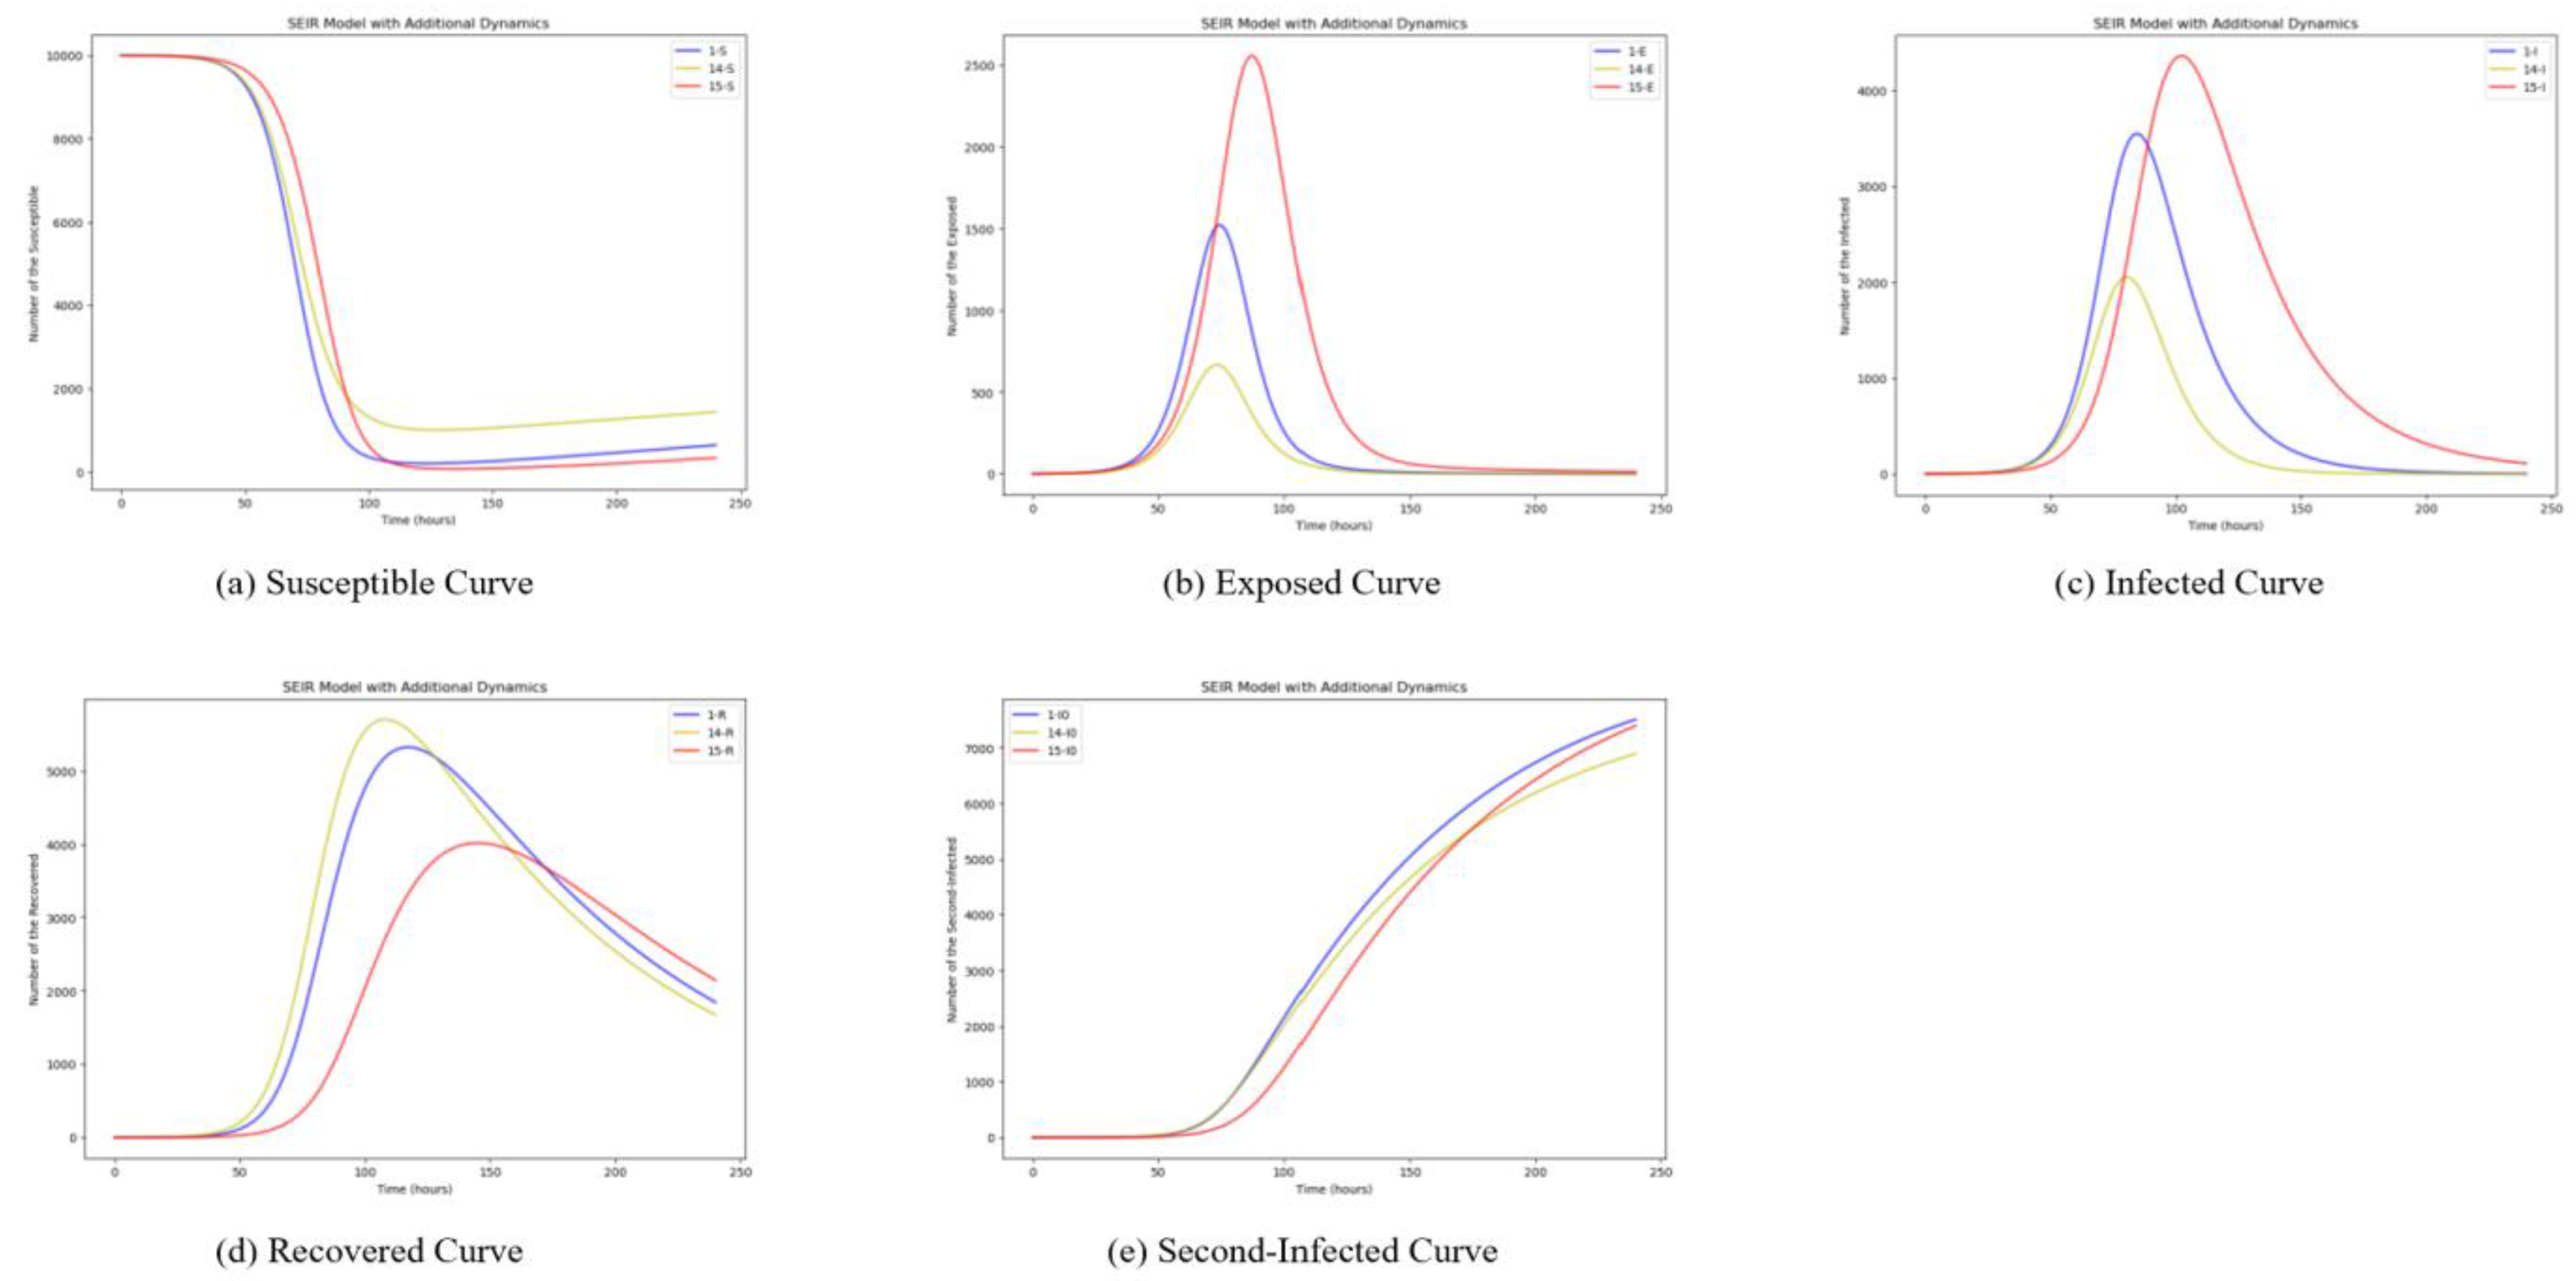
5.1.2. Impact of Changes in Dissemination Rate

In this section, the influence of the dissemination rate that effects the dissemination speed and scope of information is discussed. The dissemination rate β is the probability of a user’s status of dissemination behavior changing from just following the hot event of a destination to commenting on, liking, retweeting, etc., the hot event after its outbreak. To examine the influence of β , we set the initial value as unchanged and make β take different values, such as 0.2 , 0.1 , a n d 0.05 . The simulation results are shown in Figure 5. The blue curves show the diffusion mechanism initially when β is set as 0.2. And the yellow curves show the situation when β is set as 0.1, while the red curves show the situation when β is set as 0.05.
As can be seen in Figure 5, changes in the dissemination rate β have a small effect on the susceptible users S. However, the larger β is, the shorter the exposed period of exposed users, the earlier the number of infected users reaches the peak, the larger the peak becomes, and the earlier and larger the secondarily infected I0 peaks. It means that the larger β is, the higher the probability that the exposed individuals who pay attention to the destination event will be converted into infected individuals. At the same time, the event will generate related hot events for secondary dissemination more quickly. Apparently, taking β = 0.2 appears to be more reasonable. The exposed individuals follow the event and then more quickly turn into infected individuals. This is more in line with the explosive dissemination of destination hot events.

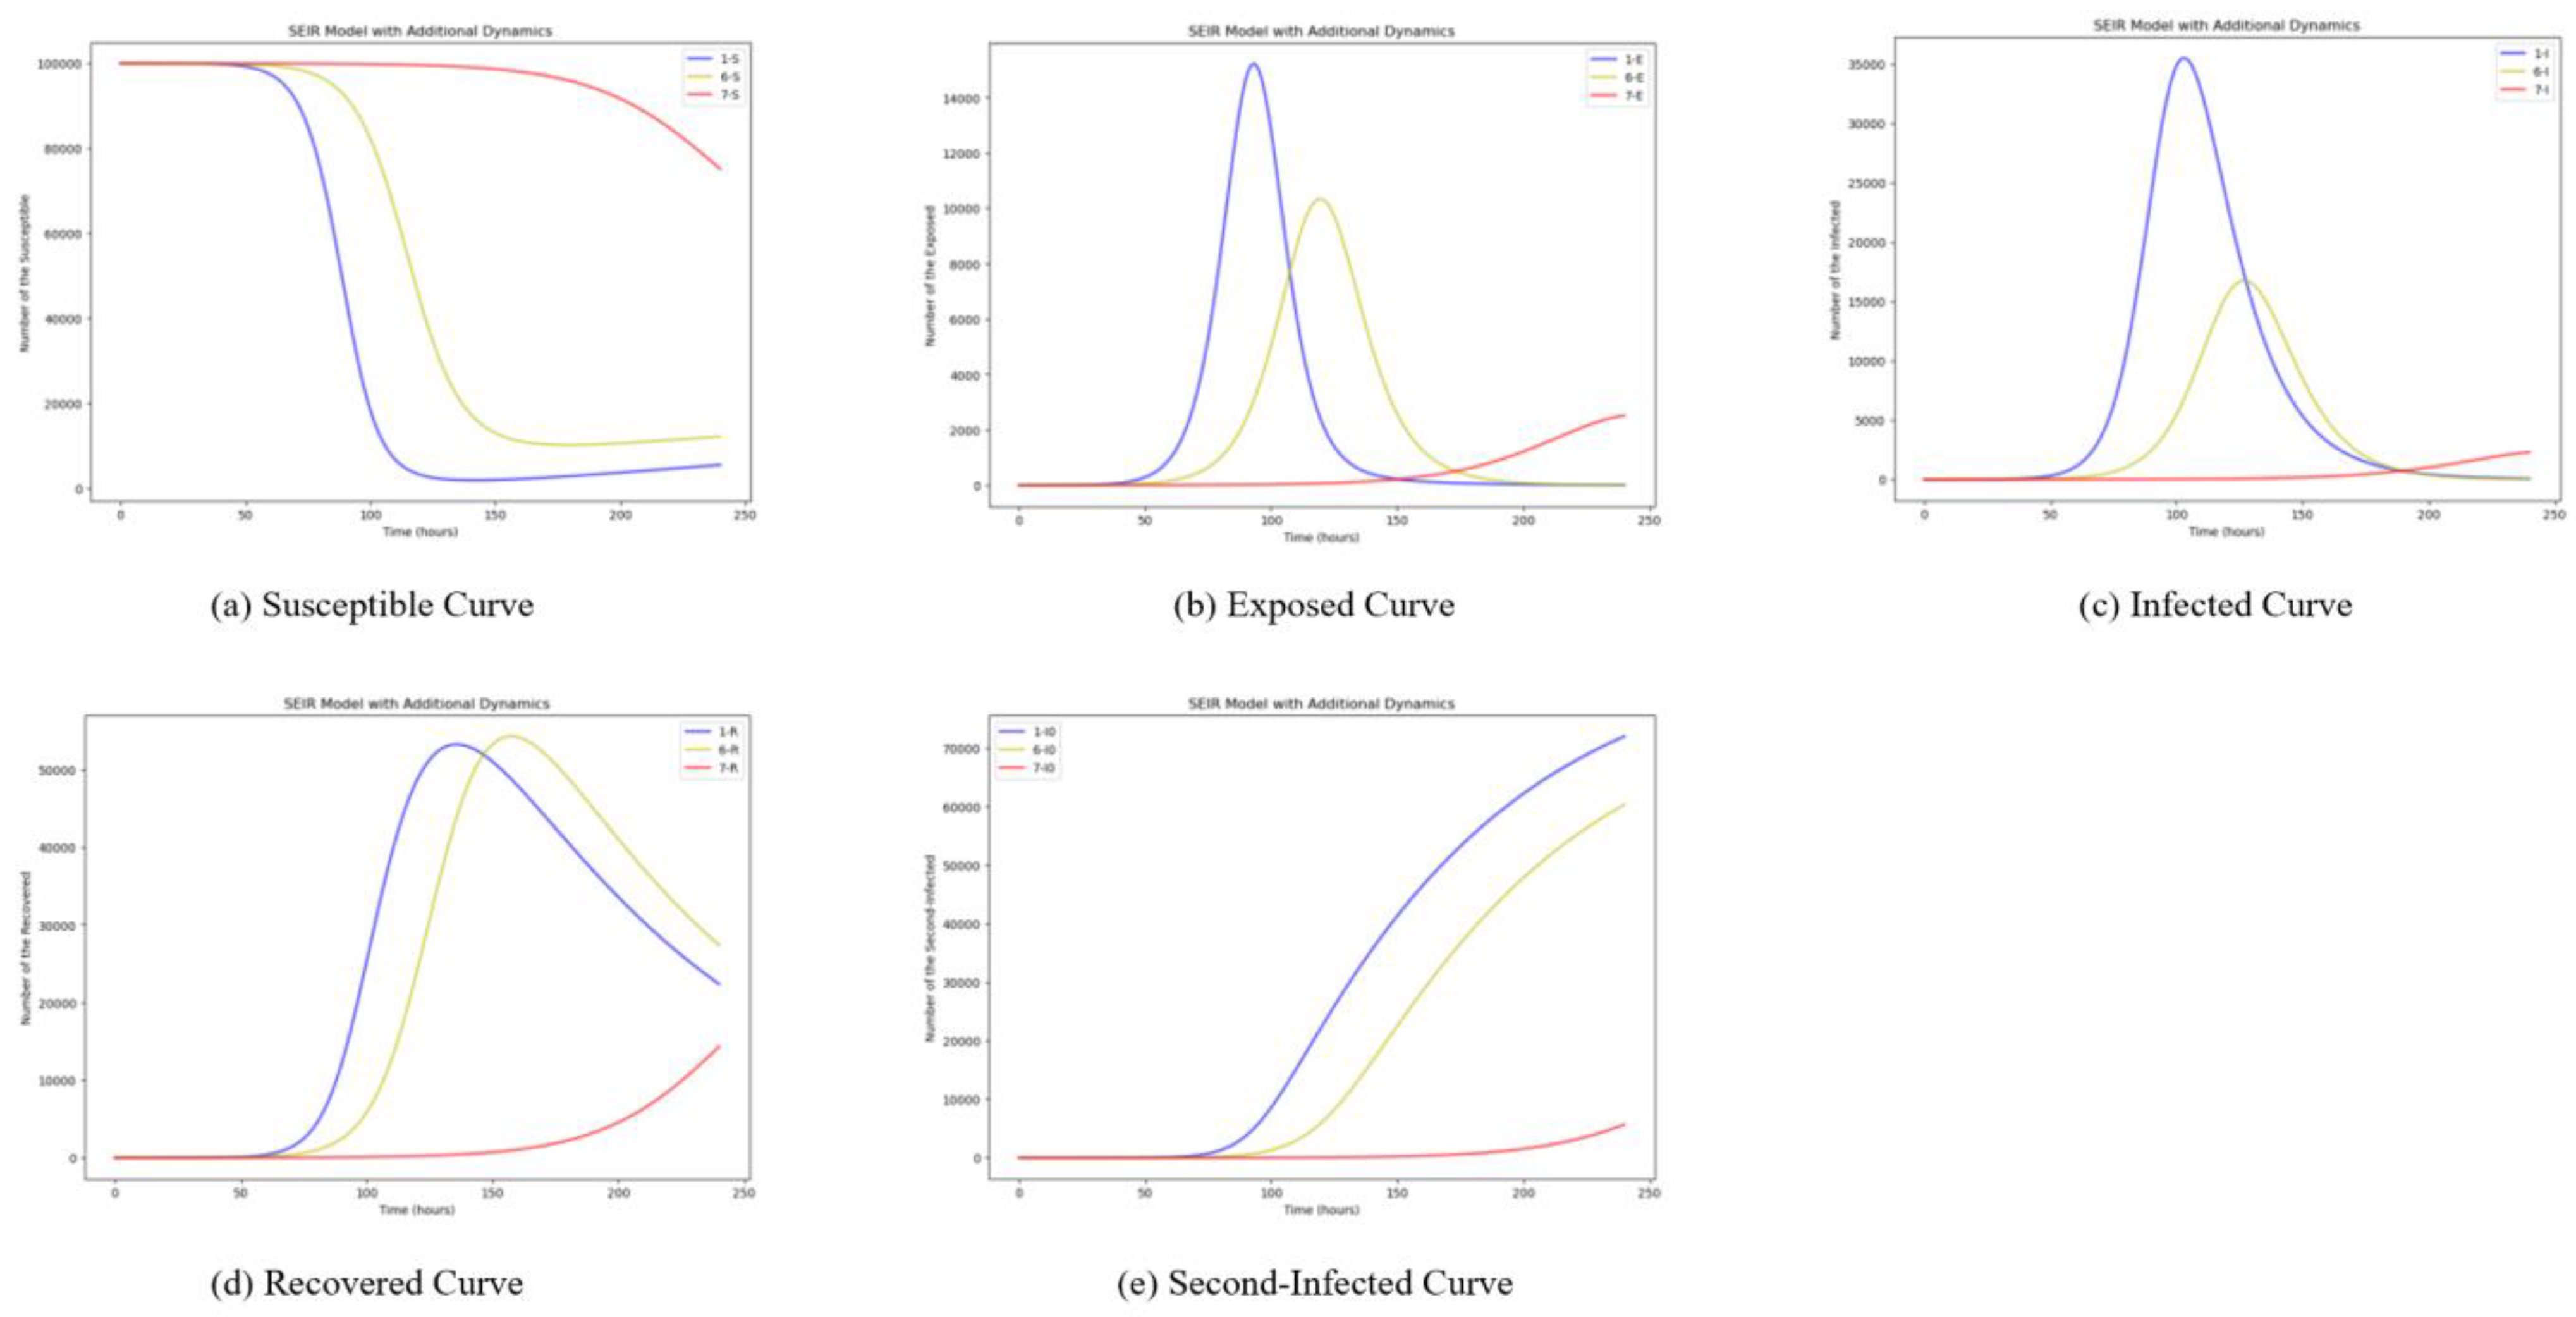
5.1.3. Impact of Changes in Removing Rates

In this section, the influence of the removing rate δ is examined. δ affects the persistence of the impact of information dissemination. The removing rate δ is the probability that a user will go from spreading the word about a hot event to losing interest in it after the hot event breaks out. We set the simulation experiment initial value as unchanged and took α = 0.06 and β = 0.2 . And then, we took δ   a s   d i f f e r e n t   v a l u e s :   0.05 ,   0.1 ,   a n d   0.2 . We compared the changes of the hot event diffusion brought by δ . The simulation results are shown in Figure 6, where the blue curves also show the diffusion process initially when δ is set as 0.05, the yellow curves show the situation when δ is set as 0.1, and the red curves show the situation when δ is set as 0.2.
As can be seen in Figure 6, the probability of removal, denoted by δ , is inversely related to the peak of the infected users I, showing the extent of diffusion. This aligns with the findings of Zhang et al., who highlighted the impact of removal probability on the diffusion of public opinion across the network [52]. And as δ increases, the dissemination period decreases, and the sooner the recovered individuals, R, reaches its maximum value. This suggests that the smaller the removing rate of disseminators after they have disseminated a destination hot event, the longer the period of dissemination. And the higher the number of disseminators at the outbreak of a destination hot event, the later the disseminators lose interest in the event.

5.1.4. Impact of Changes in Secondary Infection Rate

In this research, the SEIR model was improved considering secondary infection in the context of information dissemination. This section examines the impact of changes in the secondary infection rate. The secondary infection rate θ 1 is the probability that after the outbreak of a destination hotspot event, an event related to the hotspot event triggers the susceptible individuals S of the hotspot event to propagate the event again. The secondary infection rate θ 2 is the probability that removing individuals R who have lost interest in the event after the outbreak of a hot event will spread the event after being exposed to the event in question. In this article, we set θ 1 = θ 2 . We set the simulation experiment initial value as unchanged and performed the simulation experiment under the conditions of θ 1 = θ 2 = 0.01 ,   θ 1 = θ 2 = 0.001 ,   a n d   θ 1 = θ 2 = 0.1 separately. The simulation results are shown in Figure 7. The blue curves show the dissemination process initially when θ 1 and θ 2 are set as 0.01. And the yellow curve shows the situation when the values are set as 0.001, while the red curves show the situation when the values are set as 0.1.
As can be seen in Figure 7, changes in the secondary infection rate have a small effect on the exposed individuals E. However, with the increase of the secondary infection rate, the peak of the removing individuals will decrease rapidly, and the trend becomes flat. The number of secondarily infected individuals will increase. After the outbreak of hot events, the larger the probability of the hot events’ spreading, the more spreading individuals there will be. Also, there will be fewer individuals losing interest in the events. Apparently, setting θ 1 = θ 2 = 0.01 is more reasonable.

5.1.5. User’s Adoption Rate

Considering the diffusion of hot events within social media in reality, the adoption of new users is needed for analysis. In this section, we focus on the influences of a user’s adoption rate. The user’s adoption rate μ denotes the newly registered users after the outbreak of the destination event. Assuming the initial value is unchanged as set as 4.1.4, θ 1 = θ 2 = 0.01, and we thus set μ = 0.0005 ,   0.005 ,   a n d   0.5 . This will help elucidate the impacts of a user’s adoption rate as it changes. The simulation results are shown in Figure 8. In the figure, the blue curves show the dissemination process initially when μ is set as 0.0005. And the yellow curve shows the situation when the value is set as 0.005, while the red curves show the situation when μ is set as 0.5.
As can be seen in Figure 8, the greater the probability that a user will access social media, the greater the percentage of users who will become exposed users following the event. There are few differences between setting μ = 0.0005 and μ = 0.005 . Therefore, according to the actual situation, we chose μ = 0.0005 . At this point, subsequent to the emergence of a hot event, almost all users become susceptible to the event within an hour or so. During the initial 50 h, most users continue to pay attention to the event but make fewer comments. However, within 100 h after the outbreak of the event, users start to comment, retweet, and like the event, changing from paying attention to the event to spreading the hot event. After 100 h, users gradually lose interest in the event and stop paying attention to the event. At the same time, in the process of spreading hot events, related topics will be generated and disseminated a second time. Even as the original topic’s prominence diminishes, these associated topics continue to attract attention for an extended duration. Therefore, in the simulation experiment, setting α = 0.06 , β = 0.2 , δ = 0.05 , μ = 0.5 , and θ 1 = θ 2 = 0.01 yields results closer to reality. It can provide a reference for the study of the destination of destination hot events in social media, which exerts influence on the brand building of the destination.

5.1.6. Dissemination and Recovering Rate

In this section, we make a joint consideration of dissemination rate and recovering rate, as they are fundamental in understanding the spread and control of information diffusion, especially for diffusion modeling, communication planning, and assessment of destination branding strategies. At first, we consider the different changing situations of decreasing dissemination rate with increasing recovering rate. Assuming the initial value as unchanged, we take β = 0.2 ,   0.1 ,   a n d   0.05 and δ = 0.05 ,   0.1 ,   a n d   0.2 separately. The simulation results are shown in Figure 9. The blue curves show the dissemination process when β is set as 0.2 and δ is set as 0.05, which is the same as the initial settings. And the yellow curve shows the situation when β is set as 0.1 and δ is set as 0.1, while the red curves show the situation when β is set as 0.05 and δ is set as 0.2.
Figure 9 illustrates that with a decrease in the dissemination rate and an increase in the recovery rate, the timeline for all phases will move backward; especially, the peak of the number of people who disseminate will be greatly reduced. When the recovering rate inverts the dissemination rate, there will no longer be a change. Infected individuals will return to normal very quickly, and hotspot events will no longer exist. Therefore, setting β = 0.2 and δ = 0.05 are the best fit for reality.
And then, we consider the same proportional changes of the dissemination rate and recovering rate. Maintaining the initial value as unchanged, we set β = 0.2 ,   0.4 ,   a n d   0.1 and δ = 0.05 ,   0.1 ,   a n d   0.025 separately. The simulation results are shown in Figure 10. The blue curves show the dissemination process when β is set as 0.2 and δ is set as 0.05. And the yellow curve shows the situation when β is set as 0.4 and δ is set as 0.1, while the red curves show the situation when β is set as 0.1 and δ is set as 0.025.
As can be seen in Figure 10, the same proportional increase or decrease produces a small and negligible effect on susceptible users (S) and secondarily infected users (I0). When β and δ increase in the same proportion, the number of exposed and infected individuals decreases substantially, and recovery is faster. It can be seen that the effect of the recovery rate carries more weight. Conversely, when β and δ decrease in the same proportion, although the number of both exposed and infected users increases to a greater extent, the timeline is pushed backward, and the effects of both parameters are reflected. To sum up, setting β = 0.2 and δ = 0.05 is the best fit for reality.

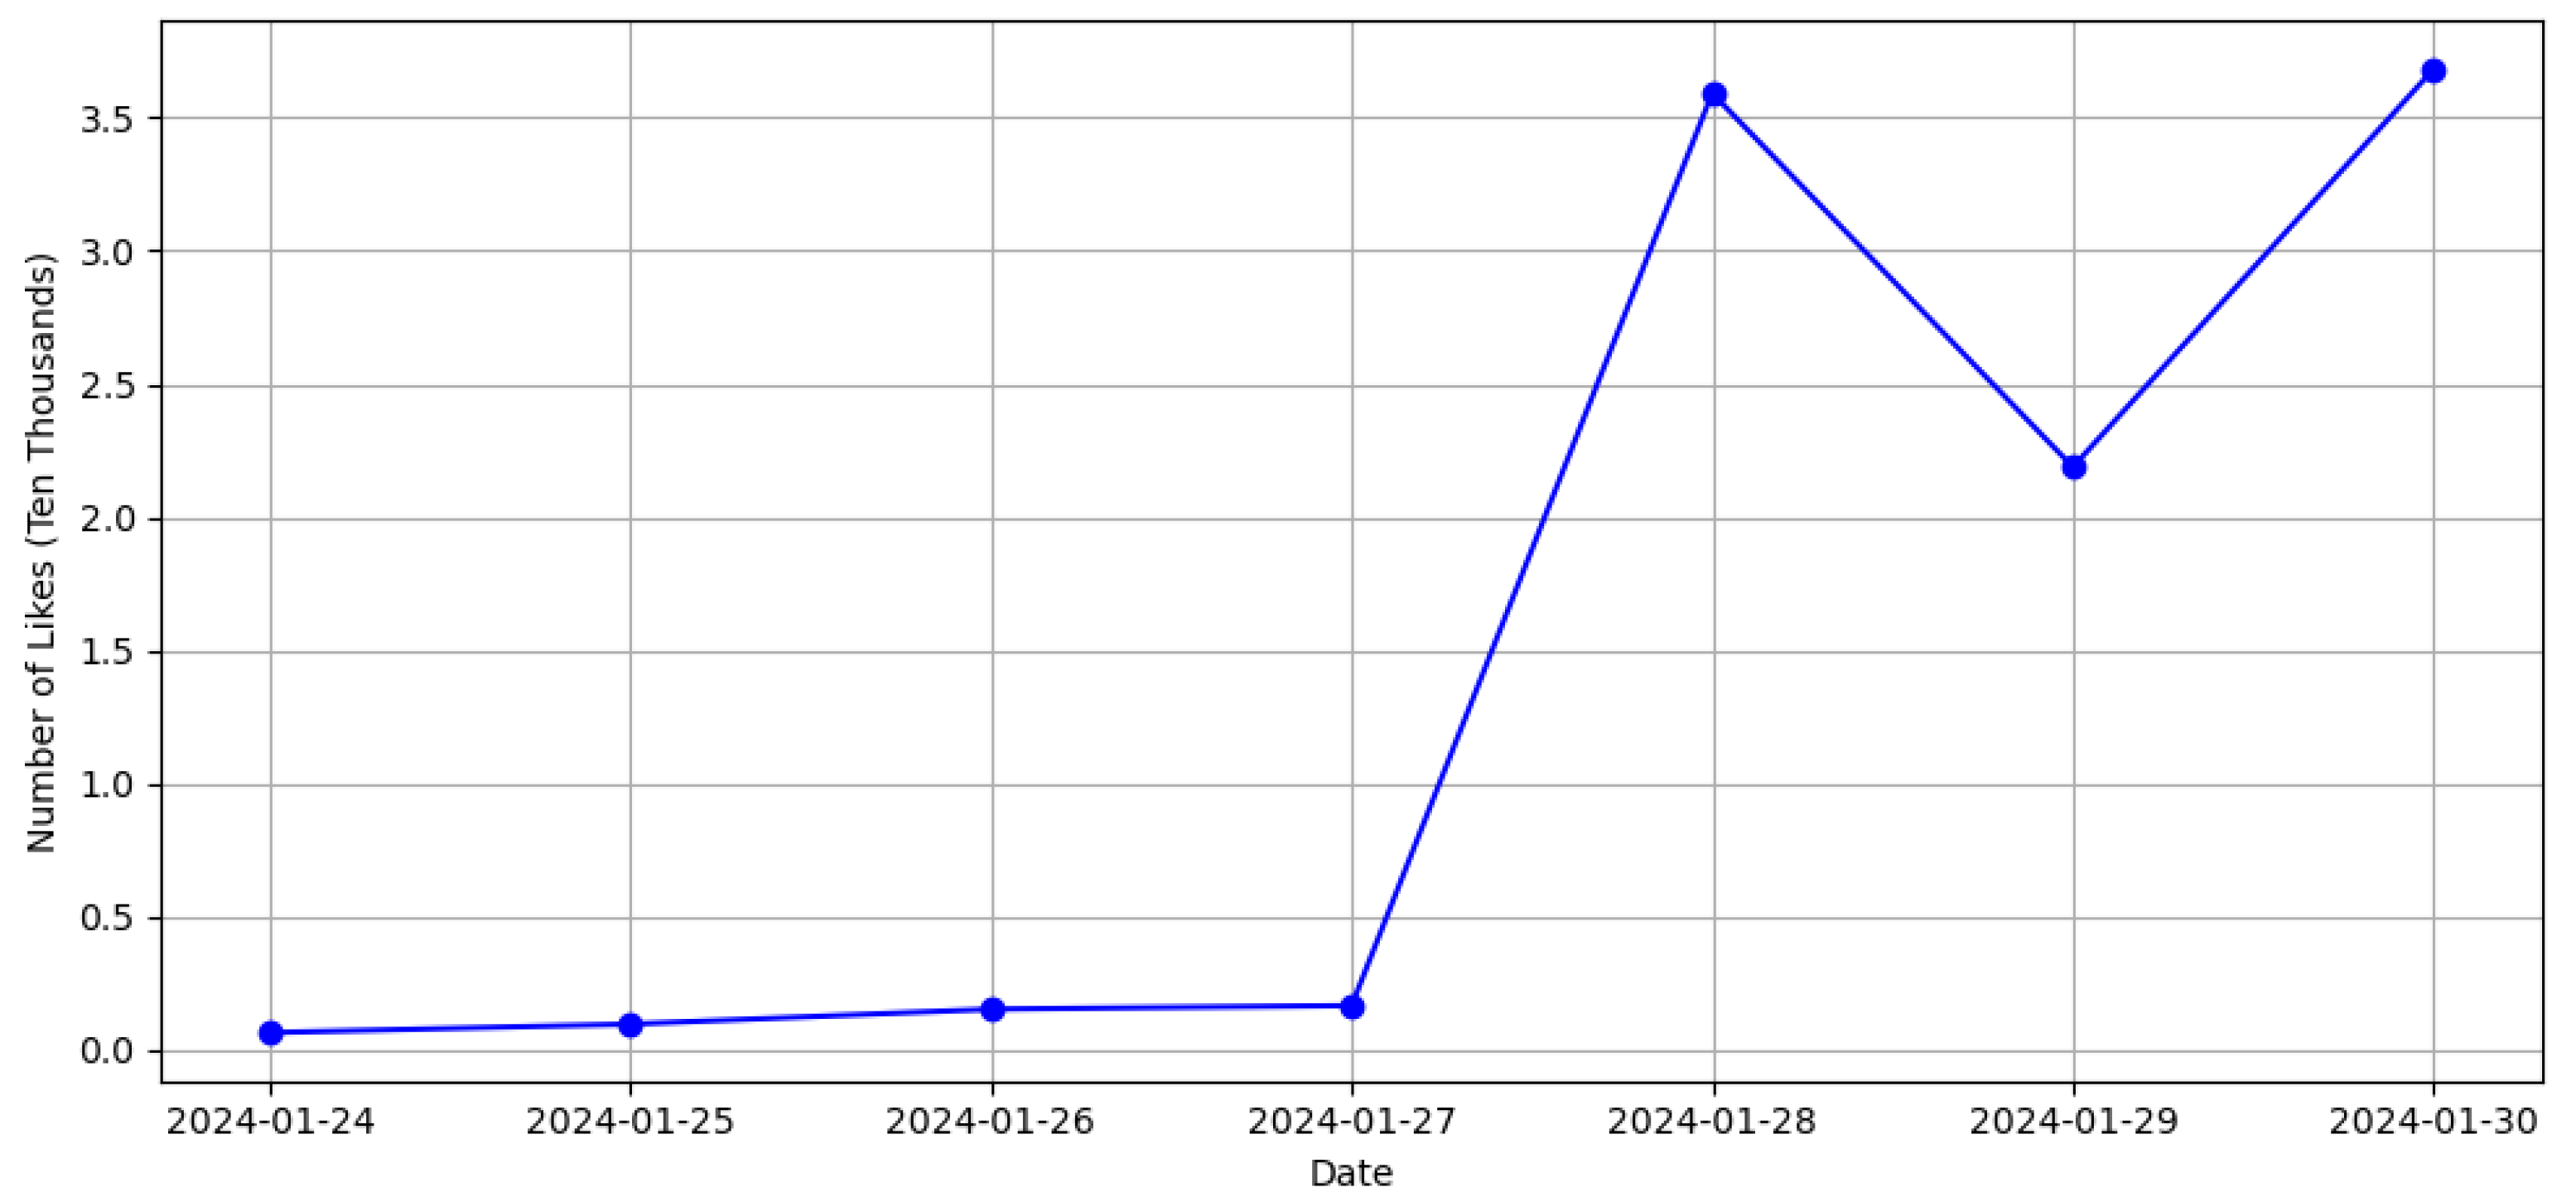
5.2. Comparison with the Actual Event

This section commences with an exposition of a notable event related to the Xinjiang destination brand on TikTok as the case study. Following this introduction, the essential values used to simulate the event’s diffusion process on the platform are discussed.
The incident triggered a heated debate on TikTok. The trend of the voice volume of social media platforms for one week (24–30 January) is depicted in Figure 11 and Figure 12, respectively. This article takes the hot event of “TikTok’s Short Video Account of Xinjiang Culture and Tourism—Editors, Post-Millennials, Aid in the Promotion of Xinjiang Tourism Publicity” at the end of January 2024 as an example. Subsequent to the unfolding of this event, there was a heated discussion on the TikTok platform. Its volume trend on social media platforms from 24 to 30 January is shown in Figure 11 and Figure 12.
The analysis of the graphical data reveals that, in the early period after the occurrence of this hot event, the trend of its voice volume kept rising, but the rise was slow. It peaked around the evening of 28 January, 120 h following the event’s occurrence. Thereafter, the voice volume of this event started to decrease continuously. At about 145 h after the outbreak of this event, the voice volume associated with the event began to rise again to reach a second peak. In the process of spreading hotspot events, users’ interests in the event ranged from paying attention to the event to spreading the event and then losing interest in the event. The related events triggered by the event attracted users to spread the event again so that the volume of the hot event increased again. The data utilized for the simulation experiment was collected from TikTok, which was calculated according to the hot video liking rate of around 20%. A total of about 200,000 event-related users were acquired (data source: https://trendinsight.oceanengine.com/) (accessed on 7 February 2024). The collection time was from 4 to 7 February 2024. This paper uses the calculated TikTok user data set. In the event of “Editors, Post-Millennials Aid in the Promotion of Xinjiang Tourism Publicity”, released by Tik-Tok account-Xinjiang New Oriental Cultural Tourism gained more interactions. The geographical distribution of the dissemination process for hot events containing about 200,000 user nodes is shown in Figure 13. Where the target group index (TGI) indicates the preference of a certain group for the content of the keyword/video, etc., TGI100 is the broad market level. The higher the TGI, the more attention the users pay to that part of the content.
The analysis of the heat map reveals a concentration of netizen interactions within the network map of hot events, predominantly localized in the north-western region of the country, especially in Xinjiang locally. Regions with TGI of 100 or above include Xinjiang and Shaanxi, which indicates the small-world character of this network diagram. Therefore, in the simulation experiment, we can set N = 200,000 ,   S t = 199,999 ,   E t = 0 ,   I t = 1 ,   R t = 0 ,   I 0 = 0 ,   a n d   t = 168 . The simulation results are shown in Figure 14 and Figure 15, respectively.
The analysis of the simulation outcomes reveals that the population of susceptible users of the event was stable at the peak in the first 50 h or so after the occurrence of the event. During the 50–100 h period following the event’s outbreak, most of the users who followed the event shifted from susceptible to exposed users and continued to follow the event. In the middle of the time after the occurrence of the event, the exposed users who paid attention to the event quickly shifted to become the infected users of the event, and the number of infected users peaked at about 110 h after the occurrence of the event, which showed that this event was an explosive hot event. However, beyond this peak, the number of infected users gradually decreased, changing into the recovered users of the event. Concurrently, the associated incidents of this event triggered a secondary dissemination. This brought users’ attention to the event again, which led to an increase in the number of users. If we only refer to the dissemination result figure, it can be clearly observed that the destination event dissemination in these simulation results basically matches with the dissemination law of the voice volume trend of the dissemination of this hot event within social media. Also, the presented values almost match the sum of the number of likes and retweets, indicating that the constructed model has a strong match with reality. This congruence between the simulated results and empirical data underscores the robustness of the model in replicating the dissemination patterns of hot events within social media contexts.

6. Conclusions

6.1. Theoretical Contributions

In this paper, we studied the diffusion mechanism of hot events in social media and the influencing factors on destination brand building during the communication process through agent-based modeling and simulation. Firstly, the simulation results demonstrate that the diffusion of hot events experiences an increase at first among susceptibles and then goes through a decrease before the secondary dissemination happens. Secondly, the results indicate how the communication rates during the diffusion process influence the diffusion effect. The infection rate influences the conversion rate from susceptible individuals to exposed individuals to follow the events representing the scope of influence. In addition, the dissemination rate exerts effects on the information spreading speed. And the removing rate influences the period of hot events where infected individuals change to removers and the infected individuals peak in number, showing the attractiveness of the events. Thirdly, the simulation model in this research is the first diffusion model considering the secondary dissemination of hot events within social media. The secondary infection rate influences the amount of the secondarily infected individuals and then impacts the spheres of influence. This is highly consistent with the reality of event dissemination on social media.

6.2. Managerial Implications

In this paper, an improved SEIR model is proposed for the mechanism of destination hot event dissemination in social media, and its effectiveness is verified by the simulation model. This has some value for the destinations to apply hot event dissemination on social media platforms to build a strong brand image. Firstly, the destinations need to focus on several conversion rates during the event diffusion process that influence the diffusion scope and effect. Therefore, the conclusions of this research can guide destinations to employ targeted marketing strategies based on their communication goals, which may help destinations to build a strong brand image. And secondly, this research can help destinations concentrate on the influences of secondary diffusion to increase the attractiveness and effect of the events to form a competitive brand.

6.3. Limitations and Future Research Directions

Nevertheless, the current case confronted two main limitations. One is the lack of accurate data from social media platforms. In the big data era, there is a large amount of data showing a variety of topics on many social media platforms. Considering this, more precise data would lead to outcomes that are more aligned with reality. The other limitation is that this research focuses only on the diffusion process of event dissemination and the conversion rate during this process. It ignores other factors influencing the diffusion outcomes, such as the influences of opinion leaders and destination brand image. Hence, should data become available, integrating additional influencing factors into the model could offer further insights and yield more precise outcomes in subsequent advancements.

Author Contributions

Conceptualization, L.D.; methodology, L.D. and J.T.; software, J.T.; validation, L.D., J.T. and D.H.; formal analysis, L.D., J.T. and D.H.; investigation, L.D. and J.T.; resources, L.D.; data curation, J.T.; writing—original draft preparation, L.D., J.T. and D.H.; writing—review and editing, L.D., J.T., D.H., H.Z. and Z.W.; visualization, J.T. and D.H.; supervision, H.Z. and Z.W.; project administration, Beijing municipal education commission; funding acquisition, Z.W. All authors have read and agreed to the published version of the manuscript.

Funding

This research was funded by The Project of Cultivation for young top-motch Talents of Beijing Municipal Institutions (No. BPHR202203237).

Data Availability Statement

Data are contained within the article.

Conflicts of Interest

The authors declare no conflicts of interest.

References

  1. Petrosyan, A. Number of Internet and Social Media Users Worldwide as of October 2023. Available online: https://www.statista.com/statistics/617136/digital-population-worldwide/ (accessed on 1 December 2023).
  2. Ortiz-Ospina, E. The Rise of Social Media. Available online: https://ourworldindata.org/rise-of-social-media (accessed on 1 December 2023).
  3. Ananda, A.S.; Hernández-García, Á.; Lamberti, L. N-REL: A Comprehensive Framework of Social Media Marketing Strategic Actions for Marketing Organizations. J. Innov. Knowl. 2016, 1, 170–180. [Google Scholar] [CrossRef]
  4. Wang, H.; Yan, J. Effects of Social Media Tourism Information Quality on Destination Travel Intention: Mediation Effect of Self-Congruity and Trust. Front. Psychol. 2022, 13, 1049149. [Google Scholar] [CrossRef] [PubMed]
  5. Thomas, H. Social Media Has the Greatest Influence on Travel Destination Choices. Available online: https://www.statista.com/chart/30135/media-influences-on-travel-destination/ (accessed on 1 December 2023).
  6. Pike, S.; Page, S.J. Destination Marketing Organizations and Destination Marketing: A Narrative Analysis of the Literature. Tour. Manag. 2014, 41, 202–227. [Google Scholar] [CrossRef]
  7. Huang, G.I.; Karl, M.; Wong, I.A.; Law, R. Tourism Destination Research from 2000 to 2020: A Systematic Narrative Review in Conjunction with Bibliographic Mapping Analysis. Tour. Manag. 2023, 95, 104686. [Google Scholar] [CrossRef]
  8. Benckendorff, P.; Zehrer, A. A Network Analysis of Tourism Research. Ann. Tour. Res. 2013, 43, 121–149. [Google Scholar] [CrossRef]
  9. Wong, I.A.; Song, Y.C.; Zhang, C. Not All Films Are Created the Same: Understanding the Cross-Level Effect of Movie Ratings on Destination Image Creation. J. Travel Tour. Mark. 2021, 38, 356–367. [Google Scholar] [CrossRef]
  10. Chekalina, T.; Fuchs, M.; Lexhagen, M. Customer-Based Destination Brand Equity Modeling: The Role of Destination Resources, Value for Money, and Value in Use. J. Travel Res. 2018, 57, 31–51. [Google Scholar] [CrossRef]
  11. Luo, Q.; Zhai, X. “I Will Never Go to Hong Kong Again!” How the Secondary Crisis Communication of “Occupy Central” on Weibo Shifted to a Tourism Boycott. Tour. Manag. 2017, 62, 159–172. [Google Scholar] [CrossRef] [PubMed]
  12. Barreda, A.A.; Nusair, K.; Wang, Y.; Okumus, F.; Bilgihan, A. The Impact of Social Media Activities on Brand Image and Emotional Attachment: A Case in the Travel Context. J. Hosp. Tour. Technol. 2020, 11, 109–135. [Google Scholar] [CrossRef]
  13. Morgan, N.; Pritchard, A.; Pride, R. Tourism Places, Brands, and Reputation Management. In Destination Brands, 3rd ed.; Morgan, N., Pritchard, A., Pride, R., Eds.; Butterworth-Heinemann: Oxford, UK, 2011; pp. 3–19. ISBN 978-0-08-096930-5. [Google Scholar]
  14. Zenker, S.; Braun, E. Branding a City: A Conceptual Approach for Place Branding and Place Brand Management. In Proceedings of the 39th EMAC Annual Conference, Frederiksberg, Denmark, 1–4 June 2010. [Google Scholar]
  15. Blain, C.; Levy, S.E.; Ritchie, J.B. Destination Branding: Insights and Practices from Destination Management Organizations. J. Travel Res. 2005, 43, 328–338. [Google Scholar] [CrossRef]
  16. Lee, G.; O’Leary, J.T.; Hong, G.S. Visiting Propensity Predicted by Destination Image: German Long-Haul Pleasure Travelers to the US. Int. J. Hosp. Tour. Adm. 2002, 3, 63–92. [Google Scholar] [CrossRef]
  17. Ritchie, J.; Ritchie, J. The Branding of Tourism Destinations. In Proceedings of the Annual Congress of the International Association of Scientific Experts in Tourism, Marrakech, Morocco, September 1998. Available online: https://citeseerx.ist.psu.edu/document?repid=rep1&type=pdf&doi=f04795dd595c0aeb22bf202f6626caac80987644 (accessed on 1 December 2023).
  18. Kotsi, F.; Pike, S. Destination Brand Positioning Theme Development Based on Consumers’ Personal Values. J. Hosp. Tour. Res. 2021, 45, 573–587. [Google Scholar] [CrossRef]
  19. Hankinson, G. Relational Network Brands: Towards a Conceptual Model of Place Brands. J. Vacat. Mark. 2004, 10, 109–121. [Google Scholar] [CrossRef]
  20. Seyyedamiri, N.; Khosravani, A. Identification of the Effective E-Promotional Tools on Improving Destination Brand Image. J. Glob. Inf. Manag. JGIM 2020, 28, 169–183. [Google Scholar] [CrossRef]
  21. Andéhn, M.; Kazeminia, A.; Lucarelli, A.; Sevin, E. User-Generated Place Brand Equity on Twitter: The Dynamics of Brand Associations in Social Media. Place Brand. Public Dipl. 2014, 10, 132–144. [Google Scholar] [CrossRef]
  22. Edwards, D.; Cheng, M.; Wong, I.A.; Zhang, J.; Wu, Q. Ambassadors of Knowledge Sharing: Co-Produced Travel Information through Tourist-Local Social Media Exchange. Int. J. Contemp. Hosp. Manag. 2017, 29, 690–708. [Google Scholar] [CrossRef]
  23. Bazzanella, F.; Bichler, B.F.; Schnitzer, M. Collaboration and Meta-Organisation in Event Tourism–Effects of the Olympic Agenda 2020 on Planning the 2026 Winter Olympics. Tour. Manag. Perspect. 2022, 41, 100939. [Google Scholar] [CrossRef]
  24. Shao, J.; Li, X.; Morrison, A.M.; Wu, B. Social Media Micro-Film Marketing by Chinese Destinations: The Case of Shaoxing. Tour. Manag. 2016, 54, 439–451. [Google Scholar] [CrossRef]
  25. Williams, N.L.; Inversini, A.; Ferdinand, N.; Buhalis, D. Destination eWOM: A Macro and Meso Network Approach? Ann. Tour. Res. 2017, 64, 87–101. [Google Scholar] [CrossRef]
  26. Wong, C.U.I.; Qi, S. Tracking the Evolution of a Destination’s Image by Text-Mining Online Reviews-the Case of Macau. Tour. Manag. Perspect. 2017, 23, 19–29. [Google Scholar] [CrossRef]
  27. Wang, Z.; Liu, W.; Sun, Z.; Zhao, H. Understanding the World Heritage Sites’ Brand Diffusion and Formation via Social Media: A Mixed-Method Study. Int. J. Contemp. Hosp. Manag. 2023, 36, 602–631. [Google Scholar] [CrossRef]
  28. Horowitz, D.M. The New Community Rules: Marketing on the Social Web. J. Prod. Brand Manag. 2010, 19, 461–463. [Google Scholar] [CrossRef]
  29. Zhou, X.; Liang, W.; Luo, Z.; Pan, Y. Periodic-Aware Intelligent Prediction Model for Information Diffusion in Social Networks. IEEE Trans. Netw. Sci. Eng. 2021, 8, 894–904. [Google Scholar] [CrossRef]
  30. Zhou, X.; Liang, W.; Wang, K.I.-K.; Huang, R.; Jin, Q. Academic Influence Aware and Multidimensional Network Analysis for Research Collaboration Navigation Based on Scholarly Big Data. IEEE Trans. Emerg. Top. Comput. 2021, 9, 246–257. [Google Scholar] [CrossRef]
  31. He, Z.; Cai, Z.; Yu, J. Latent-Data Privacy Preserving with Customized Data Utility for Social Network Data. IEEE Trans. Veh. Technol. 2018, 67, 665–673. [Google Scholar] [CrossRef]
  32. Dong, S.; Deng, Y.-B.; Huang, Y.-C. SEIR Model of Rumor Spreading in Online Social Network with Varying Total Population Size. Commun. Theor. Phys. 2017, 68, 545. [Google Scholar] [CrossRef]
  33. Li, M.; Wang, X.; Gao, K.; Zhang, S. A Survey on Information Diffusion in Online Social Networks: Models and Methods. Information 2017, 8, 118. [Google Scholar] [CrossRef]
  34. Zhao, Y.; Kou, G.; Peng, Y.; Chen, Y. Understanding Influence Power of Opinion Leaders in E-Commerce Networks: An Opinion Dynamics Theory Perspective. Inf. Sci. 2018, 426, 131–147. [Google Scholar] [CrossRef]
  35. Ben-Naim, E.; Krapivsky, P. Scaling Behavior of Threshold Epidemics. Eur. Phys. J. B 2012, 85, 145. [Google Scholar] [CrossRef]
  36. Hethcote, H.W.; van den Driessche, P. Some Epidemiological Models with Nonlinear Incidence. J. Math. Biol. 1991, 29, 271–287. [Google Scholar] [CrossRef] [PubMed]
  37. Kermack, W.O.; McKendrick, A.G. A Contribution to the Mathematical Theory of Epidemics. Proc. R. Soc. London. Ser. A Contain. Pap. A Math. Phys. Character 1927, 115, 700–721. [Google Scholar]
  38. Goffman, W.; Newill, V. A Generalization of Epidemic Theory: An Application to the Transmission of Ideas. Nature 1964, 204, 225–228. [Google Scholar] [CrossRef] [PubMed]
  39. Anderson, R.M.; May, R.M. Infectious Diseases of Humans: Dynamics and Control; Oxford University Press: Oxford, UK, 1991. [Google Scholar]
  40. Garas, A.; Argyrakis, P.; Rozenblat, C.; Tomassini, M.; Havlin, S. Worldwide Spreading of Economic Crisis. N. J. Phys. 2010, 12, 113043. [Google Scholar] [CrossRef]
  41. Wang, H.; Deng, L.; Xie, F.; Xu, H.; Han, J. A New Rumor Propagation Model on SNS Structure. In Proceedings of the 2012 IEEE International Conference on Granular Computing, Hangzhou, China, 11–13 August 2012; pp. 499–503. [Google Scholar]
  42. Wang, Y.; Cao, J.; Alsaedi, A.; Ahmad, B. Edge-Based SEIR Dynamics with or without Infectious Force in Latent Period on Random Networks. Commun. Nonlinear Sci. Numer. Simul. 2017, 45, 35–54. [Google Scholar] [CrossRef]
  43. Zhao, L.; Yuan, R.; Guan, X.; Li, M. Propagation Modeling and Analysis of Incidental Topics in Blogosphere. In Proceedings of the Online Communities and Social Computing: Third International Conference, OCSC 2009, Held as Part of HCI International 2009, San Diego, CA, USA, 19–24 July 2009; Proceedings 3. Springer: Berlin/Heidelberg, Germany, 2009; pp. 401–410. [Google Scholar]
  44. Jiang, P.; Yan, X. A Quantitative Model for the Spread of Online Information. Qual. Quant. 2019, 53, 1981–2001. [Google Scholar] [CrossRef]
  45. Xie, T.; Wei, Y.; Chen, W.; Huang, H. Parallel Evolution and Response Decision Method for Public Sentiment Based on System Dynamics. Eur. J. Oper. Res. 2020, 287, 1131–1148. [Google Scholar] [CrossRef] [PubMed]
  46. Li, Q.; Du, Y.; Li, Z.; Hu, J.; Hu, R.; Lv, B.; Jia, P. HK–SEIR Model of Public Opinion Evolution Based on Communication Factors. Eng. Appl. Artif. Intell. 2021, 100, 104192. [Google Scholar] [CrossRef]
  47. Chen, T.; Rong, J.; Yang, J.; Cong, G. Modeling Rumor Diffusion Process with the Consideration of Individual Heterogeneity: Take the Imported Food Safety Issue as an Example during the COVID-19 Pandemic. Front. Public Health 2022, 10, 781691. [Google Scholar] [CrossRef] [PubMed]
  48. Fang, B.; Jia, Y.; Han, Y.; Li, S.; Zhou, B. A Survey of Social Network and Information Dissemination Analysis. Chin. Sci. Bull. 2014, 59, 4163–4172. [Google Scholar] [CrossRef]
  49. Tian, C.; Xiao, T.; Shang, J. Channel Differentiation Strategy in a Dual-Channel Supply Chain Considering Free Riding Behavior. Eur. J. Oper. Res. 2022, 301, 473–485. [Google Scholar] [CrossRef]
  50. Railsback, S.F.; Grimm, V. Agent-Based and Individual-Based Modeling: A Practical Introduction; Princeton University Press: Princeton, NJ, USA, 2019. [Google Scholar]
  51. Koponen, I.T. Agent-Based Modeling of Consensus Group Formation with Complex Webs of Beliefs. Systems 2022, 10, 212. [Google Scholar] [CrossRef]
  52. Zhang, M.; Qin, S.; Zhu, X. Information Diffusion under Public Crisis in BA Scale-Free Network Based on SEIR Model—Taking COVID-19 as an Example. Phys. A Stat. Mech. Its Appl. 2021, 571, 125848. [Google Scholar] [CrossRef]
Figure 1. SEIR Information Dissemination Path.
Systems 12 00124 g001
Figure 2. Improved SEIR Model on Information Dissemination.
Systems 12 00124 g002
Figure 3. Evolution Path of Destination Hot Events.
Systems 12 00124 g003
Figure 4. Simulation Results of Infection Rate Change.
Systems 12 00124 g004
Figure 5. Simulation Results of Dissemination Rate Change.
Systems 12 00124 g005
Figure 6. Simulation Results of Removing Rate Change.
Systems 12 00124 g006
Figure 7. Simulation Results of Secondary Infection Rate Change.
Systems 12 00124 g007
Figure 8. Simulation Results of User’s Adoption Rate Change.
Systems 12 00124 g008
Figure 9. Simulation Results of Dissemination and Recovering Rate Inverse Change.
Systems 12 00124 g009
Figure 10. Simulation Results of Dissemination and Recovering Rate Isotropic Change.
Systems 12 00124 g010
Figure 11. Number of Likes of Hot Events.
Systems 12 00124 g011
Figure 12. Number of Retweets of Hot Events.
Systems 12 00124 g012
Figure 13. The Geographical Distribution of the Hot Event Dissemination.
Systems 12 00124 g013
Figure 14. Overall Results of Hot Event Simulation.
Systems 12 00124 g014
Figure 15. Dissemination and Secondary Dissemination Results Pruning Chart.
Systems 12 00124 g015
Table 1. Key Concept in Destination Brand Diffusion in Social Media Based on SEIR Model.
SEIR ModelConcept in Destination Brand Diffusion in Social Media
S (susceptible)Susceptible individuals who pay close attention to destination branding events in large numbers.
E (exposed)Lurkers who are interested in a destination hot event but are neutral about it and waiting to see what will happen.
I (infected)Communicators who are aware of hot events in the destination and then communicate the information on the social media platform.
R (recovered)Movers who have lost interest in destination hot events and no longer participate in communications.
I0 (secondarily infected)Communicators who are re-informed about hot events in the destination and then spread the information for a second time.
Table 2. Parameter settings for simulation experiments.
Project α β δ θ 1 = θ 2 μ
10.30.20.050.010.0005
20.150.20.050.010.0005
30.60.20.050.010.0005
40.30.10.050.010.0005
50.30.050.050.010.0005
60.30.20.10.010.0005
70.30.20.20.010.0005
80.30.20.050.0010.0005
90.30.20.050.10.0005
100.30.20.050.010.005
110.30.20.050.010.05
120.30.10.10.010.0005
130.30.050.20.010.0005
140.30.40.10.010.0005
150.30.10.0250.010.0005
Disclaimer/Publisher’s Note: The statements, opinions and data contained in all publications are solely those of the individual author(s) and contributor(s) and not of MDPI and/or the editor(s). MDPI and/or the editor(s) disclaim responsibility for any injury to people or property resulting from any ideas, methods, instructions or products referred to in the content.

