1. Introduction
In recent years, public health emergencies frequently invade people’s daily lives. The recent outbreak of public health emergencies in COVID-19 has kept people isolated in recent years, and their demand for consumption has gradually shifted from “offline” to “online”. This change has promoted the development of the logistics industry to a certain extent and made people realize the importance of the logistics industry. Still, it also made the logistics industry realize some of its problems. Public health emergencies cause people to be unable to go out for a long time, resulting in a shortage of distribution personnel. Different epidemic prevention policies in different places have led to the reduction of delivery timeliness. Improper sterilization or intensive pick-up personnel, the spread of viruses in the process of express delivery, people’s growing consumer demand, and the difficulties in logistics terminal delivery have become intractable problems under public health emergencies. Therefore, this paper makes scientific evaluation and analysis of logistics terminal distribution risk under public health emergencies and puts forward corresponding countermeasures. The aim is to reduce the impact of potential risks of logistics terminal distribution as much as possible and avoid the paralysis of logistics terminal distribution when public health emergencies occur.
In the usual process of logistics terminal distribution, there will often be damage or loss of goods, user information disclosure, and accidents of distribution personnel. In the context of public health emergencies, there will also be risks of virus infection and low delivery timeliness due to policies and regulations. Therefore, on the basis of combing the existing research [
1,
2,
3], this paper combines the characteristics of the background of public health emergencies [
4]. In this paper, the risks of logistics terminal distribution under the background of public health emergencies are summarized as personnel risk, information risk, cargo risk and environmental risk. And this paper establishes the logistics terminal distribution risk index system under public health emergencies.
At present, there are many studies on the risk assessment at home and abroad [
5,
6,
7,
8,
9,
10,
11,
12,
13,
14,
15]. However, there is no study on the risk assessment of logistics terminal distribution based on public health emergencies. The single risk assessment method has its corresponding shortcomings to solve this kind of problem. The grey correlation method requires high sample data, which makes the evaluation result unreliable. A fuzzy comprehensive evaluation method can effectively deal with qualitative data, but its membership degree is sometimes difficult to determine, and the weight of indicators is also subjective. The TOPSIS method can fully use the original data, but it is also subjective when determining the weight.
Based on the above considerations, this paper takes the public health emergencies affecting people in recent years as the research background. We propose that the risk caused by public health emergencies should be considered in the risk assessment of logistics terminal distribution, using intuitionistic fuzzy set theory and the intuitionistic fuzzy entropy weight method to come ture the quantitative transformation and objective weighting of qualitative indicators. Then, this paper combines fuzzy theory with grey theory to establish a grey fuzzy comprehensive evaluation model. We assign values to the risk indicators that are difficult to quantify, so as to make the evaluation results as objective and fair as possible and improve the scientific nature of the evaluation. We evaluate and study the risk indicators from two evaluation angles: the degree of influence after the risk occurs, and the possibility of the risk.
To sum up, this paper has the following contributions: (1) This paper constructs a logistics terminal distribution risk assessment index system. Unlike previous studies, this paper considers the impact of public health emergencies and constructs a logistics terminal distribution risk index system under public health emergencies. (2) This paper combines the intuitionistic fuzzy entropy weight method and the grey fuzzy comprehensive evaluation method for the first time to evaluate the risk of logistics terminal distribution. (3) This paper adds the influence of public health emergencies to the risk control of logistics terminal distribution.
The rest of the paper is organized as follows: in the second part, we summarize a series of related documents and review the literature. In the third part, we introduce the risk assessment methods related to the text. In the fourth part, we make a case analysis according to the previous calculation method. In the fifth part, we analyze and summarize the results of the case study and draw a conclusion.
2. Literature Review
2.1. Public Health Emergencies
Haffajee et al. [
4] has defined public health emergencies. He et al. [
16] put forward a new emergency medical logistics model to deal with public health emergencies quickly. Wang et al. [
17] paid attention to the three-dimensional goals of humanitarian logistics: efficiency, effectiveness and fairness. Then, proposed an emergency material distribution model with multiple rescue points, multiple impact points and multiple periods. Kundu et al. [
18] outlined the field of emergency logistics over the last 25 years. And put forward the themes of “the self-organized response system of emergency logistics management” and “an integrated emergency transportation logistics system”.
To sum up, most of the current literature on public health emergencies is combined with emergency logistics [
19]. There is little research on the combination of logistics terminal distribution.
2.2. Risk Assessment of Logistics
Zhang et al. [
20] used the improved maximum deviation method to calculate the weight of each risk index, ranked the importance of the index, and then used the improved catastrophe progression method to evaluate the risk model of agricultural products cold chain logistics. Liu et al. [
21] proposed an improved FMEA model as a risk assessment method, considering experts’ limited rational behavior. Zhang et al. [
22] developed a risk assessment and detection model based on historical detection data to evaluate the risks in cold chain logistics. Han et al. [
23] established a risk assessment model based on a Bayesian network to assess the risk of urban logistics of unmanned aerial vehicles. Chen et al. [
24] used Bayesian theory, to establish a DBN risk assessment model to assess the risk of dairy cold chain logistics. Fu et al. [
25] combined the extension decision model and entropy weight method to evaluate the risk of the imported cold chain logistics safety supervision system. Shanker et al. [
26] combined the fuzzy analytic hierarchy process and fuzzy TOPSIS method to evaluate the risk of third-party logistics in the restaurant supply chain. Lu et al. [
27] considered the risk preference of 4PL integrators in the auction process. And the auction scoring function of 4PL-integrator was established by using prospect theory. Then, a two-stage auction mechanism for the selection of third-party logistics suppliers under risk aversion was designed. Rathore et al. [
28] put forward a method of combining the grey analytic hierarchy process and grey technology to establish a comprehensive risk index to evaluate the risk to the food supply chain.
To sum up, at present, most of the literature is about the risk assessment of logistics and supply chains, and there are few articles about the risk assessment of the logistics terminal distribution process. This paper will evaluate the risk of logistics terminal distribution under public health emergencies to fill the gap in this field.
2.3. Risk Assessment Method
Wu et al. [
5] proposed the concept of intuitionistic fuzzy weighted entropy and a new method to solve the problem of intuitionistic fuzzy multi-criteria decision-making. Zhang et al. [
6] used the intuitionistic fuzzy entropy weight method and another method to effectively solve the optimization problem of the manufacturing service supply chain. Yuan et al. [
7] proposed an optimal weight method based on intuitionistic fuzzy entropy minimization to solve multi-attribute group decision-making problems. Zhang et al. [
8] proposed an extended genetic algorithm based on an interval-valued intuitionistic fuzzy entropy weight method to solve the fuzzy mixed integer linear programming model. Zhou et al. [
9] established a combined evaluation model combining fuzzy comprehensive evaluation and grey relational analysis. Li et al. [
10] established a mathematical model to evaluate the fire risk by combining the grey risk degree method, analytic hierarchy process, and fuzzy evaluation method. Wu et al. [
11] established the evaluation model of grey fuzzy correlation analysis theory to evaluate the safety grade of highway construction. AlAlawin et al. [
12] proposed a comprehensive evaluation algorithm that combines grey relational analysis, fuzzy comprehensive evaluation, data envelopment analysis, and an interval-two fuzzy logic system to evaluate warehouses. Minguito et al. [
13] used the method of grey relational analysis to verify that the failure mode and impact analysis methods would determine the priority issues related to the risks to the humanitarian supply chain.
This paper combines the intuitive fuzzy entropy weight method and grey fuzzy evaluation to realize the quantitative transformation and objective weighting of qualitative indicators. It is also possible to assign values to risk indicators that are difficult to quantify, to make the evaluation results as objective and fair as possible, and to improve the scientific evaluation.
3. Index System Construction and Evaluation Method
3.1. Principles for Establishing a Risk Index System
The construction of a logistics terminal distribution risk assessment index system under public health emergencies is the aim of this paper. It is necessary to design a reasonable risk assessment index system and select key risk indicators to accurately measure the risk of cold chain logistics. In order to establish a scientific and rational indicator system, we have identified the following basic principles to ensure the objectivity and reliability of evaluation results:
The principle of rationality. There must be a certain logical relationship between the indicators. They need to be independent of each other, but they need to be connected. Each index should be able to measure the risk degree of logistics terminal distribution from different angles and different dimensions.
The principle of scientificity. The evaluation indicators in each index system should objectively and truly reflect the basic characteristics of public health emergencies and logistics terminal distribution, so as to make the final evaluation results scientific.
The principle of comparability. Each indicator selected in the indicator system needs to be able to compare its risk horizontally and highlight its own characteristics to improve the accuracy and authenticity of the evaluation results.
The principle of hierarchy. The logistics terminal distribution risk index system should be subdivided according to the impact degree of each risk index to build a more intuitive and clear index structure.
3.2. Identification of the Risk Index
In the process of logistics terminal distribution, the two key activity subjects are people and goods. Therefore, we first identified two first-level risk indicators: personnel risk and goods risk. Suguna M. et al. [
29] summarized the major factors affecting last-mile delivery projects in the COVID-19 era. This includes information about the customer’s knowledge of the goods. And it highlights the impact of the COVID-19 era on last-mile delivery. Therefore, we identified two other primary risk indicators: information risk and environmental risk.
By reading relevant literature and following the above principles, this paper summarizes the risks of logistics terminal distribution [
1,
2,
3]. In addition, relevant risk indicators related to the impact of public health emergencies [
4,
29] are added. The following risk indicators are obtained:
3.2.1. Risks of Personnel
Online shopping has gradually become a mainstream shopping method. The increase in distribution demand has led to a corresponding increase in distribution personnel. This has led to uneven quality of distribution personnel. This has resulted in customer complaints caused by distribution staff and the loss of distribution staff. In the process of distribution, distribution personnel are also faced with the risks brought about by unexpected accidents. And when public health emergencies occur, people will also be at risk of being infected by viruses. Therefore, the risk indicators relating to personnel risk include: the risk of accidental injury, the risk of complaints caused by personnel quality, the risk of employee turnover and the risk of personnel infection.
3.2.2. Risks of Information
In the process of logistics distribution, the sharing of distribution information is also a criterion of customer satisfaction. Sometimes the distribution information is not updated in time and the distribution information is wrong. Attention must also be paid to the customer’s information security during the distribution process. Therefore, the risk indicators related to information risk include: the risk of untimely information transmission, the risk of network system security, the risk of customer information disclosure and the risk of information transmission distortion.
3.2.3. Risks of Goods
In the process of logistics distribution, goods are a crucial link. Goods may be lost and damaged in the process of logistics distribution. Customer satisfaction also depends on the delivery time [
30]. It is a common problem that goods are not delivered to customers on time. Even after the completion of logistics distribution, there is also the risk of customer return. Therefore, the risk indicators determined in the cargo risk category are: the risk of loss of goods, the risk of goods damage, the risk of untimely delivery of goods, and the risk of customer return.
3.2.4. Risks of the Environment
For logistics distribution, natural disasters will become a huge obstacle in the process of logistics distribution. The fluctuations of the macroeconomic environment will also have a certain impact on logistics distribution. With regard to the occurrence of public health emergencies, a series of policies and regulations issued by the state for public health emergencies will also be influencing factors for logistics distribution. Therefore, the indicators identified in the environmental risks category are: the risk of natural disaster, the risk of policy and regulation and the risk of economic fluctuation (The risk of policies and regulations here mainly refers to the effect of policies and regulations issued by the state when public health emergencies occur).
3.3. Construction of the Risk Index System
According to the above identification and analysis of risk indicators, the risk indicators of logistics terminal distribution under public health emergencies are established, as shown in
Table 1.
3.4. Determining the Index Weight
Since the data for calculating weights in this paper were collected by means of questionnaires, the data may be difficult to quantify and highly subjective. Based on the above considerations, this paper combines the intuitionistic fuzzy set and entropy weight methods. In this paper, the intuitionistic fuzzy entropy weight method is used to calculate the weight of risk assessment index to solve the problem of difficult data processing [
31,
32]. The detailed steps for weight calculation are as follows:
- (1)
Evaluate the indexes of each risk index by questionnaire. And convert the evaluation grades into intuitionistic fuzzy numbers by using intuitionistic fuzzy theory according to
Table 2 [
33].
- (2)
Construct the original decision matrix. Construct the original decision matrix of a × b. Where A is the number of secondary risk indicators. B is the number of evaluation indicators. The evaluation indicators are the degree of influence after the risk occurs and the possibility of the risk [
18].
Let the risk index be
, the evaluation index be
and the appraiser be
. The intuitionistic fuzzy decision matrix constructed by each appraiser is:
where:
is the intuitionistic fuzzy number of the appraisers (
) towards risk indicator (a) and evaluation indicator (b); where μ, v and π represent the membership degree, non-membership degree, and hesitation degree of intuitionistic fuzzy numbers respectively, and 0 ≤ μ + ν ≤ 1, π = 1 − μ − ν.
- (3)
Assemble the intuitionistic fuzzy decision matrix given by all evaluators into a group opinion.
where: IFWA is an intuitive fuzzy weighted average operator;
represents the weight of evaluators
,
and
. K is the total number of evaluators. The assembled intuitionistic fuzzy decision matrix is expressed as:
where:
is an aggregated intuitionistic fuzzy matrix;
is an aggregated intuitionistic fuzzy number corresponding to the risk indicator (a) and the evaluation indicator (b).
- (4)
The intuitionistic fuzzy entropy weight method is used to calculate the weight. In this paper, the intuitionistic fuzzy entropy weight method is used to calculate the weight of each risk index in the aggregation decision matrix
[
34]:
where:
is intuitionistic fuzzy entropy; and
is index weight.
3.5. The Grey Fuzzy Comprehensive Evaluation
The grey fuzzy comprehensive evaluation method effectively combines the advantages of grey evaluation and fuzzy evaluation. It fully considers the fuzziness and greyness of the data obtained by the expert scoring method. It not only solves the problem that membership degree is difficult to determine, but also overcomes the shortcomings of the traditional quantitative method which is too subjective. Based on the above considerations, this paper adopts the grey fuzzy comprehensive evaluation method to evaluate the risk of logistics terminal distribution [
35]. The specific steps are as follows.
3.5.1. Determining the Evaluation Grey Class, Grey Evaluation Coefficient, and Whitening Weight Function
The fuzzy evaluation set in this paper is a collection of evaluation results of risk indicators collected by questionnaire survey. In the logistics terminal distribution risk assessment system, the e values of the grey classes are 1, 2, 3, 4, and 5, respectively. The grey classes are determined to be five levels: very low, low, medium, high, and very high, which are assigned to 1, 3, 5, 7 and 9 in turn, and the adjacent risk values 2, 4, 6 and 8 are the levels between the above risk levels. Combined with the risk characteristics of logistics terminal distribution and previous literature research [
36], the calculation formula of the whitening weight function corresponding to each grey class is constructed, as shown in
Table 3.
If
is the risk value corresponding to the evaluation grade of the i-th expert on the j-th risk indicator, and the whitening weight function value is calculated according to
Table 3, then the corresponding grey evaluation coefficient is determined as follows:
where:
is the grey evaluation coefficient of the e-th evaluation of the J-th risk indicator by the I-th expert.
is the grey evaluation coefficient of the e-th evaluation of the J risk index for all experts.
is the total grey evaluation coefficient of all experts on the j-th risk index. I = 1, 2, …, h (h is the number of experts). J = 1, 2, …, m (m is the number of risk indicators). E = 1, 2, 3, 4, 5.
3.5.2. Calculating the Membership Degree of Risk Indicators and Constructing the Membership Matrix
The grey evaluation coefficient of the jth risk index is normalized to obtain the membership degree
of the risk index j to the e-th grey level. And a fuzzy membership matrix
is established as follows:
where: b = 1, 2, …, s, s is the number of first-level indicators. J = 1, 2, …, m, m is the number of secondary indicators.
3.5.3. Fuzzy Comprehensive Evaluation
To make a comprehensive evaluation of the membership matrix
of grey evaluation, use the weights calculated by the intuitive fuzzy entropy weight method to construct the weight vector
of secondary risk indicators, and use Formula (9) to calculate the fuzzy comprehensive evaluation vector of secondary risk indicators [
37], which is expressed by
:
Producing the judgment matrix B:
Use Formula (11) to calculate the fuzzy comprehensive evaluation vector of the first-level risk indicators, which is represented by a (w is the weight vector of the first-level indicators):
The comprehensive evaluation result of logistics terminal distribution risk is determined by A and evaluation grade vector L, and the evaluation result G is calculated by Formula (12):
where:
. Finally, the calculation results are analyzed to determine the risk level of logistics terminal distribution under public health emergencies and to think about coping strategies.
4. Case Study
4.1. Case Study Process
The case study process of this paper is shown in
Figure 1.
4.2. Risk Evaluation of the Index System
The authors of this paper conducted a questionnaire survey of employees of different positions in an e-commerce enterprise in China and used this data to calculate an example of the weight. Through the questionnaire survey of the employees of logistics enterprises, the four first-level risk indicators and the following fifteen second-level risk indicators are rated. The subjects surveyed in this paper were informed and volunteered to participate in this study. All personally identifiable information was removed and replaced with unique identifiers to ensure anonymity. Only the investigators have access to this data, which is securely stored in accordance with the applicable data protection regulations.
In this paper, 50 questionnaires were collected and converted into intuitionistic fuzzy numbers according to the conversion table in
Table 2. The intuitionistic fuzzy decision matrix of 50 questionnaires was obtained. The weight of each group of questionnaires is set to 1/50. Then, the intuitionistic fuzzy decision matrix
of the assembled first-level risk indicators is obtained according to Formulas (2) and (3), as shown in
Table 4.
According to Formulas (4) and (5), the weight vector W of the first-level index is calculated as follows:
The second-level indicators under B
1, B
2, B
3, and B
4 are calculated in the same way, and the weight vector of each second-level indicator is obtained. The secondary index aggregation decision matrix under B
1 is obtained, as shown in
Table 5.
According to Formulas (4) and (5), the weight vector W
1 of the secondary index under B
1 is calculated as follows:
See
Table 6 for the decision matrix of secondary index aggregation under B
2.
According to Formulas (4) and (5), the weight vector W
2 of secondary indicators under B
2 is calculated as follows:
See
Table 7 for the decision matrix of secondary index aggregation under B
3.
According to Formulas (4) and (5), the weight vector W
3 of the secondary index under B
3 is calculated as follows:
See
Table 8 for the decision matrix of secondary index aggregation under B
4.
According to Formulas (4) and (5), the weight vector W
4 of the secondary index under B
4 is calculated as follows:
So, the weight vector of each risk indicator is:
4.3. Establishing the Evaluation Matrix, Calculating the Grey Evaluation Coefficient and the Membership Degree
In this study, four professors from different universities in the field of logistics and distribution and an executive of an e-commerce company were invited to rate the risk indicators in this paper. The surveyed experts were informed and volunteered to participate in the study. All data collected in this study will be kept strictly confidential. All personally identifiable information was removed and replaced with unique identifiers to ensure anonymity. Only the investigators have access to this data, which is securely stored in accordance with the applicable data protection regulations. The score range of experts is from 1 to 9, and the score results are shown in
Table 9. According to the calculation formula of whitening weight function in
Table 3, the grey evaluation coefficient and membership degree of each index are obtained, and the calculation results are shown in
Table 10.
4.4. Fuzzy Comprehensive Evaluation
4.4.1. A Comprehensive Evaluation of Secondary Indicators
According to the data in
Table 9 and the weight vector of indicators, the fuzzy comprehensive evaluation vector is calculated according to Formula (9):
According to Formula (10), the judgment matrix B is obtained:
4.4.2. Comprehensive Evaluation of First-Level Indicators
According to Formula (11), the fuzzy comprehensive evaluation vector A of the first-level index is calculated as follows:
4.4.3. Comprehensive Evaluation of the Logistics Terminal Distribution Risk under Public Health Emergencies
According to Formula (12), the comprehensive risk evaluation value G of logistics terminal distribution under public health emergencies is calculated as follows:
The comprehensive risk evaluation value of logistics terminal distribution under public health emergencies is 7.007, which shows that the logistics terminal distribution has high risk when public health emergencies occur, which shows that this study is essential.
4.5. Results Analysis
- (1)
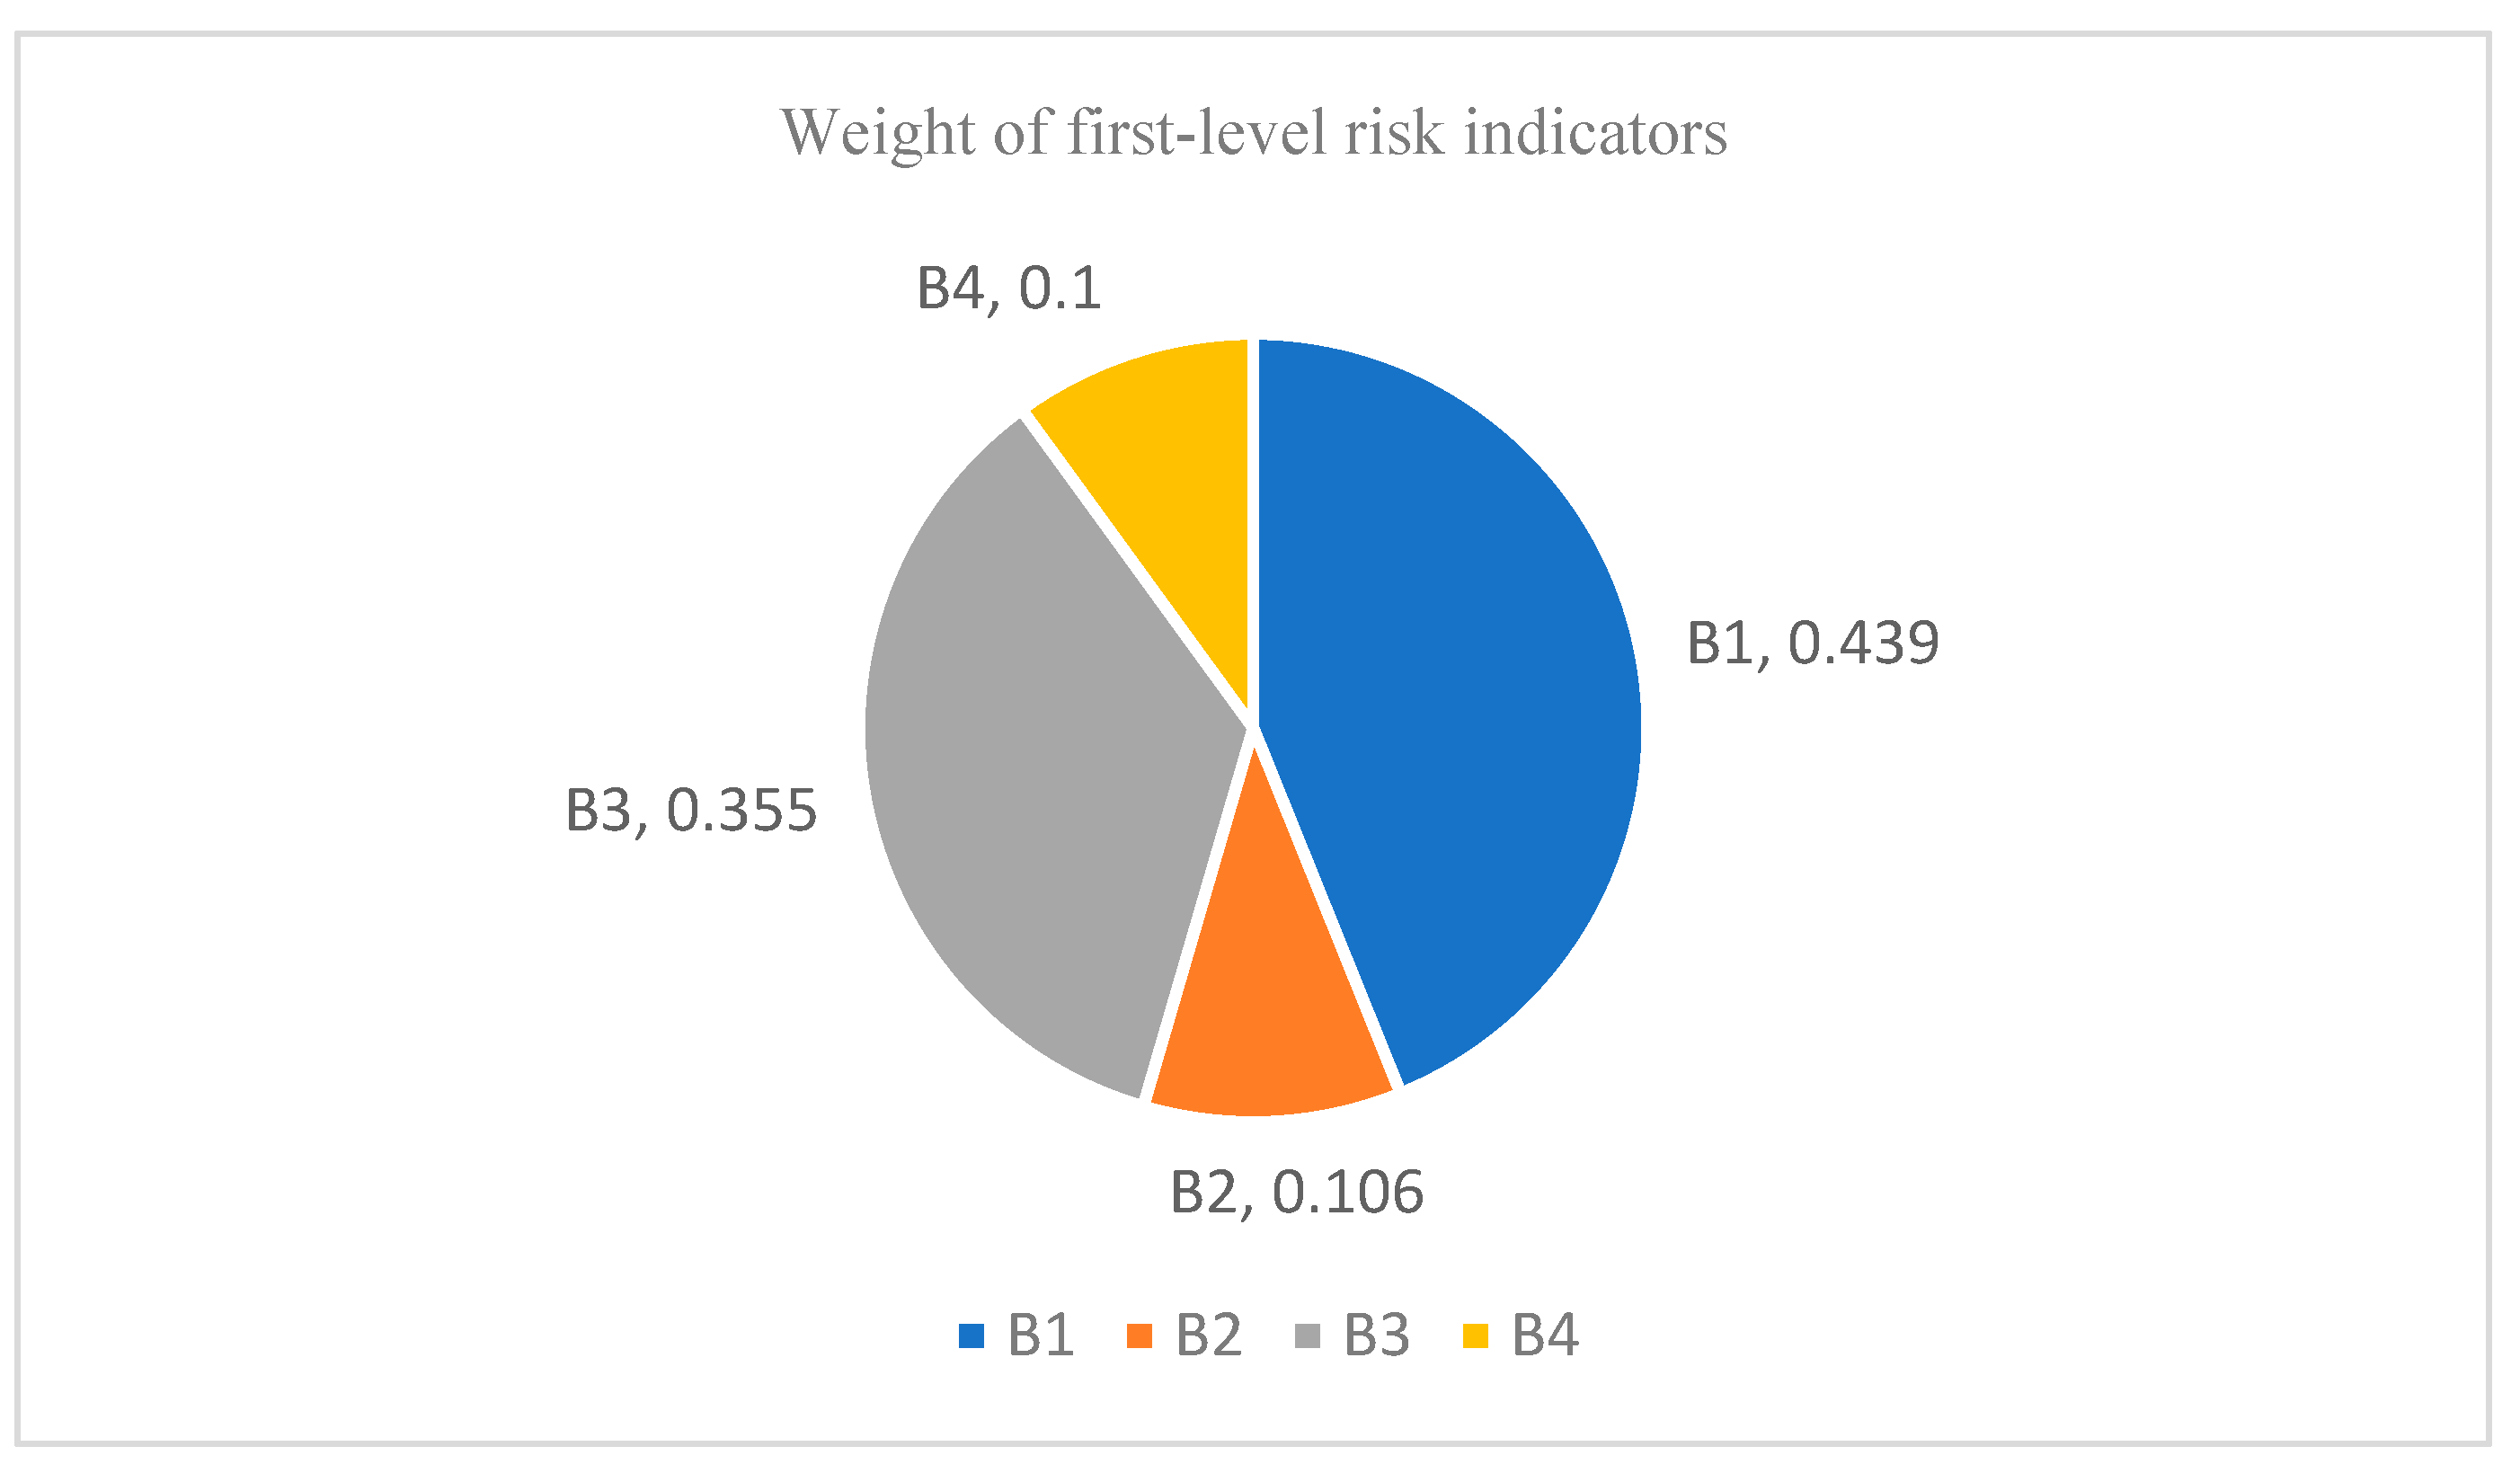
The proportions of the first-level risk indicators is shown in
Figure 2.
In the first-level indicators, the corresponding weight coefficients of personnel risk, information risk, goods risk, and environmental risk are 0.439, 0.106, 0.355, and 0.100, respectively. It can be clearly seen from
Figure 1 that the risk coefficients of personnel risk and cargo risk are larger. Therefore, when public health emergencies occur, we should focus on the risks related to personnel and goods, and control them in a timely and effective manner.
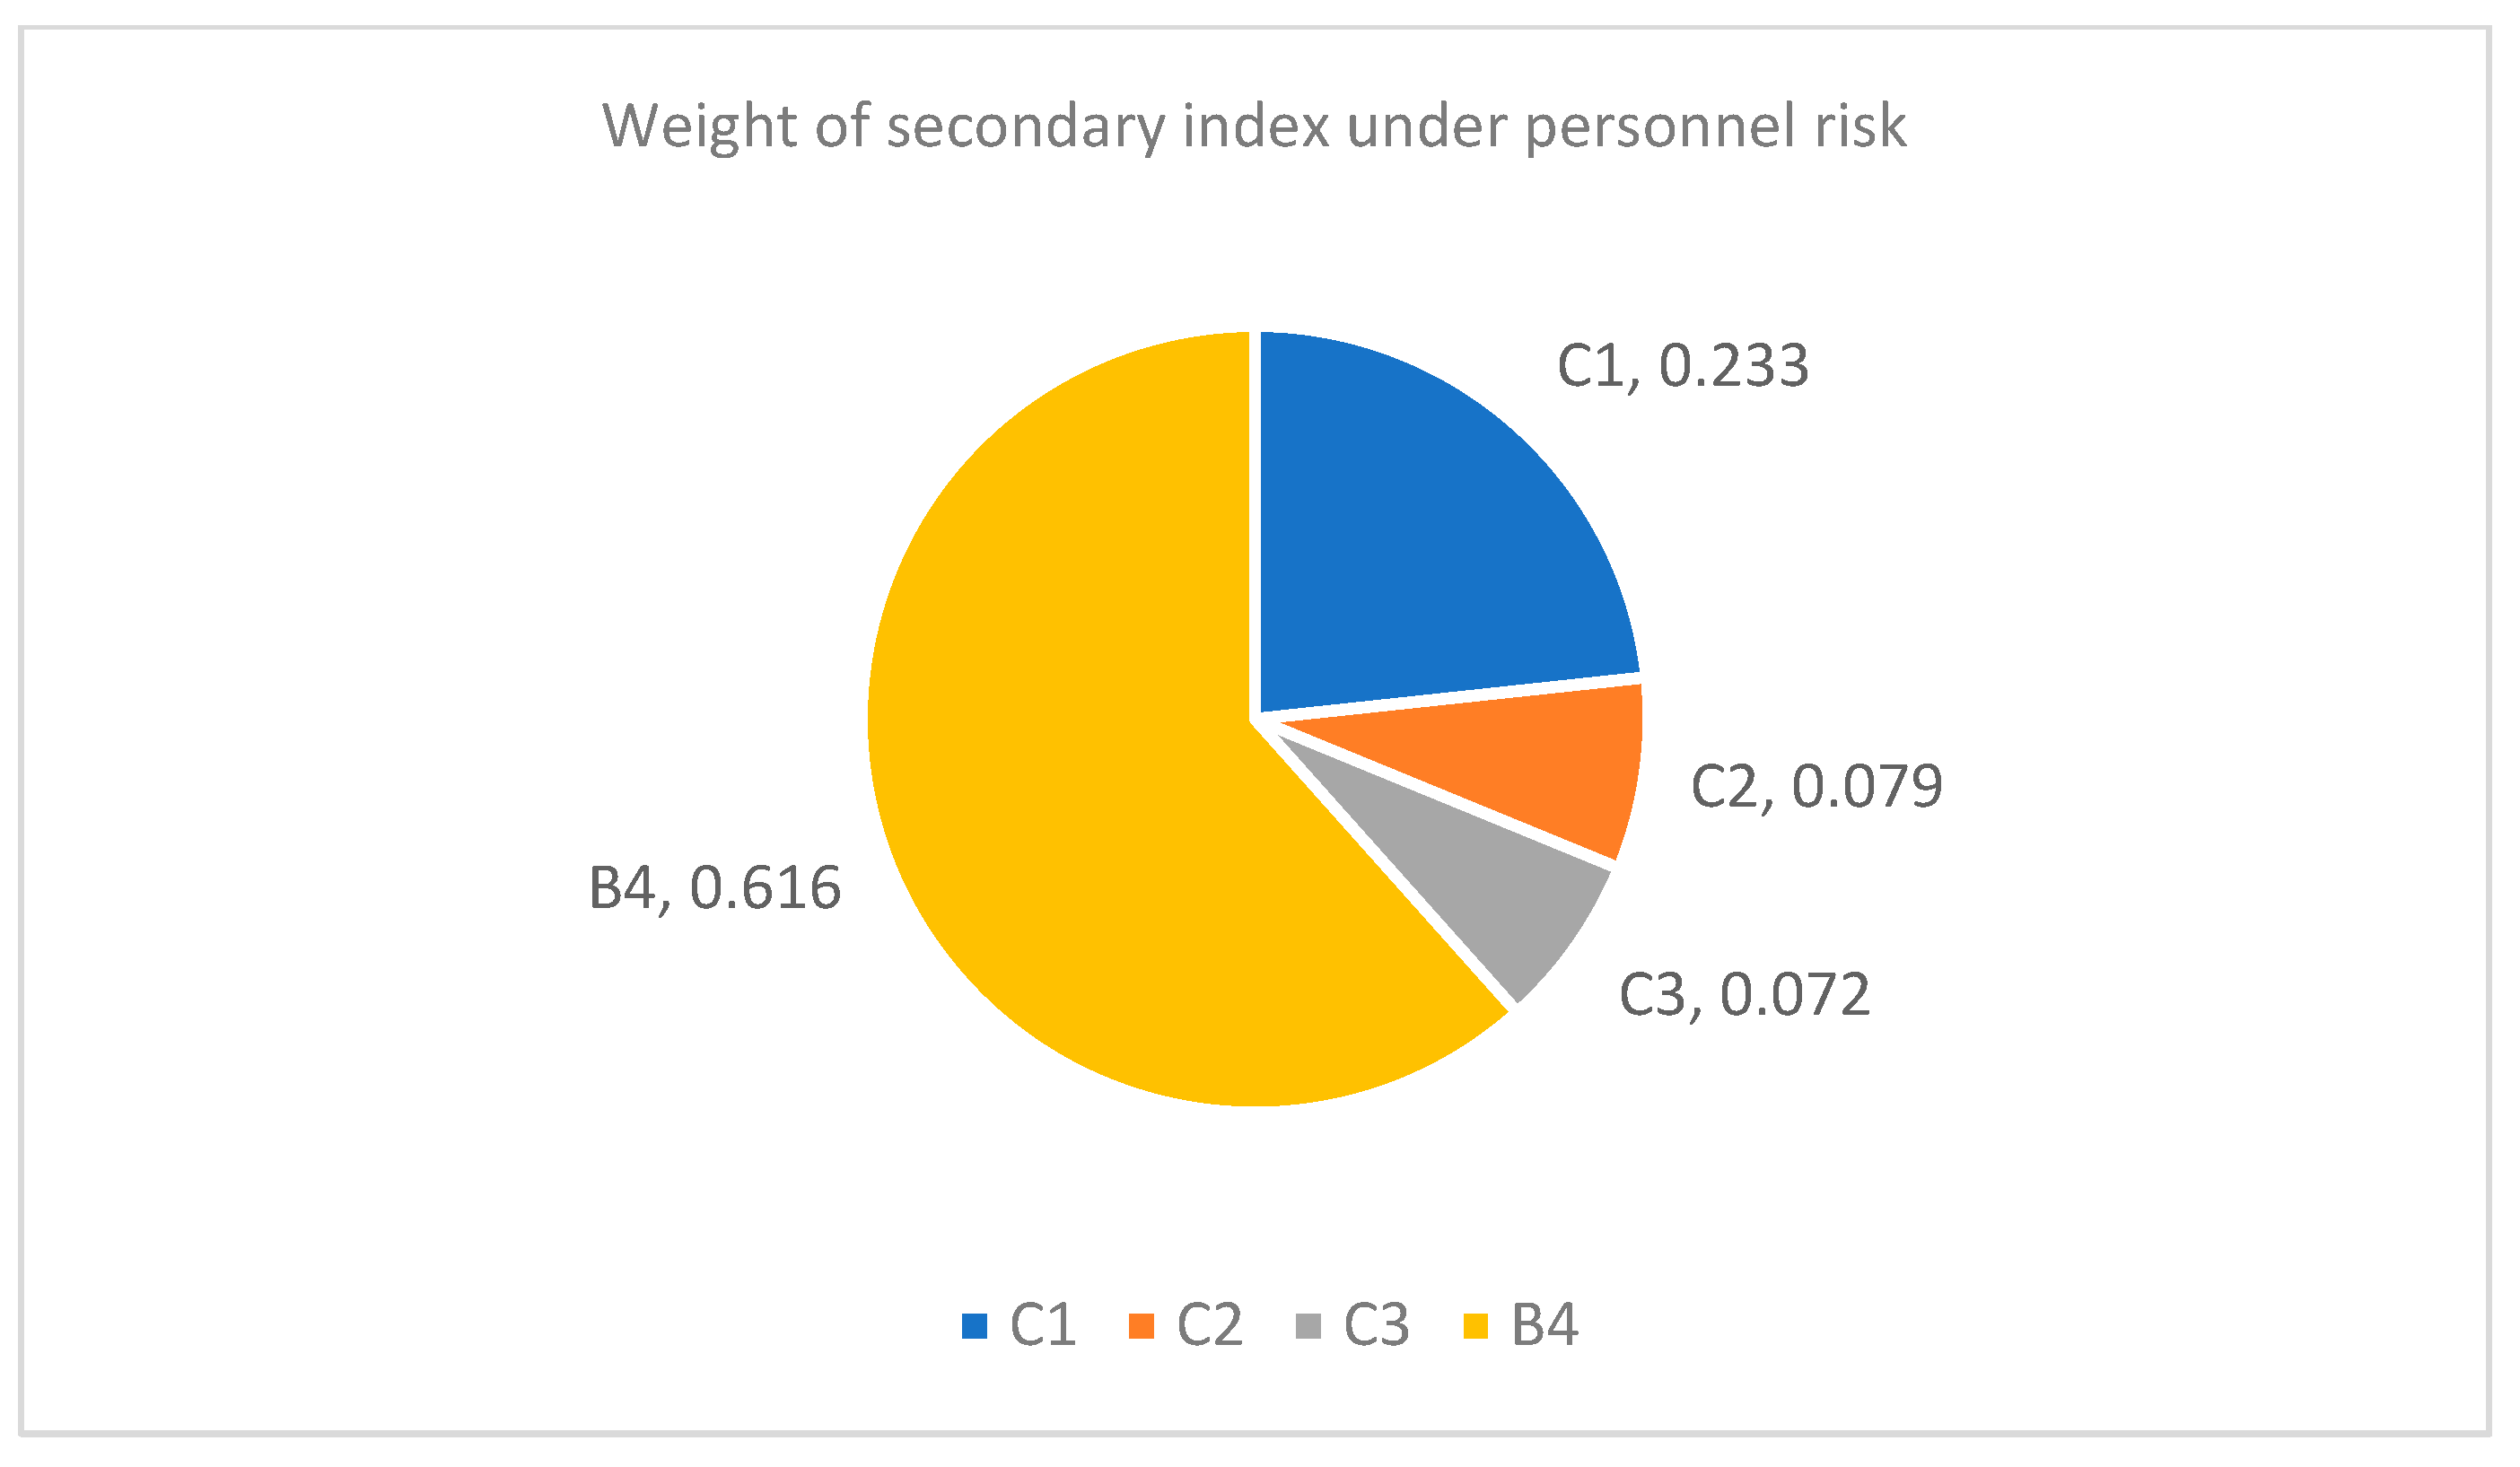
- (2)
The corresponding secondary risk indicators in personnel risk are accidental injury risk, complaint risk caused by personnel quality, staff turnover risk, and personnel infection risk, and their corresponding weight coefficients are 0.233, 0.079, 0.072, and 0.616, respectively, among which the risk coefficient of personnel infection is the largest. Therefore, when public health emergencies occur, logistics terminal distribution risk management and control should focus on personnel infection risk.
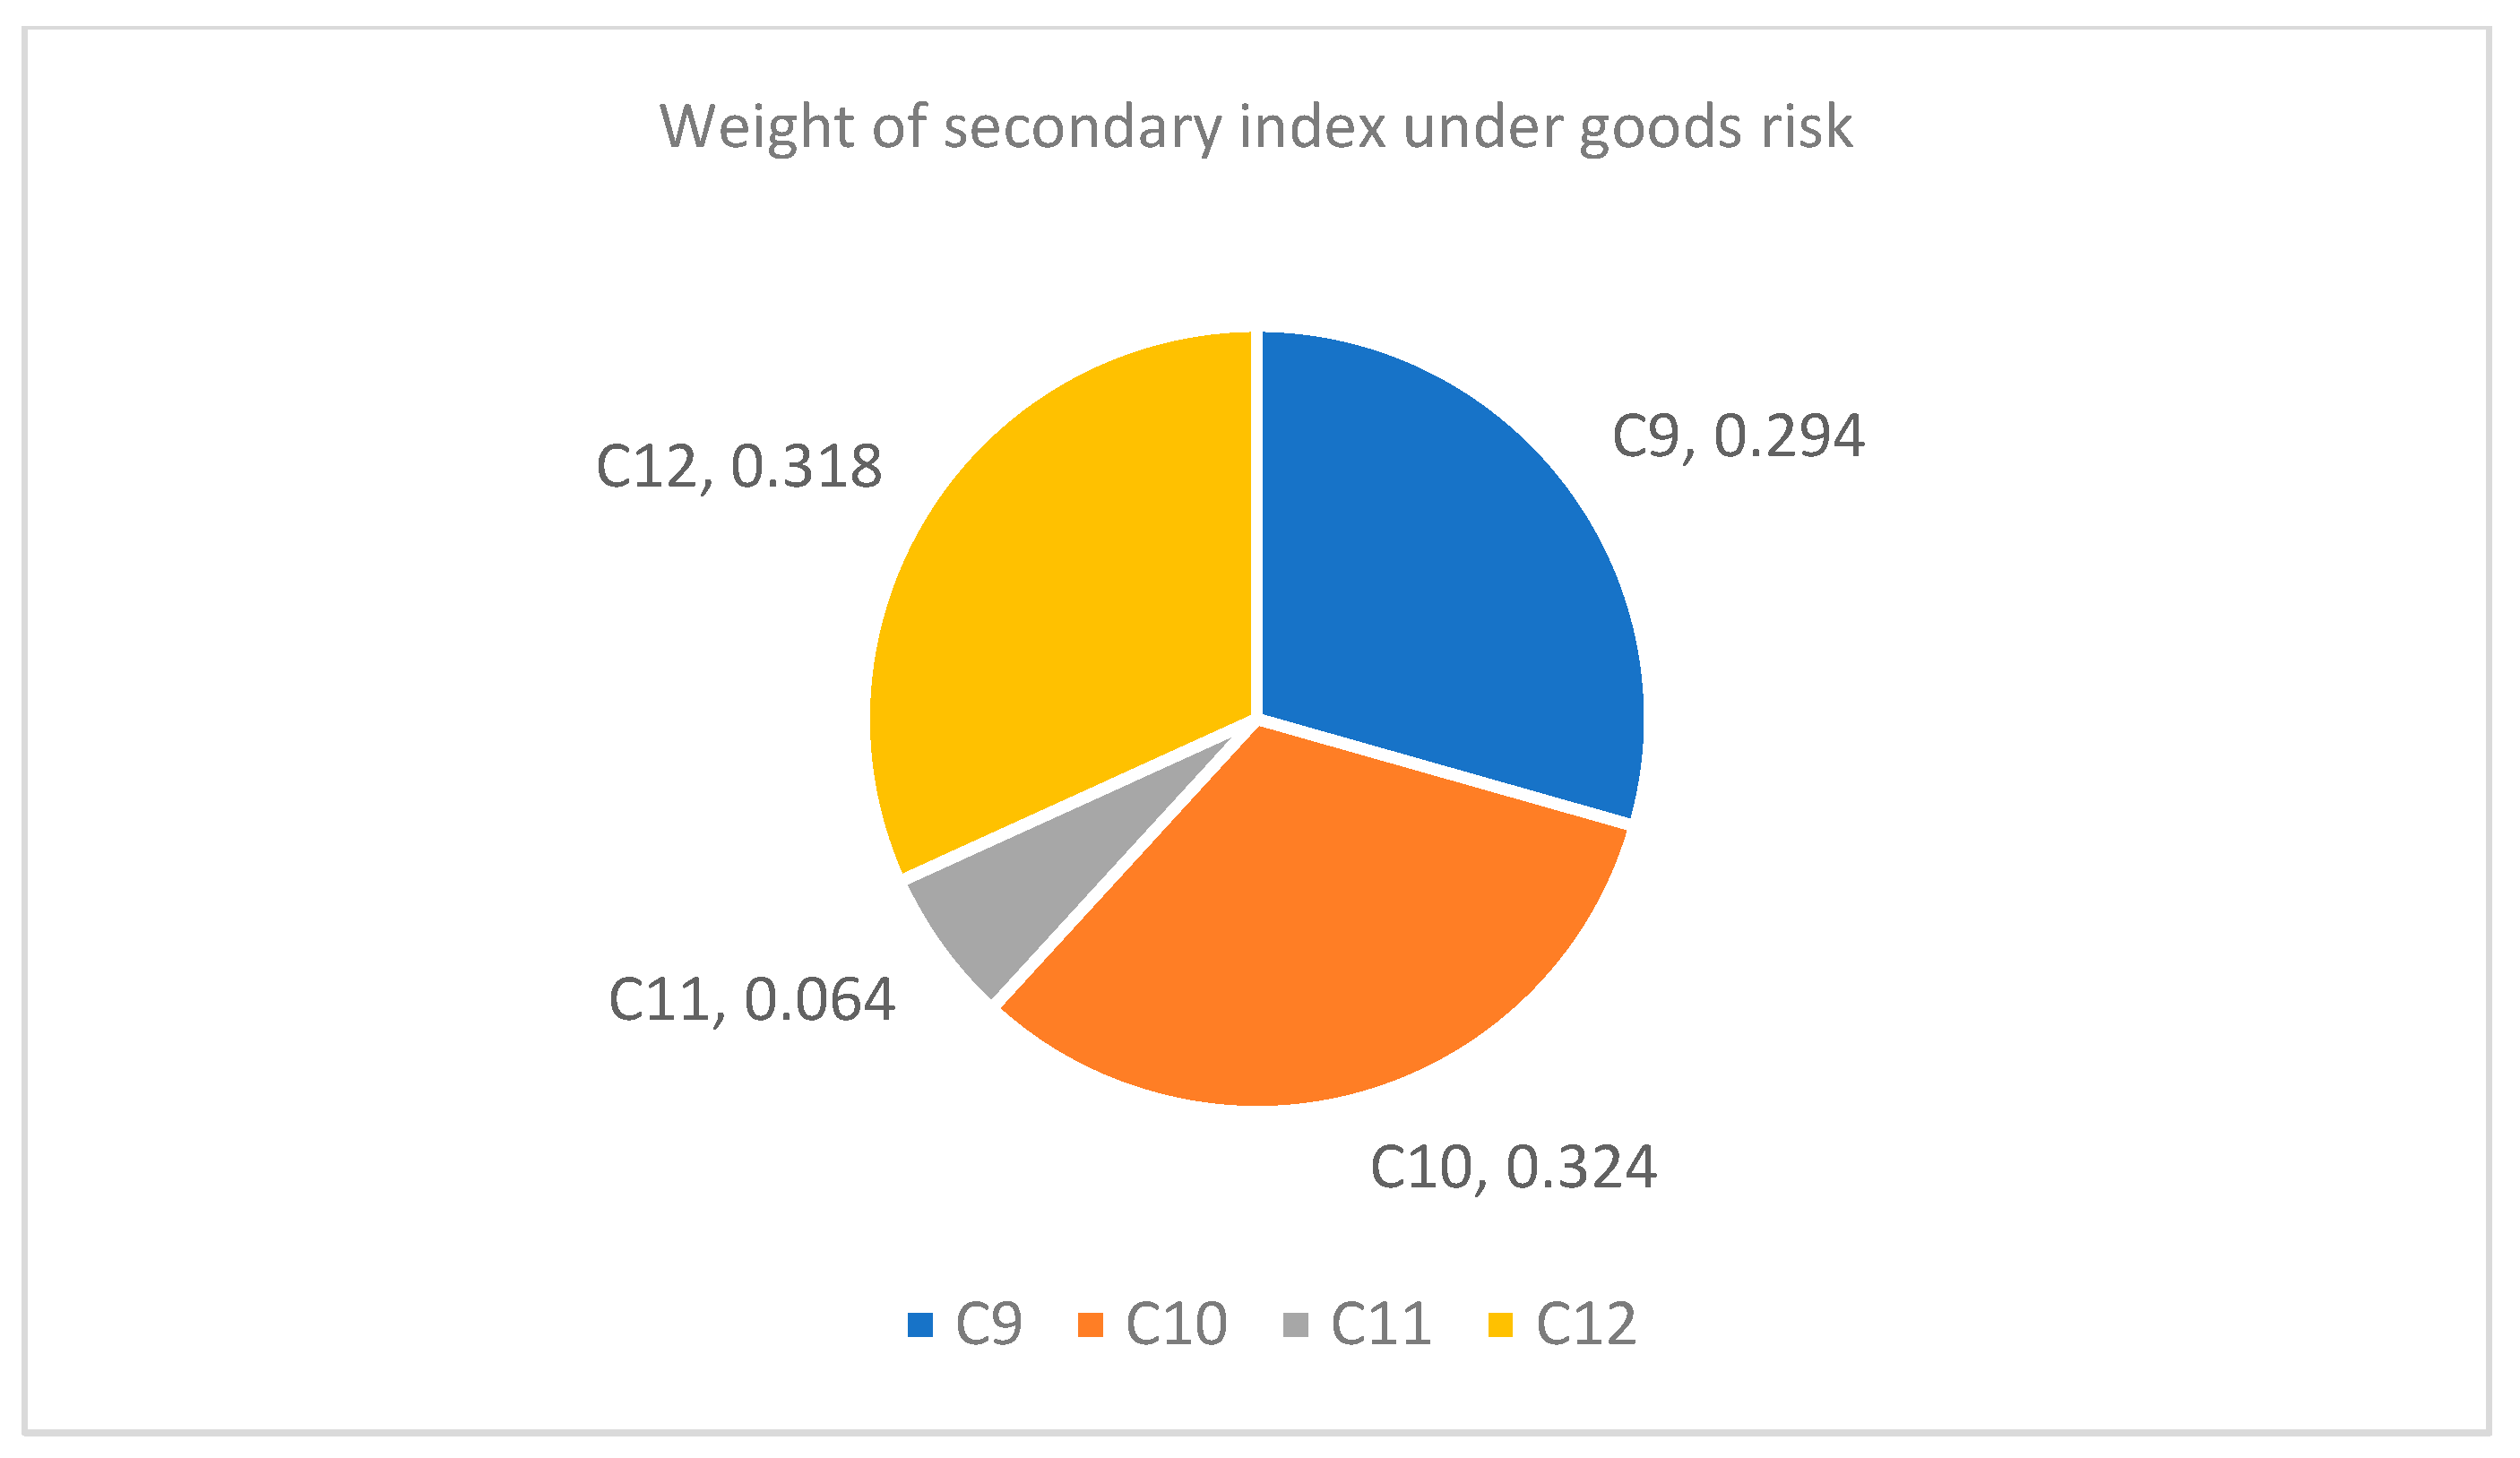
- (3)
The secondary risk indicators corresponding to goods risks are goods loss risk, goods damage risk, goods delivery delay risk, and customer return risk, and their corresponding weight coefficients are 0.294, 0.324, 0.064, and 0.318, respectively, among which the risk coefficients corresponding to customer return risk, goods loss risk and goods damage risk are relatively large, so these risks should be controlled emphatically in risk management.
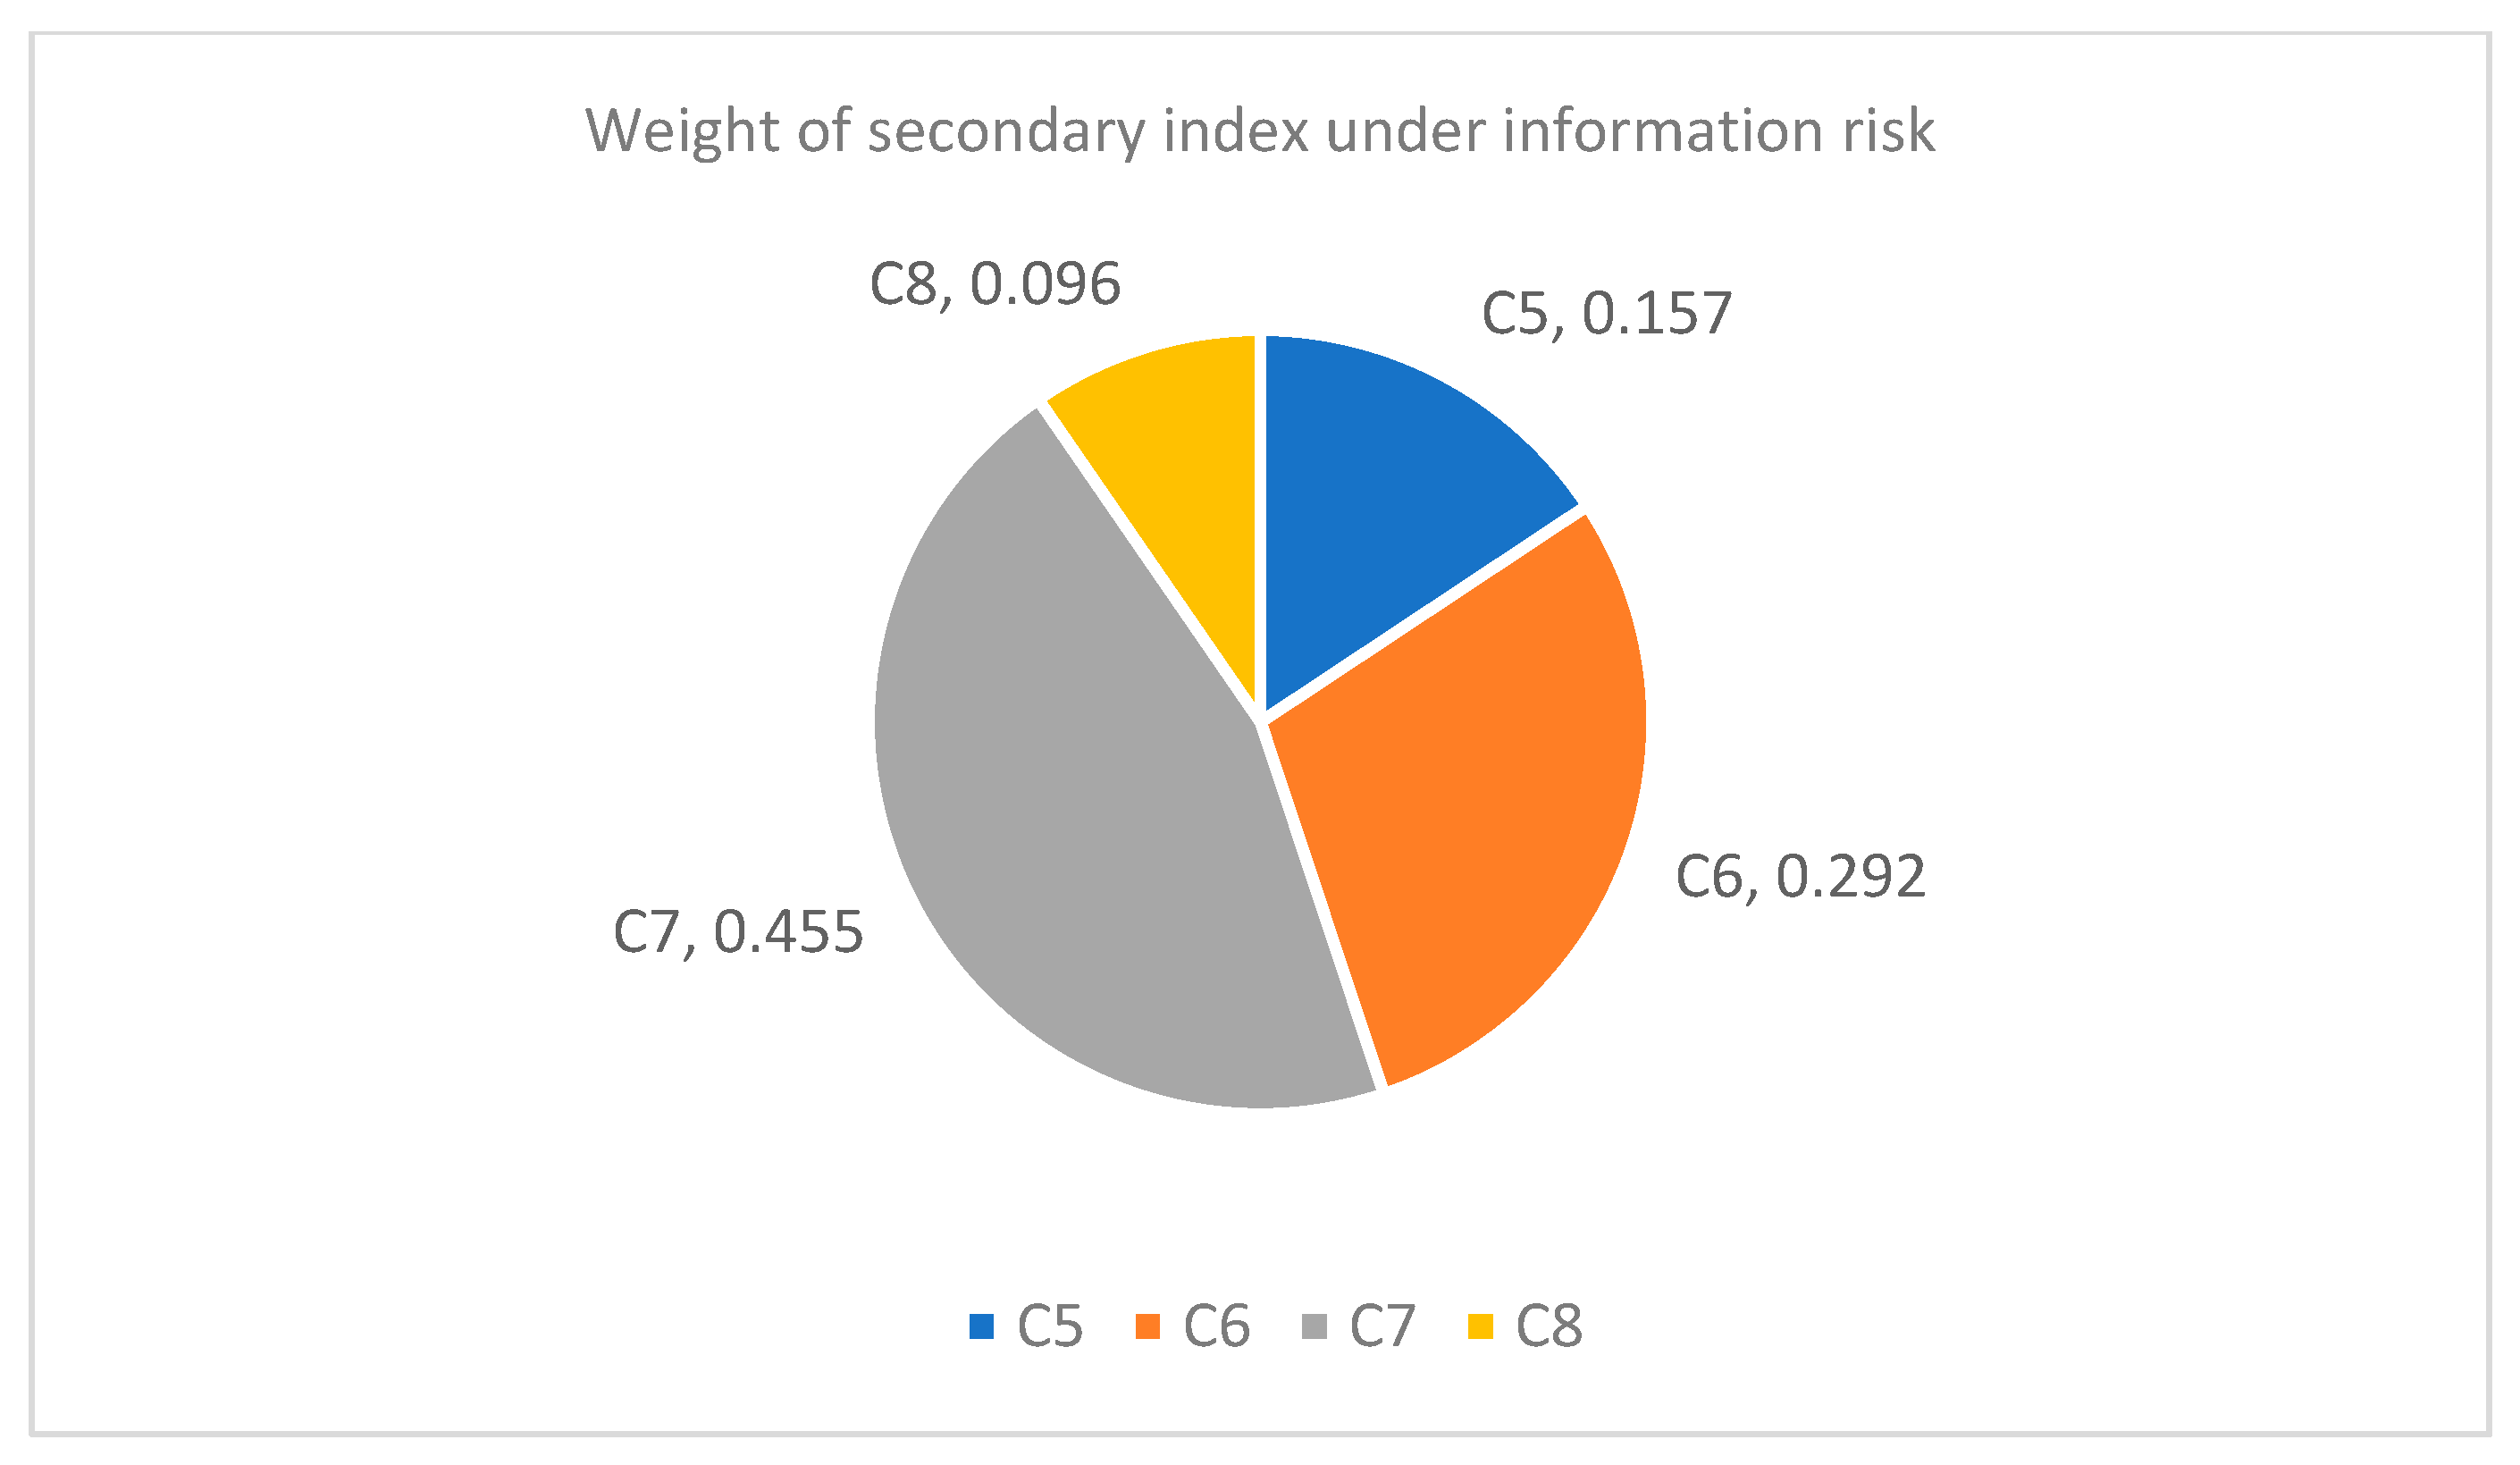
- (4)
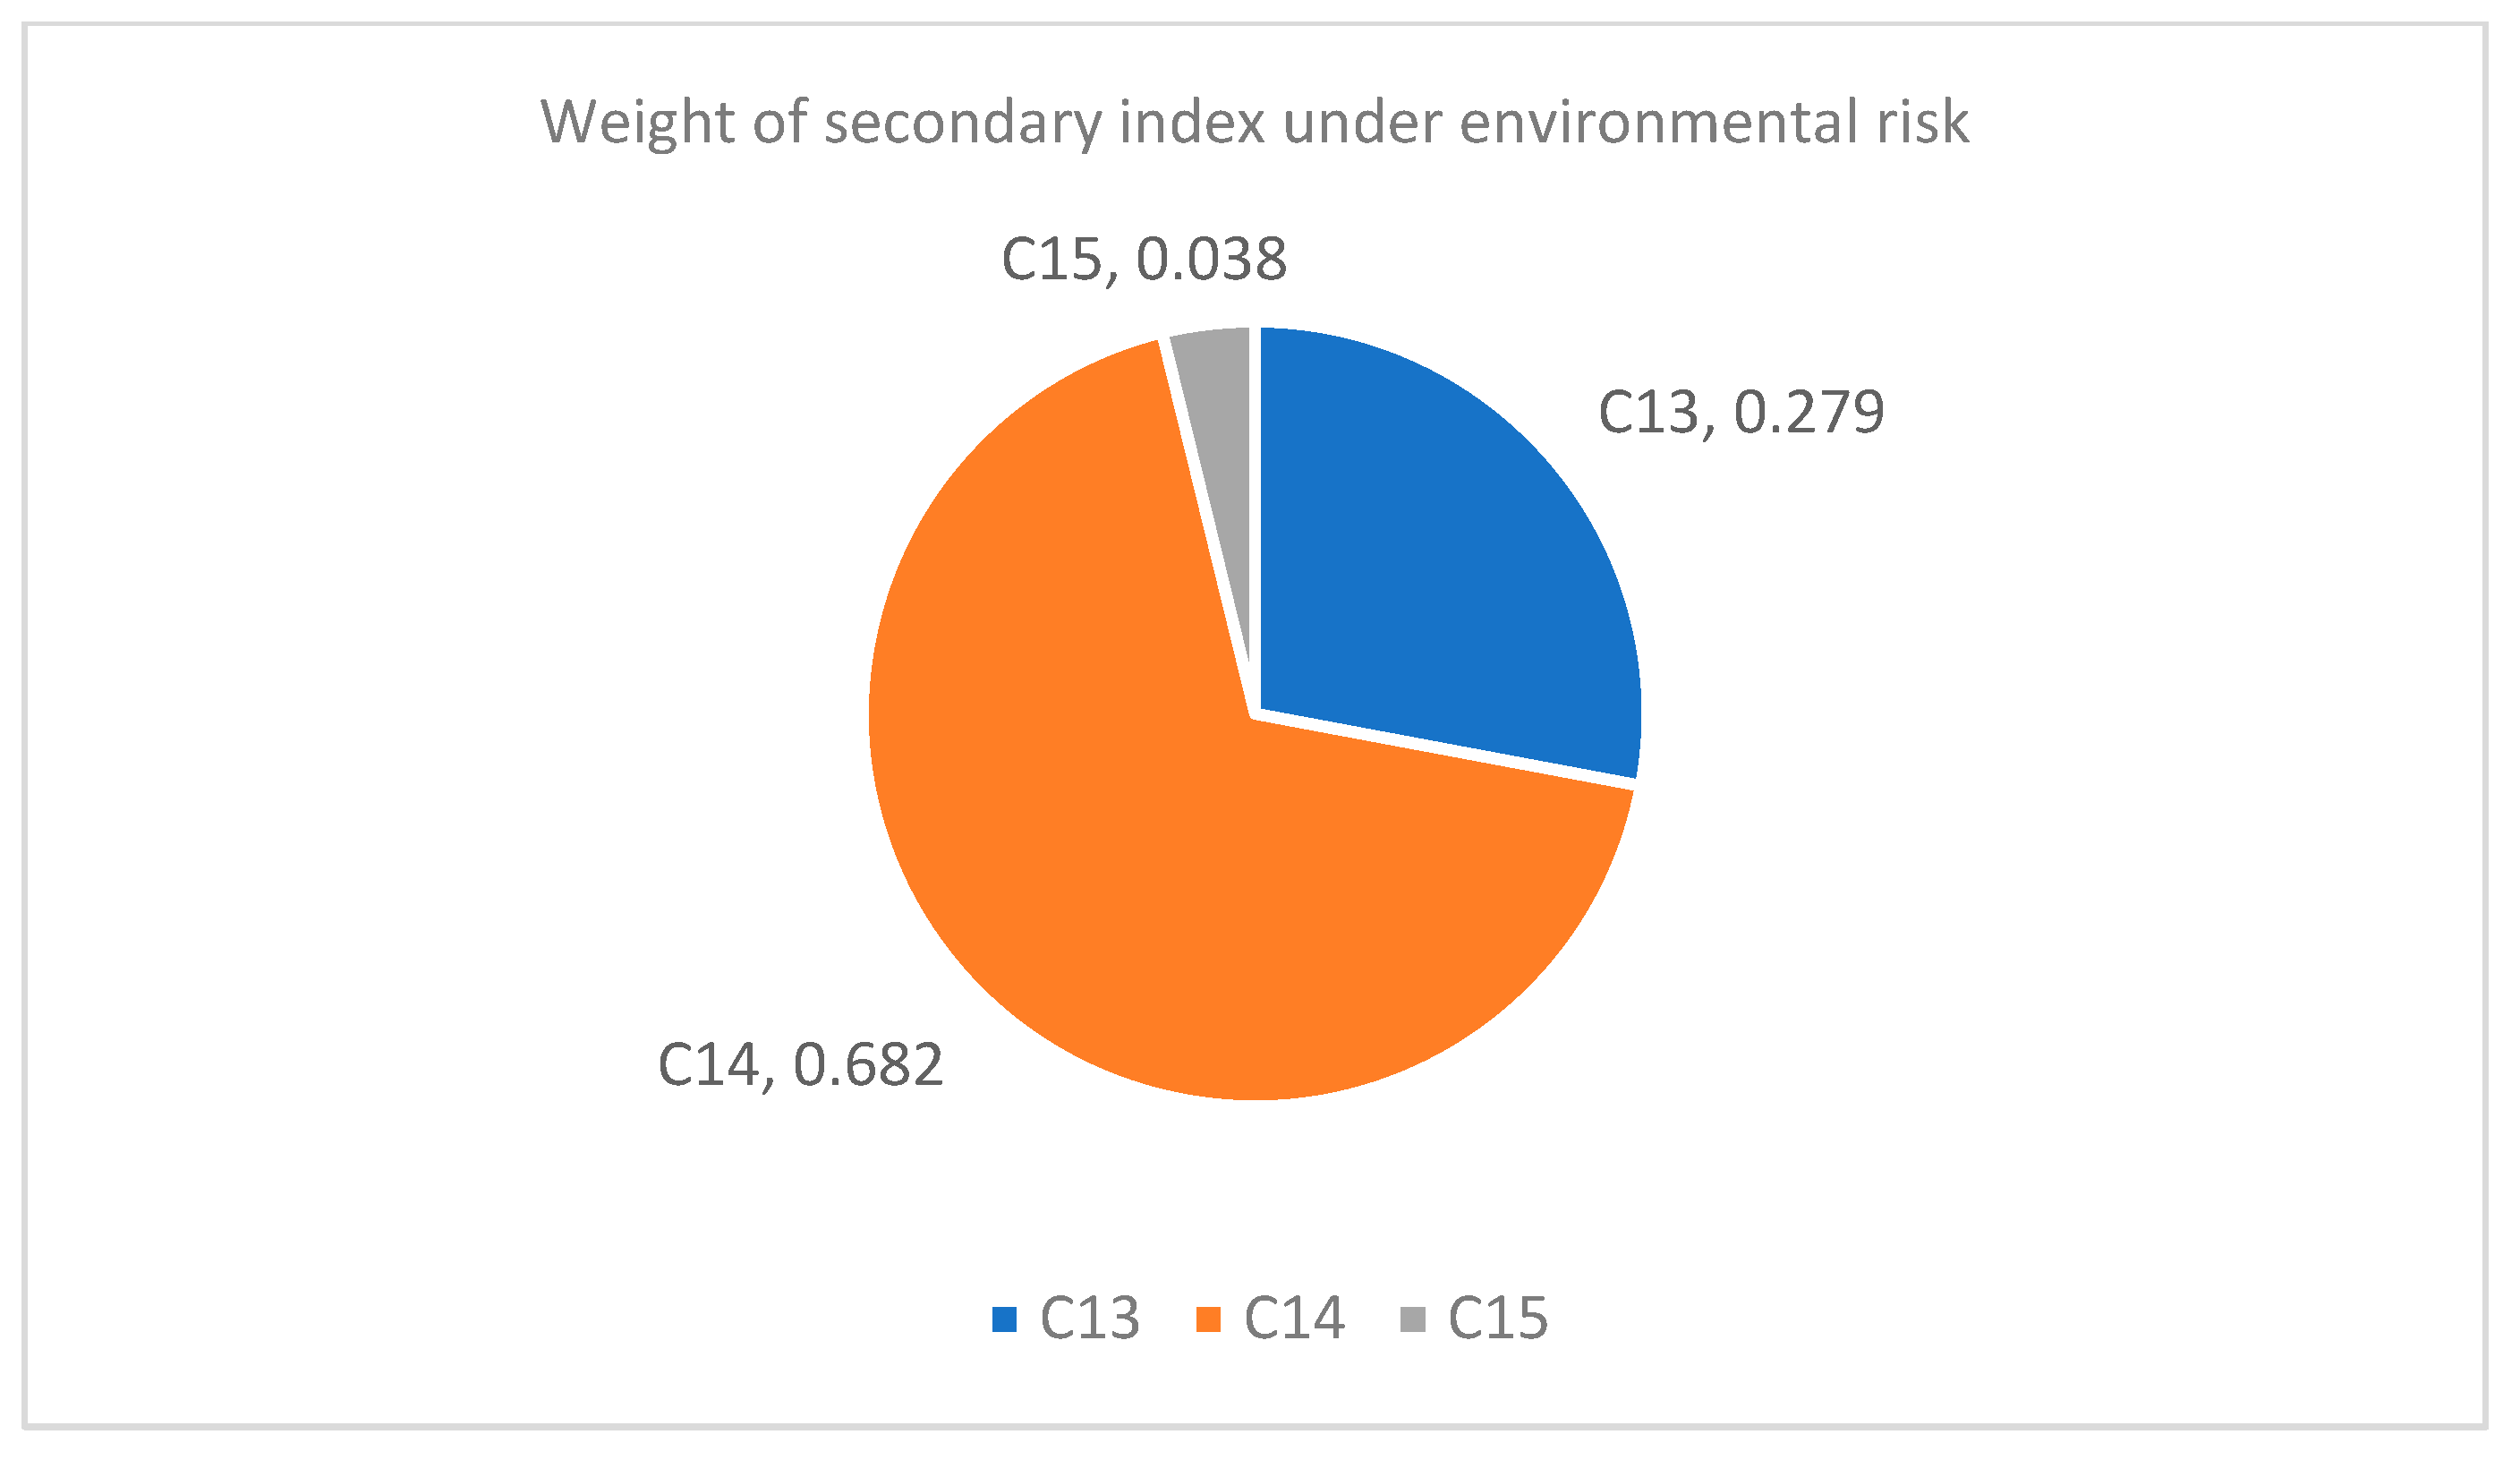
Although the risk coefficients of information risk and environmental risk are small, the weight coefficients of customer information leakage risk and policy and regulation risk in the corresponding secondary risk indicators are 0.455 and 0.682, respectively. It can be clearly seen from
Figure 4 and
Figure 6 that customer information disclosure risk and policy and regulatory risk account for a large proportion of information risk and environmental risk. Therefore, when public health emergencies occur, we should also pay attention to these two risks in the process of risk management and the control of the logistics terminal distribution.
4.6. Risk Control Measures and Suggestions
Through the analysis of the above evaluation results, this study puts forward the following risk control measures and suggestions:
- (1)
Establish self-pickup points or develop unmanned distribution and try to avoid contact between distribution personnel and customers. In public health emergencies, human contact should be minimized to avoid the spread of viruses and human infection. Setting up pickup points that allow customers to pick up at any time on their own schedule can achieve this goal. The development of unmanned distribution can reduce the risk of human infection, improve the efficiency of distribution and control the cost of distribution.
- (2)
Pay close attention to the real-time updates of government policies and make timely adjustments according to policies and regulations. When public health emergencies occur, the government will systematically implement a series of prevention and control policies and regulations. Enterprises need to carry out logistics distribution within the scope permitted by policies and regulations. Therefore, enterprises should always pay attention to the updates of policies and regulations and adjust logistics distribution activities according to the latest policies and regulations, and actively respond to national policies and contribute their share to national prevention and control.
- (3)
Pay attention to the training of distribution personnel and improve the quality of distribution personnel. Enterprises need to strengthen the quality training of distribution personnel and infiltrate advanced service concepts into employees, and ensure that employees have the ability to respond to emergencies. Companies need to ensure that employees have good professional quality to provide customers with better delivery services, and reduce the risk of customer complaints and returns due to the quality of the delivery personnel.
- (4)
Strengthen the monitoring of the goods during the distribution process to ensure that the goods reach the hands of customers smoothly. It is necessary to establish a perfect cargo monitoring system to realize the whole monitoring process. Ensure responsibility to the individual to avoid loss and damage to goods, and ensure that customers can timely and smoothly get the goods, protect the rights and interests of customers.
- (5)
Attach importance to information security and avoid the disclosure of customers’ personal information. Enterprises should pay attention to the privacy of customers’ personal information and strengthen network information security and personal privacy protection in the distribution process. In the delivery process, ensure that the goods only pass through the hands of the delivery personnel and customers, protect the privacy of customers, and avoid the disclosure of customer privacy.
5. Discussion and Conclusions
In recent years, public health emergencies have occurred frequently. In this context, the logistics terminal distribution has also received a huge impact. However, there is no research on risk assessment in this aspect. Therefore, this paper establishes the risk evaluation index system of logistics terminal distribution under public health emergencies for the first time, which is helpful to understand the risk impact in this case more intuitively. Since the data collected by questionnaire survey and expert scoring method are difficult to quantify and subjective, this paper uses the combination of the intuitive fuzzy entropy weight method and the grey fuzzy comprehensive evaluation method to solve these problems for the first time in this field.
On the basis of consulting relevant literature, this paper follows the basic principles of building a risk assessment index system. Based on the characteristics of public health emergencies and logistics terminal distribution, this paper innovatively establishes a logistics terminal distribution risk assessment index system under public health emergencies.
Based on the background of public health emergencies, this paper uses the intuitionistic fuzzy entropy weight method and the grey fuzzy comprehensive evaluation method for the first time to evaluate the risks of logistics terminal distribution. In order to solve the problem that data is difficult to quantify and subjective, this paper uses the intuitionistic fuzzy entropy weight method to determine the weight of risk index in the index system. Then, this paper adopts the grey fuzzy comprehensive evaluation method to evaluate the risk of logistics terminal distribution. This method not only solves the problem that the membership degree of fuzzy mathematics is difficult to determine, but also overcomes the subjective shortcomings of traditional quantitative methods.
Through case analysis, it is concluded that the logistics terminal distribution risk under public health emergencies is high, and the main risks are personnel risk and cargo risk. In risk management and control, it is necessary to focus on the risk of personnel infection, the risk of customer return, the risk of goods loss, the risk of goods damage, the risk of customer information disclosure and the risk of policies and regulations. In the context of public health emergencies, this paper puts forward corresponding risk management countermeasures for the risks that need to be paid attention to.
In recent years, public health emergencies have occurred frequently. This paper evaluates the logistics terminal distribution risk under the background of public health emergencies and makes corresponding countermeasures. This paper can supplement the current research in this field to some extent.
Author Contributions
Conceptualization, H.B. and R.Z.; methodology, H.B. and F.L.; analysis and simulation, R.Z. and F.L.; writing—original draft preparation, R.Z.; writing—review and editing, F.L. All authors have read and agreed to the published version of the manuscript.
Funding
This work is supported by the National Key R&D Program of China under Grant No. 2020YFB1712802, the Research Program of the Regional Economic Development Research Center of Yanshan University under Grant No. JJ2208, Key Applied Research Program of Social Science of Qinhuangdao under Grant No. 2023LX044.
Informed Consent Statement
We obtained verbal informed consent from all participants.
Data Availability Statement
The data presented in this study are available on request from the corresponding author due to data protection.
Conflicts of Interest
The authors declare no conflicts of interest.
References
- Raj, R.; Singh, A.; Kumar, V.; De, T.; Singh, S. Assessing the e-commerce last-mile logistics’ hidden risk hurdles. Clean. Logist. Supply Chain. 2024, 10, 100131. [Google Scholar] [CrossRef]
- Mismar, H.; Shamayleh, A.; Qazi, A. Prioritizing Risks in Last Mile Delivery: A Bayesian Belief Network Approach. IEEE Access 2022, 10, 118551–118562. [Google Scholar] [CrossRef]
- Deng, X.; Yang, X.; Zhang, Y.; Li, Y.; Lu, Z. Risk propagation mechanisms and risk management strategies for a sustainable perishable products supply chain. Comput. Ind. Eng. 2019, 135, 1175–1187. [Google Scholar] [CrossRef]
- Haffajee, R.; Parmet, W.E.; Mello, M.M. What is a public health “emergency”? N. Engl. J. Med. 2014, 371, 986–988. [Google Scholar] [CrossRef] [PubMed]
- Wu, J.Z.; Zhang, Q. Multicriteria decision making method based on intuitionistic fuzzy weighted entropy. Expert Syst. Appl. 2011, 38, 916–922. [Google Scholar] [CrossRef]
- Zhang, S.; Xu, S.; Zhang, W.; Yu, D. A hybrid approach combining an extended BBO algorithm with an intuitionistic fuzzy entropy weight method for QoS-aware manufacturing service supply chain optimization. Neurocomputing 2018, 272, 439–452. [Google Scholar] [CrossRef]
- Yuan, J.; Luo, X. Approach for multi-attribute decision making based on novel intuitionistic fuzzy entropy and evidential reasoning. Comput. Ind. Eng. 2019, 135, 643–654. [Google Scholar] [CrossRef]
- Zhang, W.; Ding, J.; Wang, Y.; Zhang, S.; Xiong, Z. Multi-perspective collaborative scheduling using extended genetic algorithm with interval-valued intuitionistic fuzzy entropy weight method. J. Manuf. Syst. 2019, 53, 249–260. [Google Scholar] [CrossRef]
- Zhou, J.; Wang, Y.; Li, B. Study on optimization of denitration technology based on gray-fuzzy combined comprehensive evaluation model. Syst. Eng. Procedia 2012, 4, 210–218. [Google Scholar] [CrossRef]
- Li, S.; Tao, G.; Zhang, L. Fire risk assessment of high-rise buildings based on gray-FAHP mathematical model. Procedia Eng. 2018, 211, 395–402. [Google Scholar] [CrossRef]
- Wu, Z.; Shen, R. Safety evaluation model of highway construction based on fuzzy grey theory. Procedia Eng. 2012, 45, 64–69. [Google Scholar] [CrossRef]
- AlAlawin, A.H.; Wafa’H, A.A.; Salem, M.A.; Mahfouf, M.; Albashabsheh, N.T.; He, C. A fuzzy logic based assessment algorithm for developing a warehouse assessment scheme. Comput. Ind. Eng. 2022, 168, 108088. [Google Scholar] [CrossRef]
- Minguito, G.; Banluta, J. Risk management in humanitarian supply chain based on FMEA and grey relational analysis. Socio-Econ. Plan. Sci. 2023, 87, 101551. [Google Scholar] [CrossRef]
- Huang, M.; Lu, F.Q.; Ching, W.K.; Siu, T.K. A distributed decision making model for risk management of virtual enterprise. Expert Syst. Appl. 2011, 38, 13208–13215. [Google Scholar] [CrossRef]
- Lu, F.; Bi, H.; Sun, F.; Yu, C. Risk evaluation of IT outsourcing using Risk-matrix. In Proceedings of the 11th World Congress on Intelligent Control and Automation, Shenyang, China, 29 June–4 July 2014; pp. 599–601. [Google Scholar]
- He, Y.; Liu, N. Methodology of emergency medical logistics for public health emergencies. Transp. Res. Part E Logist. Transp. Rev. 2015, 79, 178–200. [Google Scholar] [CrossRef] [PubMed]
- Wang, S.L.; Sun, B.Q. Model of multi-period emergency material allocation for large-scale sudden natural disasters in humanitarian logistics: Efficiency, effectiveness and equity. Int. J. Disaster Risk Reduct. 2023, 85, 103530. [Google Scholar] [CrossRef]
- Kundu, T.; Sheu, J.B.; Kuo, H.T. Emergency logistics management—Review and propositions for future research. Transp. Res. Part E Logist. Transp. Rev. 2022, 164, 102789. [Google Scholar] [CrossRef]
- Yan, T.; Lu, F.; Wang, S.; Wang, L.; Bi, H. A hybrid metaheuristic algorithm for the multi-objective location-routing problem in the early post-disaster stage. J. Ind. Manag. Optim. 2023, 19, 4663–4691. [Google Scholar] [CrossRef]
- Zhang, H.; Qiu, B.; Zhang, K. A new risk assessment model for agricultural products cold chain logistics. Ind. Manag. Amp. Data Syst. 2017, 117, 1800–1816. [Google Scholar] [CrossRef]
- Liu, P.; Li, Y. An improved failure mode and effect analysis method for multi-criteria group decision-making in green logistics risk assessment. Reliab. Eng. Syst. Saf. 2021, 215, 107826. [Google Scholar] [CrossRef]
- Zhang, G.; Li, G.; Peng, J. Risk assessment and monitoring of green logistics for fresh produce based on a support vector machine. Sustainability 2020, 12, 7569. [Google Scholar] [CrossRef]
- Han, P.; Yang, X.; Zhao, Y.; Guan, X.; Wang, S. Quantitative ground risk assessment for urban logistical unmanned aerial vehicle (UAV) based on bayesian network. Sustainability 2022, 14, 5733. [Google Scholar] [CrossRef]
- Chen, W.; Wen, F.; Zhu, X.; Xie, Q. DBN method for risk assessment of dairy products cold chain logistics. J. Syst. Simul. 2019, 31, 936–945. [Google Scholar]
- Fu, Q.; Sun, Y.; Wang, L. Risk Assessment of Import Cold Chain Logistics Based on Entropy Weight Matter Element Extension Model: A Case Study of Shanghai, China. Int. J. Environ. Res. Public Health 2022, 19, 16892. [Google Scholar] [CrossRef]
- Shanker, S.; Sharma, H.; Barve, A. Assessment of risks associated with third-party logistics in restaurant supply chain. Benchmarking Int. J. 2021, 28, 2432–2464. [Google Scholar] [CrossRef]
- Lu, F.; Bi, H.; Feng, W.; Hu, Y.; Wang, S.; Zhang, X. A Two-Stage Auction Mechanism for 3PL Supplier Selection under Risk Aversion. Sustainability 2021, 13, 9745. [Google Scholar] [CrossRef]
- Rathore, R.; Thakkar, J.J.; Jha, J.K. A quantitative risk assessment methodology and evaluation of food supply chain. Int. J. Logist. Manag. 2017, 28, 1272–1293. [Google Scholar] [CrossRef]
- Suguna, M.; Shah, B.; Raj, S.K.; Suresh, M. A study on the influential factors of the last mile delivery projects during COVID-19 era. Oper. Manag. Res. 2021, 15, 399–412. [Google Scholar] [CrossRef]
- Bi, H.; Zhu, X.; Lu, F.; Huang, M. The Meal Delivery Routing Problem in E-commerce Platforms under the Shared Logistics Mode. J. Theor. Appl. Electron. Commer. Res. 2023, 18, 1799–1819. [Google Scholar] [CrossRef]
- Chen, T.Y.; Li, C.H. Objective weights with intuitionistic fuzzy entropy measures and computational experiment analysis. Appl. Soft Comput. 2011, 11, 5411–5423. [Google Scholar] [CrossRef]
- Chen, T.Y.; Li, C.H. Determining objective weights with intuitionistic fuzzy entropy measures: A comparative analysis. Inf. Sci. 2010, 180, 4207–4222. [Google Scholar] [CrossRef]
- Aloini, D.; Dulmin, R.; Mininno, V. A peer IF-TOPSIS based decision support system for packaging machine selection. Expert Syst. Appl. 2014, 41, 2157–2165. [Google Scholar] [CrossRef]
- Liu, M.F.; Ren, H.P. A study of multi-attribute decision making based on a new intuitionistic fuzzy entropy measure. Syst. Eng. Theory Pract. 2015, 35, 2909–2916. [Google Scholar]
- Zhao, J. A method of power supply health state estimation based on grey clustering and fuzzy comprehensive evaluation. IEEE Access 2023, 11, 12226–12236. [Google Scholar] [CrossRef]
- Li, H.; Dong, K.; Jiang, H.; Sun, R.; Guo, X.; Fan, Y. Risk assessment of China’s overseas oil refining investment using a fuzzy-grey comprehensive evaluation method. Sustainability 2017, 9, 696. [Google Scholar] [CrossRef]
- Huang, Z.; Zhao, W.; Zhang, Y.; Yao, X.; Jia, Q.; Wang, H.; Le, T.; Song, D.; Gao, Y. Comprehensive safety evaluation of emergency training for building ruins scenario based on analytic hierarchy process-grey fuzzy evaluation. IEEE Access 2020, 8, 147776–147789. [Google Scholar] [CrossRef]
| Disclaimer/Publisher’s Note: The statements, opinions and data contained in all publications are solely those of the individual author(s) and contributor(s) and not of MDPI and/or the editor(s). MDPI and/or the editor(s) disclaim responsibility for any injury to people or property resulting from any ideas, methods, instructions or products referred to in the content. |
© 2024 by the authors. Licensee MDPI, Basel, Switzerland. This article is an open access article distributed under the terms and conditions of the Creative Commons Attribution (CC BY) license (https://creativecommons.org/licenses/by/4.0/).


