Article

A Meta-Analysis of Innovation Management in Scientific Research: Unveiling the Frontier

1
Faculty of Operation and Economics of Transport and Communications, University of Zilina, Univerzitna 1, 010 26 Zilina, Slovakia
2
Department of Administration and Public Management, The Bucharest University of Economic Studies, 010371 Bucharest, Romania
*
Author to whom correspondence should be addressed.
Systems 2024, 12(4), 130; https://doi.org/10.3390/systems12040130
Submission received: 28 February 2024 / Revised: 5 April 2024 / Accepted: 8 April 2024 / Published: 9 April 2024
(This article belongs to the Special Issue Research and Practices in Technological Innovation Management Systems)

Abstract

:
Innovation is a critical element in numerous domains, especially when it comes to determining the course of business success via efficient innovation management systems. The objective of this study is to determine which innovation category has the greatest impact on the effectiveness of innovation management by analyzing the correlation of innovation and its associated activities on the innovation performance of companies. This study synthesizes empirical research findings regarding the relationship between management and innovation performance through the utilization of meta-analysis. In recent decades, meta-analysis has gained significant prominence as a method to improve the precision of results by integrating multiple studies into a comprehensive analysis. Systematic reviews and meta-analyses enhance the credibility of research outcomes due to their status as the most dependable forms of evidence. A noteworthy correlation is observed between innovation performance and innovation categories, with small and medium-sized enterprises (SMEs) exhibiting the strongest correlation. Significantly, organizational innovations demonstrate the strongest correlation coefficient, indicating that they have the greatest impact on innovation performance. This research highlights the significance of innovation management in effectively addressing enterprise challenges and promoting business success. It specifically emphasizes the critical role that organizational innovations play in facilitating innovation performance.

1. Introduction

Entrepreneurship and innovation in the current digital age are defined as the application of digital technology to traditional business models [1,2]. Innovation is the systematic progression of developing and showcasing original concepts, ideas, products, services, technologies, or methodologies, all with the intention of propelling innovation forward in a specific domain encompassing the economy, society, or daily life. Innovation is applicable in a wide range of formats and contexts [3]. Effective management of fundamental internal processes is critical for achieving success, as it enables organizations to improve critical performance indicators such as cost, quality, and consumer focus [4]. Over time, technological progress and globalization have created a highly competitive business environment that compels organizations to consistently introduce new products and services. This dynamic has presented numerous opportunities and challenges for organizations [5]. The business environment exerts a significant influence on the economies and enterprises of all nations. Management of innovation (also referred to as innovation management) can be delayed by a variety of internal and external factors. Among them is the COVID-19 pandemic. As a consequence of production constraints, the outcome of overseeing the majority of business entities and their added value was naturally affected. Frequently, enterprises were compelled to curtail expenditures and staff sizes as a result of insufficient financial resources [6,7]. Given that innovation is fundamental to global markets and serves as the bedrock for economic advancement, it is imperative for agile organizations to prioritize it to sustain their organizational performance and competitive advantage [8]. It is widely acknowledged that innovations significantly contribute to economic expansion and exert an impact on the performance and competitive standing of organizations. Consequently, corporate executives, state administrations, and the European Union are currently preoccupied with innovation. Procedures that standardize the development and introduction to the market of novel products, services, and concepts are referred to as “innovation management” [9]. Innovation can be implemented in an extensive variety of contexts and methods. Whether it be a novel market strategy, process, product, technology, or approach to problem solving, innovation is always something fresh [3]. As a phenomenon, businesses are utilizing digital transformation to increase the efficiency of their operations. Adhering to this approach is of utmost importance for enterprises, individuals, policymakers, and other organizations [10]. The integration of artificial intelligence (AI) into the innovation processes of businesses is becoming an ever more imperative endeavor [11]. Production must be sufficiently adaptable in response to globalization, which enhances data-driven competitiveness, to satisfy market demands. This objective could potentially be realized through the integration of Industry 4.0 technologies and autonomous production systems into the value chains and product design procedures of organizations [12]. Digitalization has become widely recognized as a critical determinant in the expansion of national economies, as a consequence of all preceding development processes, which have reinforced integration and internationalization, expanded interdependence and transnationality, and promoted international specialization and cooperation. Recent scientific and technological advancements have intensified this inclination to the extent that its complete implementation necessitates the establishment of a novel economic framework [13]. Innovations generate solutions to a variety of social and environmental problems, increase living standards, and foster the creation of new employment. It is imperative for the advancement and progress of societies and economies [14]. Numerous scholars have noted that for an extended period, the predominant emphasis has been on advancements in products or technologies [15,16]. A significant obstacle for innovative organizations is deciding whether to acquire the necessary technological advancements for product innovation through internal research and development (R&D), external knowledge acquisition, or a hybrid approach [17,18]. Future economies will be knowledge-based, and the competitiveness of employers will be determined by the expertise and knowledge of their personnel. Due to this rationale, the value of knowledge surpasses that of property, money, and labor [19]. A concept with intricate semantics, knowledge has been the subject of numerous interpretations throughout human history. The emergence of the knowledge economy and knowledge management transformed knowledge into a strategic asset for corporations; however, its definition is distinct from that of business philosophy [20]. In the present day, it is widely acknowledged that the survival and success of an organization, especially one that is knowledge-based, are contingent upon its capacity for creativity, innovation, and ingenuity. Consequently, the concept of innovativeness, which Garcia and Calantone [21] define as the ability to generate, adapt, and implement novel ideas, extends beyond technological innovation (specifically, process and product innovation) to include organizational and management innovation, which is progressively gaining prominence.
The aim of this paper is to ascertain, through the application of systematic review and meta-analysis techniques, the relationship between management of innovation in the form of selected innovation categories (product/eco/organizational innovations) and corporate innovation performance which plays an important role in the development of small and medium-sized enterprises. It consists primarily of an evaluation of the influence that various internal characteristics have on the innovation performance of companies. It may pertain to the scale of enterprises or their level of operation. Considering the aforementioned information, the subsequent research inquiries were formulated:
(1)
Does the successful implementation and integration of innovative initiatives yield a favorable impact on the operational outcomes of businesses?
(2)
Are the results of scientific studies that quantify the correlations of innovation and the implementation of innovation management in organizations identical, or do they diverge in a fundamental way?
This paper is structured in the subsequent manner. The introduction defines innovation’s significance within the context of business. The literature review section explains and provides a comprehensive synopsis of the significance of innovation, particularly in the context of the globalized world of today. Furthermore, this segment elucidates the significance of allocating resources towards research and development in relation to the proficient administration of innovation processes. The methodology section delineates the essential steps that must be undertaken and considered in order to accurately execute the statistical technique of meta-analysis. The findings of the investigation are elaborated upon in the results section. In the discussion section, a comparison is made between the conducted meta-analysis and other meta-analyses that have examined a comparable issue. The conclusion provides an overview of significant discoveries, as well as forthcoming obstacles and constraints that have a direct bearing on the research.

2. Literature Review

The process of innovation management is intricate and necessitates comprehensive development and mapping within organizations. An alternative perspective should be adopted when comparing innovations between service-providing and product-producing organizations. Nonetheless, the requirement and necessity to implement mechanisms that facilitate the efficient and seamless introduction of innovations persist as a unifying characteristic. It is imperative to recognize that a multitude of varieties of innovation exist. The introduction or commercialization of a novel or enhanced product or service that distinguishes itself from existing offerings is a critical instance of innovation [22]. Research and development (R&D) expenditures are indispensable to the sustained prosperity of organizations [23]. Investments in R&D are critical components of an organization’s innovation strategy in the current landscape of intense competition. In the current intensely competitive global market, many businesses must make profitable investments in research and development to endure and thrive. The establishment of climate transitions and the development of sustainable innovations are frequently attributed to R&D [24]. Nevertheless, investing in R&D is typically a high-risk endeavor that yields a lengthy period of return. Proficient human resources are considered an indispensable asset and a critical success factor for organizations operating in a technologically advanced, knowledge-driven, and intensely competitive business landscape [25]. At present, the worldwide economy is confronted with novel obstacles stemming from the shift towards an economy predicated on knowledge. As the knowledge economy gains traction, organizations are anticipated to develop greater flexibility, decentralization, and autonomy [26,27]. For asset creation, wealth maximization, and economic development, knowledge-based economies rely less on traditional resources such as capital, labor, and land. Over the past two decades, the global economy has been striving to transition into a knowledge-based economy. Despite its frequent usage, the term “knowledge economy” lacks a universally accepted definition. Knowledge-based economies are, in fact, those in which the generation, dissemination, and application of information and knowledge predominate. In a knowledge-based economy, where the generation of wealth is predominantly reliant on the dissemination and production of knowledge, the aim is to promote the efficient implementation of knowledge across all sectors of the economy [28].
Broadly speaking, a government may employ political and financial assistance to foster innovation and development via a variety of formal institutions. The author of one of the earliest studies to establish a correlation between innovation and institutional quality, Freeman [29], has provided evidence for the importance of institutional quality in the technology development and dissemination process. Considering the regulatory framework’s influence on innovation, regulation engenders two discernible outcomes regarding innovation. Similar to tax payment, adherence to regulations reduces the financial resources allocated for research and development [30]. Regulations have an impact on the incentive that companies must invest in R&D. In this context, a regulatory framework such as patent protection may incentivize a company to invest in research and development [31]. Conversely, alternative strategies including price controls and product market regulations may hinder the profitability of creative endeavors for businesses. In the realm of innovation management, knowledge sharing management is an additional critical element that impacts the overall success of groups. A primary objective of knowledge management is to exert a methodical impact on the dissemination and implementation of knowledge to generate value. Activities associated with knowledge management consist of the following: acquiring, encoding, storing, transferring, applying, and sharing knowledge [32]. Consequently, information sharing is vital to the structures and processes that ensure the effective utilization of available knowledge resources in order to improve performance, similar to Mehmood et al. [33]. It assists organizations in becoming more innovative, strategic, and marketable. Consequently, the exchange of employee knowledge is vital for sustaining a competitive advantage.
Systematic reviews differ significantly from other types of literature evaluations in several significant ways. A systematic review, as defined by Piggott and Polanin [34], is a qualitative synthesis and analysis of numerous independent studies that investigate a specific domain. An explicit and replicable methodology is required, which should detail the criteria used to select studies and the grounds for their acceptance or rejection. In addition to synthesizing the findings of these inquiries, an evaluation and quality assessment phase should be incorporated. The systematic review methodology, initially implemented in medical and healthcare research, has since been adopted by numerous disciplines, such as engineering, education, economics, and business studies [35]. Meta-analysis is the primary research procedure utilized in this investigation. Meta-analysis (MA) is a scientific approach that analyses data from numerous independent studies in a collective and quantitative manner. The objective is to identify and quantify prevalent trends or to determine the reasons behind the divergent conclusions of theses. MA is a complex method, and programs such as IBM SPSS statistical v.26 software are utilized for their quantification and graphical representation. However, other suitable programs include Comprehensive Meta-Analysis Software (CMA) V2, Stata 16, Meta-Essentials Version 1.5, OpenMeta [Analyst] 12.11.14, all of which can provide and precisely quantify the results of an MA. A systematic review employs meta-analysis, which is a compilation of statistical techniques used to merge the results of multiple studies. In this type of review, a quantitative summary of study outcomes is the primary focus of the research [36]. Since its inception by Gene Glass in 1976, the term MA has been derived from the Greek words meta, signifying “after,” and analysis, signifying “description or interpretation.” To facilitate the integration of findings, statistical analysis is employed on the results collected from primary or individual investigations [37]. When executed properly, MA will yield significantly more precise and unbiased data compared to analyzing individual studies, decrease the frequency of false negative outcomes, elucidate the factors contributing to divergent conclusions in certain works, and enable the testing of hypotheses. An extended preparation period is one of the drawbacks associated with meta-analyses [38].
Systematic reviews, which build upon the traditional literature review, meticulously scrutinize and amalgamate prior investigations employing the same rigorous criteria and analytical approach that govern primary research. As their name suggests, they employ a systematic methodology and, in contrast to the traditional literature review, uncover, evaluate, and synthesize the findings of pertinent studies using precise, rigorous techniques. Upon the completion of the review, an adequate amount of data ought to be accessible for the evaluation of the review’s quality [39]. In the report on the systematic review, the subject matter and a description of the methodologies utilized throughout the search, critical evaluation, data abstraction, and data synthesis phases should be detailed. The emphasis of the review is indicated by the description of the review questions and the criteria for inclusion. It is imperative to document the complete search strategy, encompassing the databases that were explicitly targeted, the search terms employed, and the procedures that were adhered to. Further information is needed concerning the methodologies employed for data synthesis and summarization, in addition to the standards used to assess the quality of the study. For practical implications to be evaluated, a comprehensive summary of the review’s findings is also required. Sifting through the vast quantity of published research, the considerable variation in its quality, and the intricate nature of the discipline collectively contribute to the difficulty in ascertaining the most reliable evidence [40].

3. Materials and Methods

During the systematic review analysis, a three-stage approach proposed by Tranfield et al. [41] and Kitchenham [42] was implemented. These crucial aspects are incorporated into a systematic review of the literature, which is followed by the application of the meta-analysis technique. Preparation, execution, and reporting comprise the phases. A review process was developed in accordance with the study’s objectives (Table 1), and a study strategy was formulated for the review in the planning phase. Throughout the implementation phase, information was selected and evaluated from the selected research, search terms were established, data sources were identified, and criteria for selecting studies were established.
The data utilized in the study were acquired from the Web of Science, the most essential index in academic publishing. The time horizon was limited to 2010 to 2023, when this research issue started to be important for academic and business practice. The greatest interest in the topic of innovation started in 2015, which is also considered the breaking point in this research topic, as there was a sharp increase and interest in the topic of innovation management and the need to effectively introduce innovations in companies. This is the reason why the articles were divided into the period before 2015 and after 2015 (including). It is crucial to maintain accurate records of the literature search so that the individual stages of identifying relevant studies can be traced back (and refined or verified). The PRISMA diagram, in which the author of the meta-analysis describes verbally and numerically the search’s specifics, is frequently employed for this purpose [43]. It is recommended to utilize the PRISMA flow diagram to visually depict the progression of studies as they undergo the different phases of a systematic review [44]. The identification of pertinent studies is critical for ensuring the credibility of meta-analysis research, as it serves as the bedrock for drawing comprehensive and pertinent conclusions. An extensive keyword search of the literature was conducted using a Web of Science database. The following terms were among those authors researched: “effects of innovation performance”; “effects of innovations”; “effects of innovation management”. Additionally, a comprehensive search was conducted by hand in the primary scholarly journals pertaining to innovation management, including articles with titles and abstracts [45,46,47,48].
To achieve the main aim of the paper, both systematic review and meta-analysis were used, as the systematic review of the studies is a part of the meta-analysis. Systematic review is a qualitative synthesis and analysis of numerous independent studies. An explicit and replicable methodology is required, which should detail the criteria used to select studies and the grounds for their acceptance or rejection. The systematic review and the individual steps that must be followed are shown in the Table 1. Meta-analysis is a scientific approach that analyzes data from numerous independent studies in a collective and quantitative manner. The aim of meta-analysis is not to quantify the basic and primary correlation coefficients. An important part of this method involves computing an effect size across all of the studies; this involves extracting effect sizes and variance measures from various studies. Thus, these data are already in the studies, and we just took them into our analysis and investigated them further. To facilitate the integration of findings, statistical analysis is employed on the results collected from primary or individual investigations. In secondary analysis, the researcher obtains and reanalyzes the original data on which an earlier study was based. Meta-analysis is the quantitative accumulation and analysis of effect sizes and other descriptive statistics across studies. It does not require access to the original study data. Moreover, the publication by Hunter and Schmidt [48] points to the basic fact that there is a strong emphasis on effect sizes rather than significance levels. The purpose of research integration is more descriptive than inferential, and the most important descriptive statistics are those that indicate most clearly the magnitude of effects. Meta-analysis typically employs estimates of the Pearson correlation coefficient. Based on this knowledge, we therefore performed a meta-analysis in such a way that we first comprehensively read all the studies (excluded and included), selected those studies that clearly described their results, and expressed the Pearson correlation coefficient. When executed properly, MA will yield significantly more precise and unbiased data compared to analyzing individual studies, decrease the frequency of false negative outcomes, elucidate the factors contributing to divergent conclusions in certain works, and enable the testing of hypotheses.
The methodological procedure is summarized in the following points for a more detailed illustration:
  • The first step of the analysis is the collection of data and resources. It consists of entering keywords into the Web of Science scientific database. The entered keywords are the following: innovation performance effects; innovation effects; effects of innovation management.
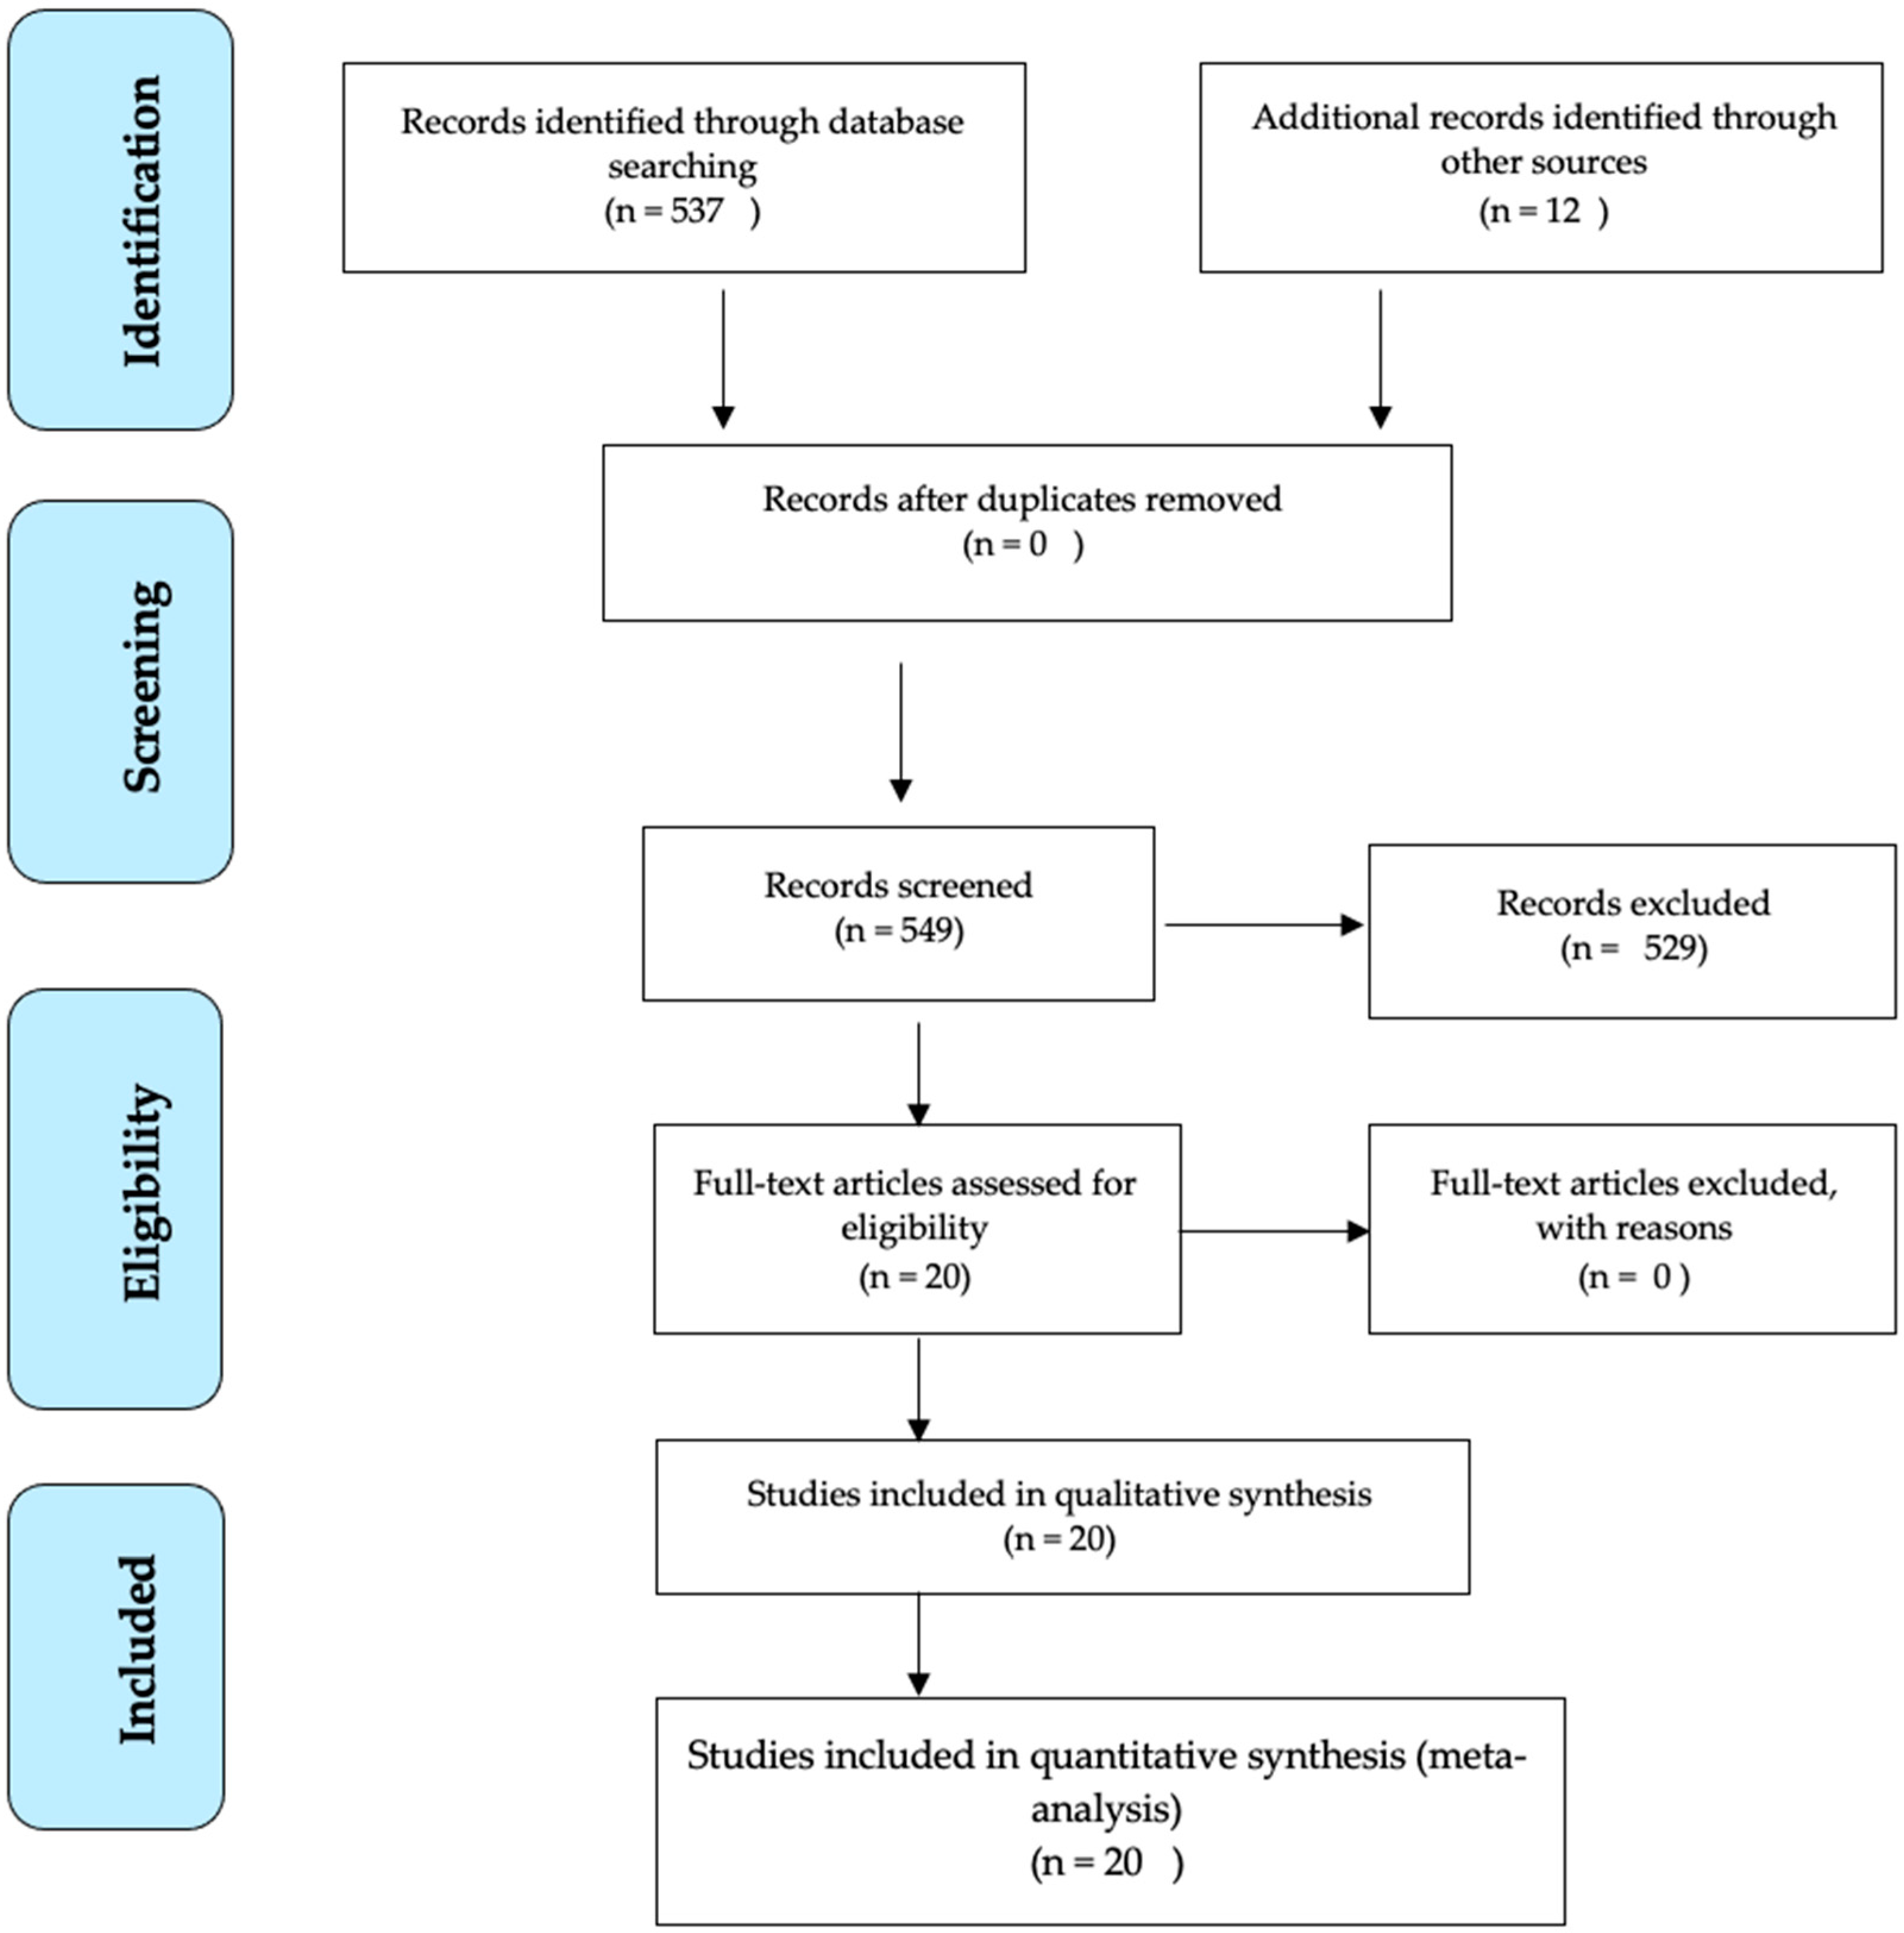
  • The entered terms are crucial to perform the meta-analysis, as they may contain quantitative data, especially the correlation coefficient. A graphical representation of the studies’ selection was made, which is shown in Figure 1, based on the PRISMA diagram.
  • After entering the keywords, it is necessary to comprehensively read the total number of articles (537 scientific articles in the Web of Science database). After reading and selecting the studies devoted to innovation performance and innovation effects, 20 studies were found to contain relevant quantitative data correlation coefficients. The types of innovations discussed in the studies are noted, as well as the sample size of enterprises involved in the study (Table 2).
  • Subsequently, the correlation coefficients from selected individual studies were transcribed (Table 3). Correlation coefficients were directly determined from these studies.
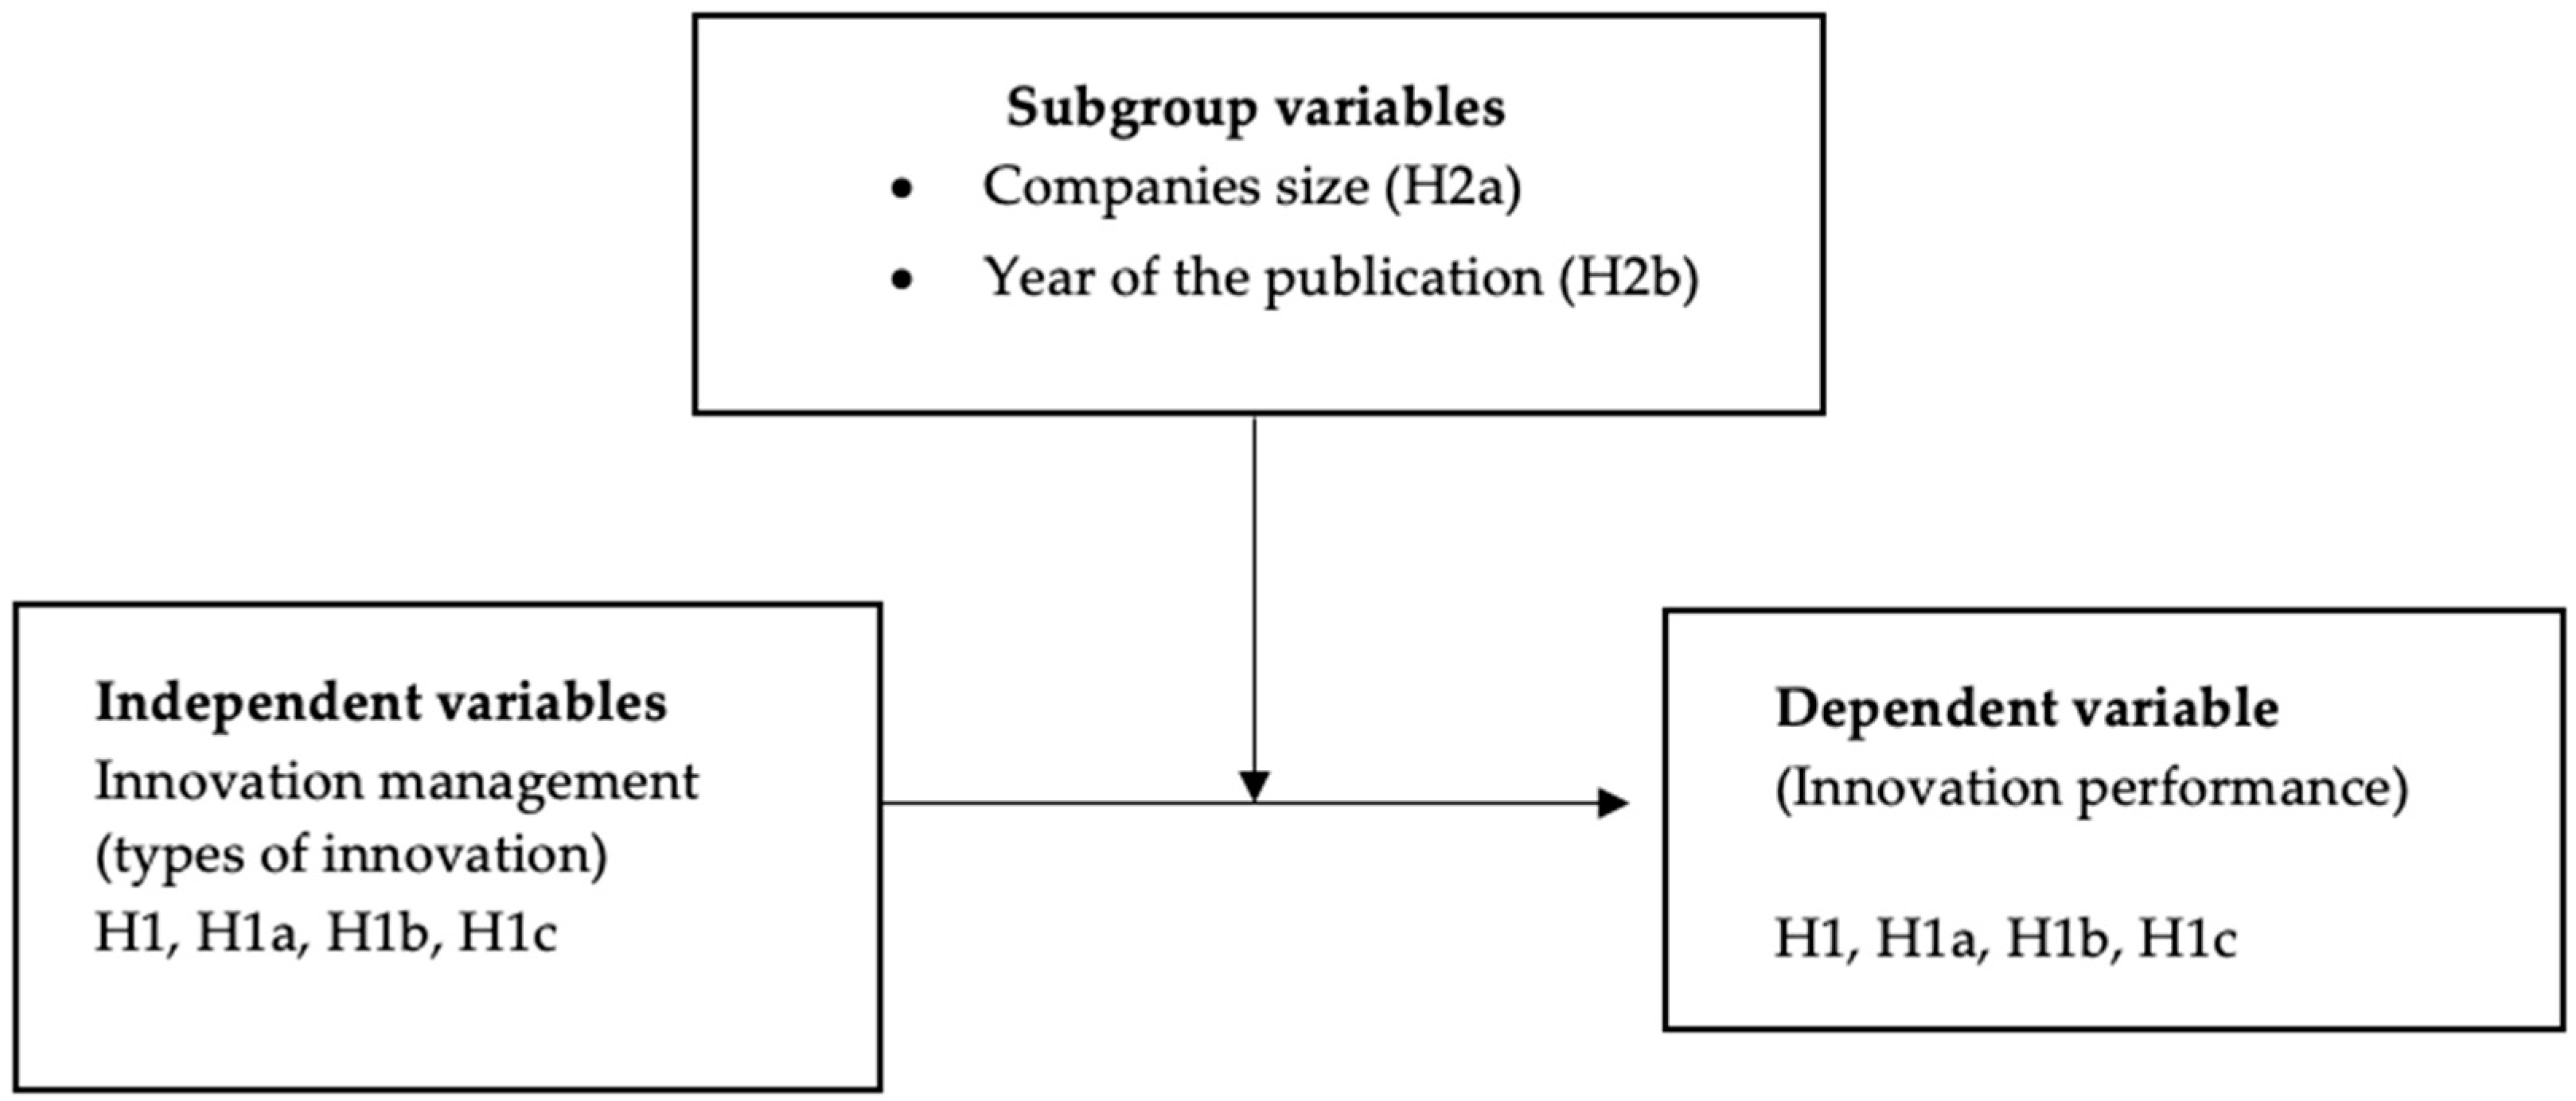
  • Before establishing the hypotheses, it is necessary to divide individual types of innovation and determine the dependent variable, distinguished variables, subgroup control, and moderator variables; the relationship between these variables and the hypotheses is shown in Figure 2.
  • Subsequently, the name of the study, the year of publication, and the correlation coefficients are entered into the statistical software Comprehensive Meta-Analysis (CMA) V2. N in Table 4 counts the total number of enterprises included in all studies, and it is also divided into individual innovation types; k is for the number of papers devoted to the research issue.
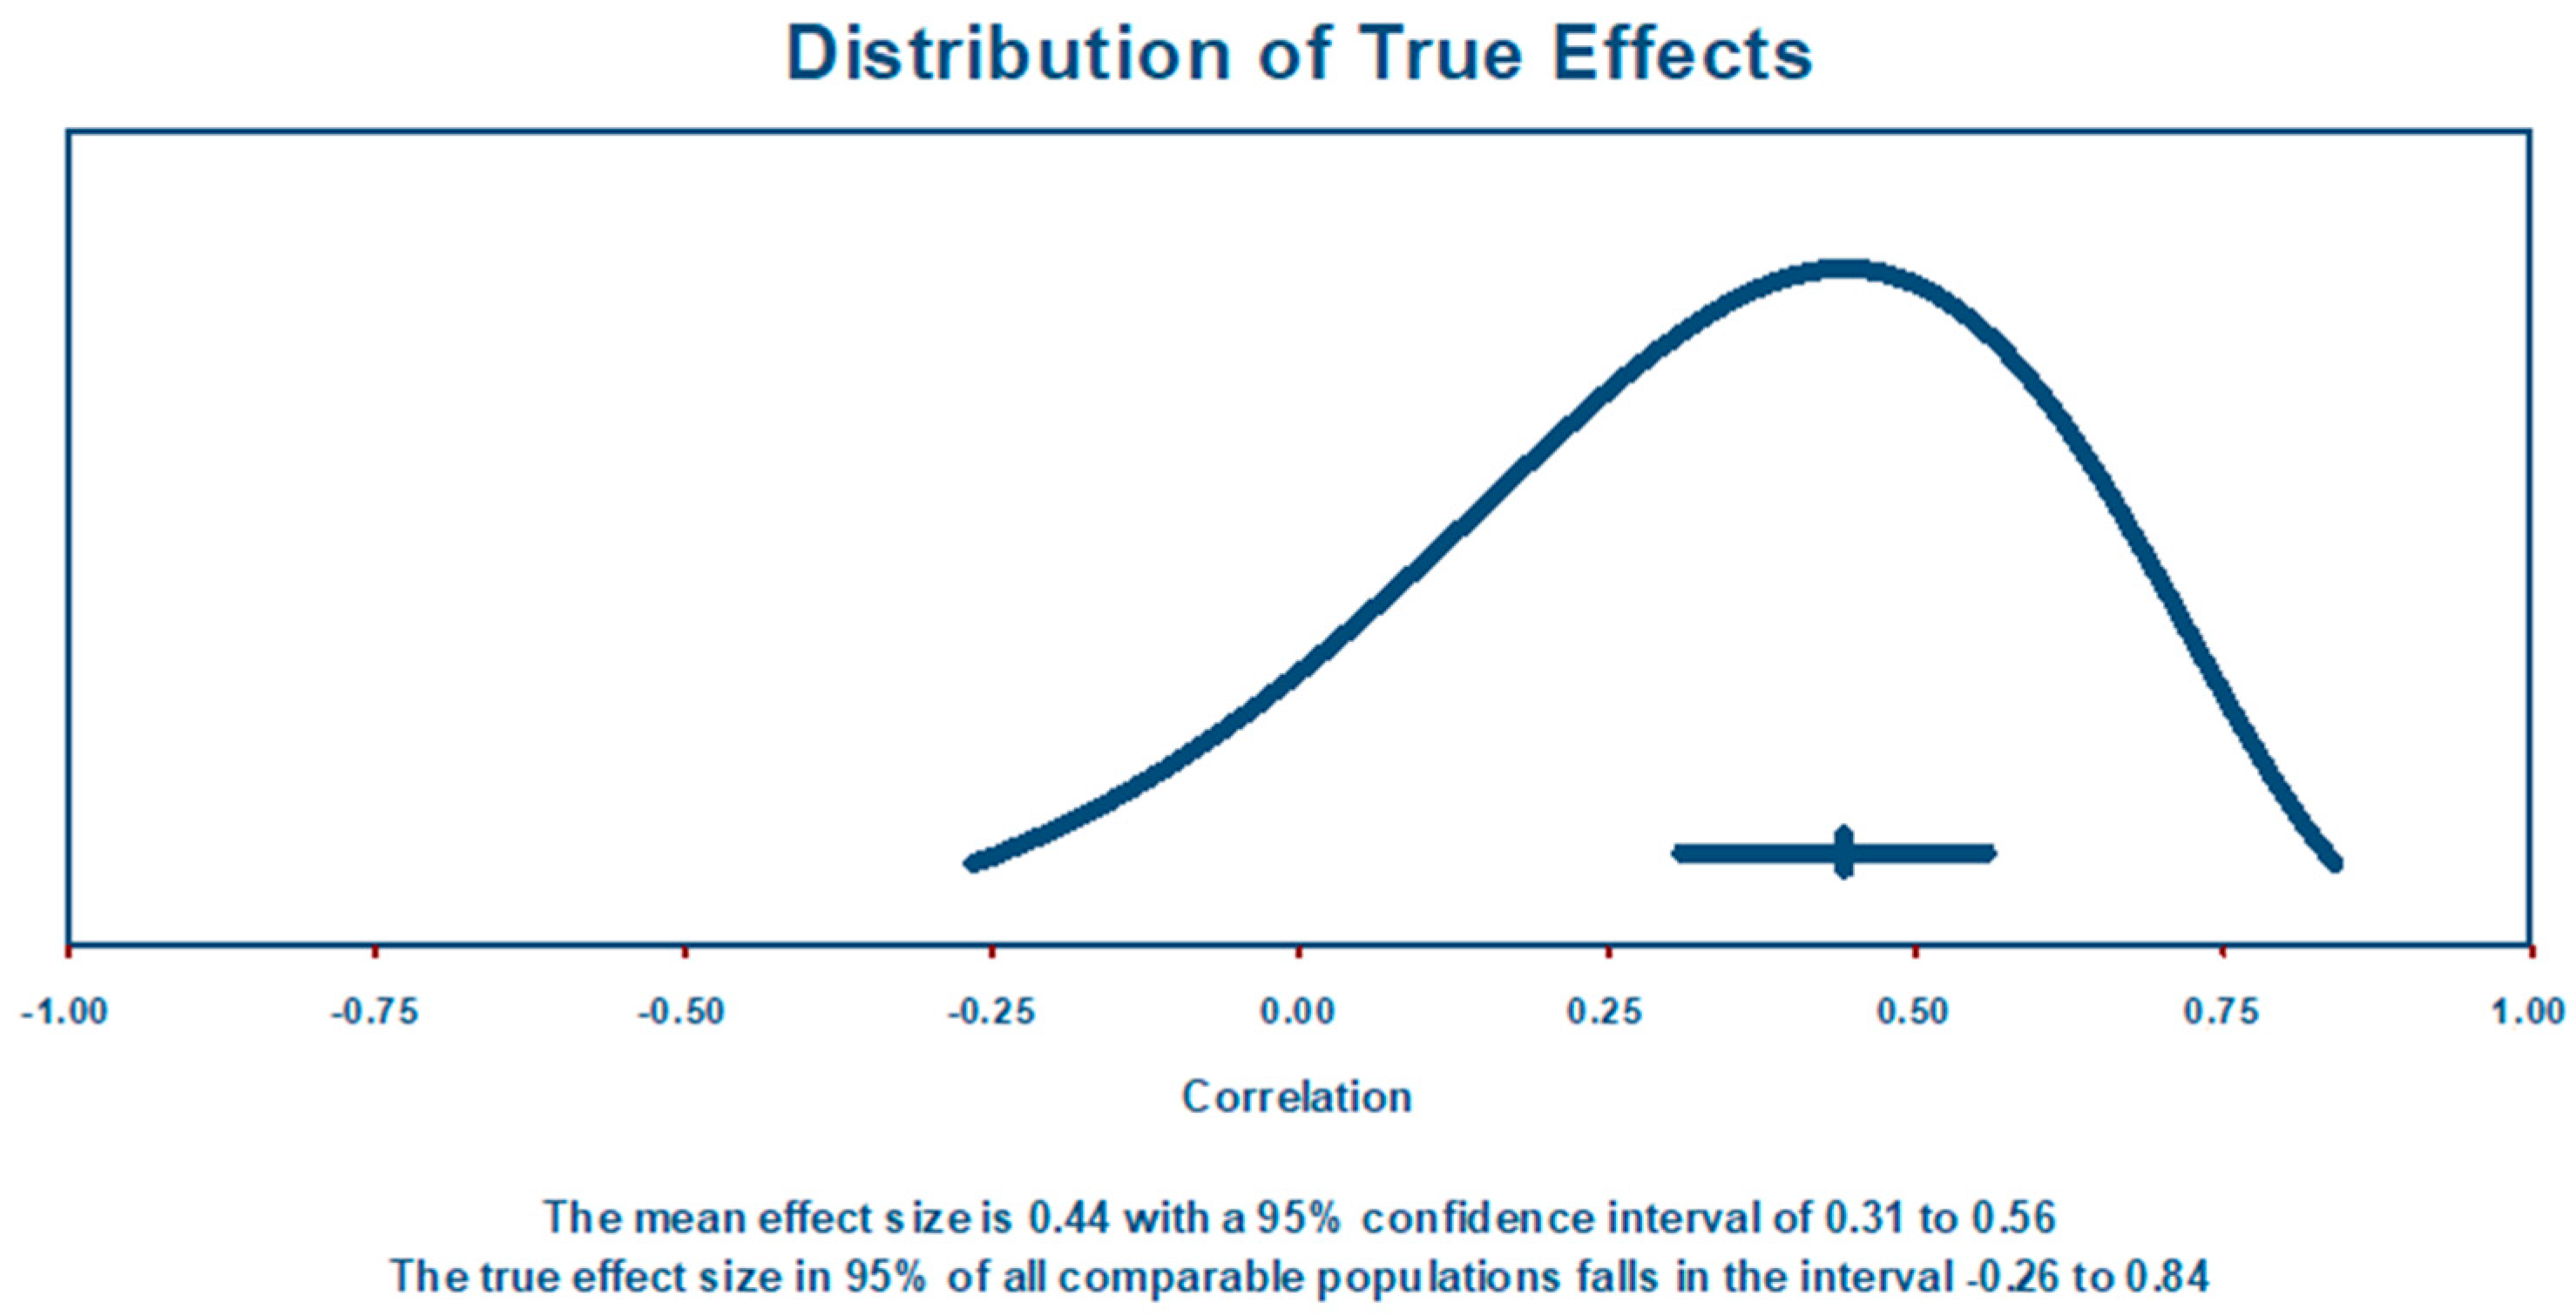
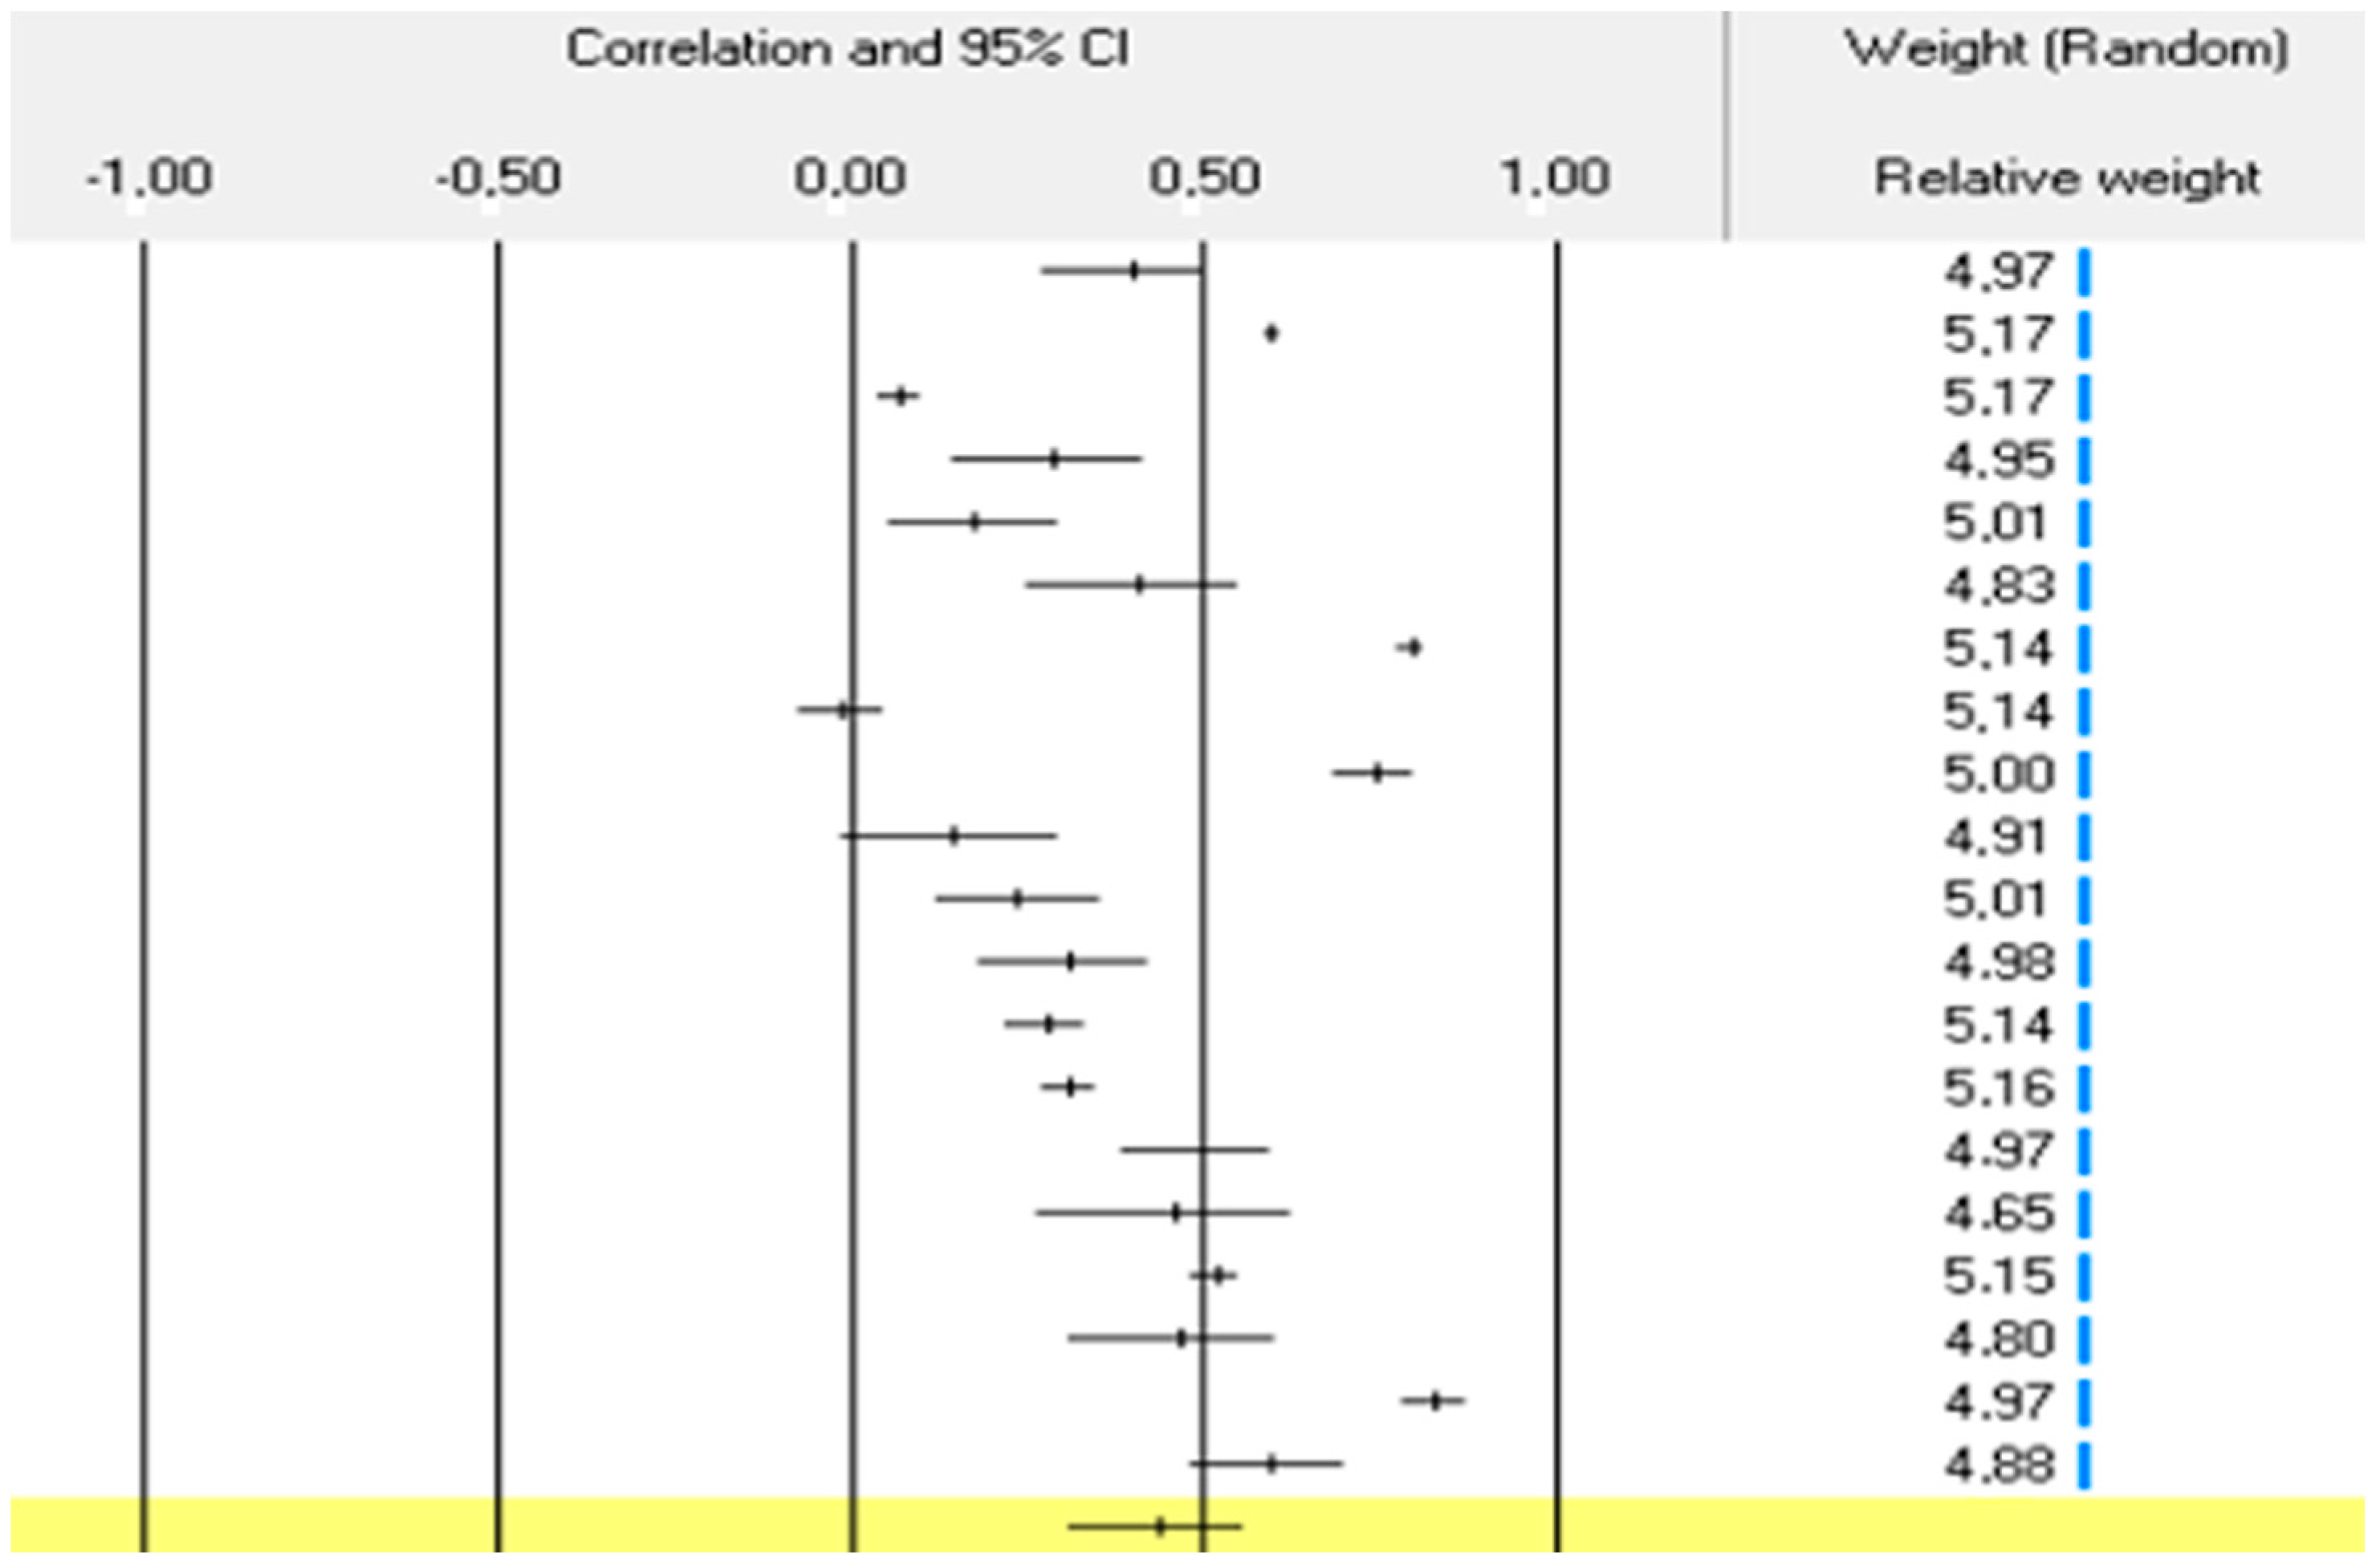
  • Based on the information inserted into the CMA software V2, the Pearson correlation coefficients are computed (Table 4), and further, they are transformed into Fisher’s Z values, which stabilize the variance and produce more accurate estimates. These outputs are used to calculate z-values and p-values as well as confidence intervals (Table 5). Then, the distribution of the true correlation effects can be portrayed graphically and numerically (Figure 3).
  • After all the calculations, basic methods using the principles of meta-analysis are performed: a funnel plot (which is a graph designed to check the existence of publication bias; Figure 4) and a forest plot (where each line in the graphical display represents a study; Figure 5).
  • Heterogeneities within the entire set of all studies were examined (Table 6). Part of the meta-analysis is the analysis of subgroups and the subsequent verification of established statistical hypotheses (Table 7).
Authors incorporated empirical studies published in peer-reviewed journals due to the expectation that such studies will present validated findings and possess the greatest influence within the discipline. This research focus is on empirical data pertaining to management innovation. Therefore, the following studies were excluded: those written in languages other than English, those that were book chapters, opinions, unpublished full-text publications, and scientific journal articles lacking quantitative data that could be converted into Pearson’s correlation coefficients. In accordance with the research conducted by Hunter and Schmidt [48], we formulated the subsequent inclusion criteria to ascertain that the samples comprise the requisite data for analysis. An essential research inquiry for each study must at the outset be the correlation between the innovation performance of organizations and the categories of innovations that effect innovation management or are affected by it. The Pearson’s correlation coefficient between the variables of interest must be reported for each study. For each study to be valid, the research sample must be independent. Additionally, every study should operate in isolation from one another. The search parameters enable the identification of 537 studies that satisfy the specified criteria on the Web of Science (Figure 1). By employing the predetermined criteria for inclusion and exclusion, pertinent research was identified after the retrieval of all papers from the databases. Following the removal of duplicate publications, papers bearing identical titles were likewise excluded. Using the procedure, the ultimate number of studies was reduced to 20 after each research article was thoroughly read.
Each of the selected studies included data collection from businesses or their employees, and these studies examined the impact of different types of innovation. After selection and consideration of relevant studies, the number of enterprises and the type of innovations that the given studies examined were shown. We then added up these quantitative data according to the type of innovation. Subsequently, using the Comprehensive Meta-Analysis V2 program, the calculations necessary for a proper meta-analysis were performed.
Dependent variable: Innovation performance.
Innovation performance refers to the comprehensive evaluation of a company’s endeavors and outcomes concerning the development of its products or services, processes, or leadership [49,50]. Metrics that have a substantial effect on innovation performance include the development of new products or services, sales revenue generated from said products or services, the quantity of patents awarded for novel inventions, the utilization of novel tools or equipment, and the implementation of novel work organizations and management techniques. These metrics encompass many indicators related to management innovation, process innovation, and product or service innovation [51,52]. The assessment of corporate innovation performance is critical to improve the value and decision making procedures of organizations.
Distinguishing variables: Management of innovations (varieties of innovations).
Various categories of innovations exist, each of which is representative of the sector in which a business operates and expands its operations. Technological innovations comprise the most significant ones, followed by product innovations, process innovations, and service innovations. Nevertheless, in the current era, eco-innovations, organizational innovations, and innovations that have a more targeted effect on the operations of the company are also of significant importance [53]. The invention or acceptance of a concept or practice that is novel to an organization is referred to as an organizational innovation. Organizational innovation prioritizes knowledge-based concepts and transformative behaviour. The most prevalent form of innovation is product innovation. A product that is introduced to potential consumers is considered novel or substantially modified, either regarding its intended functions or characteristics [54]. Service innovation includes the provision of healthcare, education, information and knowledge-based services, and transportation and logistics. Service innovation can serve as a viable strategy for a business to establish and maintain a competitive edge over time. Because services are predominantly intangible or knowledge-based goods, conceptualizations of innovations that depart from product-based definitions can enrich a discourse on service innovation [55]. Technological innovation refers to the advancement of new products through technological means [56]. It encompasses both technological products and processes. Process innovation is a critical performance determinant. Equipment or production modifications may be required for the implementation of new or substantially enhanced production methods and techniques [53]. Circular economy and associated eco-innovations are hotly debated subjects now. Eco-innovation is the commercial application of knowledge to develop products and processes that contribute to sustainable development by offering direct or indirect ecological benefits [57].
Authors, therefore, put forth the subsequent hypotheses:
H1: 
Management of innovation in the form of selected innovation categories (product innovation/eco innovation/organizational innovation) is positively correlated with companies’ innovation performance.
H1a: 
Product innovation is positively correlated with companies’ innovation performance.
H1b: 
Eco innovation is positively correlated with companies’ innovation performance.
H1c: 
Organizational innovation is positively correlated with companies’ innovation performance.
Additionally, the subgroups of the hypotheses were developed to discover additional significant findings that could corroborate or contradict authors own. Therefore, authors subsequently formulated further hypotheses.
H2a: 
The relationship between innovation management and companies’ innovation performance is statistically significant for SMEs companies.
H2b: 
The relationship between innovation management and companies’ innovation performance is statistically significant for scientific studies published after (or including) 2015.
Control and moderator subgroup variables:
A moderator variable is a term used to describe a factor that is believed to regulate or diminish the extent to which an independent variable influences a dependent variable [58,59]. This study also incorporates several subgroup variables that could potentially influence the observed association. MA, being a sophisticated approach, incorporates these variables and affords the chance to examine relationships that might have evaded detection in the original studies. In addition, the samples were subdivided into subdivisions, which were then classified according to their size to distinguish between small and medium-sized enterprises (SMEs) and large corporations. The differentiation between small and medium-sized enterprises (SMEs), large businesses, or a hybrid of the two, is established by applying the OECD 250 employee criterion [60]. Small and medium-sized enterprises (SMEs) have a substantial impact on the economies of every nation [61]. Authors subsequently concentrated on the year of publication for the studies, qualitatively conveyed the publication year in accordance with the article’s publication year and designated them as follows: prior to 2015 and after (including) 2015 as the publication year (Figure 2).
A crucial component of the investigation is the forest tract, the notion of weighting corresponds to the significance of the research findings. In general, studies are assigned weights based on the inverse of their variance. It is critical to acknowledge that smaller studies typically make a lesser contribution to the aggregate correlation estimates [62]. Weights and percentages of studies in the MA indicate the contribution of each study to the overall summary results; this is especially important when some studies are considered outliers or have a high potential for bias. Individual weights denote that each study is of equal relevance. The outcomes of this analysis are thus not distorted. The findings of MA are effectively represented graphically via forest plots [63]. Although the concept of forest plots has been in use since the 1970s, the term “forest plot” was not introduced until 2001) [64]. Furthermore, it serves as a tool for generating and examining the heterogeneity of the study outcomes’ plot. Due to the fact that it provides a swift visual representation of study heterogeneity and overall estimates, the forest plot is considered a highly effective instrument in MA [65]. Each line represents research in the forest sites. The correlation magnitude, represented as the midpoint of the box, is a point estimate of the correlation and its area is directly proportional to the study’s weight. The contributions of individual investigations to the aggregated results vary. Generally, research studies with a greater N yield more substantial information and are consequently assigned more significance. Below the studies is a diamond representing the total aggregated correlation effect from the included research.
In the context of MA, the utilization of a funnel plot to supplement the analysis is appropriate. Rosenthal [66] proposed that instead of speculating on the correlation of the missing studies, the number of studies necessary to nullify the correlation could be calculated. Given the relatively modest magnitude of this number, legitimate concerns do arise. Nonetheless, a substantial value of this parameter signifies that the correlation, although potentially inflated due to the omission of certain studies, is not null. The ‘File-drawer’ analysis was proposed by Rosenthal [66], with the absent studies being postulated to be located in file drawers. The concept of ‘Fail-Safe N’ was introduced by Cooper [67] to denote the quantity of absent studies that would render the correlation null and void. This approach has significant limitations. The assumption is made that this effect observed in the concealed studies is null, neglecting to account for the potentiality that some of the studies may have demonstrated the opposite correlation. Consequently, the quantity of studies necessary to obliterate the correlation might be less than the Fail-Safe N. Additionally, this approach prioritizes statistical significance over substantive significance, which is a fundamental distinction. Hence, although this methodology allows for the assertion that the correlation is not null, it neglects to assess whether the correlation retains practical significance even when the absent studies are accounted for. Additionally, it should be noted that the fail-safe N algorithm generates a p-value for every study, which is subsequently summed. On the contrary, the prevailing methodology employed by this program is to calculate the p-value for the combined correlation after combining the correlation sizes that were calculated for each individual study. In general, the results produced by the two methodologies differ. Hypothetically, the funnel plot would be symmetrical if MA had incorporated every pertinent study. Consequently, research will be uniformly distributed in both directions of the overall correlation. Authors are therefore concerned that these left-hand studies may exist and be omitted from the analysis if the funnel plot is asymmetric, with a relatively high number of small studies (representing a large correlation) falling to the right of the mean correlation and a relatively small number falling to the left. A method was devised by Cooper [67] that enables the imputing of these investigations. Specifically, authors ascertain the probable locations of the absent studies, incorporate them into the analysis, and subsequently recalculate the overall correlation. This approach is referred to as “Trim and Fill” because it involves an iterative process to remove asymmetric studies from the right-hand side to identify the unbiased this effect. Subsequently, the method completes the plot by re-inserting the trimmed studies on the right, along with their imputed counterparts to the left, which represent the mean correlation. The program employs a fixed effects model to identify absent studies and restricts its search to the left side of the mean correlation.

4. Results

To ensure that the meta-analysis accurately and objectively evaluates prior research, it is vital to implement classification criteria that delineate the information obtained from each study. The correlation and sample size of each individual sample were established initially. In common usage, the correlation magnitude was quantified using Pearson’s correlation coefficient. While all studies address the same subject matter, they may differ not only in their conclusions but also in the methods and techniques they employ [34,68]. Through the utilization of a meta-analysis, authors of this article evaluated the correlation between innovation management (specifically, the categories of innovations) and the innovation performance of organizations by quantitatively integrating the empirical study data from earlier independent studies [69]. The meta-analysis was conducted utilizing the Comprehensive Meta-Analysis software V2 [70]. The initial stage involved condensing Pearson’s correlation coefficients (r), which are presented in Table 2.
Table 2. Included studies in MA. Source: Authors’ compilation.
Included StudiesCorrelation rMetric
Furmanska-Maruszak and Sudolska (2016) [71]0.40Combination of social and organizational innovations with the sample of 200 companies s in Poland.
Arranz et al. (2021) [72]0.60Eco-innovations with the sample of 9172 companies in Spain
Zhang et al. (2023) [73]0.07Eco-innovations with the sample of 3842 companies in China
Apa et al. (2021) [74]0.29Organizational innovations with the sample of 179 companies in Italy
Basco and Calabro (2016) [75]0.18Product innovations with the sample of 245 companies in Chile
Zobel (2017) [76]0.41Product innovations with the sample of 119 companies in US and Europe)
Xie et al. (2017) [77]0.80Product innovations with the sample of 1206 companies in China
Yeniyurt et al. (2014) [78]−0.01Product innovations with the sample of 4290 companies in North America
Wang and Hu (2020) [79]0.75Product innovations with the sample of 236 companies in China
Rauter et al. (2019) [14]0.15Product innovations with the sample of 152 companies in Austria
Brettel and Cleven (2011) [80]0.24Product innovations with the sample of 254 companies in Germany
Lu and Yu (2020) [81]0.31Product innovations with the sample of 213 companies in China
Liu et al. (2017) [82]0.28Product innovations with the sample of 1066 companies in China
Kobarg et al. (2019) [83]0.31Product innovations with the sample of 218 companies in Germany
Jean et al. (2014) [84]0.50Product innovations with the sample of 170 companies in China
Li et al. (2019) [85]0.46Product innovations with the sample of 206 companies in China
Gunday et al. (2011) [86]0.52Product innovations with the sample of 184 companies in Turkey
Kowang et al. (2015) [87]0.47Product innovations with the sample of 108 companies in Malaysia
Bayhan et al. (2021) [88]0.83Organizational innovation with the sample of 200 respondents in Turkish companies
Chuang and Lee (2023) [89]0.60Organizational innovations with the sample of 144 companies in Taiwan
Authors initially assessed the overall relationship between innovation management and business innovation performance, as well as the moderating factors, utilizing MA approaches. Fisher’s z coefficients were utilized in place of correlation (r) to carry out the analysis accurately. The significance of this procedure lies in the fact that it ensures sampling error correction. To rank the correlation, their inverse variances were considered [90]. In addition, the corrected individual values were aggregated to derive the overall correlation [77]. The inverse hyperbolic tangent of Pearson’s correlation coefficient is referred to as the Fisher transformation (Fischer z-transformation) in statistics. Determining confidence intervals for the sample correlation coefficient becomes a formidable task due to its significantly asymmetrical distribution near +1 or −1 [91]. On a scale ranging from −1 to +1, correlation coefficients are quantified. A value of 0 signifies the absence of any linear or monotonic association, whereas a value approaching 1 indicates a stronger relationship that, over time, approaches a straight line represented by a consistently increasing or decreasing curve. Schober et al. [92] define a coefficient between variables as follows: 0.10 to 0.39 indicates a poor relationship; 0.40 to 0.69 indicates a moderate relationship; 0.70 to 0.89 indicates a strong relationship; and 0.90 to 1 denotes an extremely powerful relationship. The strength of dependence of correlation coefficients is detailed in Table 3. Based on the analysis, it is possible to conclude that innovation management has a moderate correlation on innovation performance as a whole and on innovation performance specifically. Environmental and product innovations fall under the classification of “weak dependence.” Product innovations are borderline dependent to a moderate degree. Given that organizational innovations exhibited the greatest values relative to the others, they can be categorized as moderately dependent. Upon applying Fisher’s coefficient in place of Pearson’s correlation coefficient, the outcomes remain essentially unaltered. The sole alteration that took place was in product innovations, which, after the transformation, can be categorized as having a moderate degree of interdependence among variables.
Table 3. Overall effect of MA. Source: Authors’ compilation.
HypothesiskNPearson’s Correlation rFisher’s z Coefficient
H1: Overall correlation 2022,4040.4470.475
H1a: Product1386670.3960.419
H1b: Eco213,0140.3640.381
H1c: Organizational57230.5820.665
For MA, authors incorporated the twenty studies that were mentioned. Table 4 details the fundamental parameters. Thirteen of the studies examined organizations that concentrated predominantly on product innovations (excluding ancillary activities). Two of the studies examined eco-innovations. Five of the studies identified organizations that attempted to investigate the issue of organizational innovations. A confidence interval of 95% delineates a spectrum of values [93]. The correlation serves as the effect magnitude index. For the analysis, a random effects model was implemented. A standard acceptance criterion for significance is a p-value of 0.05 or a constant z-value of 1.96. It is presumed that the studies included in the analysis constitute a random sample from a larger pool of prospective studies. The conclusions drawn from this analysis will be extrapolated to the entire number of studies [94]. The 95% confidence interval for a correlation of 0.447 is 0.557. Within this interval, the correlation of analogous studies could lie anywhere. The aggregate correlation has a p-value of 0.000 (p < 0.05). Organizational innovation performance is positively correlated with management of innovation in the form of designated innovation categories, according to a criterion alpha (α) of 0.05. Assumption H1 was approved. Likewise, Hypothesis H1a was validated. The innovation performance of companies is positively correlated with product innovation. The identical result can be extrapolated to H1c, indicating that there exists a positive correlation between organizational innovation and the innovation performance of companies. Because the p-value for eco-innovations exceeds the α significance level, it can be concluded that there is no positive correlation between eco-innovation and the innovation performance of companies. As a result, the hypothesis H1b is rejected. Additionally, a low z-value and a broad range of confidence interval values provide support for the findings.
Table 4. Hypothesis testing. Source: Authors’ compilation.
HypothesiskNz-Valuep-ValueConfidence Interval (95%)
H1: Overall correlation2022,4045.9050.0000.311; 0.565
H1a: Product1386674.1990.0000.219; 0.547
H1b: Eco213,0141.2250.220−0.225; 0.758
H1c: Organizational57234.1940.0000.340; 0.752
An inherent characteristic of the random effects model is that the magnitudes of actual correlation are distributed at random. On the contrary, within the framework of the random effects model, our objective is to calculate the average of a set of actual correlations. While large studies may produce more accurate estimates compared to small studies, it is important to note that each study estimates a distinct correlation, which in turn, represents a sample from the population who mean to attempt to estimate. Thus, in contrast to the fixed effects model, the weights allocated in the random effects model exhibit a greater degree of equilibrium. The analysis is less likely to be dominated by large studies, and less likely to be trivialized by minor studies. The random effects model posits that the true correlation may vary from one study to the next due to these variations (heterogeneity) between them. The confidence interval for the mean correlation is 0.56, and it ranges from 0.31 to 0.56. In total, 95% of all comparable studies report that the true correlation magnitude lies within the interval of −0.26 to 0.84 (Figure 3) [62].
An illustration of the correlation in greater detail is provided using a forest tract. The visual depiction of the forest graph reveals that the correlation coefficients of individual studies vary considerably. The values encompassed in the range of −0.01 to 0.83 demonstrate the considerable diversity of attainable correlation levels. Seventy percent of the correlation coefficient values, however, fall within the red-circled interval, which bodes well for future research in the context of this investigation (Figure 4).
The fail-safe N for MA, which incorporates data from 20 investigations, is 15,047. To achieve a combined two-tailed p-value greater than 0.050, it is necessary to identify and incorporate 15,047 ‘null’ studies. To nullify the correlation, 752.4 absent studies would be required for each observed study. Based on the parameters, the method posits that there are no studies that are absent. The point estimate and 95% confidence interval for the combined studies, as determined by the fixed effects model, are 0.45601 (0.44556; 0.46633). When employing Trim and Fill, the values remain unaltered. The combined investigations have a point estimate of 0.44188 and a 95% confidence interval of 0.55732 under the random effects model. By applying Trim and Fill, these values remain virtually unaltered (Figure 5).
Q-test to determine heterogeneity
As a test of the null hypothesis that all studies included in the analysis have the same correlation, the Q-statistic is utilized. The expected value of Q, assuming all studies had the same genuine correlation effect, would be equivalent to the degrees of freedom (one minus the number of studies). With 19 degrees of freedom, the Q-value is 2105.915. By applying criterion α of 0.100 to all these studies, it is possible to conclude that the correlation is identical. The I-squared statistic is 99%, indicating that the sampling error accounts for less than 99% of the variance in observed correlation and represents the variance in genuine correlations (Table 5).
Table 5. Heterogeneity test. Source: Authors’ compilation.
Heterogeneity TestQ-Test for HeterogeneityDf (Q)I-Squared
Overall correlation2105.9151999.098
A comparable examination to the one conducted in the context of the overall correlation can be replicated via subgroup analysis. Authors selected the enterprise size and the year of publication of the given publication as subgroup variables, they also selected the enterprise size and the year of publication of the given publication as subgroup variables. α = 0.05 was selected as the level of significance. Authors classified the corporations into two groups based on their employee count: small and medium enterprises, and large enterprises. The year of publication of individual studies was recoded into two categories: those published prior to 2015 and those published after 2015 (or later).
Then they investigated the H2a and H2b hypotheses. The results of this analysis can be officially declared. Authors conclude that the hypothesis H2a is accepted based on the data in Table 6, as the p value is less than the significance level (α = 0.05) for small and medium-sized enterprises (SMEs). Simultaneously, the z-value exceeds the constant threshold of 1.96, thereby providing evidence in favor of accepting the hypothesis H2a. Hypothesis H2b is also accepted on the grounds that the p-value is below the predetermined significance level (α = 0.05) for studies published after 2015. Additionally, the z-value exceeds the constant threshold for the z-score (1.96), suggesting that this metric supports the adoption of the H2b hypothesis.
Table 6. Subgroup analysis. Source: Authors’ compilation.
HypothesiskNz-Valuep-ValueConfidence Interval (95%)
H2a: Companies size
SMEs1519,5485.6020.0000.285; 0.543
Large528561.8590.062−0.027; 0.807
H2b: Publication year
Before 2015431891.9340.053−0.005; 0.593
After 20151619,2155.5270.0000.317; 0.598
Table 7. Summary of testing hypothesis. Source: Authors’ compilation.
HypothesisAccepted/RejectedCorrelation
H1: Management of innovation in the form of selected innovation types (product/eco/organizational) is positively correlated with companies’ innovation performance.AcceptedPositive
H1a: Product innovation is positively correlated with companies’ innovation performance.AcceptedPositive
H1b: Eco innovation is positively correlated with companies’ innovation performance.RejectedPositive
H1c: Organizational innovation is positively correlated with companies’ innovation performance.AcceptedPositive
H2a
The relationship between innovation management and companies’ innovation performance is statistically significant for SMEs companies.
AcceptedNot identified
H2b
The relationship between innovation management and companies’ innovation performance is statistically significant for scientific studies published after (or including) 2015.
AcceptedNot identified
Except for hypothesis H1b, every other hypothesis was accepted (Table 7). The analysis revealed that organizational innovations have the greatest correlation coefficient, suggesting that they are the most responsive and have the greatest influence on overall innovation performance. Ecological innovations fail to exhibit statistical significance when evaluated within the context of hypothesis testing.

5. Discussion

The calculation of correlation for the relationship of interest in the MA conceptual model provides valuable guidance on the optimal timing for conducting an MA [95,96]. A MA’s findings are intrinsically linked to the caliber of the primary studies it examines. The potential benefits of the MA outputs include improved correlation estimates, resolution of disputes that may arise from ostensibly contradictory research, development of novel theories, and answers to questions that were not explored in the individual studies. More precisely, the exploration of heterogeneity is critical in the development of innovative theories [97]. It is not possible to determine the efficacy of an intervention, or the validity of a hypothesis based on the findings of a single study, as such information typically varies between studies. An alternative approach that integrates data from multiple trials is necessary.
According to a study by Khosravi et al. [98], these results exist. The outcome of the MA indicated that the scale of the organization has a substantial and positive impact on management innovation. Furthermore, it demonstrated a robust and positive correlation between innovation management and financial performance. The correlation between collaborative innovations and the overall efficacy of the enterprise has been the subject of inquiry by other authors. Collaborative innovation refers to the practice wherein organizations or groups combine their resources, expertise, skills, and experience to develop or improve a solution that benefits all parties involved. Previous studies have established that collaborative innovation has a substantial effect on innovation performance. Research has established a robust and positive correlation between collaborative innovation and the innovation performance of organizations [77,99,100]. Mendoza’s [101] research illustrated the correlation between organizational specialization and innovation. This correlation was found to be statistically significant, according to the study. The results suggest that the nature of the organization moderates the relationship between specialization and innovation, with a stronger correlation observed in manufacturing firms as opposed to service-oriented ones. Opinions have been expressed by other scholars regarding open innovation as a business strategy that involves leveraging external ideas, technologies, and resources, as well as internal innovation, to advance a company’s development of new products, services, and processes. It encourages collaboration with external partners such as customers, suppliers, competitors, and research institutions to co-create value and drive innovation. Open innovation contrasts with traditional closed innovation approaches, where all innovation activities are conducted internally within the organization’s boundaries [102]. The relationship between open innovation performance and three crucial factors—analysis level, open innovation technique, and performance measure—is significantly altered [103]. To streamline the implementation of internal and external open innovation, organizations should adopt a top-down methodology. To safeguard their own inventions and promote open innovation, businesses should appoint competent executives to devise and supervise policies pertaining to organizational innovation. To promote the exchange of information, they ought to employ a combination of formal and informal limitations [104].

6. Conclusions

A comprehension of the adoption process and individual innovations is necessary to grasp the conception, development, and utilization of innovations within organizations. Additionally, numerous innovation studies are necessary because the establishment and management of innovative businesses rely on the identification of characteristics that encourage innovation adoption. MA compiled and synthesized empirical research findings concerning the correlation between innovation performance and innovation management. Both the overall effect of innovation management and its correlation with innovation performance are classified as moderate in nature. Weak reliance encompasses product and environmental innovations. Product development is dependent to a moderate degree. Organizational innovations exhibited the highest values relative to the other categories; therefore, they can be classified as moderately dependent. While the correlations between the individual studies varied, the weights assigned to each study were nearly equivalent, ensuring that none of the studies substantially distorted the obtained results. Furthermore, seventy percent of the studies were contained within the confidence interval. Additionally, authors have ascertained that there exists a statistically significant correlation between innovation management and the innovation performance of small and medium-sized enterprises (SMEs). Statistically significant correlations exist between innovation management and the innovation performance of companies, according to studies published in 2015 or later. The implementation and successful utilization of innovative initiatives positively impact the operational outcomes of businesses. Although there may be variations in the quantification of the correlation coefficient when it comes to the implementation of innovation management, fundamental differences between companies are not evident. The implementation and successful utilization of innovative initiatives positively impact the operational outcomes of businesses. With the exception of eco-innovations, the remaining chosen forms of innovation have a substantial impact on effective innovation management, a fundamental requirement for the prosperous execution of innovative endeavors within organizations. Thus, the study’s objective was accomplished.
One of the constraints of this research must be acknowledged: the lack of the use of other several scientific databases that could have broadened the scope of the studies incorporated in this analysis (e.g., to include the relevant scientific outputs for Scopus database). Furthermore, authors acknowledge that due to the increasing number of management innovation investigations, they cannot guarantee that they have considered every study that has been conducted in this field. Although it is plausible to consider the exhaustive searches as a representation of the present state of management innovation research, future investigations may incorporate additional databases, conceptual frameworks, and unpublished papers to delve deeper into this matter. One prevalent critique of meta-analyses is that they neglect the potential variability in the treatment correlation across studies in favor of concentrating on the summary correlation. While the MA will generate a mathematically valid synthesis of the included studies, if the included studies represent a biased sample of all prospective studies, the correlation reported by the MA will reflect bias. Additionally, it is critical to bear in mind that a correlation coefficient is insufficient to succinctly summarize an entire research field, as it fails to account for significant research and may diverge from randomized trials. For information management to ensure the collection of high-quality data, established procedures are necessary. The process of determining which studies to incorporate into a systematic review or meta-analysis is difficult and susceptible to error. Nevertheless, a framework of criteria is present to assist in determining which studies to integrate. A prevalent issue in the realm of MA pertains to the limitation that a single number and coefficient (particularly correlation coefficients) merely represents the impact of the analyzed studies without providing a comprehensive and all-encompassing depiction of the analyzed domains. These domains are frequently intricate and may comprise numerous indicators and indicators. As they will inevitably have unique characteristics, it may be difficult to ascertain the degree of similarity that should be maintained among the studies incorporated in an MA. It is critical to bear in mind that, by their very nature, MAs examine broader subjects than individual studies. Actually, the purpose of an MA should be to synthesize the correlation, not merely to provide a correlation summary. Consistent correlation suggests that the correlation is robust across the entire range of studies included in the analysis. When a small dispersion exists, the mean correlation must be interpreted considering the dispersion. If a substantial dispersion exists, the focus should transition from the overall correlation to the dispersion itself. Researchers, in fact, fail to achieve the intended purpose of the synthesis when they present a summary correlation without considering heterogeneity.

Author Contributions

Conceptualization, M.N., D.J. and K.V.; methodology, D.J., K.V. and M.N.; validation, D.J. and K.V.; formal analysis, E.N., M.N. and K.V.; investigation, D.J.; resources, E.N., D.J. and K.V.; data curation, E.N. and M.N.; writing—original draft preparation, D.J., M.N. and K.V.; writing—review and editing, M.N., K.V. and E.N.; visualization, M.N. and E.N.; supervision, K.V. and E.N. All authors have read and agreed to the published version of the manuscript.

Funding

This research was financially supported by the Slovak Research and Development Agency Grant VEGA 1/0677/22: Quo Vadis, Bankruptcy Models? Prospective Longitudinal Cohort Study with Emphasis on Changes Determined by COVID 19.

Data Availability Statement

The data presented in this study are available on request from the corresponding author.

Conflicts of Interest

The authors declare no conflicts of interest.

References

  1. Nambisan, S. Digital entrepreneurship: Towards a digital technology perspective of entrepreneurship. Entrepreneur. Theory Pract. 2017, 41, 1029–1056. [Google Scholar] [CrossRef]
  2. Jasimuddin, S.M.; Nakshabandi, M. Linkage between knowledge infrastructure capability and inbound open innovation: The intervening role of absorptive capacity. Prod. Plann. Control 2019, 30, 893–906. [Google Scholar] [CrossRef]
  3. Machova, R.; Korcsmaros, E.; Csereova, A.; Varga, J. Innovation activity of Slovak ICT SMEs. J. Bus. Sect. 2023, 1, 32–41. [Google Scholar] [CrossRef]
  4. Gallo, P.; Kusnirova, R.; Vachal, J.; Strakova, J.; Rauser, D. Application of BSC and EFQM models in small and medium-sized enterprises. J. Bus. Sect. 2023, 1, 20–31. [Google Scholar] [CrossRef]
  5. Stratone, M.-E. Mapping the impact of the intellectual capital on the agility and performance of an organization: A bibliometric study. Ekon.-Manazerske Spektrum 2023, 17, 39–53. [Google Scholar] [CrossRef]
  6. Gajdosikova, D.; Valaskova, K.; Kliestik, T.; Machova, V. COVID-19 Pandemic and its impact on challenges in the construction sector: A case study of Slovak enterprises. Mathematics 2022, 10, 3130. [Google Scholar] [CrossRef]
  7. Valaskova, K.; Gajdosikova, D.; Lazaroiu, G. Has the COVID-19 pandemic affected the corporate financial performance? A case study of Slovak enterprises. Equilibrium. Q. J. Econ. Econ. Policy 2023, 18, 1133–1178. [Google Scholar] [CrossRef]
  8. Jerdea, L. A bibliometric analysis of a four-construct framework: Innovation management, competitive advantage, agility and organizational performance. Manag. Dyn. Knowl. Econ. 2023, 11, 306–323. [Google Scholar] [CrossRef]
  9. Jasimuddin, S.M. Knowledge Management—An Interdisciplinary Perspective; World Scientific Publishing Company: Singapore, 2023. [Google Scholar]
  10. Civelek, M.; Krajcik, V.; Kljucnikov, A. The impacts of dynamic capabilities on SMEs’ digital transformation process: The resource-based view perspective. Oeconomia Copernic. 2023, 14, 1367–1392. [Google Scholar] [CrossRef]
  11. Dabija, D.C.; Vătămănescu, E.M. Artificial intelligence: The future is already here. Oeconomia Copernic. 2023, 14, 1053–1056. [Google Scholar] [CrossRef]
  12. Nagy, M.; Lăzăroiu, G.; Valaskova, K. Machine Intelligence and Autonomous Robotic Technologies in the Corporate Context of SMEs: Deep Learning and Virtual Simulation Algorithms, Cyber-Physical Production Networks, and Industry 4.0-Based Manufacturing Systems. Appl. Sci. 2023, 13, 1681. [Google Scholar] [CrossRef]
  13. Kliestik, T.; Nagy, M.; Valaskova, K. Global value chains and industry 4.0 in the context of lean workplaces for enhancing company performance and its comprehension via the digital readiness and expertise of workforce in the V4 nations. Mathematics 2023, 11, 601. [Google Scholar] [CrossRef]
  14. Rauter, R.; Globocnik, D.; Perl-Vorbach, E.; Baumgartner, R.J. Open innovation and its effects on economic and sustainability innovation performance. J. Innov. Knowl. 2019, 4, 226–233. [Google Scholar] [CrossRef]
  15. Damanpour, F.; Aravind, D. Managerial Innovation: Conceptions, Processes, and Antecedents. Manag. Organ. Rev. 2011, 8, 423–454. [Google Scholar] [CrossRef]
  16. Birkinshaw, J.; Hamel, G.; Mol, M.M. Management innovation. Acad. Manag. Rev. 2008, 33, 825–845. [Google Scholar] [CrossRef]
  17. Katila, R.; Ahuja, G. Something Old, Something New: A Longitudinal Study of Search Behavior and New Product Introduction. Acad. Manag. J. 2002, 45, 1183–1194. [Google Scholar] [CrossRef]
  18. Laursen, K.; Salter, A. Open for Innovation: The Role of Openness in Explaining Innovation Performance among UK Manufacturing Firms. Strateg. Manag. J. 2006, 27, 131–150. [Google Scholar] [CrossRef]
  19. Barbier, L.; Tengeh, R.K. How to Implement Knowledge Management in Emerging Governments in Africa and Beyond: A Case Study on the South African Government. Manag. Dyn. Knowl. Econ. 2023, 11, 170–189. [Google Scholar] [CrossRef]
  20. Bratianu, C. Knowledge dynamics: Exploring its meanings and interpretations. Manag. Dyn. Knowl. Econ. 2023, 11, 100–111. [Google Scholar] [CrossRef]
  21. Garcia, R.; Calantone, R. A critical look at technological innovation typology and innovativeness terminology: A literature review. J. Prod. Innov. Manag. 2002, 19, 110–132. [Google Scholar] [CrossRef]
  22. Tohidi, H.; Jabbari, M.M. The important of innovation and its crucial role in growth, survival and success of organizations. Procedia Technol. 2012, 1, 535–538. [Google Scholar] [CrossRef]
  23. Goel, R.K.; Nelson, M.A. Employment effects of R&D and process innovation: Evidence from small and medium-sized firms in emerging markets. Eurasian Bus. Rev. 2022, 12, 97–123. [Google Scholar] [CrossRef]
  24. Sarpong, D.; Boakye, D.; Ofosu, G.; Botchie, D. The three pointers of research and development (R&D) for growth-boosting sustainable innovation system. Technovation 2023, 122, 102581. [Google Scholar] [CrossRef]
  25. Liskova, S.; Tomsik, P. Competency-basd approach to human resources management. Agric. Econ. 2013, 59, 496–504. [Google Scholar] [CrossRef]
  26. Ullah, I.; Narain, R. Achieving mass customization capability: The roles of flexible manufacturing competence and workforce management practices. J. Adv. Manag. Res. 2020, 18, 273–296. [Google Scholar] [CrossRef]
  27. Valeri, M. Organizational Studies: Implications for the Strategic Management; Springer: Cham, Switerland, 2021. [Google Scholar]
  28. Mortazavi, S.H.; Bahrami, M. Integrated approach to entrepreneurship–knowledge based economy: A conceptual model. Procedia-Soc. Behav. Sci. 2012, 41, 281–287. [Google Scholar] [CrossRef]
  29. Freeman, C. Technology Policy and Economic Performance: Lessons from Japan; Pinter Publishers: London, UK, 1987. [Google Scholar]
  30. Craft, N. Regulation and productivity performance. Oxf. Rev. Econ. Policy 2006, 22, 186–202. [Google Scholar] [CrossRef]
  31. Carlin, W.; Soskice, D. Macroeconomics: Imperfections, Institutions and Policies; Oxford University Press: Oxford, UK; London, UK, 2006. [Google Scholar]
  32. Deng, P.; Lu, H. Transnational knowledge transfer or indigenous knowledge transfer: Which channel has more benefits for China’s high-tech enterprises? Eur. J. Innov. Manag. 2022, 25, 433–453. [Google Scholar] [CrossRef]
  33. Mehmood, M.S.; Jian, Z.; Akram, U.; Akram, Z.; Tanveer, Y. Entrepreneurial leadership and team creativity: The roles of team psychological safety and knowledge sharing. Pers. Rev. 2022, 51, 2404–2425. [Google Scholar] [CrossRef]
  34. Pigott, T.D.; Polanin, J.R. Methodological guidance paper: High-quality meta-analysis in a systematic review. Rev. Educ. Res. 2020, 90, 24–46. [Google Scholar] [CrossRef]
  35. Phillips, V.; Barker, E. Systematic reviews: Structure, form and content. J. Perioper. Pract. 2021, 31, 349–353. [Google Scholar] [CrossRef] [PubMed]
  36. Riley, R.D.; Higgins, J.P.; Deeks, J.J. Interpretation of random effects meta-analyses. BMJ 2011, 342, d549. [Google Scholar] [CrossRef] [PubMed]
  37. Egger, M.; Smith, G.D. Meta-analysis: Potentials and promise. BMJ 1997, 315, 1371–1374. [Google Scholar] [CrossRef] [PubMed]
  38. Egger, M.; Smith, G.D.; Schneider, M.; Minder, C. Bias in meta-analysis detected by a simple, graphical test. BMJ 1997, 315, 629–634. [Google Scholar] [CrossRef] [PubMed]
  39. Jones, T.; Evans, D. Conducting a systematic review. Aust. Crit. Care Nurs. 2000, 13, 66–71. [Google Scholar] [CrossRef] [PubMed]
  40. Owens, J.K. Systematic reviews: Brief overview of methods, limitations, and resources. Nurse Author Ed. 2021, 31, 69–72. [Google Scholar] [CrossRef]
  41. Tranfield, D.; Denyer, D.; Smart, P. Towards a methodology for developing evidence-informed management knowledge by means of systematic review. Br. J. Manag. 2003, 14, 207–222. [Google Scholar] [CrossRef]
  42. Kitchenham, B. Procedures for Performing Systematic Reviews; Keele University: Keele, UK, 2004; pp. 1–26. [Google Scholar]
  43. Zhang, L.; Zhang, Y.; Li, N.; Zhang, Q. Do the academician independent directors promote green innovation in enterprises? Environ. Sci. Pollut. Res. 2023, 30, 84061–84082. [Google Scholar] [CrossRef] [PubMed]
  44. Trifu, A.; Smîdu, E.; Badea, D.O.; Bulboacă, E.; Haralambie, V. Applying the PRISMA method for obtaining systematic reviews of occupational safety issues in literature search. MATEC Web Conf. 2022, 354, 52. [Google Scholar] [CrossRef]
  45. Rezvani, A.; Khosravi, P. A comprehensive assessment of project success within various large projects. J. Mod. Proj. Manag. 2018, 6, 114–122. [Google Scholar] [CrossRef]
  46. Crossan, M.M.; Apaydin, M. A multi-dimensional framework of organizational innovation: A systematic review of the literature. J. Manag. Stud. 2010, 47, 1154–1191. [Google Scholar] [CrossRef]
  47. Desmidt, S.; Prinzie, A.; Decramer, A. Looking for the value of mission statements: A meta-analysis of 20 years of research. Manag. Decis. 2011, 49, 468–483. [Google Scholar] [CrossRef]
  48. Hunter, J.E.; Schmidt, F.L. Methods of Meta-Analysis: Correcting Error and Bias in Research Findings. J. Am. Stat. Assoc. 2004, 20, 242–244. [Google Scholar] [CrossRef]
  49. Prajogo, D.I.; Ahmed, P.K. Relationships between innovation stimulus, innovation capacity, and innovation performance. R&D Manag. 2006, 36, 499–515. [Google Scholar]
  50. Ebersberger, B.; Bloch, C.; Herstad, S.J.; Van De Velde, E.L.S. Open innovation practices and their effect on innovation performance. Int. J. Innov. Technol. Manag. 2012, 9, 1250040. [Google Scholar] [CrossRef]
  51. Lundvall, B.Å.; Nielsen, P. Knowledge management and innovation performance. Int. J. Manpow. 2007, 28, 207–223. [Google Scholar] [CrossRef]
  52. Robertson, J.; Caruana, A.; Ferreira, C. Innovation performance: The effect of knowledge-based dynamic capabilities in cross-country innovation ecosystems. Int. Bus. Rev. 2023, 32, 101866. [Google Scholar] [CrossRef]
  53. Edwards-Schachter, M. The nature and variety of innovation. Int. J. Innov. Stud. 2018, 2, 65–79. [Google Scholar] [CrossRef]
  54. Granja, J.; Moreira, S. Product innovation and credit market disruptions. Rev. Financ. Stud. 2023, 36, 1930–1969. [Google Scholar] [CrossRef]
  55. Durst, S.; Mention, A.L.; Poutanen, P. Service innovation and its impact: What do we know about? Investig. Eur. De Dir. Y Econ. De La Empresa 2015, 21, 65–72. [Google Scholar] [CrossRef]
  56. Mooi, E.; Rudd, J.; de Jong, A. Process innovation and performance: The role of divergence. Eur. J. Mark. 2020, 54, 741–760. [Google Scholar] [CrossRef]
  57. Sanni, M.; Verdolini, E. Eco-innovation and openness: Mapping the growth trajectories and the knowledge structure of open eco-innovation. Sustain. Futures 2022, 4, 100067. [Google Scholar] [CrossRef]
  58. Hamilton, S. Deep Learning Computer Vision Algorithms, Customer Engagement Tools, and Virtual Marketplace Dynamics Data in the Metaverse Economy. J. Self-Gov. Manag. Econ. 2022, 10, 37–51. [Google Scholar] [CrossRef]
  59. Söderlund, M. Moderator variables in consumer research: A call for caution. J. Retail. Consum. Serv. 2023, 73, 103352. [Google Scholar] [CrossRef]
  60. European Commision. European Competitiveness Report 2014–2021. Available online: http://ec.europa.eu/enterprise/policies/industrial-competitiveness/competitiveness-analysis/european-competitiveness-report/index_en.htm (accessed on 20 February 2024).
  61. Belas, J. Are there differences in the approach to CSR according to the most important business sectors in the SME segment? Empirical research in the V4 countries. Ekon.-Manazerske Spektrum 2023, 17, 86–95. [Google Scholar]
  62. Borenstein, M.; Hedges, L.; Rothstein, H. Meta-analysis: Fixed effect vs. random effects. Meta-Anal. 2007, 1, 1–162. [Google Scholar] [CrossRef]
  63. Dettori, J.R.; Norvell, D.C.; Chapman, J.R. Seeing the forest by looking at the trees: How to interpret a meta-analysis forest plot. Glob. Spine J. 2021, 11, 614–616. [Google Scholar] [CrossRef] [PubMed]
  64. Verhagen, A.P.; Ferreira, M.L. Forest plots. J. Physiother. 2014, 60, 170–173. [Google Scholar] [CrossRef]
  65. Israel, H.; Richter, R.R. A guide to understanding meta-analysis. J. Orthop. Sports Phys. Ther. 2011, 41, 496–504. [Google Scholar] [CrossRef]
  66. Rosenthal, R. Meta-analysis: A review. Psychosom. Med. 1991, 53, 247–271. [Google Scholar] [CrossRef]
  67. Cooper, H. Research Synthesis and Meta-Analysis: A Step-by-Step Approach; Sage Publications: Thousand Oaks, CA, USA, 2015; Volume 2. [Google Scholar] [CrossRef]
  68. Villiger, J.; Schweiger, S.A.; Baldauf, A. Making the invisible visible: Guidelines for the coding process in meta-analyses. Organ. Res. Methods 2022, 25, 716–740. [Google Scholar] [CrossRef]
  69. Nica, E. Urban Big Data Analytics and Sustainable Governance Networks in Integrated Smart City Planning and Management. Geopolit. Hist. Int. Relat. 2021, 13, 93–106. [Google Scholar] [CrossRef]
  70. Brüggemann, P.; Rajguru, K. Comprehensive meta-analysis (CMA) 3.0: A software review. J Mark. Anal 2022, 10, 425–429. [Google Scholar] [CrossRef]
  71. Furmanska-Maruszak, A.; Sudolska, A. Social innovations in companies and in social economy enterprises. Comp. Econ. Res. Cent. East. Eur. 2016, 19, 169–191. [Google Scholar] [CrossRef]
  72. Arranz, N.; Arguello, N.L.; de Arroyabe, J.C.F. How do internal, market and institutional factors affect the development of eco-innovation in firms? J. Clean. Prod. 2021, 297, 126692. [Google Scholar] [CrossRef]
  73. Zhang, J.; Han, L.; Shields, L.; Tian, J.; Wang, J. A PRISMA assessment of the reporting quality of systematic reviews of nursing published in the Cochrane Library and paper-based journals. Medicine 2019, 98, e18099. [Google Scholar] [CrossRef] [PubMed]
  74. Apa, R.; De Marchi, V.; Grandinetti, R.; Sedita, S.R. University-SME collaboration and innovation performance: The role of informal relationships and absorptive capacity. J. Technol. Transf. 2021, 46, 961–988. [Google Scholar] [CrossRef]
  75. Basco, R.; Calabrò, A. Open innovation search strategies in family and non-family SMEs: Evidence from a natural resource-based cluster in Chile. Acad. Rev. Latinoam. De Adm. 2016, 29, 279–302. [Google Scholar] [CrossRef]
  76. Zobel, A.K. Benefiting from open innovation: A multidimensional model of absorptive capacity. J. Prod. Innov. Manag. 2017, 34, 269–288. [Google Scholar] [CrossRef]
  77. Xie, X.M.; Zeng, S.X.; Tam, C.M. How does cooperative innovation affect innovation performance? Evidence from Chinese firms. Technol. Anal. Strateg. Manag. 2017, 25, 939–956. [Google Scholar] [CrossRef]
  78. Yeniyurt, S.; Henke, J.W.; Yalcinkaya, G. A longitudinal analysis of supplier involvement in buyers’ new product development: Working relations, inter-dependence, co-innovation, and performance outcomes. J. Acad. Mark. Sci. 2014, 42, 291–308. [Google Scholar] [CrossRef]
  79. Wang, C.; Hu, Q. Knowledge sharing in supply chain networks: Effects of collaborative innovation activities and capability on innovation performance. Technovation 2020, 94, 102010. [Google Scholar] [CrossRef]
  80. Brettel, M.; Cleven, N.J. Innovation culture, collaboration with external partners and NPD performance. Creat. Innov. Manag. 2011, 20, 253–272. [Google Scholar] [CrossRef]
  81. Lu, C.; Yu, B. The effect of formal and informal external collaboration on innovation performance of SMEs: Evidence from China. Sustainability 2020, 12, 9636. [Google Scholar] [CrossRef]
  82. Liu, Y.; Ying, Y.; Wu, X. Catch-up through collaborative innovation: Evidence from China. Thunderbird Int. Bus. Rev. 2017, 59, 533–545. [Google Scholar] [CrossRef]
  83. Kobarg, S.; Stumpf-Wollersheim, J.; Welpe, I.M. More is not always better: Effects of collaboration breadth and depth on radical and incremental innovation performance at the project level. Res. Policy 2019, 48, 1–10. [Google Scholar] [CrossRef]
  84. Jean, R.J.B.; Sinkovics, R.R.; Hiebaum, T.P. The Effects of Supplier Involvement and Knowledge Protection on Product Innovation in Customer–Supplier Relationships: A Study of Global Automotive Suppliers in China. J. Prod. Innov. Manag. 2014, 31, 98–113. [Google Scholar] [CrossRef]
  85. Li, Y.; Guo, H.; Cooper, S.Y.; Wang, H. The influencing factors of the technology standard alliance collaborative innovation of emerging industry. Sustainability 2019, 11, 6930. [Google Scholar] [CrossRef]
  86. Gunday, G.; Ulusoy, G.; Kilic, K.; Alpkan, L. Effects of innovation types on firm performance. Int. J. Prod. Econ. 2011, 133, 662–676. [Google Scholar] [CrossRef]
  87. Kowang, T.O.; Long, C.S.; Rasli, A. Innovation Management and Performance Framework for Research University in Malaysia. Int. Educ. Stud. 2015, 8, 32–45. [Google Scholar] [CrossRef]
  88. Bayhan, B.C.; Korkmaz, O. Relationship between Innovation Management and Innovative Organizational Culture in Logistics Companies: A Study in the City of Mersin. Istanb. Bus. Res. 2021, 50, 103–126. [Google Scholar] [CrossRef]
  89. Chuang, L.M.; Lee, Y.P. Toward Sustainable Development: The Causes and Consequences of Organizational Innovation. Sustainability 2023, 15, 8017. [Google Scholar] [CrossRef]
  90. Hedges, L.V.; Olkin, I. Statistical Methods for Meta-Analysis; Academic Press: New York, NY, USA, 1985; Volume 1. [Google Scholar] [CrossRef]
  91. Mudholkar, G. Fischer’s Z-Transformation. Encycl. Stat. Sci. 2004, 6, 347–354. [Google Scholar] [CrossRef]
  92. Schober, P.; Boer, C.; Schwarte, L.A. Correlation coefficients: Appropriate use and interpretation. Anesth. Analg. 2018, 126, 1763–1768. [Google Scholar] [CrossRef] [PubMed]
  93. Jackson, D.; Bowden, J. Confidence intervals for the between-study variance in random-effects meta-analysis using generalised heterogeneity statistics: Should we use unequal tails? BMC Med. Res. Methodol. 2016, 16, 118. [Google Scholar] [CrossRef]
  94. Clephas, P.R.D.; Heesen, M. Interpretation of meta-analyses. Interv. Pain Med. 2022, 1, 100120. [Google Scholar] [CrossRef]
  95. Cafri, G.; Kromrey, J.D.; Brannick, M.T. A meta-meta-analysis: Empirical review of statistical power, type I error rates, effect sizes, and model selection of meta-analyses published in psychology. Multivar. Behav. Res. 2010, 45, 239–270. [Google Scholar] [CrossRef] [PubMed]
  96. Paul, J. Marketing in emerging markets: A review, theoretical synthesis and extension. Int. J. Emerg. Mark. 2019, 15, 446–468. [Google Scholar] [CrossRef]
  97. Papakostidis, C.; Giannoudis, P.V. Meta-analysis. What have we learned? Injury 2023, 54, 30–34. [Google Scholar] [CrossRef] [PubMed]
  98. Khosravi, P.; Newton, C.; Rezvani, A. Management innovation: A systematic review and meta-analysis of past decades of research. Eur. Manag. J. 2019, 37, 694–707. [Google Scholar] [CrossRef]
  99. Lau, A.K.; Tang, E.; Yam, R.C. Effects of supplier and customer integration on product innovation and performance: Empirical evidence in Hong Kong manufacturers. J. Prod. Innov. Manag. 2010, 27, 761–777. [Google Scholar] [CrossRef]
  100. Kim, K. Impact of firms’ cooperative innovation strategy on technological convergence performance: The case of Korea’s ICT industry. Sustainability 2017, 9, 1601. [Google Scholar] [CrossRef]
  101. Mendoza, M.L. Innovation across types of organization: A meta-analysis. Suma De Neg. 2015, 6, 108–113. [Google Scholar] [CrossRef]
  102. Chesbrough, H. Open Innovation: The New Imperative for Creating and Profiting from Technology; Harvard Business Press: Brighton, MA, USA, 2003. [Google Scholar]
  103. Nguyen, T.P.T.; Huang, F.; Tian, X. A meta-analysis of the impact of open innovation on performance. J. Manag. Organ. 2021, 2, 1–18. [Google Scholar] [CrossRef]
  104. Damanpour, F. Organizational innovation: A meta-analysis of effects of determinants and moderators. In Organizational Innovation; Routledge: London, UK, 2018; Volume 2, pp. 127–162. [Google Scholar] [CrossRef]
Figure 1. PRISMA diagram. Source: Authors’ compilation.
Systems 12 00130 g001
Figure 2. Graphical representation of the conceptual framework of the study. Source: Authors’ compilation.
Systems 12 00130 g002
Figure 3. Distribution of the true correlation effects. Source: Authors’ compilation.
Systems 12 00130 g003
Figure 4. Funnel plot. Source: Authors’ compilation.
Systems 12 00130 g004
Figure 5. Forest plot of MA. Source: Authors’ compilation.
Systems 12 00130 g005
Table 1. Systematic review analysis. Source: Authors’ compilation.
Review ActivityRequired Information
Review focusClear formulation of the hypothesis and review question.
Strategy of the searchSearch terms, scientific databases searched, restriction in the search, outcome of the search processes.
Selection of the studyInclusion criteria, exclusion criteria.
Critical appraisalCriteria for study quality determination, study appraisal procedures.
Data abstractionMethods for abstracting data, the strategies used, missing data.
AnalysisMeta-analysis, investigation of heterogeneity, comparisons, analysis of sensitivity, sub-group analyses.
ResultsFindings from methods, summary data, characteristics of studies included in the systematic review.
DiscussionSummary of findings, limitations of the research, implications for research, future challenges in the discussed issue, implications the practice.
Disclaimer/Publisher’s Note: The statements, opinions and data contained in all publications are solely those of the individual author(s) and contributor(s) and not of MDPI and/or the editor(s). MDPI and/or the editor(s) disclaim responsibility for any injury to people or property resulting from any ideas, methods, instructions or products referred to in the content.

