
Bootstrap Method of Eco-Efficiency in the Brazilian Agricultural Industry

 , , , , and
Abstract
:1. Introduction
2. Theoretical Methodological Framework
2.1. Literature Review
2.2. Productivity and Efficiency Models
2.3. Eco-Efficiency DEA Model
Shannon–Weaver Diversity Index
3. DEA-Stochastic Model
3.1. Outlier Detection
- First, an algorithm is implemented based on the Jackknife resampling technique. Randomly choose approximately 10% of the set r with to form a subset that we will call t with .
- Calculate the efficiencies of the DMUs by the DEA of com .
- Then, one must recalculate each of the efficiencies by removing each of the DMUs with and , where each represents the DMU that was removed. Thus, one must calculate the standard deviation of with respect to :
- Repeat (1, 2, and 3) S times, accumulating the leverage information in , where .
- The average leverage (a value that measures the impact of removing the DMU from the set, given by the standard deviation) is calculated for each DMU. The idea is that outliers will exhibit behavior with a higher leverage than the average of the other DMUs, so it will be selected with a lower probability, where .
- Posteriorly, the overall leverage is calculated by summing the average leverage of each DMU, where .
- After Jackknife resampling, bootstrap is applied to insert confidence intervals and information by leveraging to reduce the probability of choosing outliers for stochastic resampling samples; the probability is calculated based on the Heaviside function. In this way, the DMU with a considerable leverage value for overall leverage is discarded.
3.2. Statistical Inference of DEA-Stochastic with Bootstrap
- For each observation of the original sample , the DEA corresponding to each of the original sample represented by or is calculated (given the result of the scale backtest, the model is represented by ).
- Through a resampling process, a set of data is randomly drawn from the original sample. The bootstrap method is used to generate this random sample from the original sample of size p, which corresponds to the eco-efficiency scores, with , providing a distribution of a population estimated by the resampling process bootstrap .
- From this random sample, we have the inputs and outputs generated in the resampling , , .
- We calculate the estimated bootstrap for the eco-efficiency scores for each given the values from step (III) of i for , via a Linear Programming Problem (LPP) with DEA constraints:Equation (4) is input-oriented. The output-oriented model follows the same logic.
- We repeat steps (II) to (IV) B times (by default, ) to obtain the result with the confidence interval of 95%, given each observation , in a set of estimates, where .
3.3. Test of the Return to Scale Model
4. Analysis Variables
5. Results Analysis DEA
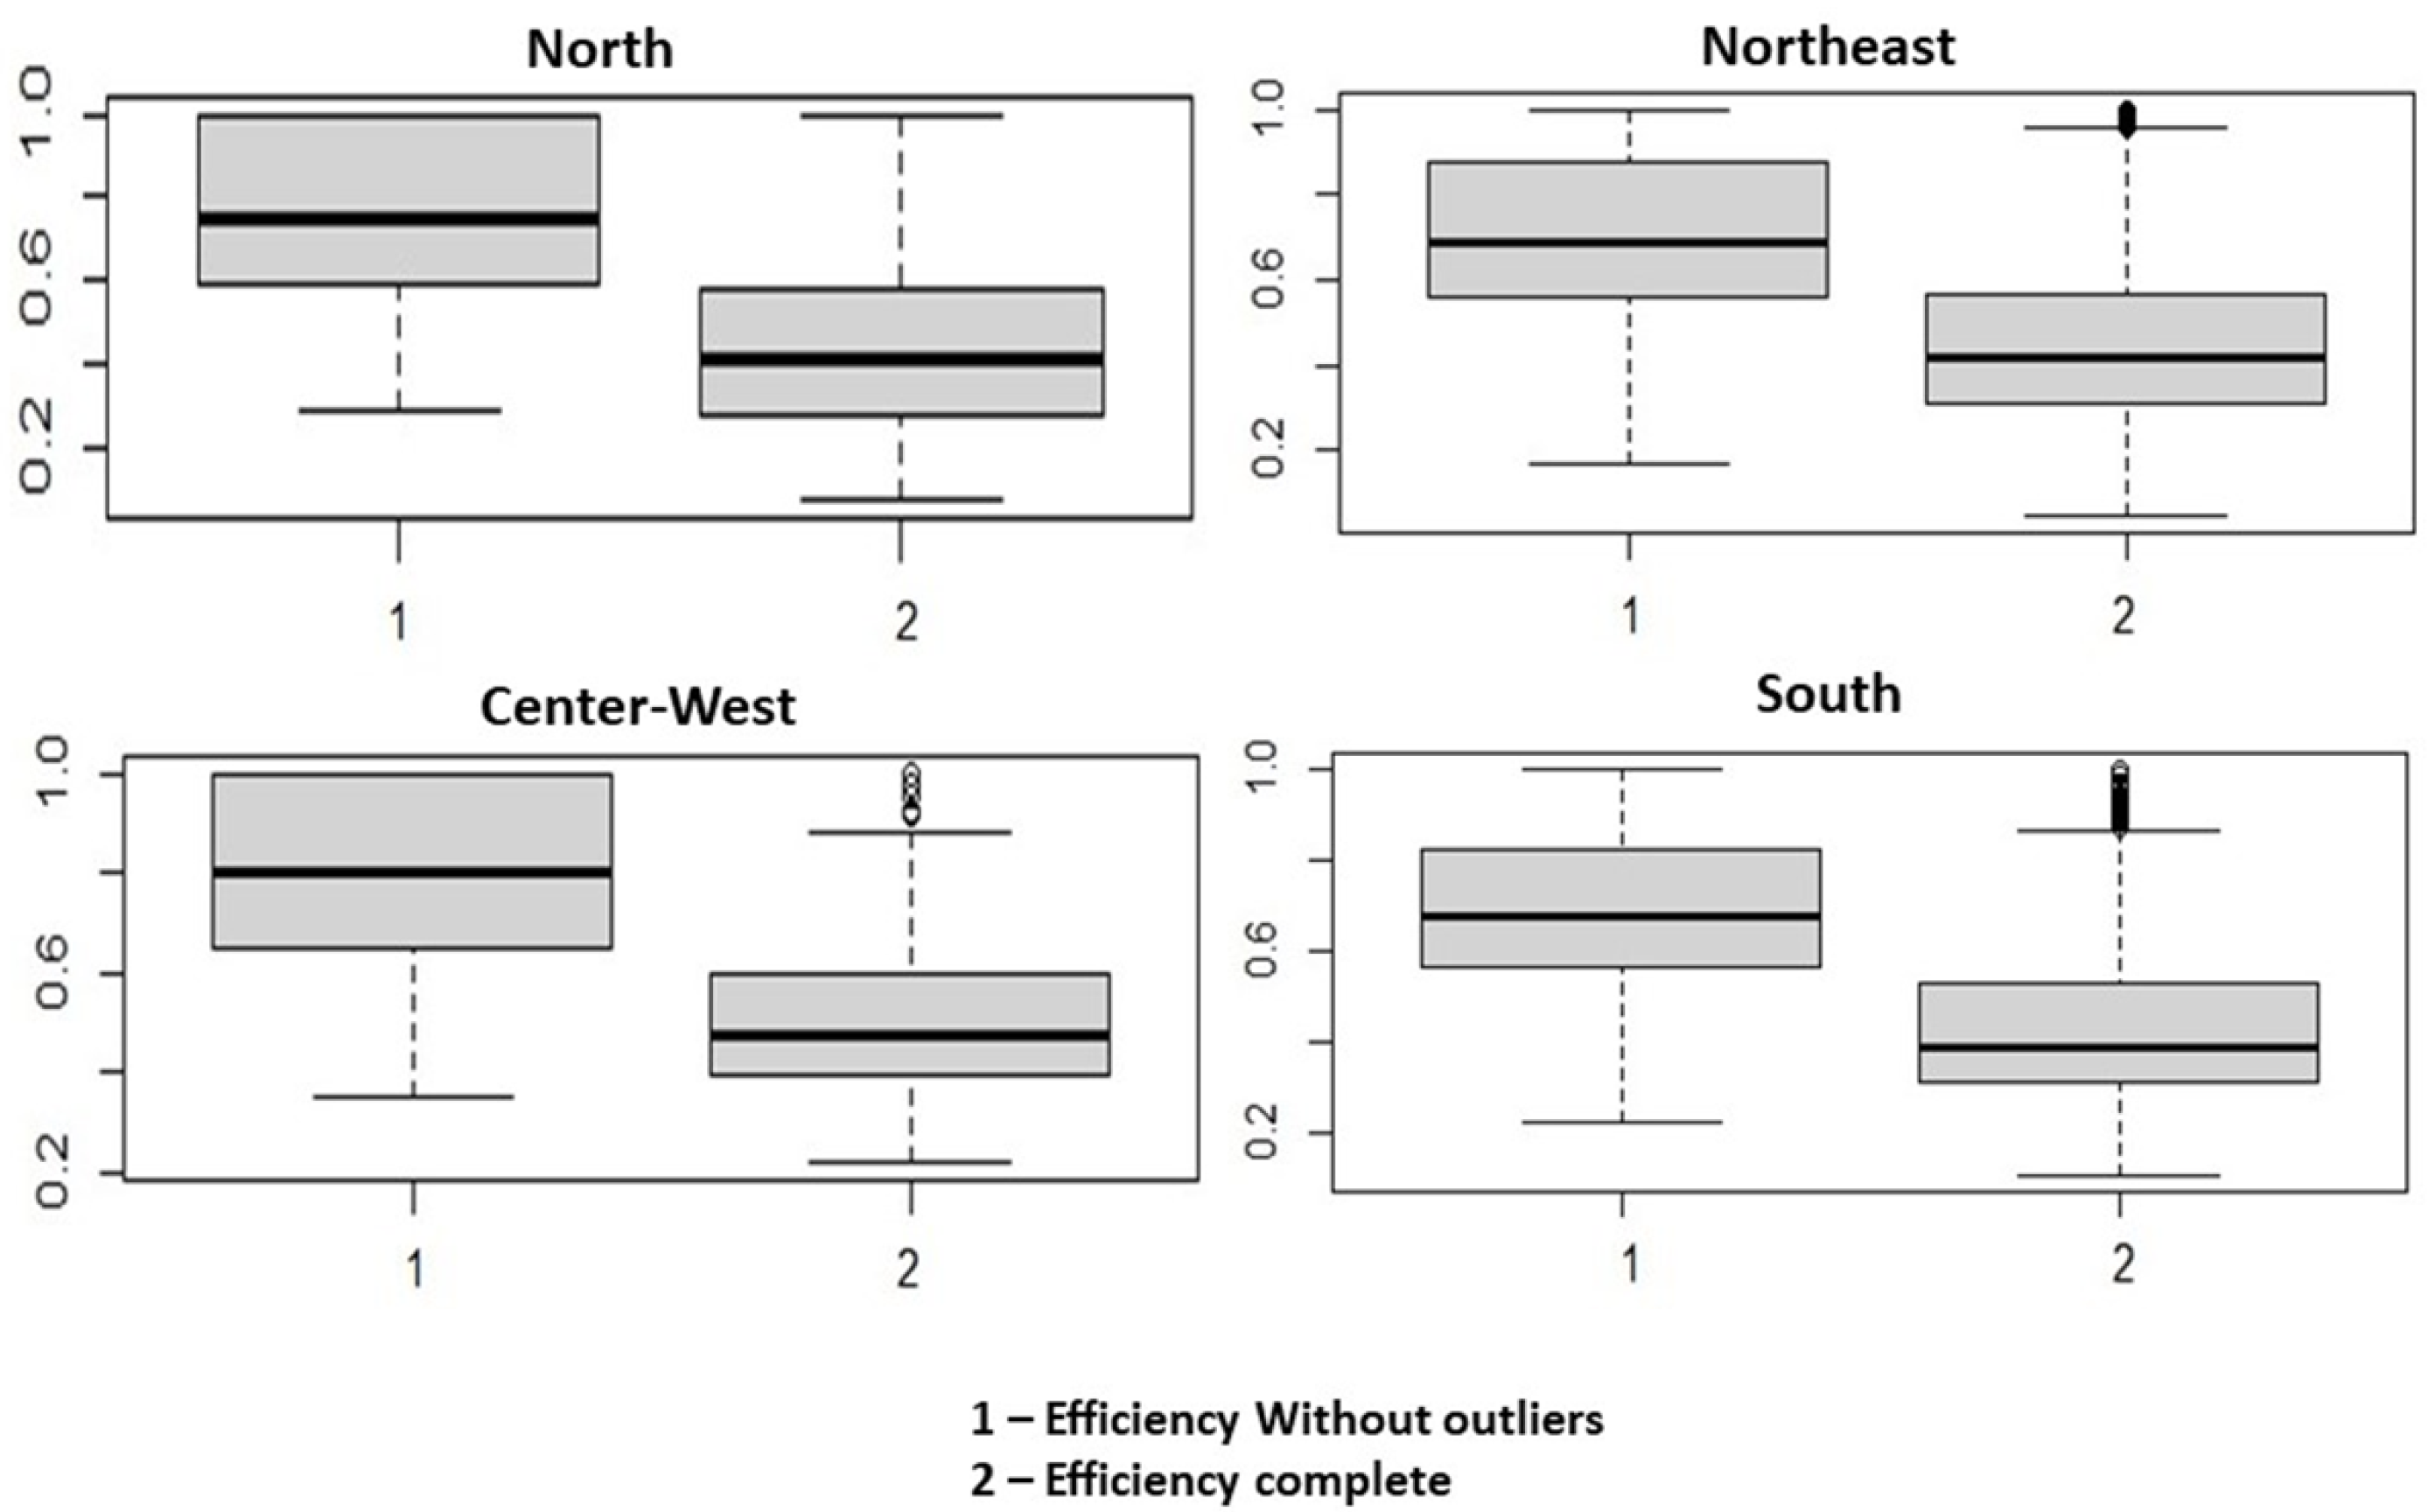
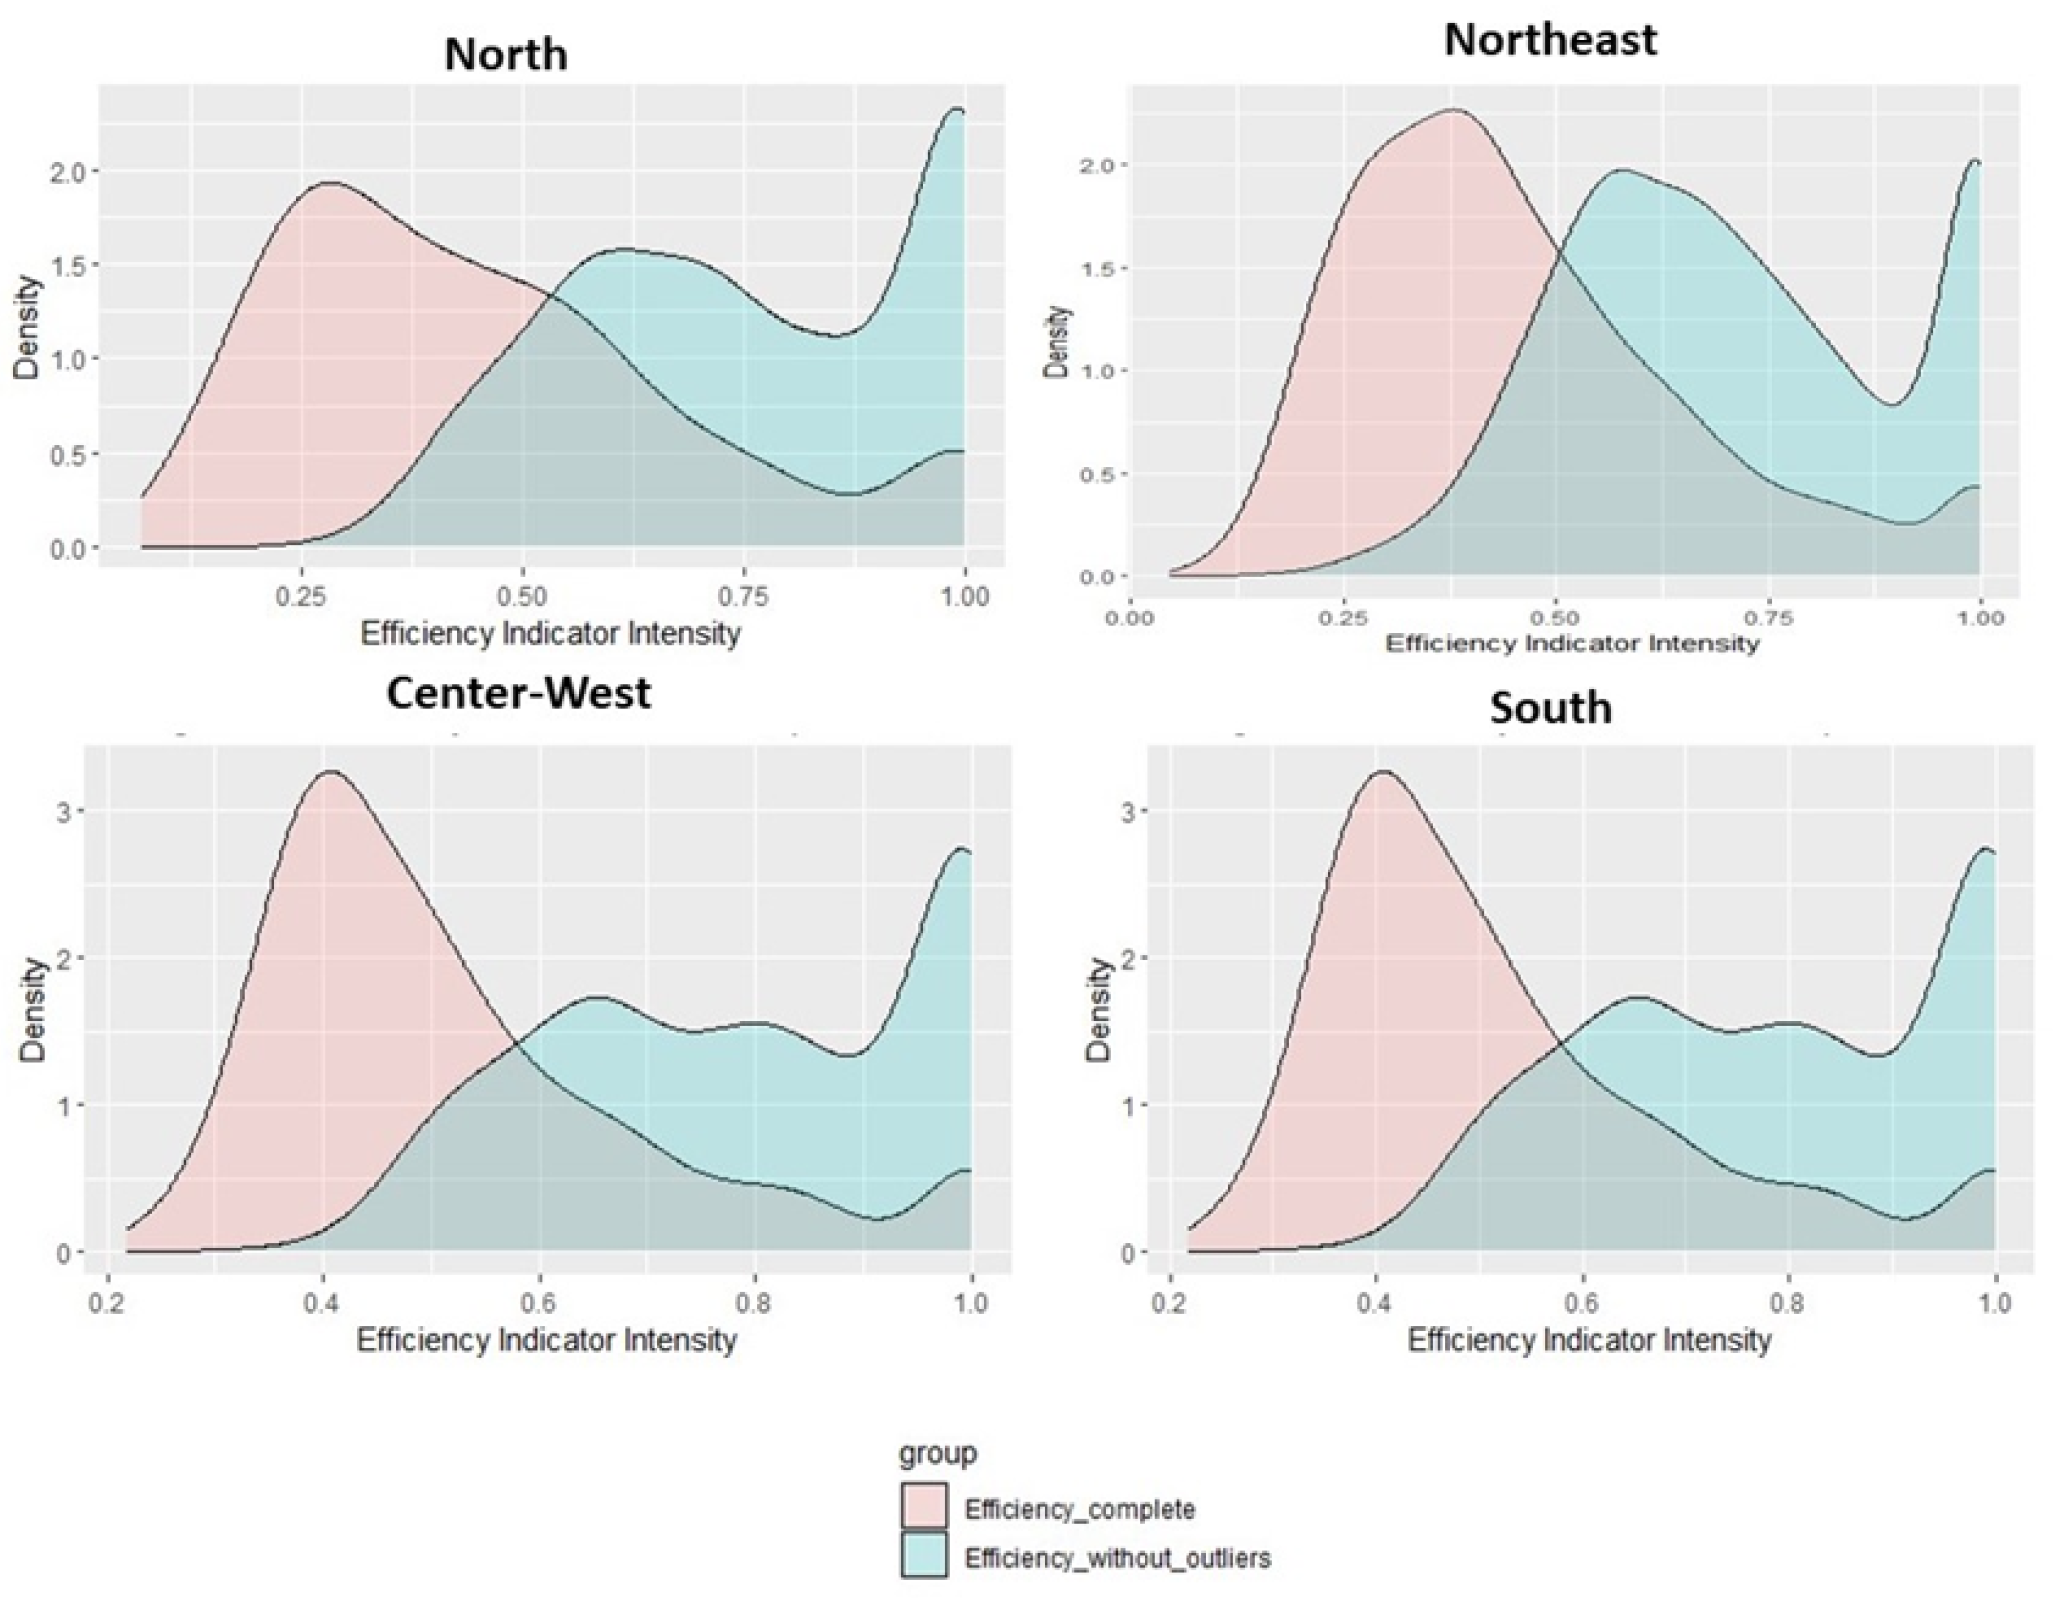
5.1. Removing the Outliers
5.2. Scale Return Test
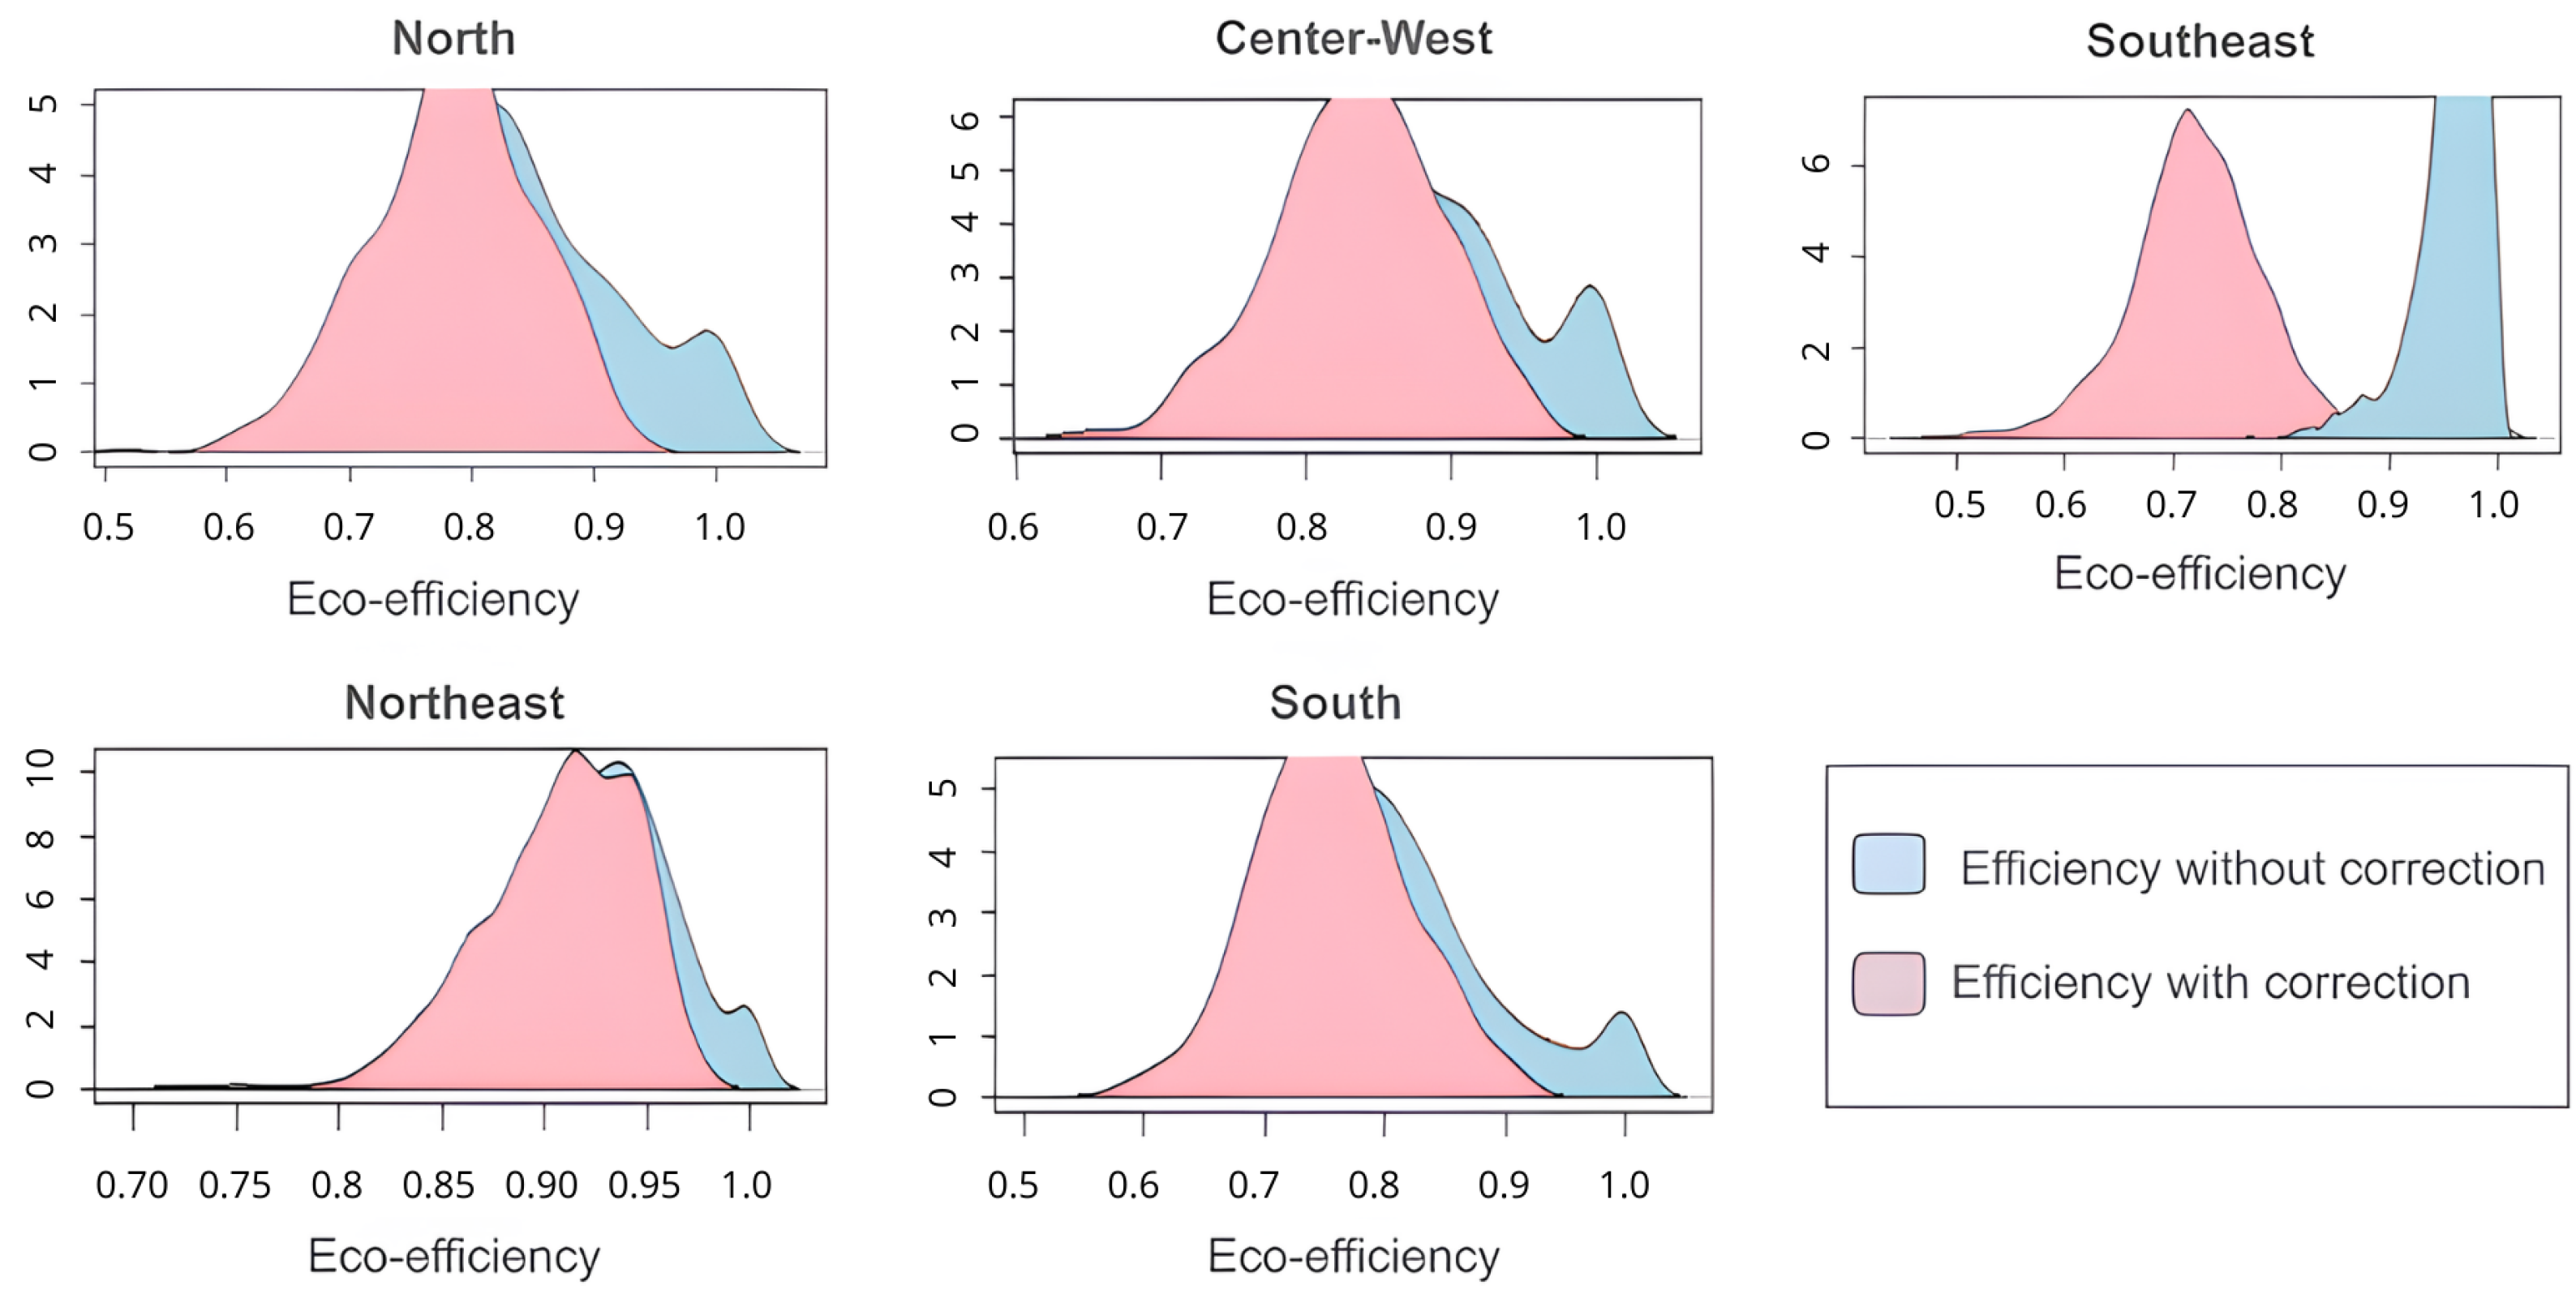
5.3. Statistical Inference of DEA Eco-Efficiency of Municipalities
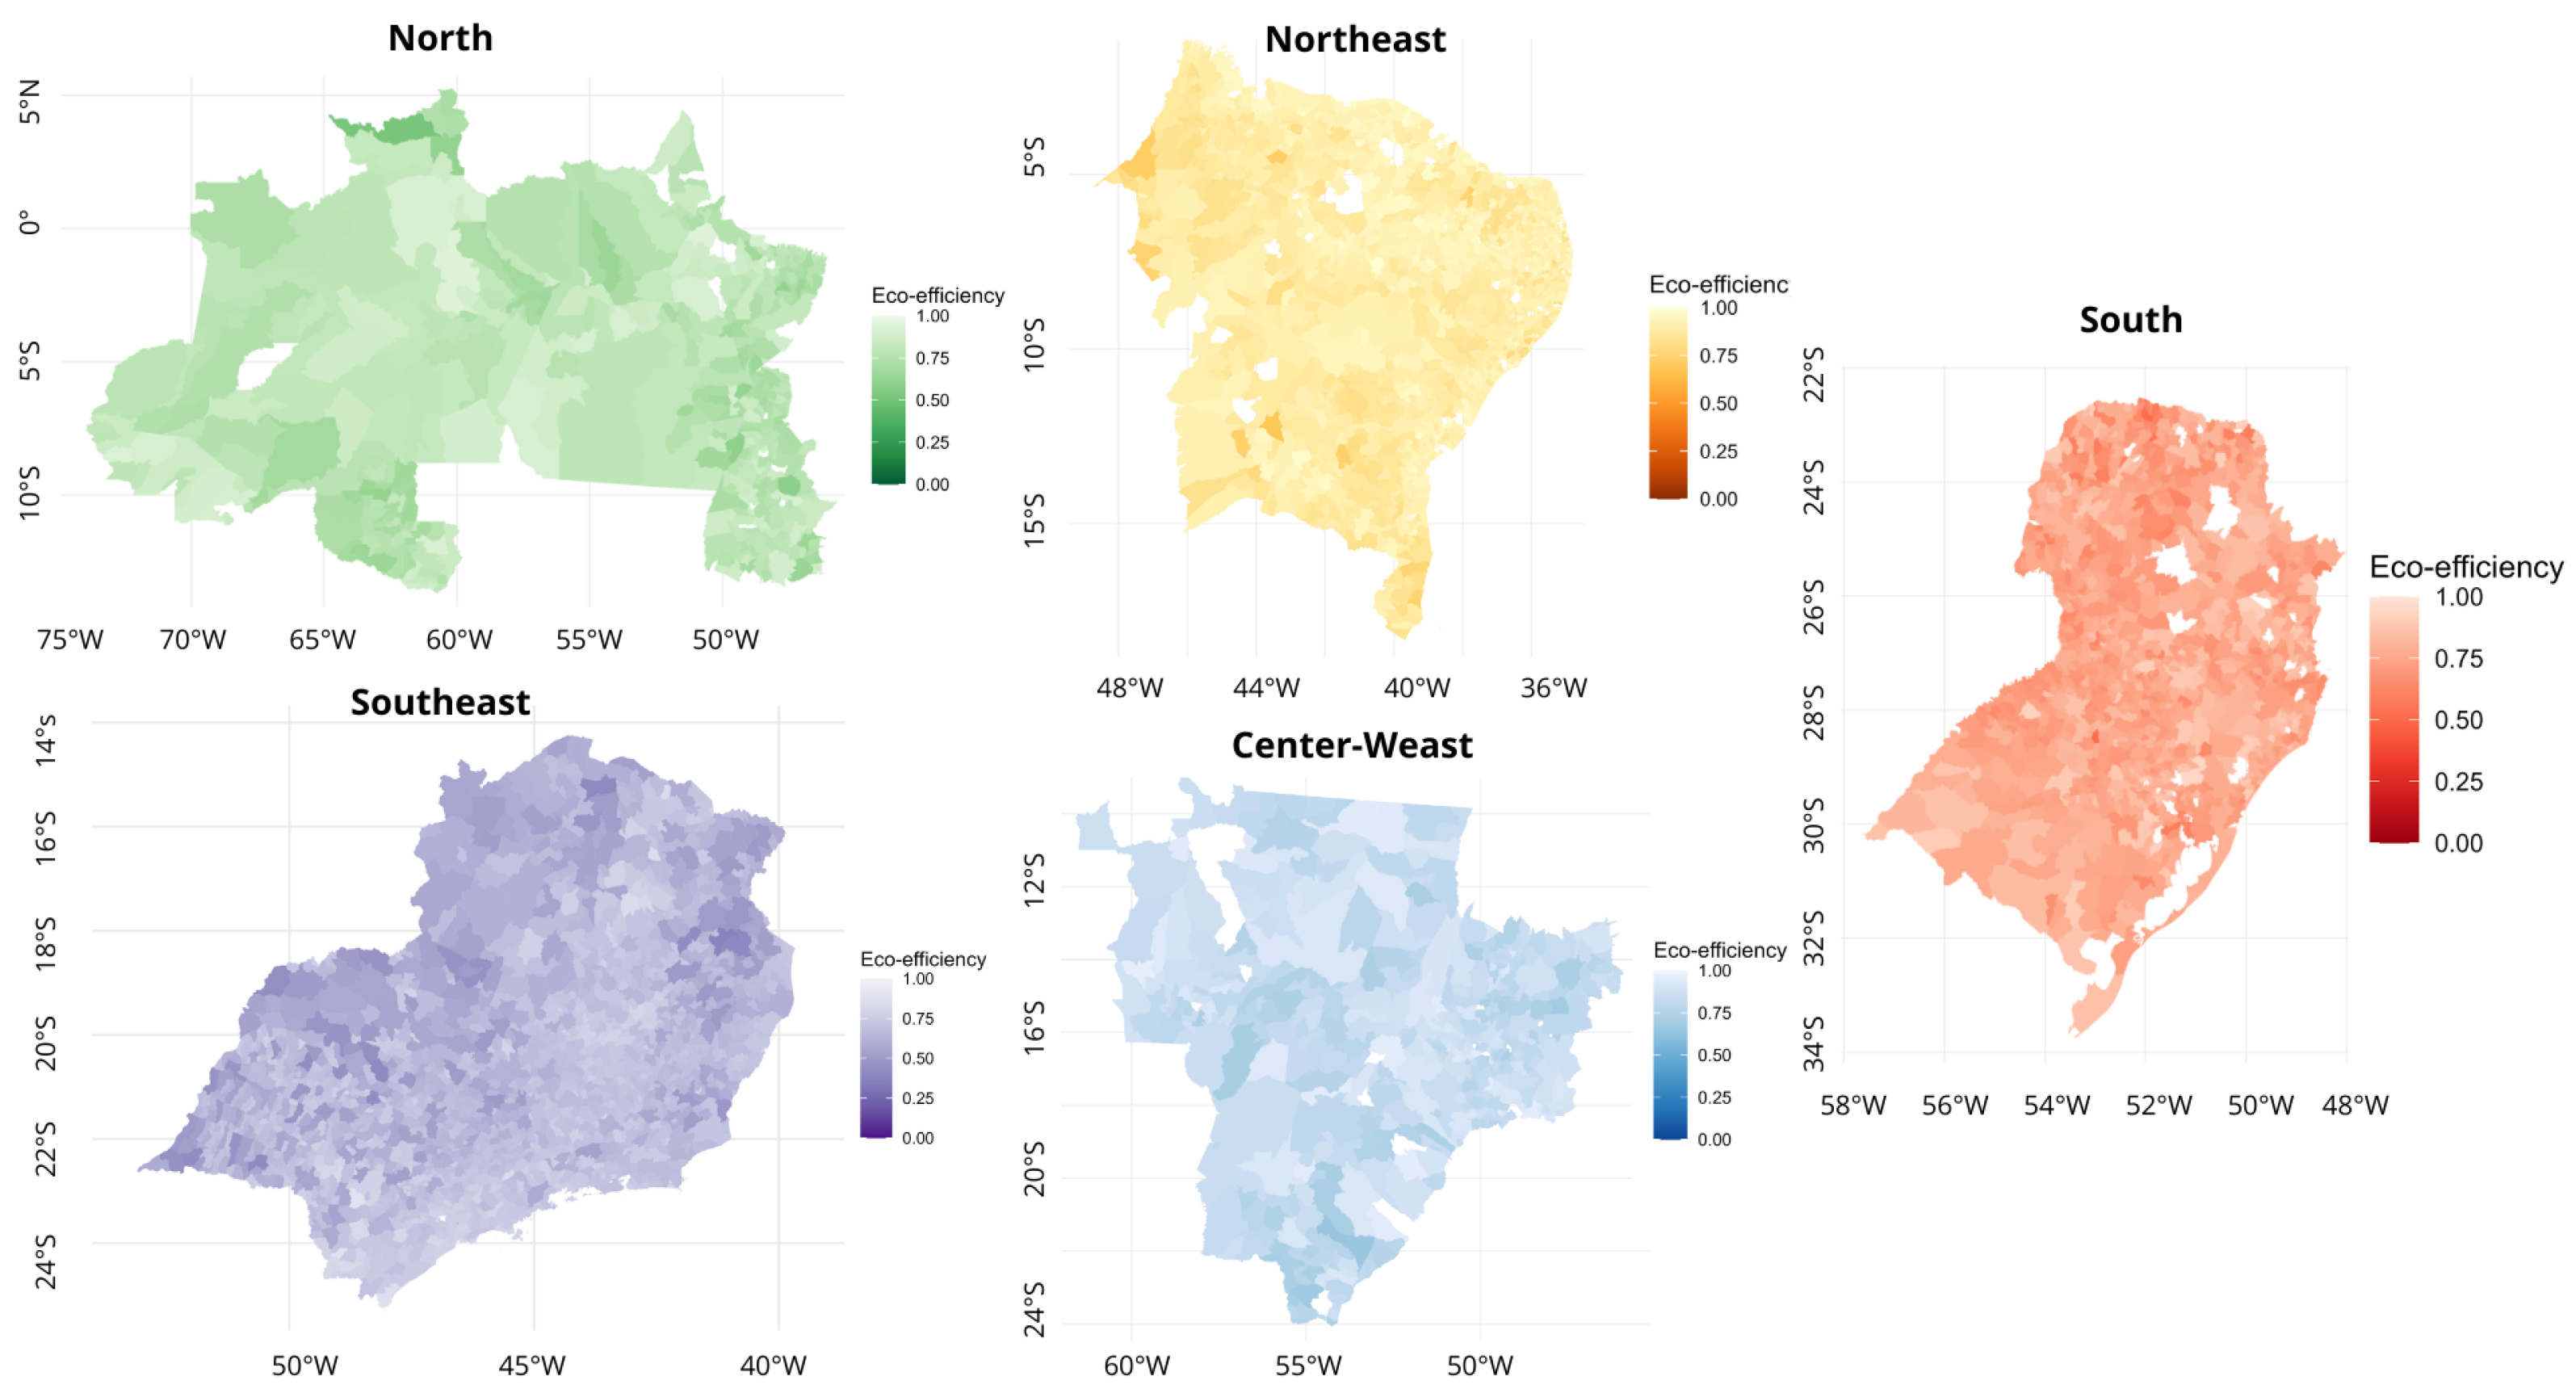
5.4. Geocoding of Eco-Efficiency Score Data in Brazilian Municipalities
6. Conclusions
Author Contributions
Funding
Data Availability Statement
Conflicts of Interest
References
- Brazilian Institute of Geography and Statistics. Agricultural Census 2017: Definitive Results, 2017. Available online: https://sidra.ibge.gov.br/pesquisa/censo-agropecuario/censo-agropecuario-2017/resultados-definitivos (accessed on 30 January 2023).
- Hamid, S.S.; Santos, M.A.S.D.; Aguiar, A.F.; Andreatta, T.; Costa, N.L.; Lopes, M.L.B.; Lourenço-Júnior, J.D.B. Changes and Factors Determining the Efficiency of Cattle Farming in the State of Pará, Brazilian Amazon. Sustainability 2023, 15, 10187. [Google Scholar] [CrossRef]
- Bobitan, N.; Dumitrescu, D.; Burca, V. Agriculture’s Efficiency in the Context of Sustainable Agriculture—A Benchmarking Analysis of Financial Performance with Data Envelopment Analysis and Malmquist Index. Sustainability 2023, 15, 12169. [Google Scholar] [CrossRef]
- Stepien, S.; Czyżewski, B.; Sapa, A.; Borychowski, M.; Poczta, W.; Poczta-Wajda, A. Eco-efficiency of small-scale farming in Poland and its institutional drivers. J. Clean. Prod. 2021, 279, 123721. [Google Scholar] [CrossRef]
- Matsumoto, K.; Chen, Y. Industrial eco-efficiency and its determinants in China: A two-stage approach. Ecol. Indic. 2021, 130, 108072. [Google Scholar] [CrossRef]
- Charnes, A.; Cooper, W.W.; Rhodes, E. Measuring the efficiency of decision making units. Eur. J. Oper. Res. 1978, 2, 429–444. [Google Scholar] [CrossRef]
- Banker, R.D.; Charnes, A.; Cooper, W.W. Some models for estimating technical and scale inefficiencies in data envelopment analysis. Manag. Sci. 1984, 30, 1078–1092. [Google Scholar] [CrossRef]
- Liu, X.; Guo, P.; Guo, S. Assessing the eco-efficiency of a circular economy system in China’s coal mining areas: Emergy and data envelopment analysis. J. Clean. Prod. 2019, 206, 1101–1109. [Google Scholar] [CrossRef]
- Shah, I.H.; Dong, L.; Park, H.-S. Tracking urban sustainability transition: An eco-efficiency analysis on eco-industrial development in Ulsan, Korea. J. Clean. Prod. 2020, 262, 121286. [Google Scholar] [CrossRef]
- Huang, J.X.; Yu, J.; Zhang, N. Composite eco-efficiency indicators for China based on data envelopment analysis. Ecol. Indic. 2019, 85, 674–697. [Google Scholar] [CrossRef]
- Yu, Y.; Peng, C.; Li, Y. Do neighboring prefectures matter in promoting eco-efficiency? Empirical evidence from China. Technol. Forecast. Soc. Chang. 2019, 144, 456–465. [Google Scholar] [CrossRef]
- Zhou, C.; Shi, C.; Wang, S.; Zhang, G. Estimation of eco-efficiency and its influencing factors in Guangdong province based on Super-SBM and panel regression models. Ecol. Indic. 2018, 86, 67–80. [Google Scholar] [CrossRef]
- Fan, Y.; Bai, B.; Qiao, Q.; Kang, P.; Zhang, Y.; Guo, J. Study on eco-efficiency of industrial parks in China based on data envelopment analysis. J. Environ. Manag. 2017, 192, 107–115. [Google Scholar] [CrossRef] [PubMed]
- Yu, S.; Liu, J.; Li, L. Evaluating provincial eco-efficiency in China: An improved network data envelopment analysis model with undesirable output. Environ. Sci. Pollut. Res. 2020, 27, 6886–6903. [Google Scholar] [CrossRef] [PubMed]
- Bianchi, M.; Del Valle, I.; Tapia, C. Measuring eco-efficiency in European regions: Evidence from a territorial perspective. J. Clean. Prod. 2020, 276, 123246. [Google Scholar] [CrossRef]
- Chen, Y.; Chen, Y.; Yin, G.; Liu, Y. Industrial eco-efficiency of resource-based cities in China: Spatial–temporal dynamics and associated factors. Environ. Sci. Pollut. Res. 2023, 30, 94436–94454. [Google Scholar] [CrossRef] [PubMed]
- Li, Y.; Liu, A.C.; Yu, Y.Y.; Zhang, Y.; Zhan, Y.; Lin, W.C. Bootstrapped DEA and clustering analysis of eco-Efficiency in China’s hotel industry. Sustainability 2022, 14, 2925. [Google Scholar] [CrossRef]
- Yu, Y.; Huang, J.; Luo, N. Can more environmental information disclosure lead to higher eco-efficiency? Evidence from China. Sustainability 2018, 10, 528. [Google Scholar] [CrossRef]
- Baráth, L.; Bakucs, Z.; Benedek, Z.; Fertő, I.; Nagy, Z.; Vígh, E.; Debrenti, E.; Fogarasi, J. Does participation in agri-environmental schemes increase eco-efficiency? Sci. Total. Environ. 2024, 906, 167518. [Google Scholar] [CrossRef] [PubMed]
- Molinos-Senante, M.; Maziotis, A.; Sala-Garrido, R.; Mocholí-Arce, M. Factors influencing eco-efficiency of municipal solid waste management in Chile: A double-bootstrap approach. Waste Manag. Res. 2023, 41, 457–466. [Google Scholar] [CrossRef] [PubMed]
- Peña, C.R.; Pensado-Leglise, M.D.R.; Serrano, A.L.M.; Bernal-Campos, A.A.; Hernández-Cayetano, M.; Staddon, P.L. Agricultural eco-efficiency and climate determinants: Application of dea with bootstrap methods in the tropical montane cloud forests of Puebla, Mexico. Sustain. Environ. 2022, 8, 2138852. [Google Scholar] [CrossRef]
- Penã, C.R.; Rosano, C.A.; Rodrigues, E.; Serrano, A.L.M. Spatial dependency of eco-efficiency of agriculture in São Paulo. Braz. Bus. Rev. 2020, 17, 328–343. [Google Scholar] [CrossRef]
- da Silva, J.V.B.; Rosano-Peña, C.; Martins, M.M.V.; Tavares, R.C.; da Silva, P.H.B. Eco-efficiency of agricultural production in the Brazilian Amazon: Determinant factors and spatial dependence. Rev. Econ. Sociol. Rural. 2021, 60, 250907. [Google Scholar] [CrossRef]
- Yang, L.; Ma, C.; Yang, Y.; Zhang, E.; Lv, H. Estimating the regional eco-efficiency in China based on bootstrapping by-production technologies. J. Clean. Prod. 2020, 243, 118550. [Google Scholar] [CrossRef]
- Farrell, M.J. The measurement of productive efficiency. J. R. Stat. Soc. 1957, 120, 253–281. [Google Scholar] [CrossRef]
- Shephard, R.W. The Theory of Cost and Production Function; Princeton University Press: Princeton, NJ, USA, 1970; p. 308. [Google Scholar]
- Peña, C.R.; Guarnieri, P.; Sobreiro, V.A.; Serrano, A.L.M.; Kimura, H. A measure of sustainability of Brazilian agribusiness using directional distance functions and data envelopment analysis. Int. J. Sustain. Dev. World Ecol. 2014, 21, 210–222. [Google Scholar] [CrossRef]
- Peña, C.R.; Serrano, A.L.M.; Britto, P.A.P.; Franco, V.R.; Guarnieri, P.; Karim, T. Environmental preservation costs and eco-efficiency in Amazonian agriculture: Application of hyperbolic distance functions. J. Clean. Prod. 2018, 197, 699–707. [Google Scholar] [CrossRef]
- Koopmans, T.C. Analysis of production as an efficient combination of activities. In Activity Analysis of Production and Allocation Proceedings of a Conference; Koopmans, T.C., Alchian, A., Dantizg, G.B., Georgescu-Roegen, N., Samuelson, P.A., Tucker, A.W., Eds.; John Wiley and Sons: New York, NY, USA, 1951; Volume 13, p. 33e97. [Google Scholar] [CrossRef]
- Beltrán-Esteve, M.; Gómez-Limón, J.A.; Picazo-Tadeo, A.J. Assessing the impact of agri-environmental schemes on the eco-efficiency of rain-fed agriculture. Span. J. Agric. Res. 2012, 10, 911–925. [Google Scholar] [CrossRef]
- Bogetoft, P.; Otto, L. Benchmarking with dea, sfa, and r; Springer Science & Business Media: Berlin/Heidelberg, Germany, 2011. [Google Scholar]
- Efron, B. Bootstrap methods: Another look at the jackknife. Ann. Stat. 1979, 7, 1–26. [Google Scholar] [CrossRef]
- Wilson, P. Detecting Influential Observations in Data Envelopment Analysis. J. Product. Anal. 1993, 6, 27–45. [Google Scholar] [CrossRef]
- Wilson, P. Detecting Influential Observations in Deterministic Non-Parametric Frontiers Models. J. Bus. Econ. Stat. 1995, 11, 319–323. [Google Scholar] [CrossRef]
- Stošić, B.D. Technical Efficiency of the Brazilian Municipalities: Correcting nonparametric frontier measurements for outliers. J. Product. Anal. 2005, 24, 157–181. [Google Scholar]
- Stošić, B.D. Jackstrapping DEA scores for robust efficiency measurement. An. XXV Encontro Bras. Econom. SBE 2003, 23, 1525–1540. [Google Scholar]
- Simar, L.; Wilson, P.W. Sensitivity analysis of efficiency scores: How to bootstrap in nonparametric frontier models. Manag. Sci. 1998, 44, 49–61. [Google Scholar] [CrossRef]
- Simar, L.; Wilson, P.W. Non-parametric tests of returns to scale. Eur. J. 2002, 139, 115–132. [Google Scholar] [CrossRef]
- Yang, L.; Ouyang, H.; Fang, K.; Ye, L.; Zhang, J. Evaluation of regional environmental efficiencies in China based on super-efficiency-DEA. Ecol. Indic. 2015, 51, 13–19. [Google Scholar] [CrossRef]
- Da Silva, G.S.E.; Gomes, E.G. A stochastic production frontier analysis of the Brazilian agriculture in the presence of an endogenous covariate. In Proceedings of the Operations Research and Enterprise Systems: 7th International Conference, ICORES 2018, Funchal, Madeira, Portugal, 24–26 January 2018; Revised Selected Papers 7. Springer International Publishing: Berlin/Heidelberg, Germany, 2019; pp. 3–14. [Google Scholar]
- Radlińska, K. Some Theoretical and Practical Aspects of Technical Efficiency—The Example of European Union Agriculture. Sustainability 2023, 15, 13509. [Google Scholar] [CrossRef]


| Variable | Average | Median | Dev.Pad | Maximum | Minimum |
|---|---|---|---|---|---|
| 63,147.55 | 24,480.80 | 138,808.71 | 4,810,916.30 | 0.001000 | |
| 4264.12 | 1476.00 | 17,276.88 | 1,107,997.00 | 0.042275 | |
| 51,104.04 | 18,329.00 | 109,730.62 | 1,740,972.06 | 34.035800 | |
| 2715.28 | 1768.00 | 2,944.54 | 48,246.00 | 0.001000 | |
| 3509.74 | 955.00 | 9881.26 | 251,959.00 | 0.001000 | |
| 88,650.06 | 41,829.00 | 172,537.12 | 3,258,836.00 | 0.001000 | |
| 18,222.27 | 4773.00 | 49,424.62 | 1,125,574.00 | 8.391978 | |
| 101,297.16 | 39,154.58 | 206,618.66 | 4,485,536.54 | 40.518500 | |
| 0.080088 | 0.074229 | 0.041666 | 1.000000 | 0.017115 |
| Region | Municipalities | Heaviside | K–S | Municipalities without Outliers |
|---|---|---|---|---|
| North | 450 | 17 | 13 | 433 |
| Northeast | 1794 | 61 | 21 | 1733 |
| Mid-Western | 467 | 23 | 10 | 444 |
| Southeast | 1662 | - | - | 1662 |
| South | 1191 | 42 | 21 | 1149 |
| Municipalities | Region | Without Outliers with Correction | 95% Confidence Interval | Without Outliers without Correction | |
|---|---|---|---|---|---|
| Maximun | Minimum | ||||
| Afuá (PA) | North | 0.9340 | 0.9953 | 0.9160 | 1.0000 |
| Presidente Fig. (AM) | North | 0.9336 | 0.9905 | 0.9130 | 0.9999 |
| Manaus (AM) | North | 0.9295 | 0.9898 | 0.8981 | 0.9999 |
| Porto Walter (AC) | North | 0.9195 | 0.9498 | 0.8938 | 0.8620 |
| Pimenta Bueno (RO) | North | 0.9150 | 0.9698 | 0.8895 | 0.8346 |
| Araripina (PE) | Northeast | 0.9818 | 0.9914 | 0.9739 | 0.7597 |
| Santo Estêvão (BA) | Northeast | 0.9814 | 0.9931 | 0.9715 | 0.9499 |
| Macaúbas (BA) | Northeast | 0.9806 | 0.9974 | 0.9728 | 0.9474 |
| Itapipoca (CE) | Northeast | 0.9792 | 0.9958 | 0.9697 | 0.9736 |
| Iguatu (CE) | Northeast | 0.9773 | 0.9893 | 0.9683 | 0.7265 |
| Nova Lacerda (MT) | Center-West | 0.9618 | 0.9947 | 0.9446 | 1.000 |
| Ribeirãozinho (MT) | Center-West | 0.9533 | 0.9947 | 0.9214 | 0.8420 |
| Inocência (MS) | Center-West | 0.9528 | 0.9952 | 0.9307 | 0.6985 |
| Turvânia (GO) | Center-West | 0.9520 | 0.9953 | 0.9304 | 0.8385 |
| Edealina (GO) | Center-West | 0.9519 | 0.9888 | 0.9188 | 0.7847 |
| Nova Campina (SP) | Southeast | 0.9004 | 0.9261 | 0.8780 | 0.6447 |
| Itatinga (SP) | Southeast | 0.8888 | 0.9539 | 0.8621 | 0.7763 |
| Cananéia (SP) | Southeast | 0.8656 | 0.9513 | 0.8467 | 0.6580 |
| Josenópolis (MG) | Southeast | 0.8502 | 0.9521 | 0.8321 | 0.7097 |
| Carbonita (MG) | Southeast | 0.8432 | 0.9732 | 0.8373 | 0.6688 |
| Caxias do Sul (RS) | South | 0.9400 | 0.9912 | 0.9094 | 0.8493 |
| Giruá (RS) | South | 0.9221 | 0.9663 | 0.8998 | 0.8099 |
| Barão do Tri. (RS) | South | 0.9174 | 0.9949 | 0.9119 | 0.7158 |
| Mafra (SC) | South | 0.9165 | 0.9755 | 0.8947 | 0.8988 |
| Congonhinhas (PR) | South | 0.9163 | 0.9935 | 0.8976 | 0.7499 |
| Municipalities | Region | Without Outliers with Correction | 95% Confidence Interval | Without Outliers without Correction | |
|---|---|---|---|---|---|
| Maximun | Minimum | ||||
| Aurora do Pará (PA) | North | 0.6182 | 0.6510 | 0.6056 | 0.9230 |
| Ariquemes (RO) | North | 0.6160 | 0.6855 | 0.6001 | 0.9643 |
| Conceição do A. (PA) | North | 0.5986 | 0.6481 | 0.5841 | 0.8317 |
| Rio Sono (TO) | North | 0.5962 | 0.6442 | 0.5796 | 0.8541 |
| Amajari (RR) | North | 0.5169 | 0.5786 | 0.4997 | 1.0000 |
| Mucugê (BA) | Northeast | 0.7354 | 0.7568 | 0.7259 | 0.9841 |
| Aldeias Altas (MA) | Northeast | 0.7214 | 0.7244 | 0.7179 | 0.9053 |
| Açailândia (MA) | Northeast | 0.7200 | 0.7573 | 0.7000 | 0.9223 |
| Itinga do Mar. (MA) | Northeast | 0.7164 | 0.7410 | 0.6944 | 0.9509 |
| Muquém do S.F (BA) | Northeast | 0.6867 | 0.7156 | 0.6704 | 0.8742 |
| Antônio João (MS) | Center-West | 0.7037 | 0.7345 | 0.6882 | 0.8650 |
| Planaltina (GO) | Center-West | 0.6836 | 0.7204 | 0.6660 | 0.8915 |
| Amambai (MS) | Center-West | 0.6758 | 0.6953 | 0.6581 | 0.8442 |
| Nova Andradina (MS) | Center-West | 0.6474 | 0.6676 | 0.6339 | 0.7609 |
| Nova A. do Sul (MS) | Center-West | 0.6447 | 0.6709 | 0.6244 | 0.8676 |
| Jaíba (MG) | Southeast | 0.4163 | 0.4764 | 0.4191 | 0.8162 |
| Morro Agudo (SP) | Southeast | 0.4139 | 0.4874 | 0.4218 | 0.6971 |
| Paraguaçu Paul. (SP) | Southeast | 0.4124 | 0.4679 | 0.4043 | 0.7646 |
| Ecoporanga (ES) | Southeast | 0.4105 | 0.4996 | 0.4345 | 0.8066 |
| Ataléia (MG) | Southeast | 0.3781 | 0.4490 | 0.3981 | 0.7420 |
| Eldorado do Sul (RS) | South | 0.5720 | 0.6321 | 0.5583 | 0.8259 |
| Santo Inácio (PR) | South | 0.5667 | 0.6041 | 0.5516 | 0.7305 |
| Iguaraçu (PR) | South | 0.5383 | 0.6088 | 0.5325 | 0.8105 |
| Colorado (PR) | South | 0.5130 | 0.5448 | 0.5016 | 0.7438 |
| Colorado (RS) | South | 0.5130 | 0.5448 | 0.5016 | 0.7530 |
| Descriptive Statistics | Region | ||||
|---|---|---|---|---|---|
| North | Northeast | Center-West | Southeast | South | |
| Mean with original outlier | 0.7343 | 0.8909 | 0.6408 | 0.9589 | 0.8393 |
| Mean without outlier without correction | 0.8355 | 0.9225 | 0.8742 | 0.7265 | 0.8000 |
| Mean without outliers with correction | 0.7839 | 0.9067 | 0.8348 | 0.6802 | 0.7526 |
| Median with original outlier | 0.7571 | 0.8912 | 0.6259 | 0.9661 | 0.8428 |
| Median without outlier without correction | 0.8250 | 0.9253 | 0.8649 | 0.7228 | 0.7894 |
| Median without outliers with correction | 0.7881 | 0.9125 | 0.8359 | 0.6915 | 0.7526 |
| Amplitude with original outlier | 0.2801 | 0.0650 | 0.2317 | 0.0309 | 0.1112 |
| Amplitude without outlier without correction | 0.0529 | 0.0380 | 0.0918 | 0.0753 | 0.1027 |
| Amplitude without outlier with correction | 0.0838 | 0.0532 | 0.0761 | 0.0829 | 0.0864 |
| Municipalities | Region | Without Outliers with Correction | 95% Confidence Interval | Without Outliers without Correction | |
|---|---|---|---|---|---|
| Maximun | Minimum | ||||
| Araripina (PE) | Northeast | 0.9818 | 0.9914 | 0.9739 | 0.9660 |
| Santo Estêvão (BA) | Northeast | 0.9814 | 0.9931 | 0.9715 | 0.9569 |
| Macaúbas (BA) | Northeast | 0.9806 | 0.9974 | 0.9728 | 0.9849 |
| Itapipoca (CE) | Northeast | 0.9792 | 0.9958 | 0.9697 | 0.9933 |
| Iguatu (CE) | Northeast | 0.9773 | 0.9893 | 0.9683 | 0.9703 |
| Nova Lacerda (MT) | Mid-West | 0.9618 | 0.9947 | 0.9446 | 0.9894 |
| Ribeirãozinho (MT) | Mid-West | 0.9533 | 0.9947 | 0.9214 | 0.8947 |
| Inocência (MS) | Mid-West | 0.9528 | 0.9952 | 0.9307 | 0.9087 |
| Turvânia (GO) | Mid-West | 0.9520 | 0.9953 | 0.9304 | 0.8886 |
| Edealina (GO) | Mid-West | 0.9519 | 0.9888 | 0.9188 | 0.8639 |
Disclaimer/Publisher’s Note: The statements, opinions and data contained in all publications are solely those of the individual author(s) and contributor(s) and not of MDPI and/or the editor(s). MDPI and/or the editor(s) disclaim responsibility for any injury to people or property resulting from any ideas, methods, instructions or products referred to in the content. |
© 2024 by the authors. Licensee MDPI, Basel, Switzerland. This article is an open access article distributed under the terms and conditions of the Creative Commons Attribution (CC BY) license (https://creativecommons.org/licenses/by/4.0/).
Share and Cite
Marques Serrano, A.L.; Saiki, G.M.; Rosano-Penã, C.; Rodrigues, G.A.P.; Albuquerque, R.d.O.; García Villalba, L.J. Bootstrap Method of Eco-Efficiency in the Brazilian Agricultural Industry. Systems 2024, 12, 136. https://doi.org/10.3390/systems12040136
Marques Serrano AL, Saiki GM, Rosano-Penã C, Rodrigues GAP, Albuquerque RdO, García Villalba LJ. Bootstrap Method of Eco-Efficiency in the Brazilian Agricultural Industry. Systems. 2024; 12(4):136. https://doi.org/10.3390/systems12040136
Chicago/Turabian StyleMarques Serrano, André Luiz, Gabriela Mayumi Saiki, Carlos Rosano-Penã, Gabriel Arquelau Pimenta Rodrigues, Robson de Oliveira Albuquerque, and Luis Javier García Villalba. 2024. "Bootstrap Method of Eco-Efficiency in the Brazilian Agricultural Industry" Systems 12, no. 4: 136. https://doi.org/10.3390/systems12040136
APA StyleMarques Serrano, A. L., Saiki, G. M., Rosano-Penã, C., Rodrigues, G. A. P., Albuquerque, R. d. O., & García Villalba, L. J. (2024). Bootstrap Method of Eco-Efficiency in the Brazilian Agricultural Industry. Systems, 12(4), 136. https://doi.org/10.3390/systems12040136