Article

The Impact of a Skill-Driven Model on Scrum Teams in Software Projects: A Catalyst for Digital Transformation

1
Department of Computing and Games, Teesside University, Middlesbrough TS1 3BX, UK
2
Department of Mathematics and Statistics, University of Agriculture Faisalabad, Faisalabad 38000, Pakistan
3
School of Business and Management, Queen Marry University London, London E1 4NS, UK
*
Author to whom correspondence should be addressed.
Systems 2024, 12(5), 149; https://doi.org/10.3390/systems12050149
Submission received: 9 March 2024 / Revised: 20 April 2024 / Accepted: 24 April 2024 / Published: 26 April 2024
(This article belongs to the Special Issue Strategic Management in Digital Transformation Era)

Abstract

:
Human skills are a critical factor in the success or failure of a digital project. Limited studies have been conducted to identify the industry demand for skills of scrum roles (product owner, scrum master, web developer) and levels (entry, associate, mid-senior). The evaluation of skills over time benefits both decision-makers and associated team members, which leads to successful project completions. The aim of this research is to improve decision making concerning the level-specific skills of selected scrum roles for digital projects. The study identifies major and minor skills, patterns, and relationships between levels, and formulates the mathematical equations as the most important inputs to the skill-driven model’s implementation and evaluation. Both qualitative and quantitative research methods were used to analyse 900 surveyed job advertisements published on LinkedIn in Europe. Descriptive analysis was used to analyse quantitative data while the deductive approach was followed with thematic analysis. There are required skill sets for each level of roles, level-specific skills, industry-demanded skills, and formulas related to the initial and individual skill ratings that are investigated. A new mechanism for evaluation is introduced based on “the time spent with skills”. As a result, the proposed model is implemented by feeding research findings into the Mendix programming platform. The skill-driven model is a decision-support solution in software project management to evaluate skills which assist in assigning the right person to the right digital project. Further investigation on different job portals can help to improve the accuracy of industry standards and reduce the lack of progression skills by overcoming limitations identified in this paper.

1. Introduction

IT projects are differentiated from other engineering projects by difficulty levels of higher complexity and ability in project failures [1]. The iron triangle is used to assess the project performance based on time, cost, and quality. The third vertex, quality, is mostly used in information systems for new concepts consisting of decision making and support [2]. According to the study in [3], the most referenced object in project success factors is “team members”. The study in [4] highlighted the importance of strong human resources as an essential factor in on-time and successful project completion. Therefore, the awareness and understanding of the skills of team members aid in decision making. A skill-driven working model team can serve as a catalyst for digital transformation by embracing an agile mindset [5], cross-functional collaboration [6], problem solving skills [7], and continuous learning and adaptation [8]. By cultivating such a skill-driven model and attributes within scrum teams, organisations can leverage their digital transformation efforts effectively, driving innovation, agility, and competitiveness in today’s fast-paced digital economy.
The question “Who knows what?” is challenging to decision-makers when it is time to allocate resources to a project in hand. There should be enough information to decide where decision making is an essential element in project management. Also, project managers avoid or postpone making decisions until there is enough information to minimise the decision regret [9]. The project success rate is increased when the project characteristics are used in managing and forming teams accordingly [4]. Moreover, Ref. [10] mentioned that assigning the right person for the job enhances performance and job satisfaction. Finding the best-fit skills is important in successful project completion.
Minimal knowledge and understanding of the project team’s capabilities based on industry experiences lead to software project failures. A skilled team as a whole is required to fulfil all project tasks [11]. A development team consists of many people who have vast enterprise knowledge and experience [12]. To develop a project, company staff are required to have essential skills, knowledge, and experience [13]. The skills and competencies of a project member are considered a project risk factor [14]. Lack of skills or knowledge of team members is identified as a factor in a project [15]. There is importance in studying the skills and skill levels of the team members to answer the question “Who knows what?”, which masks the research problem.

1.1. Trends in Scrum Teams

Agile software development and methods dominate within a variety of industries and scientific communities on a global scale [16]. Furthermore, the scrum methodology is still leading in the industry, and it increased to 87% in a recent survey, while 80% of companies use agile software development as the main approach [17]. A previous study discussed the suitability of agile methodologies for project management and software development projects in digital transformation. It presented the successful case of scrum in public administration in digital transformation in the city of Barcelona [18]. Many research articles have mentioned that scrum is widely used in the IT and software development industry. The required skills and expertise of the team are considered an impact factor in successful projects that use scrum [19]. Team capability was identified as an important factor for agile project success [20]. A small scrum team was formed with three scrum roles, which are explained more in Section 2.

1.2. Interest in LinkedIn Data

According to the literature, the industry’s demand for skills impacts employee development, to update university programs, and employers focus on trends to update technology and to train their staff [21]. More than nine studies were detected from the last 10 years which extracted data from job advertisements to investigate the industry demand.
LinkedIn is the most used professional network for job searching. Also, there are over 675 million users and it provides millions of job opportunities [22]. Lappas [23] revealed that there were over 180,000 different job titles in their dataset related to information technology (IT) employees on LinkedIn. It is identified as the most frequently used platform in terms of building professional networks. Also, job portals were considered as another category to generate labour market data which only focuses on publishing job posts, and according to the results, job portals remain a popular category [21]. Furthermore, another survey highlighted that the impact of LinkedIn on businesses will increase in 2024 [24]. Therefore, the current survey uses LinkedIn as the only job board from which to collect job description data.

1.3. Aim of the Study

The research aim is to improve the decision-making process of project team members in terms of their job roles and levels. The influence of this phenomenon is based on individual and contextual factors such as salary, work experience, and level of team expertise. Therefore, the study considered existing models and developed a skill-driven model on decision making about job roles in software project management (SPM) to answer “Who knows what?” effectively.

1.4. Research Question (RQ) and Objectives

The research motivation originated from the researchers’ previous work experience in the IT industry. The other reasons behind the woek are identifying career development, the professional well-being of employees, obtaining a better understanding of scrum teams, and adding value to the SPM subject area, especially in the era of digital transformation.
There are 22 studies related to skills analytics that were found in the literature, which explore skill gaps, skill mismatch, and industry demand issues. However, the least studied areas were the first two [21]. Furthermore, investigations of soft skills on digital projects and developing a skill evaluation tool and test to investigate the career paths of software developers existed [3,25]. By considering the aim, motivation, and identified gaps, the authors formed the following question for this study.
RQ: How does the major and minor skills-driven model aid in evaluating and improving decision making about the scrum team in software projects?
Objective 1: To filter major and minor skills by collecting appropriate data from job vacancies.
Objective 2: To identify patterns and relationships of team roles by analysing collected data.
Objective 3: To formulate mathematical equations for roles based on identified variables.
Objective 4: To implement a skill-based continuous evaluation model.
Objective 5: To critically evaluate the proposed model with existing techniques/models.
The overall intention of this study is to achieve all five objectives to answer the research question. This study examines the impact of the skill-driven model in scrum teams for software projects concerning skills, skill levels, salaries, and experiences. Overall, the paper describes the way of achieving the mentioned objectives to answer the research question.
The remainder of the paper is organised as follows: Section 2 presents related work in the current context of the study. Section 3 describes the research method with survey strategy, data generation method, and qualitative and quantitative analysis. Section 4 represents the results and discussion of the summarised results, along with the limitations of the study. Finally, Section 5 concludes the study by suggesting future research.

2. Related Work

The related work specific to decision making in software projects is described in this section, as illustrated in Figure 1. Initially, overall decision making in SPM with existing decision-making models is presented. Next, we examine the literature regarding the impact factors of poor decision making. The literature search was continued to extract the factors that could be controlled externally. The skill resource factor was explored further to reveal existing studies in skills evaluation. The limited availability of skill evaluation to assist decision making was discovered, as no studies have focused on skills related to role-based levels.
The scrum framework includes a small-sized team, representing the scrum fundamental unit, and generally, it is 10 or fewer, with scrum roles, such as product owner, scrum master, and developers, that define the scrum team. Members of the scrum team have all the necessary skills to complete a sprint, named a cross-functional [26]. Also, survey results indicate the same three scrum roles [19]. Furthermore, the most effective agile team composition is between three and nine members [27]. Therefore, the authors formed a small scrum team with three members, including the product owner, the scrum master, and the developer. Each scrum role has specific accountabilities. The scrum master establishes the scrum by following the scrum guide. Also, they support the understanding of scrum theory and practices for all members, both within the scrum team and the organisation. The product owner maximises the product outcomes from the team by handling product backlog management. The developers are required to have domain-specific skills to achieve project tasks in a sprint [26].
The web developer role has been chosen as the developer role along with the other two main scrum roles. There are no specific roles for specific activities such as designing and testing in the scrum development team. Also, team members work cross-functionally and equally on each task: designing, development, and testing. Furthermore, scrum is well known among web application developers [28]. The study only considered three levels due to the limited time and the data availability. According to a study, the highest job post values were identified as 57%, 21%, and 20% for associate, entry, and mid-senior, respectively, in LinkedIn for human resource roles [29]. Another study [30] highlighted LinkedIn experience levels, but it considered three levels: entry, mid-level, and top-level (director and executive). In this study, fewer job posts were available for internship, director, and executive categories. Therefore, entry, associate, and mid-senior levels were considered in this study.
Many applications have been developed to improve the decision-making process in different industries to achieve various objectives. For instance, an application was implemented as a decision-support solution for all kinds of users who are involved in e-learning systems in the education field to evaluate and select the appropriate website [31]. Moreover, the study in [32] introduced a decision model that supports the selection of technology/programming language for software projects and other decision-making problems faced by software engineers. As a result, the cost and time of the decision-making process were reduced by using the decision model, which generates decisions more effectively and efficiently to achieve the goals of the software engineers. Also, there are decision-support applications for patient education, medical research, diagnostics, medical treatment, and wellness care that have been developed by using artificial intelligence (AI) in the healthcare industry. These AI applications facilitate the completion of a wide range of activities without human inputs and interactions. For example, a case study of AI adaptation in the healthcare sector in South Korea provides AI assumptions about patients and diseases with measurements of decision weight [33].

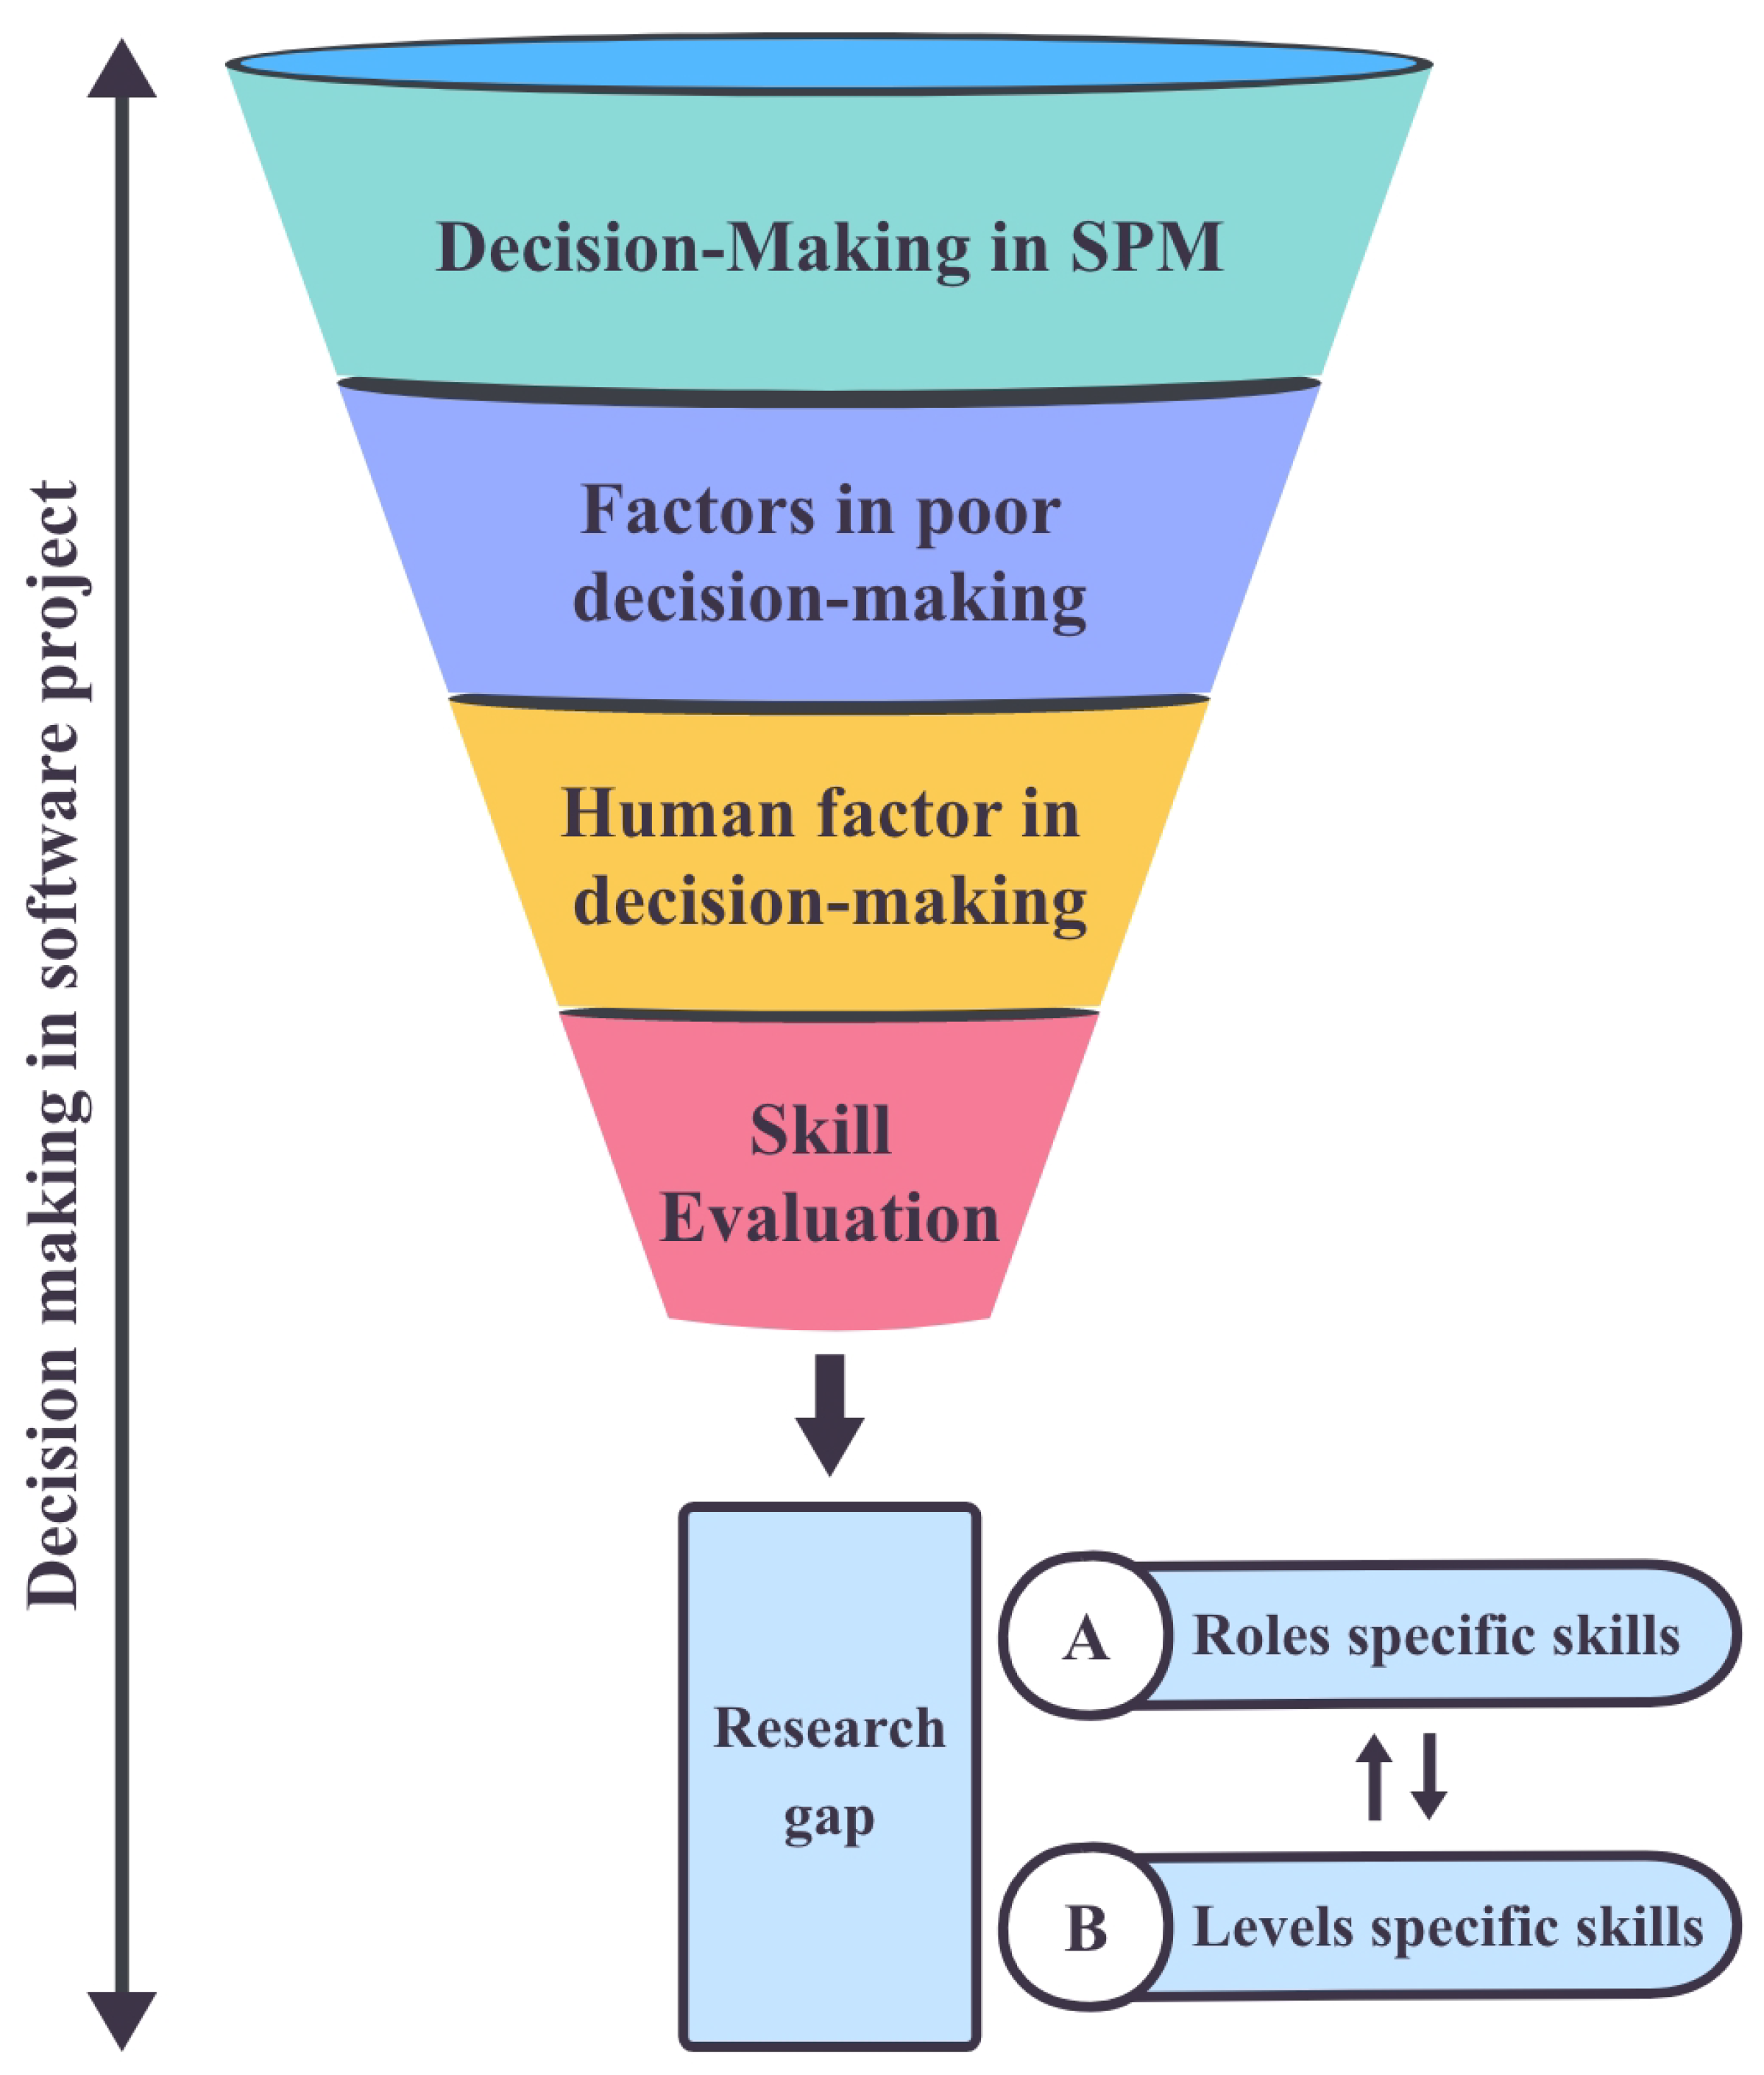
2.1. Decision Making in SPM

Decision making in SPM is defined as a list of complex tasks which involve human interaction, knowledge, and cultural background. Also, decision making is an essential element in project management [9]. Decision making is a process of investigation and comparison of alternatives to observe the best option according to specific criteria [34]. According to Sadabadi and Kama [35], the ability to make decisions is the way of defining SPM. Therefore, software project management has a very strong tie with decision making.
Other than theories, several tools are available in SPM for tracking project issues, time planning, collaborative environments, and team management; these positively impact project success, although decision-makers have very limited tools and techniques in SPM for project planning and analysis. As a result, a study proposed a rule-based decision-support system (DSS) to select a programming language that consists of a count of team members as a parameter, but team technical knowledge was not counted [36]. Similarly, the study in [32] proposed a decision model from an empirical study for selecting the best-fit programming language/technology, which is an identical problem in the early phase of software development. However, the study only focuses on the programming language features and software quality attributes. In the decision model, only the project requirement point of view is considered to select the appropriate programming language. In contrast, the experience in technology and the programmer’s availability were not considered in developing the decision model; these were identified as lessons learned that did not directly impact language selection.
A problem with selecting tools in SPM exists related to the multi-criteria decision-making (MCDM) problem, and a few studies have tried to address this problem by proposing frameworks such as product lifecycle management software based on project management body of knowledge (PMBOK) knowledge areas and decision frameworks. The PML model included a human resource knowledge area for SPM tool selection while considering most of the human resources criteria, for instance, task scheduling, resource management, time tracking, and estimation under functionality features [37,38].

2.2. Factors in Poor Decision Making

Making poor decisions negatively impacts the SPM process. According to the Project Management Institute (PMI), 47% of projects were unsuccessful due to errors in decision making [39]. The paper indicates that there is a possibility of project failures or delays due to some set of poor decisions and unexpected situations happening when making very challenging decisions on complex projects in the international environment [9]. Sadabadi and Kama [35] stated that decision making is included as a critical function to manage effectively in SPM. As a result, effective decision making is a critical factor that directs a project to success.
Individual and situational factors cause poor project decisions. The individual factors related to decision-makers are experience, skills, and abilities such as communication, knowledge, negotiation, personality, and interpersonal and organisational skills. The technical competence of team members is considered an important situational factor. Software project managers influence more, rather than sharing decisions, when the team has limited technical knowledge [9]. This provides clear evidence for the need to evaluate the team’s technical knowledge. Another source also explained software project failures due to limited skills, experience, tools, and techniques in SPM. Specifically, less productivity leads to project delays, which are a key factor in software project failure and a challenge for software project managers during development. The study is mainly focused on decisions based on SPM tool selection for the overall project rather than team individual improvements [38]. Individual factors of decision-makers depend on their abilities. But the team commitment can be improved if the team is involved in decision making, along with having a more mature team to improve competency [9].

2.3. The Human Factor in Decision Making

Skilled resources are ranked as a project success factor in the top 10 success factors by including the importance of project requirement execution and delivery [40]. Also, competent, qualified, and experienced team roles contribute to projects their expertise, and the capability of project teams is considered a critical success factor [41]. There was a challenge in predicting the required skilled people due to emerging technology and knowledge in an early study as well [42]. Moreover, some other research focused on the same factors required for digital transformation in certain industries along with employers’ perceptions [43].
Team commitment to the project is one of the most important factors which defines the success of the project. In the literature, it was identified as a critical factor in achieving team goals effectively to make a successful team [9]. The decision-making process is continuous when considering the software development industry and it mainly depends on the experience and knowledge of software engineers [32]. In addition, there is a problem in matching the right job opportunity to the right employee in software development due to management decisions [4]. Therefore, making the right decision at the right time is more important when managing a project team appropriately.
A recent study observed that “team members” is the most referenced term in the literature for IT project success factors. Several papers discussed the skills of team members in different approaches but highlighted that the project team is formed with members who have the required skills, skill levels, knowledge, experience, and qualifications [12,13,44]. In general, skilled staff not only represent skilled members but also represent the knowledge to perform all sets of project tasks [11]. Therefore, the skill evaluation of everyone is supported to achieve overall project goals and objectives.

2.4. Skill Evaluation

Several studies were conducted to extract job titles or skills [21,23,45]. However, the focus of those studies was specific to one factor rather than both. A combination of both factors seems to be understudied because there is not a straightforward path to skill evaluation. Table 1 describes the availability of specific skill-related factors in other studies.
There was inaccuracy in the self-evaluation of skills that did not match industry expectations and underestimation or overestimation when evaluating using self-rating. In addition, the research was based on a skill matrix for skill ratings on a 1–5 scale. It includes both perspectives from the employee and employer regarding the same set of skills. However, the results do not match each other [46]. There is another study that uses a skill map to calculate skill rankings from frequencies of crucial skills [47]. Also, the skill evaluation tool is introduced based on the 1–5 point rating scale for the future work skill profile for software engineer and developer skills, without considering the role or level [25]. Therefore, self-evaluation should not be used as a practical method in decision making.
Real-world data provides industry demand and accurate data. New sources of online data are currently focused on the Office of National Statistics (ONS) [48]. Few studies were found that used real-world data to analyse skills in the software industry by using online job boards. A qualitative study specifically investigated the soft skills in software engineering by using data from the largest job board in New Zealand and the study found 17 soft skills in the software industry [49]. Nevertheless, team roles and levels were not considered in the analysis.
In 2020, Lappas [23] identified the most popular problem of identifying and characterising IT workforce prototype career paths by analysing LinkedIn profiles. The study tackled job role title diversity as one of the identified challenges. As a result, 13 types of job roles were identified from the dataset and two algorithms were used for identifying career paths. In contrast, the study was focused on categorising work groups according to the key terms and titles (e.g., SWE work group consists of a software architect, system engineer, lead software engineer, etc.) rather than experience levels and types of skills.
In the literature, few studies are related to specific roles and skills analysis to understand industry demands. According to Ref. [48], specific data were extracted from job advertisements such as job title, skills, salary, company name, etc. They created a node connection map for skills which appear together in advertisements but did not consider specific roles. Therefore, further development of an evaluation based on roles would be difficult.
There is a study that identified the soft and technical skills of data science roles by using job adverts. The research did not focus on experience levels of job roles when identifying skills and left a void for further analysis [50]. As well as that, another study for data scientist roles’ skills was analysed using the text analysis method without considering experience-level-specific skills and skill evaluation [51].
According to Ref. [52], the SRDQN model recommends skills based on the salary mentioned in the job post. Therefore, skills and salary should have a strong relationship in each job post. There is another study that used inputs from one stage to the next stage by evaluation to find skills mismatches. They introduced a digitalisation capability evaluation system (DCES) as the target was digital skills for digitalisation [54]. Skills in demand and skills of existing and potential employees have a mismatch. If both employer and employee recognise the skills of each level of a given role and try to improve the identified skills, this may lead to minimising the skills mismatch [48].
One of the best skill management models based on expertise was developed to measure expertise in the skills of employees. A set of complex parameters was used to calculate the expertise. The study used a post-model development survey to obtain feedback from stakeholders [53]. However, to be an expert in a skill or knowledge, it should be gained by training or experience. Expertise is defined as skill or knowledge possessed by an expert in the subject matter. Furthermore, the identification of the skills and measurements is beneficial for better future performance [55]. Put simply, experience is the time spent with knowledge in empiricism, which is the foundation of scrum [26]. Being complex and using some parameters that cannot be justified for the purpose give an opportunity to dive deep into a simpler model.

2.5. Areas to Research

Software project scheduling problems are associated with minimising a project’s cost and time [56,57]. The project scheduling problem has been formulated in team skill development over time as a new project property [58].
Iriarte and Bayona [3] suggested future work to implement a model to investigate the influence of “which and how” soft skills on IT projects. They further described how it would support selecting a best-fit skilled team that aligns with the context and nature of the project. Even though the study focuses on soft skills, the overall outlook suggests there is a necessity for further study.
The systematic review in [21] identified specific gaps related to IT skills and most of them addressed skills in the demand category. Also, limited studies have been conducted on skills gaps and skills mismatches. A similar result was observed in the literature search. Therefore, there is further evidence for the remaining research gap. In addition, “expert detection”, along with “skill analytics”, were suggested as important facts of the hiring process because it is expected that digital sources such as job portals will be explored to find industry standards for the analysis. It should be noted that the matching of industry standards for skill expertise with organisational requirements would be beneficial for internal people management.
One of the studies suggests that further research is required on the collected data to implement and test the skill evaluation tool for improving the career paths of software engineers and developers [25]. Therefore, the requirement of skill evaluation for specific roles is mentioned as a research gap. Apart from that, individual skills and conflicts between skills cannot be retrieved from a project manager as they are not optimised properly [59]. This leads to difficulties in decision making and overall project planning.
According to another study [56], knowledge gathered from education and training combined with one’s own talents and abilities initially defines a skill level, and then, the experiences added with time continuously improve the skill level. This suggests that there is a relationship between experience and level of skills. This makes a void for further studying the relationship between skill and experience.
A recent study has identified that a limited number of responses was a limitation in finding role-specific data. It proposed to investigate scrum role-based characteristics by using a large dataset as future work [19]. To gather a considerably large dataset, this research was designed to collect data from LinkedIn.
As a summary of the literature review, the section suggests that there is a significant area to research on role-based levels and evaluation of their corresponding skills over time. This will allow researchers to reveal the relationships and draw mathematical connections between them.

3. Materials and Methods

This research used both qualitative and quantitative data, which is identified as a mixed method in the literature [60]. The Agile System Development Life Cycle (SDLC) was followed as the research process model, as shown in Figure 2. Initially, the datasets of web developers were analysed, and later, the same methodology was followed for the other two roles. Research processes are not straightforward in practical scenarios, as discussed in the literature. Furthermore, this is a flexible methodology that provides an opportunity to work on backward and forward phases [61]. For example, the application development was performed iteratively as it used analysed data such as mean, average, majors, minors, etc. Therefore, the overall process was treated as an iterative process.

3.1. Literature Search Process

The literature review was conducted to identify the current state of the context and gaps related to the research topic. The authors have followed the systematic mapping study (SMS) to filter out most related resources using the following steps [62]:
  • Define the search keywords using the research topic;
  • Select databases/search engines and create search expressions;
  • Define inclusion and exclusion criteria;
  • Select the most related research papers.
The keywords and synonyms derived from the research topic are as per Table 2. In step 2, five popular academic databases were selected: Scopus, ACM Digital Library, IEEE Explorer, Science Direct, and Business Source Ultimate and Emerald Insight [63]. The search query was slightly different from database to database based on the features of the search engine. As mentioned in Section 2, background knowledge and gaps were identified by following the above steps.
The same methodology was used to select the papers which included the SPSP (Software Project Scheduling Problem) solutions [57]. A study in [21] followed the same search strategy with a few additional steps such as applying the inclusion and exclusion criteria to the reference list of papers and revisiting the excluded articles due to too many exclusions. To maintain the best practice, the author only considered the papers published in the last 10 years. In addition, the literature search was continued in another approach to identify the themes of selected scrum role skills under the technical and soft categories, as described in data analysis.

3.2. Research Methods

A survey was selected to answer the research question as an overall approach. Also, documents were selected as the data generation method. Theoretically, one research strategy can have more than one data generation method. Also, it provides different viewpoints about the phenomenon and increases the quality of the research [61]. However, the research only considered one data generation method due to the scope of the study.
Job advertisements were considered as documents of data collection. In the literature, it is mentioned that “found documents” existed before the research and digital documents are also considered sources of document-based data under publication categories such as the academic literature, media articles, blog posts, social media posts, etc. Also, document-based research can be applied to any type of research strategy [61]. Therefore, surveying using publicly available online job posts on LinkedIn is possible in academic research.

3.3. Data Collection

There are some job standardisation models on LinkedIn which relate to job postings to recognise professional entities, a feature for suggesting skill sets to the recruiter who posts the job by following the entity-tagging and entity-ranking processes. The right person with the right skill sets will interact with the specific job post [22]. According to the deep understanding of the LinkedIn job posting flow, it was used to filter the jobs with profile skills. Therefore, a new profile was created with minimum content to eliminate the filtering bias of an existing account.
Data were collected within the last quarter of 2023, from LinkedIn into a spreadsheet. The job posts were searched for two types of methodologies in the literature. On the one hand, keyword searches to find related job posts were mentioned in two studies. The keywords found in the literature were used to conduct the automatic search in the T-Net portal [64], while the other research used four keywords derived from work experiences based on the authors and descriptions of the role [65]. On the other hand, the data were collected using predefined search criteria to collect software-related advertisements [49]. The authors defined the data collection methodology by the combination of both identified methodologies. Each job role name was used as a search keyword to identify the related job posts and define the other search criteria as follows. (1) Keyword: job role inside the double quotation; (2) Industry: all; (3) Location: Europe; (4) Job type: full-time; (5) Experience level: only selected levels; (6) Filtered by: most relevant; and (7) Date posted: previous month. Also, Boolean functions are supported in the LinkedIn search engine [66].

3.3.1. Dataset

The sampling frame was a list of job advertisements published on LinkedIn related to three levels of selected job roles and considered the latest accurate, and included all the populations within the interested context. The collected sample represented a portion of the overall population, called probability sampling, and used the random sampling technique to select the data points randomly [61]. For instance, previous research used the same sampling technique to collect full profile data of IT employees from LinkedIn [23]. Initially, the survey was planned to be conducted only in the United Kingdom (UK) data but there were limited data for selected roles and levels. Therefore, the survey was extended to collect data from European countries because it is a continent that includes the UK [67]. Of the respondents, 25% were from Europe for the State of Agile survey, this being the second largest value [17]. The study extended keyword selection from titles to abstracts due to the limited possibility of collecting only from titles, and this improved the validity of the study [21].
At the planning stage, the authors decided to collect 100 data for each role. However, there were less than 100 data available as a total for both SME and WDA categories in the initial stage and they were collected later before starting their analysis. Also, another study found that entry-level data availability on LinkedIn was small compared with senior levels [47]. The sample size was calculated using an online tool by adding the LinkedIn estimated interested population size as 3689, where the confidence level and margin of error were set as 95% and 3%, respectively. In the literature, two studies were found to use the same method to calculate the sample size [49,65]. The sample size was generated as 828 but there were 900 sample data collected, as per Table 3.

3.3.2. Data Extraction

Not all LinkedIn job advertisements follow the same structure but still include basic elements such as job title, location, job type, industry, and number of employees. There are identified characteristics related to the professional bodies included in job posts named job title, company name, required skills, and qualifications [22]. The study in [49] mentioned that the authors had to read the full advert to extract data from the SEEK adverts. There was no consistency in the structure of the LinkedIn job adverts and the author had to go through the whole advertisement. Data were extracted from each job post, as shown in Table 4, related to the objectives mentioned in Section 1. However, there is strong evidence that identified LinkedIn job advertisements were semi-structured with free-style text for the company name, job title, location, and job description, while job function, employment type, industry, experience level, number of employees, and skill words have a predefined classification [66]. Additionally, skill words were generated by using the skill standardiser, which suggests the targeted skills for the job post [22]. However, the authors did not consider skill words in this study to remove the bias on the platform and the study focused only on job advert content. Also, it only generated a maximum of ten skill words per job post. According to the authors’ observations, there were more than ten skills per job post and some of the main skills were missing in the list. In contrast, another study used LinkedIn profile data for the analysis and described which data were included in the profile to identify the user’s career paths [23]. This provides valid evidence of the use of publicly available data on LinkedIn in a research study. Therefore, there were three unstructured data located in the job description which needed to be extracted as free-style text, as shown in Table 4.

3.4. Data Analysis

The data analysis was conducted for both qualitative and quantitative data. Numeric data were statistically analysed, such as salary and experience [61]. For example, the count of each skill was calculated to identify the frequency of the skills. Objective 1 was achieved by applying mixed methods and the salary and experience from each data point (job advertisement) used in the rest of the objectives with analysed data from objective 1. However, salary and experience were not available in every data point and data that existed was used for analysis. Microsoft Power BI Desktop (version 9.6) was used to analyse the data [68]. Figure 3 illustrates the overall data analysis process, which is described in each sub-section.
Different approaches were found in the literature, such as using natural language processing (NLP) to analyse technical and soft skills in Glassdoor job posts. This was used to analyse data by using text analytics methods such as the N-gram model, TF-IDF Ngram, and lexicon mapping, but the study highlighted some limitations on missing data when using lexicon [50]. Also, there was a study which used a large resume database from LinkedIn with 121,313 IT employee profiles, 696,985 job listings, 442,796 job descriptions in text, and 180,921 different job titles. Their approach was completely different due to the very large and complex dataset, using machine learning algorithms for data mining [23].

3.4.1. Data Cleansing

The extracted data were presented as per Table 5. A similar kind of structure was used to list data extracted from LinkedIn in Ref. [47]. Salary was recorded into minimum and maximum as a range. Each identified skill was maintained in separate columns. Each row depicts an extracted job post for entry level as P1, P2, and so on. Skills (S1, S2, S3, …) with other data types were represented column-wise and continued to add new skills as a column in each post. The same format was followed, and 9 sheets were maintained for each level of each role in the main spreadsheet.
The exclusion criteria when selecting an advertisement are defined as follows:
  • Ignored posts that contained too specific subjects/backgrounds, which can occur due to a special requirement, or with unclear subjects. As an example, mining industry-related tools and technical skills;
  • Ignored noisy text formats which contained special characters, HTML tags, and distracting icons;
  • Excluded posts older than 60 days;
  • Ignored posts which did not offer actual jobs and repeated the same content with slight changes;
  • Filtered out only full-time jobs due to consideration of salary and work experience.
Some of the above exclusions were considered in a research study which had a different approach to data cleansing using algorithms and normalisation. Standardisation was a more important aspect of data transformation in this work to improve the quality of the data in terms of ensuring consistency and removing bias [48,69]. Also, another study mentioned that atypical job posts were eliminated from the dataset, which may mislead the process [23]. There were some features available in Power BI such as removing duplicates, removing spaces, replacing values, merging columns and rows, etc. For example, the null values in the skills column were replaced by 0, as shown in Table 5, in the dataset to remove the errors. Other mentioned features were applied during the data preparation stage.
Most of the salaries were in Euro or Great British Pound (GBP) but there were a few in Swedish Krona (SEK). There were different currencies used in the job posts and normalisation of the salary was needed. Therefore, the authors decided to convert all the salaries into GBP using a currency conversion tool to maintain consistency. The site “Oanda.com” was used on 5 November 2023, UK Standard Time [70].

3.4.2. Qualitative Data Analysis

Several steps were followed to analyse the skills at each level of each role by using thematic analysis. As the first step, predefined themes of technical and soft skills were derived as per the literature, and this is known as the deductive approach in theory [61]. There was an article which followed the inductive approach to identify the soft skills in software engineering by analysing 530 job posts manually. It was completely the opposite approach that did not use predefined categories of soft skills [49]. Table 6 shows the refined themes under each scrum role from the literature. Then, the gathered skills from job adverts were grouped into themes. Also, some skills were identified as new categories, as shown in Table 7, apart from the identified themes. Additionally, (1) frontend web technologies and frameworks, (2) backend web technologies and frameworks, and (3) web design and tools were identified as separate technical skills of web developers. Programming and technical skills should be a unified single skill [71,72].

3.4.3. Quantitative Data Analysis

Quantitative analysis was used to identify the patterns and relationships of the dataset. Theoretically, there are three types of statistical techniques: simple analysis, simple descriptive statistical techniques, and more complex statistical techniques [61]. According to the scale of the study, simple and descriptive statistics were applied rather than more complex statistical analysis, that was not required to achieve the research objectives. The study in [23] used descriptive statistics to focus on the analysis of LinkedIn profile data to identify career paths and the same technique was used to analyse numerical data in another study as well [21]. Power BI is supported for the required analysis methods and data analysis expressions (DAX) were used to perform logical and aggregation functions [86].
The nominal, ordinal, and ratio data were used in discrete and continuous data formats. Qualitative data were analysed using both qualitative and quantitative analysis methods. Theoretically, there is a possibility to use quantitative analysis methods on qualitative data. Nominal value 1 was used in the skill dataset to represent the skill availability when extracting data from adverts, and after the data collection empty cells were replaced with the value 0 using the Power BI set value feature to identify the unavailability of skills. Also, nominal data were used to calculate the frequency of each skill [61]. In the literature, many articles measured the count value to identify the frequency of the dataset and “term frequencies” were recognised as a text-processing technique in the literature [21,49]. The count of occurrences of technical and soft skills was calculated. All the counts which were less than two were ignored at each level due to being too specific and the literature introduced it as “talent detection” because it is specialised knowledge for a specific project [21]. Then, frequency differences were calculated, and a significant difference was identified to define the major and minor skills of each level.
A descriptive statistical technique was used for salary and experience years of the ratio data type in a continuous form as follows: (1) minimum, maximum, and average values of salary; and (2) the highest and lowest values of experience years of each level. Experience levels were defined as ordinal data types which had a sequential order to differentiate one level from another. The analysed data were used to identify the patterns and relationships between the levels to achieve objective 2 by using tables and graphs in Section 4.

3.5. Ethical Considerations

Ethical approval was received from the Teesside University ethics committee on the in October, 2023. The study was carried out following the university guidelines and the UK General Data Protection Regulation [87,88]. However, this research did not directly involve any personal data.

4. Results and Discussion

4.1. Overview Results in Advertisements

A total of 900 job advertisements were analysed under each level of the three selected scrum roles from different industries in Europe. IT services and IT consulting, software development and staffing and recruiting industries dominated, with more than 75% of the job adverts. Also, Germany, France, UK, and The Netherlands were the dominant countries, with over 75% of the jobs.
Germany, The Netherlands, UK, and Italy were the top four European countries based on descriptive analysis [66]. The same trend for job vacancies was observed in the current study and this is a secondary confirmation of the data validity. All other countries in Europe had very few posts published on LinkedIn for the selected roles.

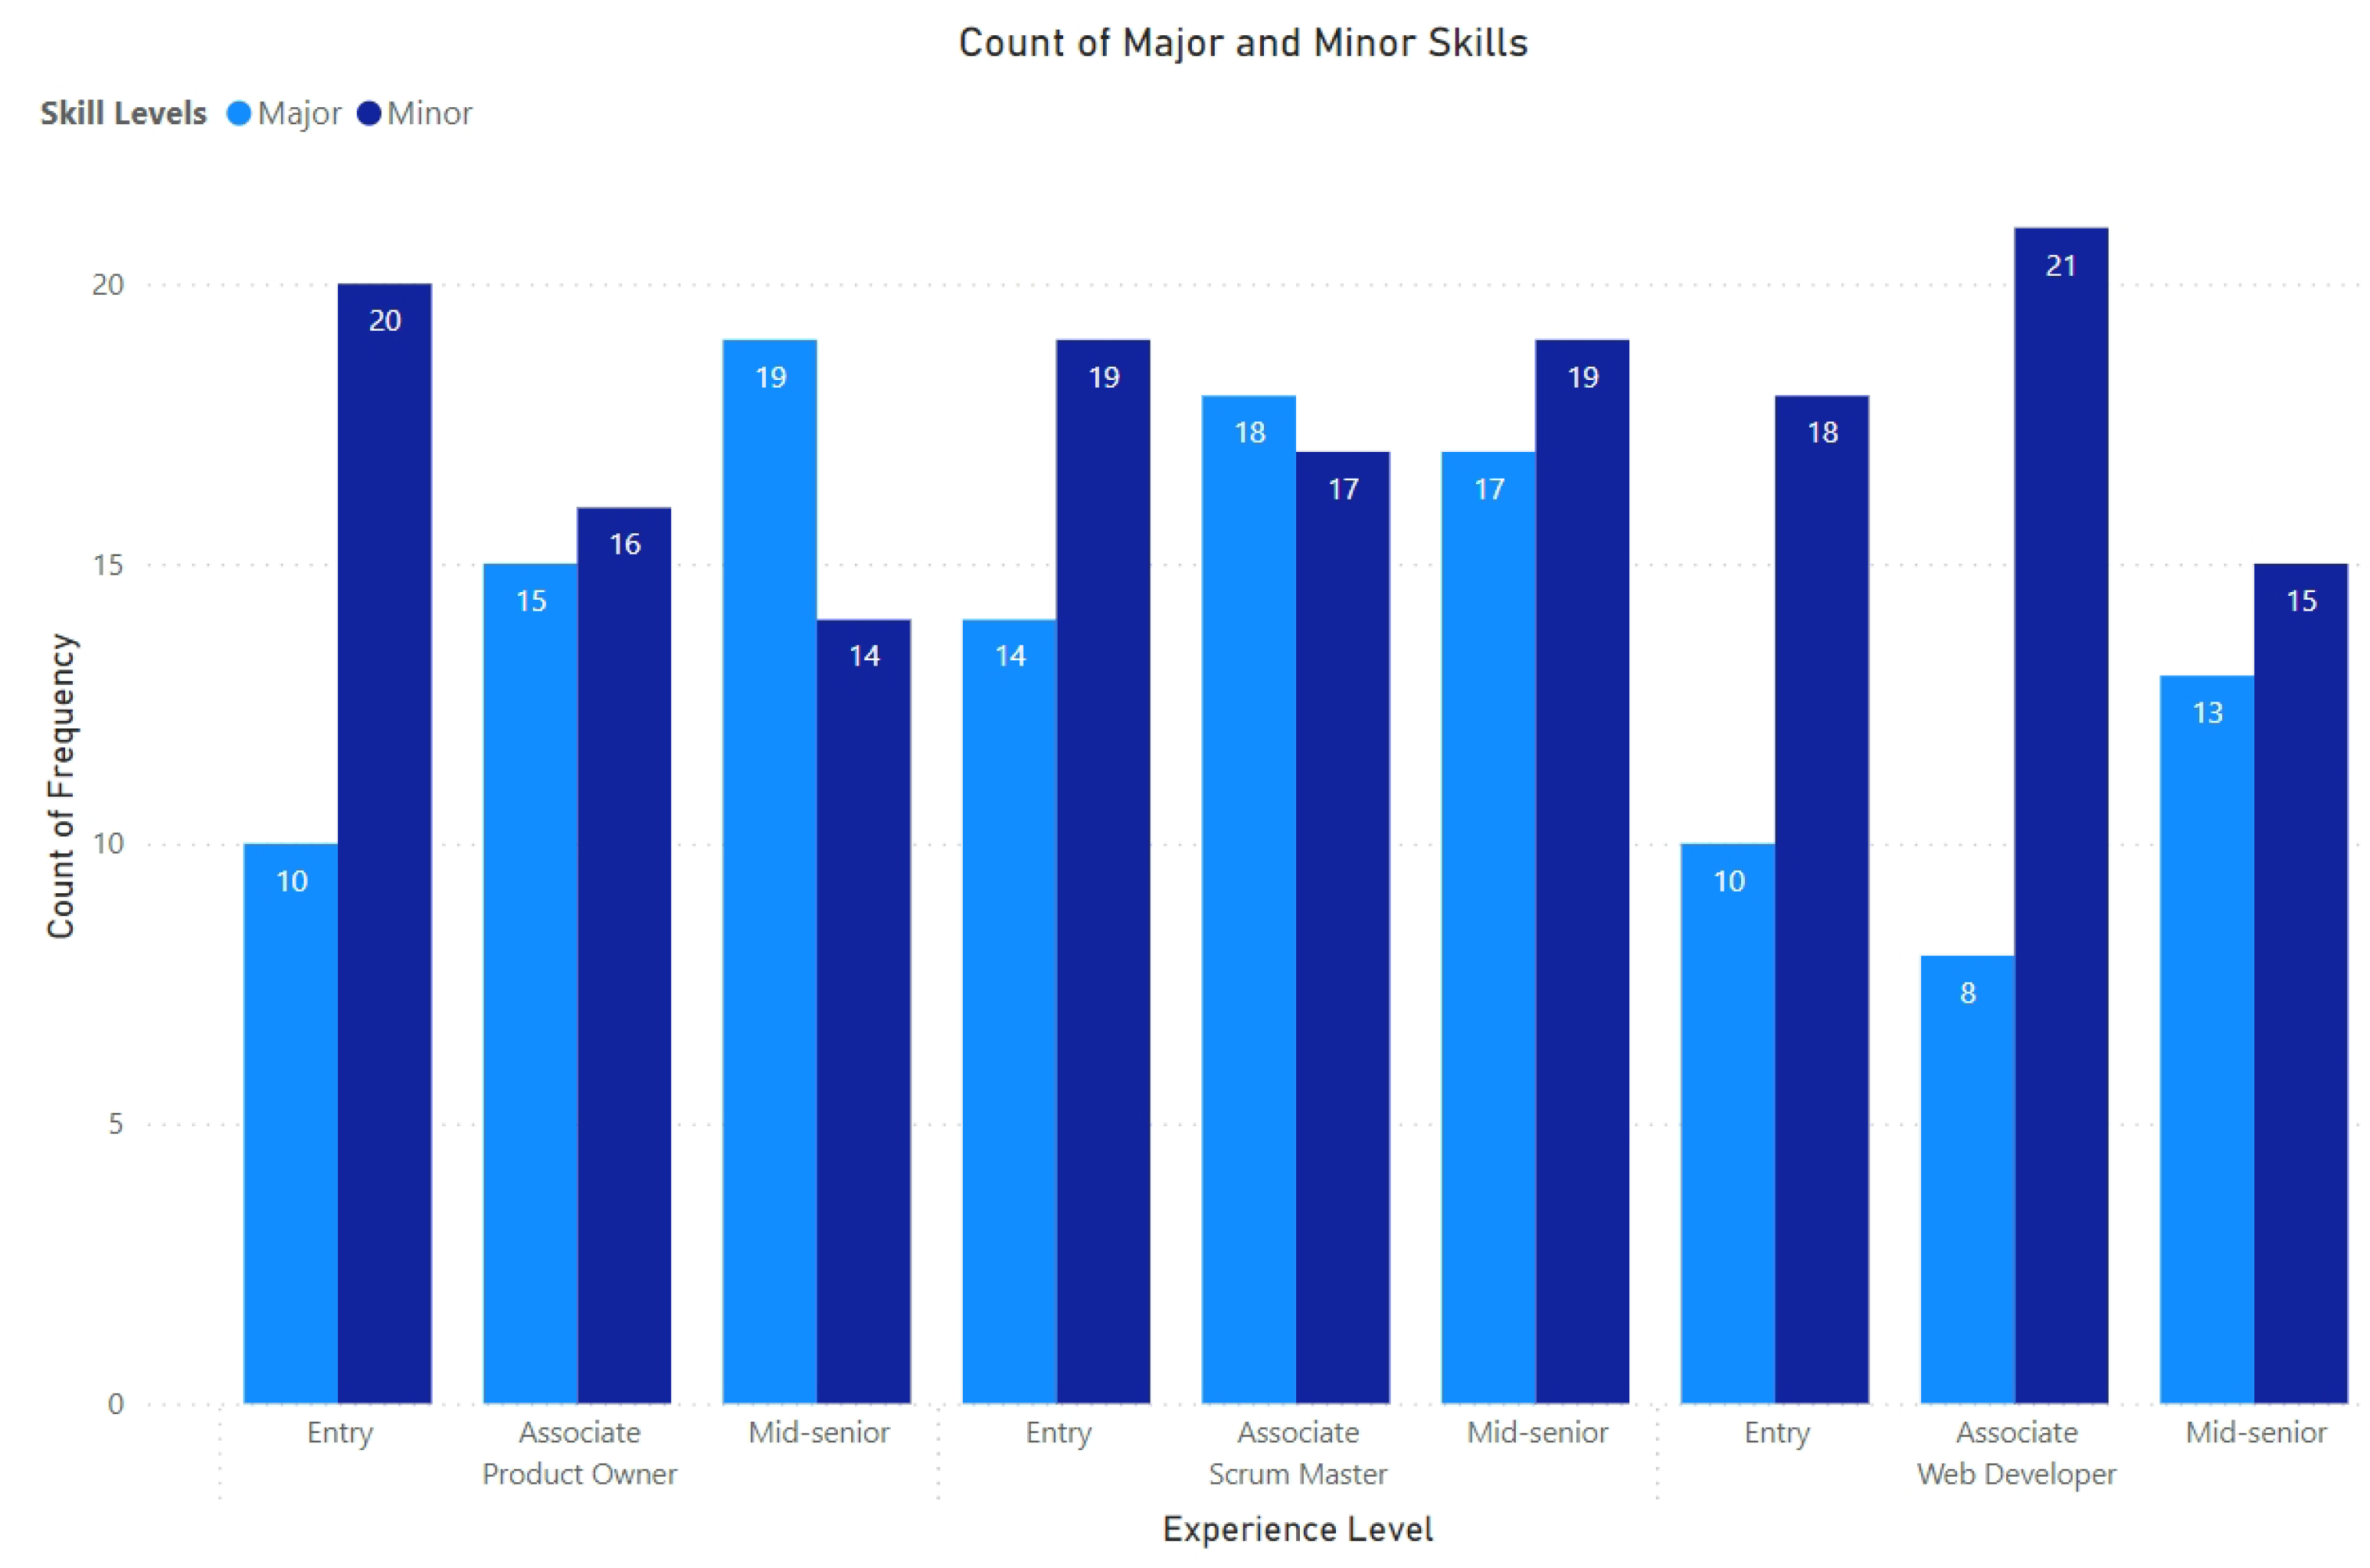
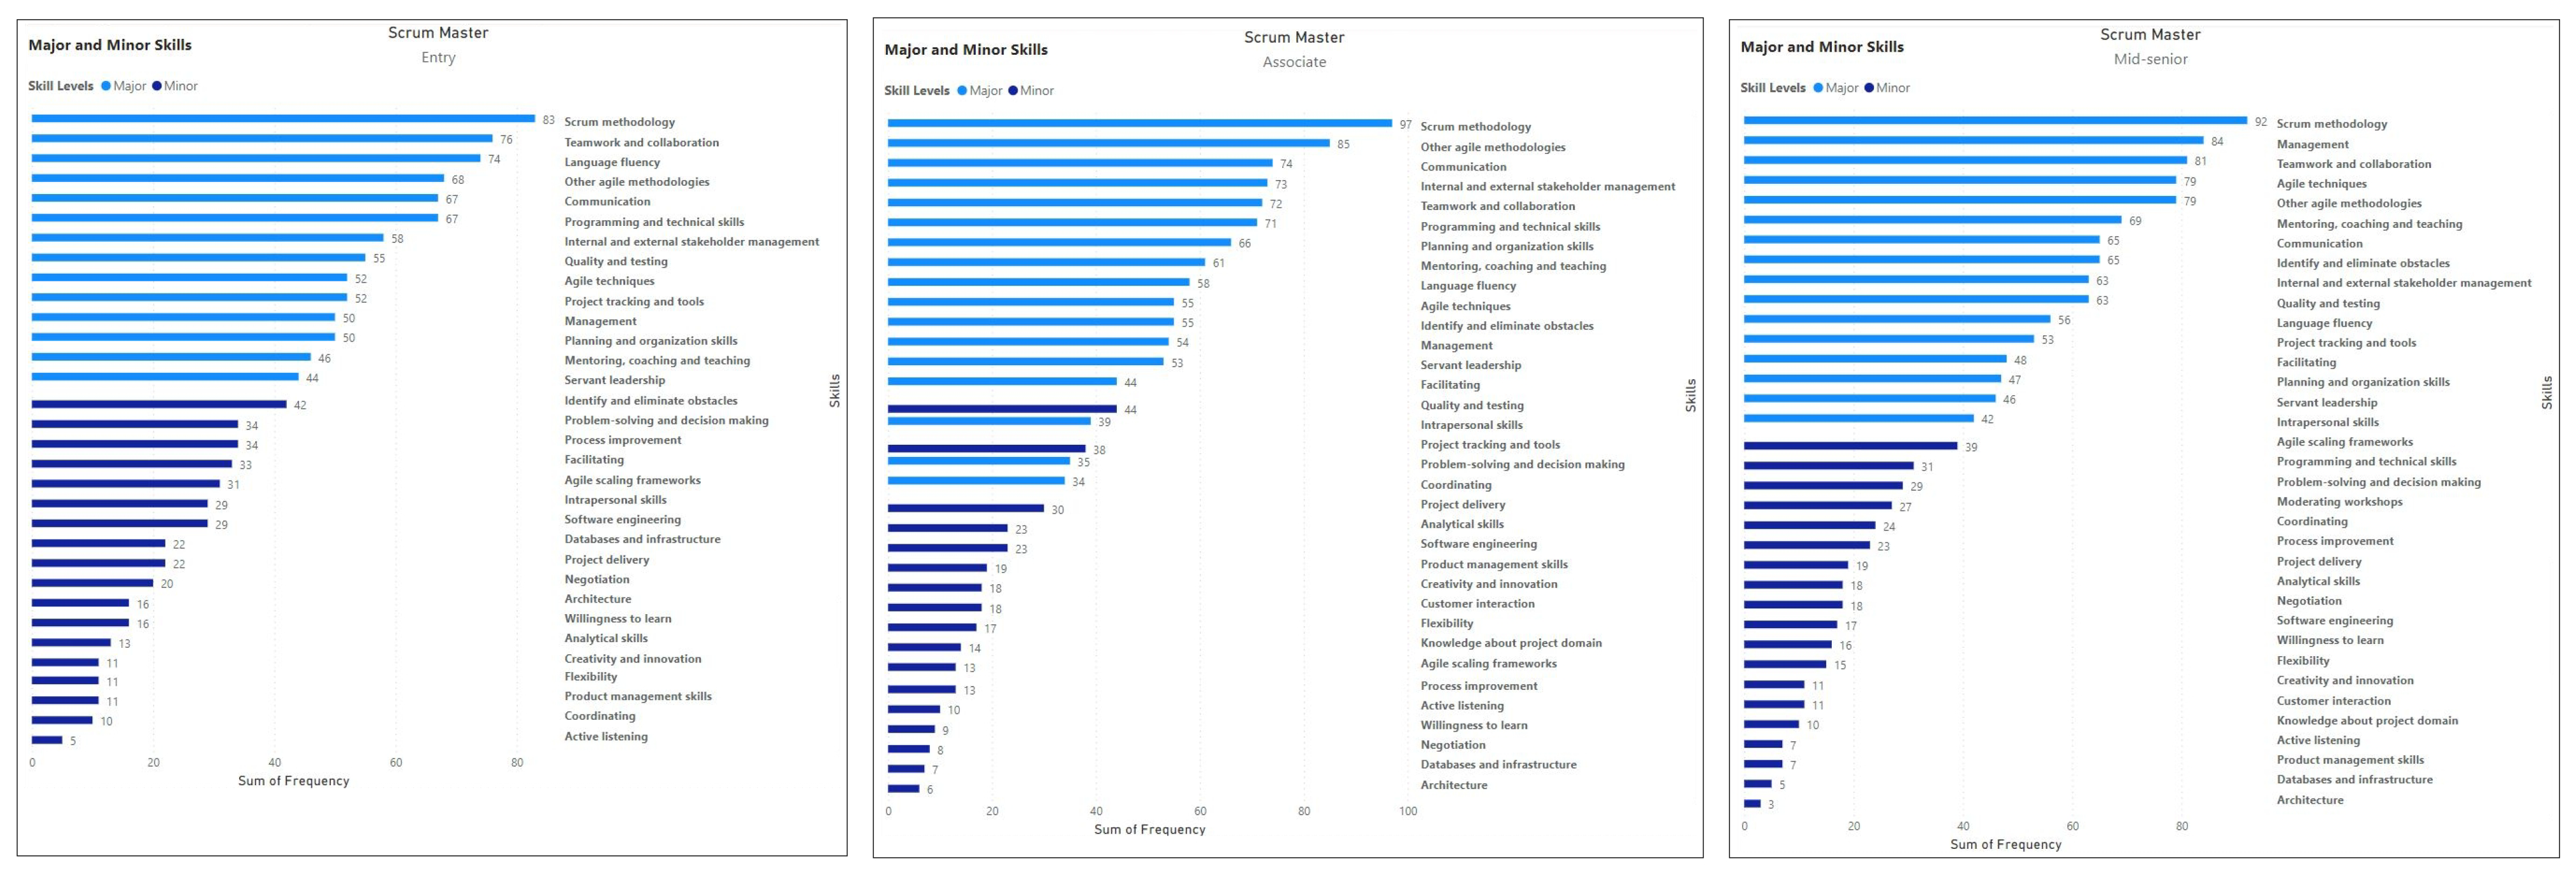
4.2. Objective 1: Major and Minor Skills in Scrum Roles

There were two sets of soft and technical skills for each role level. As mentioned in Section 3, major and minor skills were identified by using the significant difference of each skill in a set (both soft and technical). The major skills from both soft and technical skills were combined. In the same way, minor skills were also combined for all role levels. The major skills of the scrum master associate level were derived as shown in Figure 4. For the rest, the same methodology was followed. As a result, each role level has major and minor separate skills lists with a combination of soft and technical skills. In addition, human and business skills were referred to as soft skills in some cases [46]. However, business skills were treated as technical skills for relevant roles (product owner and scrum master) because those were identified as role-specific skills within this study.
Figure 5 shows the overall number of major and minor skills in each role level. There is a significant increase in major skills between the lowest level and the highest level of each role. At the mid-senior level, both the product owner (PO) and web developer (WD) roles required a higher number of major skills, 19 and 13, respectively, compared with the associate level. However, there is a slight difference between the associate and mid-senior levels of scrum master (SM), by only one skill. Non-progression skills, that were identified in further analysis of objective 2, suggest they should have a clear impact on major and minor skills.
Major and minor skills and the number of adverts (frequency) are illustrated in Appendix A based on experience levels and roles. A frequency analysis was performed to identify the most and least frequent skill sets using a histogram analysis of the skill distribution [48]. IT and software knowledge is the highest wanted skill at the mid-senior level, while team and collaboration skills were highest at lower levels, while they ranked second at the mid-senior level. Even if the IT and software knowledge was a major skill set, it was at the bottom in lower levels.
Scrum master at all three levels had the same scrum methodology as the top skill. Teamwork and collaboration and other agile methodologies (e.g., dynamic systems development method, Kanban, Lean, extreme programming, feature-driven development [19]) were within the top five in all three levels. Web developers at all levels had frontend and backend web technologies as their topmost skills. Other than that, teamwork and collaboration were among the top five skills. The aim of objective 1 was to recognise major and minor skill lists for each role level.

Skills in Industry Demand

New skills were discovered under each role for industry demand by comparison with themes, as shown in Table 7. Skill requirements were provided from the employer’s perspective based on emerging and required skills by analysing online job vacancies [69]. However, there were some disagreements identified in the analysed data. For example, the coordinating skill was discovered as a new skill at the associate level of product owner, but it disappeared at the mid-senior level. Likewise, there were a few uncommon occurrences in the analysed data, not only in the new skills, but also themes as well. The study in [16] identified a lot of industrial information provided by LinkedIn and other digital sources, but data extraction was difficult because of noisy data. Therefore, in further analysis, those patterns were identified and ignored to simplify the process.

4.3. Objective 2: Patterns and Relationships

4.3.1. Required Major and Minor Skill Patterns

An article mentioned the most frequent skills as required skills, but it did not specifically consider job levels and skills continuity between levels [48]. Moreover, a skill matrix was used to map the most frequent skills as required hard skills [47]. In this study, skills which were identified at entry level and remained at the same skill levels were considered required major and minor skills. As a result, these types of skills were filtered as required skills for each role in terms of continuity in Appendix B.

4.3.2. Level-Specific Progression Skill Patterns

Patterns were identified which had continuous progress between levels. It is important to identify patterns as they directly affect progression [89]. This specifically indicates the skills gaps between levels. Therefore, these types of skills impact on future career paths as value-added skills. Two types of patterns were considered to identify the level-specific progression relationships: skills that were recognised as minor and continued to the next level as major (illustrated in Appendix C); and skills that appeared at associate level as major or minor skills and remained in mid-senior level in the same state or as major. For example, the responsibility and accountability skill occurred at the POA as a minor skill, with 24 occurrences, and continual growth to 46 at the next level as a major skill. Also, only one minor skill was identified at POM as a conceptual skill, but it had a very low frequency that could be considered a specialised job requirement which was not filtered out in previous steps. The minor skills that were observed at SMA (customer interaction and knowledge about project domain), and WDA (leadership) positions were continued to the next level but with reduced demand.

4.3.3. Lack of Skill Progression Patterns

According to Appendix D, some patterns deviated from the main identified patterns due to unstructured job descriptions with minimal information. For example, the possible lack of progression patterns is shown in Table 8. In the study, these patterns were identified as deviant patterns and had relationships that deviated from the mainstream. Also, the skills that did not continue to higher levels were considered non-progression skill patterns. A study followed the outlier elimination step in the process of eliminating highly abnormal job descriptions which were misleading [23]. Deviant and non-progression patterns were considered outliers in this study and eliminated from further analysis.
No deviant patterns were observed in PO levels. Appendix D illustrates all possible deviations of SM and WD. The last possible pattern in Table 8 was not counted as it did not exist. Problem solving and intrapersonal skills had less frequency differences and were an indication of the noise of the dataset. All the other skills that differentiated from more than 10 adverts suggested a deviation. Also, there were only three skills with non-progression from PO and WD roles. There was a lack of continuity between levels and very low frequency values. For example, risk assessment did not occur at the associate level and occurred again at the higher level.
Appendix E illustrates required, and level-specific all skill patterns after eliminating the lack of progression patterns. Each level’s total major and minor skill counts were reduced by the impact of a lack of progression skills. As a result, there was a clear increase in levels of major skills.

4.4. Objective 3: Formulating Mathematical Equations

4.4.1. Initial Relationship and Rating

An employee who initially joined a company has only an actual salary and work experience years. The salary was expected to be awarded based on the overall skill expertise that matches with the job requirements in an advertisement [55]. Also, the skill expertise was expected to be measured during the interview process. Explanations of variables are in Table 9 to improve the readability. However, the exact skill level of a new employee is difficult to define at the initial stage. Therefore, the authors have identified the industry standard values by analysing collected salaries and experience years of each role, as shown in Figure 6. For instance, low skills have lower pay and high skills have higher pay, which implies that the level of a skill defines the pay [48]. As a result, the industry-average skill level was defined by using S m i n , S m a x , E m i n , and E m a x values of the role level.
According to the analysis, the authors determined that the skill value of new employees should be placed within A and B in the graph, as shown in Figure 7. The green area (A) represents all the higher-skilled values, and the red area (B) represents lower-skilled values. For instance, if an employee has less work experience and a higher salary when compared with the industry average, that indicates the employee should be more skilled. Also, if it is the other way around, that indicates an under-skilled employee. Furthermore, if the salary and previous work experience of an employee are on an average level (y = mx + c), that indicates the employee has an industry-average skill value.
Most importantly, there was a true zero value to minimum experience years because some job opportunities did not require any experience. Therefore, the experience varies from a minimum of none (0/ E m i n ) to any number of years ( E m a x ). However, non-volunteering opportunities were considered in the study; hence, salary cannot be zero. Therefore, salary varies from a minimum ( S m i n ) to a maximum ( S m a x ) in GBP. Hence, S m i n > 0 , E m i n > = 0 and both S m a x and E m a x should be larger than S m i n and E m i n , respectively.
Equation (1) calculates the expected average salary ( S e x p ) for the given experience in the industry. According to the y = mx + c line, ‘m’ should be [ ( S m a x S m i n ) / ( E m a x E m i n ) ] and ‘c’ should be either S m a x [ ( S m a x S m i n ) / ( E m a x E m i n ) ] E m a x or S m i n [ ( S m a x S m i n ) / ( E m a x E m i n ) ] E m i n .
S e x p = ( S m a x S m i n ) ( E m a x E m i n ) E a + { S m a x ( S m a x S m i n ) ( E m a x E m i n ) E m a x }
S d i f f is the difference between the actual salary of the employee ( S a ) and the expected industry-average salary S e x p represented in (2).
S d i f f = S a S e x p
A rating based on the salary difference S d i f f was introduced using a scale from 0 to 100, where 50 means no difference (or average salary), 0 is the minimum salary S m i n for maximum experience E m a x , and 100 is the maximum salary S m a x for the minimum experience E m i n an individual can obtain, as shown in Figure 7. Employees rated 0–49 are low in skill expertise, 50 is the average, and 51–100 are high in skill expertise. Equation (3) indicates the mathematical representation.
I n i t i a l   R a t i n g = 50 ( S d i f f ) ( S m a x S m i n ) + 50

4.4.2. Individual Skill Time

The frequency values of each level major and minor were used to generate the skill evaluation framework by using the below equations. Table 10 shows a description of the variables.
Equation (4) represents the number of hours to complete to reach the next level. For instance, it shows the total number of hours required to complete the PO entry level to enter the PO associate level. The total number of hours should be allocated for both major and minor skills at a specific level proportionately. The major and minor proportion is measured as follows for any level.
f ( m a j o r ) S K ( m a j o r ) : f ( m i n o r ) S K ( m i n o r )
Total hours for major and minor skills of each level were calculated from (5) and (6) based on the major and minor proportion of the level.
H n e x t = E D i f f ( a v g ) D y e a r T d a y
H m a j o r = H n e x t f ( m a j o r ) S K ( m a j o r ) ( f ( m a j o r ) S K ( m a j o r ) + f ( m i n o r ) S K ( m i n o r ) )
H m i n o r = H n e x t f ( m i n o r ) S K ( m i n o r ) ( f ( m a j o r ) S K ( m a j o r ) + f ( m i n o r ) S K ( m i n o r ) )
At every level of a role, it requires time ( H ( m a j o r ) or H ( m i n o r ) ) to improve a skill expertise. The time allocated for each skill level (major or minor) should be different. Majors require more time than minors. By adding time as an overall value, the time will be distributed to all skills as per their proportion. As a result, individual skills are evaluated in an hourly manner based on skill level (major or minor).
There is a significant impact on the overall rating by changing the salary. However, change in the level-specific hours has minimum impact on the overall rating due to the low amount of completed project or sprint hours. Additionally, the initial ratings were unique according to the role and the level of team members. All the equations generated useful information about employee skill evaluation to make decisions about employee career development and ease of employee selection for a project. The proposed model was developed based on the initial rating and skill development throughout project completions.

4.5. Objective 4: Proposed Skill-Based Continuous Evaluation Model

Low-code development (LCD) platforms are considered as promising tools in the industry. Also, only low programming knowledge is required to develop an application [90]. Forrester’s survey highlighted that there was a 5 to 10 times greater speed of development. Additionally, time consumption was low when compared with the coding development approach [91]. Therefore, the authors decided to develop the Skill Evolution Evaluation Model (SEEM) using a low-code platform.
SEEM was implemented using the Mendix low-code platform, which supports development in frontend, workflow, integration, and backend. Moreover, LCD platforms are easy to use in the agile development process [90]. According to many analysts at Gartner, SAP, and IBM, Mendix is the best emerging tool which provides a full-stack development platform [92]. Mendix is a collaborative tool with all roles and lifecycle phases. Also, Mendix supports both experienced and non-experienced developers by providing two types of environments. This study used Mendix Studio Pro, which required some programming knowledge, to develop the application [93]. The Mendix platform is more suitable for a small or medium-sized project which has a short delivery time [92]. The product prototype was developed using the Mendix Studio Pro platform in the 10.4.1 version.
SEEM consists of the main Mendix features mentioned by Poe and Mew in the study in [92], such as security and user authentication, deployment, user experience and interfaces, business logic, data structure, and domain model, but does not use the collaborative feature due to single-user implementation. This paper describes the SEEM’s domain model, business model, and user interfaces (UIs). Other features are similar to the Mendix default functionalities.

4.5.1. Domain Model

There are four main entities produced in the proposed model apart from user accounts with one-to-one, many-to-many, and one-to-many relationships. Finalised major and minor skills were stored in the skills table by categorising skill types and levels. All three roles were stored in the roles entity along with connected skills for the role derived from the study findings available in the skills entity. There was a many-to-many relationship between roles and skills because any role could have multiple skills. Analysed industry standard values for each level of all roles were stored in the standards entity, which has a one-to-many relationship with the roles entity. I.e., a single role could have three industry standards for each level.
The main entity was the employee, which consists of different data types such as string, decimal, integer, and date. Also, it had field validations for employee experience, salary, and level to improve the security strength of the application. An employee has several relationships between every other entity but most importantly, one employee has one account and many skills, many employees have many standard values, and one employee has only one role at a time. All the relationships and entities are provided in Figure 8.

4.5.2. Business Model

The point-to-sell features were defined as the business model. The overall model was developed using Mendix microflows that supports connecting both UI and entities. The prototype business model is a combination of three main features as follows: (1) initial (base) rating; (2) next level total hours and completed hours; (3) overall rated value and individual skill values. To develop this model, the authors used previously generated results as input for this process, such as finalised role-specific major and minor skills of each level, industry-standard values, and mathematical equations. Also, the synthetic individual salary and work experience were used as inputs to measure the initial rating. Appendix F illustrates the main features of the business model process in a flowchart.
Figure 9 presents one of the microflows used to implement the initial rating feature. Similarly, there are two microflows for other main features. However, there were several microflows implemented. Moreover, the initial equation was implemented as a change variable action in the initial rating microflow. All the equations were formulated in relevant microflow to build the proposed model.
By updating the salary, SEEM recalculates the hours to complete in the same way it calculated them in the initial stage and updates the rating. At the same time, it resets the completed hours. The decision-maker could have a clear understanding of the expertise related to skill hours and offer a better wage increase. This will benefit the employee as their new rating is an indicator of a fair wage increase.
SEEM is developed based on data from scrum roles in the IT industry. By following the same methodology, it can be developed for any other organisation which has scrum teams, such as construction, education, product development, automotive, marketing, finance, and event planning. Also, it can be developed further for any organisation that has role and level-specific skill data. Recruitment knowledge, knowledge about scrum, research and development skills, product development, and software testing are needed as knowledge, experience, and skills. Any computer with a web browser can be used to run the SEEM and the internet is required if hosted in a cloud space.

4.5.3. User Interfaces

The proposed skill-driven model involved three users, administrator, project manager (PM), and employee, with the latter a representative from the scrum team. Features were implemented for PMs (any decision-maker) to make effective decisions. The employee is considered as an inheritance of the other two roles without any additional features. For example, an administrator can create and manage all user accounts while an employee is only able to view their profiles with personalised data and update their account. All these features are available for PMs as they are the target group. Figure 10A indicates where individual salary and experience are entered as input values. Moreover, other necessary details related to specific employees can be added from the same view such as role, experience level, and skills. Then, the initial rating is calculated by using a formula and displayed to the PM in Figure 10B. There is a view in Figure 10C for inserting project worked hours, which impacts overall employee rating and systematically calculates completed hours from total next-level hours. An employee profile UI with completed hours and overall rated values on a 0–100 scale are shown in Figure 10D. Prototype wireframes in XD—https://xd.adobe.com/view/b4e65c32-b6f6-47b7-8039-0e7a9716337b-e1b5/ (accessed on 4 October 2023).

4.6. Objective 5: Model Evaluation with Previous Works

This study evaluates the proposed model with the existing tools and models of skill evaluation. In the literature, there are other methods to evaluate skills from different perspectives, such as a skill matrix [46], DFIR skill map [47], the Skill Recommendation Deep Q-Network (SRDQN) [52], skill evaluation tools [25], and the skills mapping approach [51]. Therefore, we critically analyse some of the above models and tools under predefined categories such as purpose, features, accuracy, and efficiency of decision making.

4.6.1. Expertise-Based Skill Management System (EBSMS)

The EBSMS uses several parameters to define the skill expertise including skill level, skill items, skill set, mean skills, skill set based on education and experience, project success factor, training, and feedback from the manager [53]. In this context, having too many parameters makes a model complex. Also, the 1–10 skill level and skill items have no given methodology for how to assign them to an employee. The skill set was chosen by an employee based on their education. This might be misleading as education does not always reflect all skills used in employment, especially in the software industry. They used the project success factor in the calculation [53]. However, the project’s success is defined by the decision making of the project management. Poor decisions are accountable for project failures [9]. Based on this, the success factor should not be a factor for an individual employee except decision-makers. Requesting feedback from a manager to evaluate making the process longer and more complex would add time and increase the risk of not achieving it in the long run. SEEM does not use the above-mentioned educational background, project success factor, or manager’s feedback. The model accepts standard roles and level-based skill sets, with the ability to add additional skills if needed. In addition, SEEM calculates a skill rating (or level) at the beginning of the employment based on the agreed salary and experience years in the field. This avoids the manual assessing and rating requirement to make the process simpler. In the future, updates of the salary and experience in skills will be tracked and visible to both manager and employee. SEEM was designed to provide an estimation of the time required to reach the next level of the role based on the current salary and experience, which is not available in EBSMS. The only inputs to the SEEM would be additional skills, salary, and skill hours after project completion (or time tracker) to make use of the model for everyday use with less effort.

4.6.2. Skill Matrix

A skill matrix is a method used to evaluate skills in a specific project or event. It was used to evaluate employee skills at the review stage after a project. The identified skills were rated by using different ranking methods such as numerical ranking, colour coding, or textual coding (low, medium, and high) [46]. The skill matrix was used by Potter [46] for student skills. However, skill evaluation is conducted by students, assessors, and clients. There are inaccuracies in students’ self-rated skill matrix due to under- or overestimation. However, SEEM uses only a salary (if changed) and the hours worked in each skill (or collective overall hours for all skills) after a completed project. The simplicity of the inputs and the definition of expertise suggest that SEEM should be more accurate and descriptive in terms of skills expertise [55]. Moreover, SEEM follows industry standard values to calculate individual expertise and no estimations are used. The individual ratings always follow the industry standards.
Other than that, the skill list was categorised as technical, humanistic, and business skills, but there is no further categorisation according to roles and levels as major or minor in skill matrices. As a result, the team selected irrelevant skills from the skill list for the projects. Additionally, it was mentioned that a key factor of self-evaluation should match industry expectations; otherwise, it will be difficult to understand the skills which are needed to improve or resume [46]. On the other hand, SEEM categorises the roles according to the career path level (entry, associate, mid-senior, etc.) along with the skill level as a major or a minor depending on the usage of the skill in a specific role level. Also, the improvements in skills and salaries are visible throughout the employment for both the manager (or employer/decision-maker) and the employee. This makes SEEM a step ahead of skill matrices in continuously evaluating and tracking progress.
Generally, a skillmap is defined as a list of skills and ranked values with a hierarchical skill classification and matrix ranking method. A skillmap is represented as a table with a list of skills as a tree structure in rows based on the four levels of skill classification, as per Table 11. A DFIR skillmap was generated as training material for future DFIR professionals and the skills were identified from a threefold approach map with a tree-structured skill matrix to identify the most frequent skills [47]. SEEM used a different method to find frequent skills and did not apply weighting until the classification of majors and minors. After the classification, majors and minors received weights based on the frequency ratios.
Data occurrences were recorded in each column in DFIR. The total number of occurrences was calculated under three datasets and the average percentage represents the importance of skills. The most important feature is skill classifications that gives a deep understanding of the skills. However, there is no specific information about the skill evaluation method using the skillmap [47]. SEEM provides a clear methodology to obtain simple inputs and calculate an initial start expertise rating, continuous evaluation, and calculations throughout the stay of an employee in a given workplace. As described above, SEEM uses industry-wide standards for calculations collected and derived from real job board data. SEEM is a flat structure over the tree structure of DFIR [47]. DFIR focuses on the most crucial skills but SEEM focuses on both majors (crucial in DFIR) and minors as they have a distinct pathway to the next steps in the career ladder in the same role, as found in the information generated from collected data.
The skill matrix, skillmap, EBSMS, and SEEM have their focus areas and goals. Some of these are complex for the user (manager/decision-maker) and have no support for different stakeholder access. Some of the models do not consider roles and connected levels to specify the output. It is difficult to distinguish which is the best model; however, SEEM provides a more simplified and transparent model to carry out everyday skills evaluation and tracking for both decision-makers and employees. This enhances the ability to make decisions quickly and easily.

4.6.3. Values of SEEM
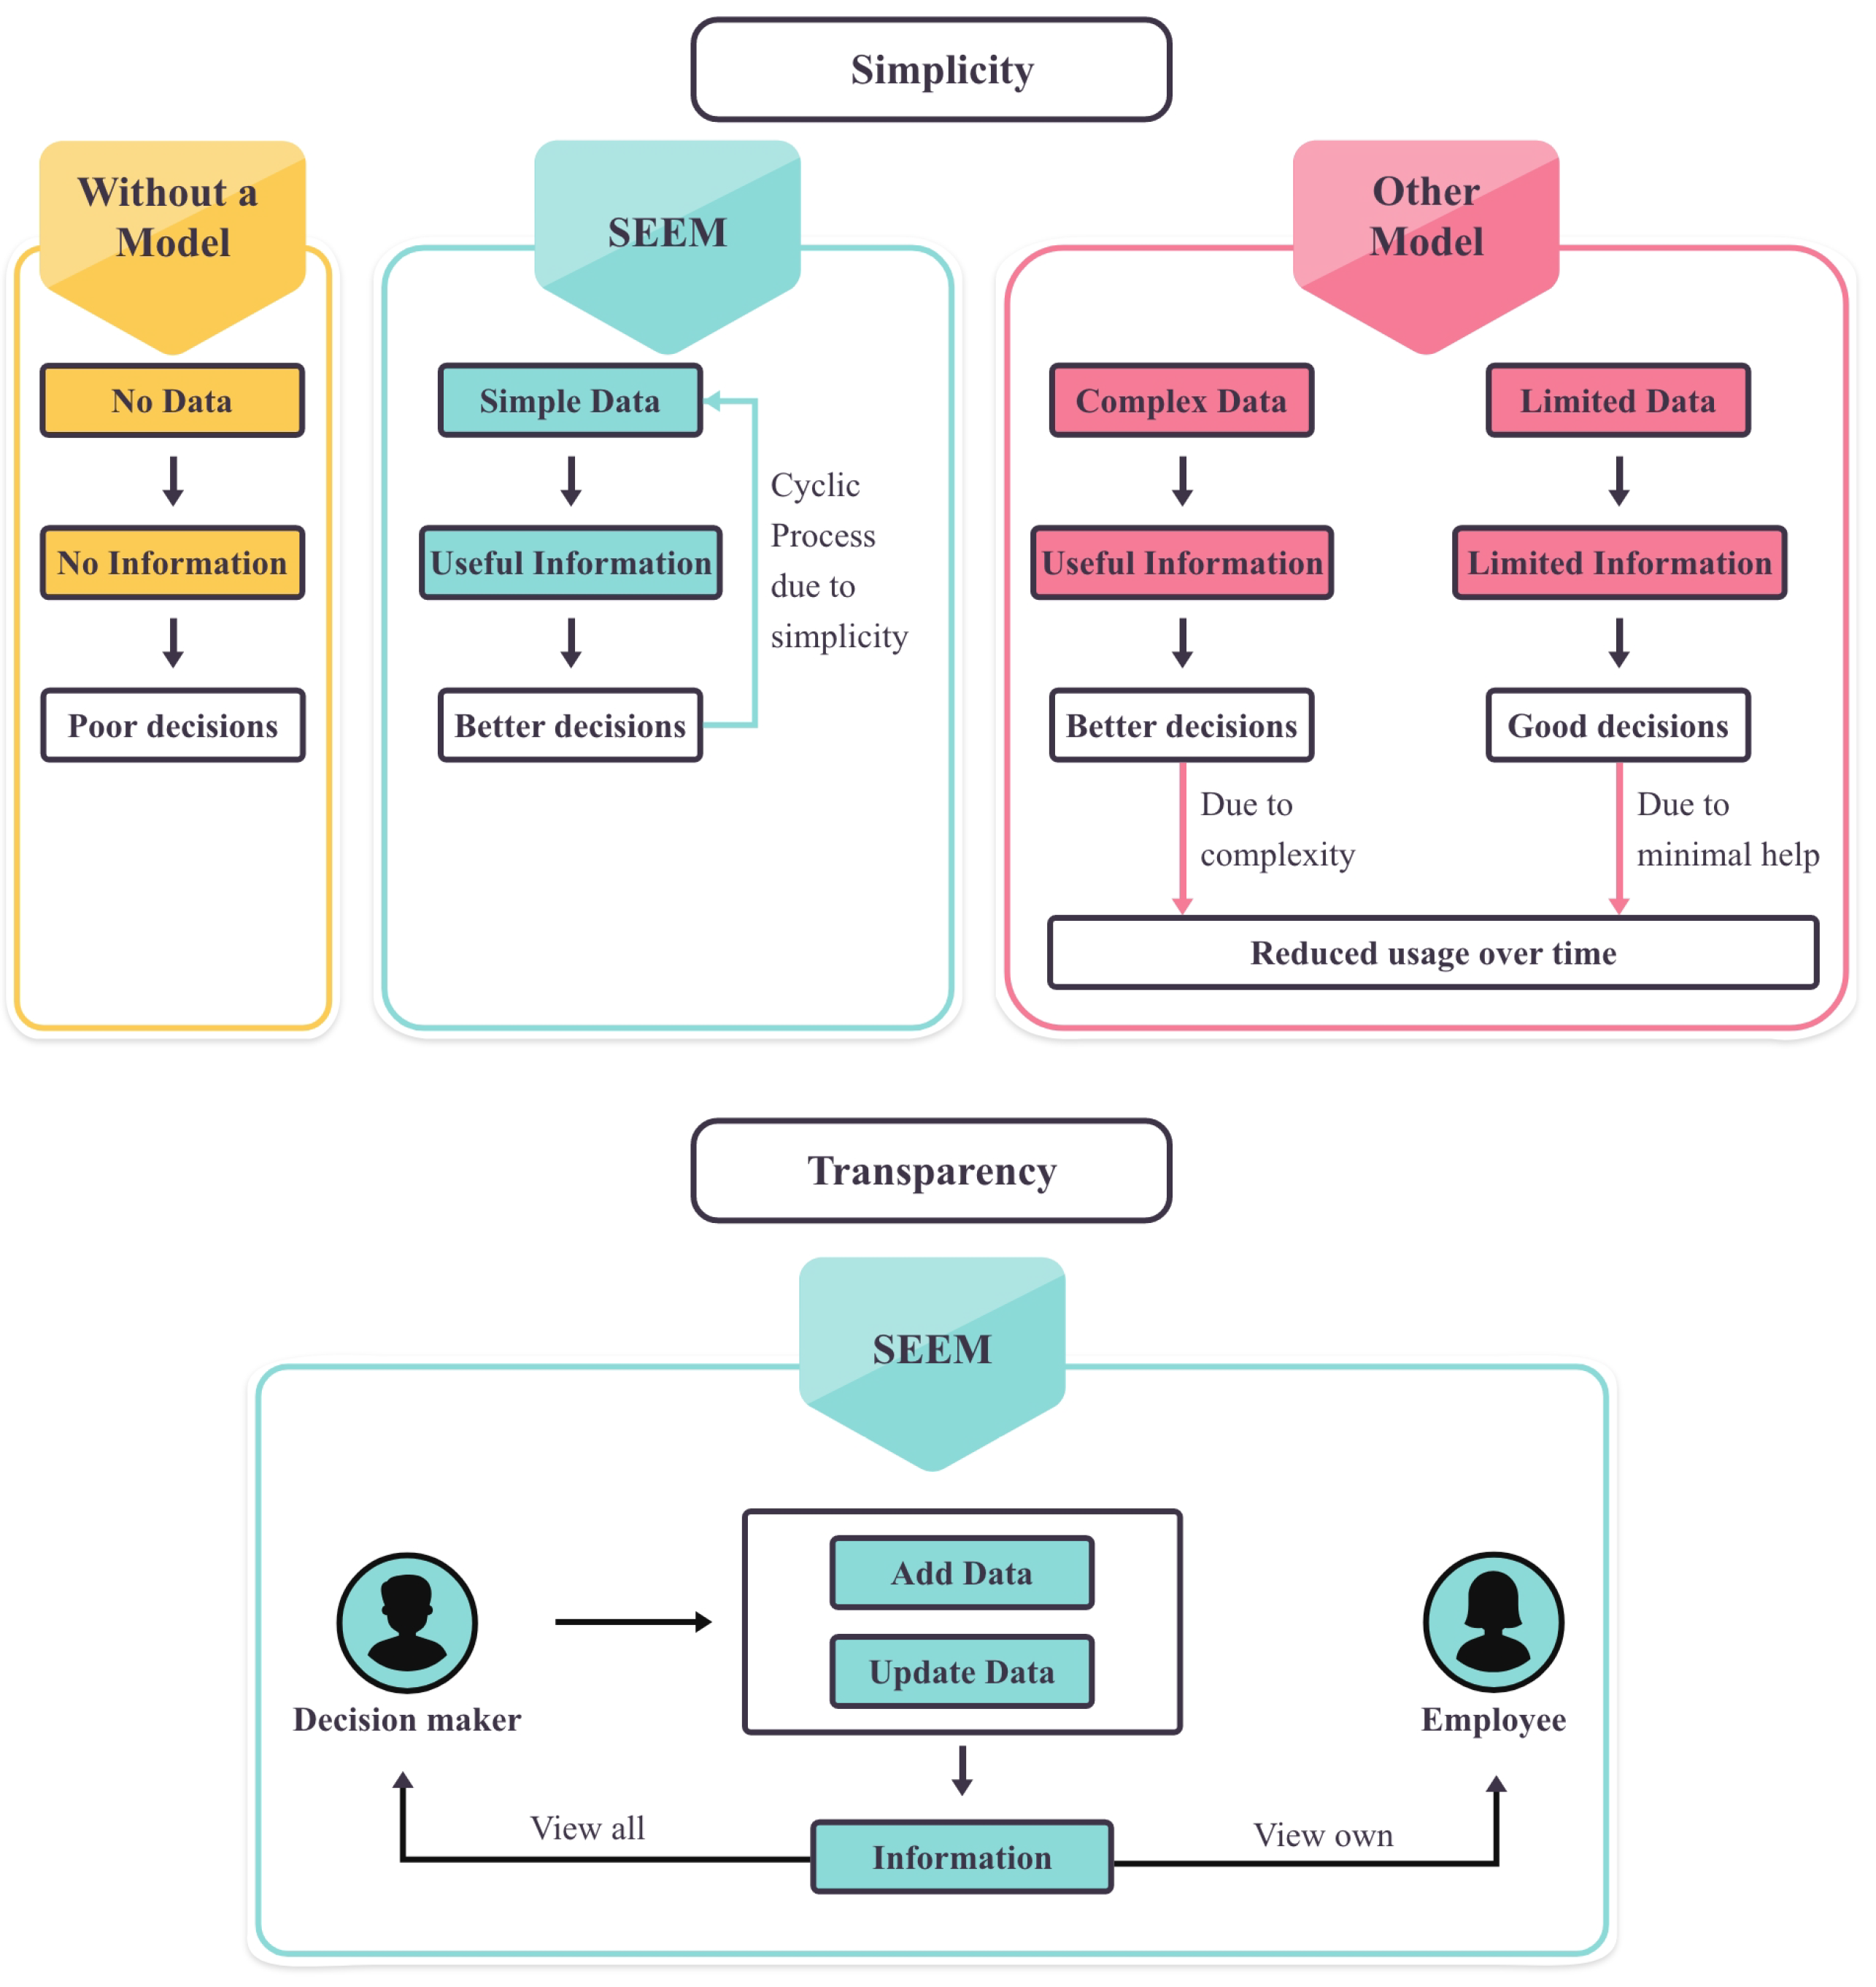
  • Simplicity:
    SEEM expects simple inputs (e.g., agreed salary, experience years, updated salary, overall hours, or individual skill hours to be accepted as inputs in different stages) from the decision-maker that encourage continuous engagement. The decision-maker could make better decisions by considering useful information as follows.
    • Completed hours to date and the hours needed to be completed to the next level (entry to the associate, associate to mid-senior);
    • Initial ratings;
    • Overall continuous ratings.
    As a cyclic encouragement, the process would continue to have improved results over time. By using SEEM, decision-makers understand better employees’ skills and make better decisions. The decision-makers can input overall project hours into the model and the model distributes those hours to each skill depending on the weights of each skill category (major or minor).
    As a value addition, SEEM also supports the input of individual skill hours to provide improved results, which would be a result of stimulating decision-makers from previous results with overall hours. Figure 11 indicates the simplicity in the flow of SEEM by comparison with other existing models and without a model.
  • Transparency:
    Only a decision-maker adds or updates data, which is also visible to the respective team members. Transparency leads to more accurate, prompt data inputs, as shown in Figure 11.
  • Extended values:
    For SEEM, the skill hours are added sprint-wise or by linking a time-tracker software. This makes the process more efficient, and the decision-maker is free from entering data. This leads to making the model more useful and reduces hesitation. Linking to the payroll with caution could make the process easier to add employees, update salaries, etc. Everyone in the same loop benefits without having to adapt to completely new software or solutions by integrating or linking additional services as described above.
    The gaps identified in the literature can be solved by using this model as it provides a clear understanding of individual employees’ skill levels. As an example, teamwork, communication skills, and organisational skills ratings should reflect the expected commitment of the employee.
    The digital transformation in businesses and industries within Industry 4.0 is changing and has significant challenges in the skills market. Skills evaluation and tracking throughout an employment have become a common research area due to the demand [94].

4.6.4. Study Contribution

Limited studies have been conducted to identify skill evaluation concerning digital industry demand. The results of this study prove that the skills of each selected scrum role can be extracted from LinkedIn job adverts. The level-specific skills in job adverts were not studied as per the literature even if the role-specific skill analysis was found. The skill set is the reflection of the current skill demand for a selected role. The skill set is classified to differentiate major skills and minor skills in demand by using frequencies in levels. The existence of patterns and relationships was found through the study as follows: (1) required skills, (2) level-specific progressions skills, and (3) lack of skill progressions. The study eliminated two types of lack of skill progression to improve the accuracy of the dataset.
The initial skill value of an employee is anywhere within the graph (Figure 7) and is used as the backbone of the study. It was defined on a 0–100 scale based on the industry standard values. Skill value has three different states: average skilled, over-skilled, or under-skilled. Two mathematical equations were formulated based on the resultant relationships between salary, experience, and major–minor skills.
The impact of skill-driven models in scrum teams for software projects was researched less and the focus was on the reduction in the complexity and the improvement in the usability. SEEM was developed after research, not a commonly used method like the surveyed research on a suggested model. SEEM is a findings-based model rather than an assumptions-based model. The authors believe that such studies on skill-driven models can be useful for project success, especially in the era of digital transformation.

4.6.5. Limitations

  • The use of only one platform (LinkedIn) and a data generation method (document) to extract data could miss out on a different set of recruiters who do not use LinkedIn.
  • The data were limited only to European countries for the three specific scrum roles.
  • The LinkedIn job adverts expired soon after the recruitment process completed. It was a challenge to extract enough data and review job advertisements after the vacancies were filled on LinkedIn [21].
  • Job roles changed slightly with the job advertisement titles in the data collection process.
  • There were difficulties in finding data for specific roles from October to November because the second largest peak recruitment period is September to October and the quietest hiring months are November to December in the UK due to the influence of seasonal trends [48]. Data were collected during the intermediate time between the hiring trends.
  • Some adverts were published as non-English and used Chrome Translate to translate the description [95]. This impacted the process of data collection and additional time was invested to expand the dataset.
  • The salaries were not mentioned and left blank in some job adverts. Salary information was not mentioned in 50% of job postings, as also found in another study [48]. Also, experience was not mentioned in several job adverts, but this was not as frequent as salaries not being mentioned.
  • The approach did not follow an automated process for data extraction and analysis. Therefore, it was time consuming.

4.6.6. Future Research Directions

  • An evaluation of SEEM and its effectiveness could be performed as a future study by using a control group.
  • There were specific job titles which related to the scrum roles in job advertisements. This is an opportunity to analyse more specialised roles to detect emerging job roles and career paths in the IT industry.
  • More job portals could be used to improve the accuracy of industry standards of the proposed model and eliminate platform bias (LinkedIn).
  • Future research could focus on different approaches to improve the efficiency of the process by following an automated process in data extraction.
  • Data could be expanded for any IT professionals and levels by following the same approach worldwide.

5. Conclusions

This study is based on an industrial dataset which effectively impacts industry demand for skills. The proposed model suggests that there is a direct relationship between job advert skills with career development. Major and minor skills for each level are derived from the study for objective 1 along with the relationships and patterns for objective 2. The formulation of the mathematical representation for objective 3 was based on the achievement of both initial objectives. As objective 4, SEEM was developed upon the mathematical formulas and skill sets from the first two objectives. The use of a single-platform approach with a single data generation method, manual data collection within the only European region, translating adverts using a browser extension, missing salaries and experiences, and expiring adverts were identified as major limitations to the study. SEEM was compared with a few existing models to find out the impact on the scrum team. The results suggest that there is better visibility and evaluation of the expertise of skills of the scrum team for decision making in software projects that use SEEM. Also, the team members see the progress towards their next career level, and this improves them as a team. Both decision-makers and scrum team members benefit.

Author Contributions

Conceptualisation, V.H. and I.A.; methodology, V.H. and S.S. (Saqib Shamim); software, V.H., I.A. and S.S. (Sidra Saleem); validation, V.H., I.A. and S.S. (Sidra Saleem); formal analysis, V.H.; investigation, V.H.; resources, I.A.; data curation, V.H.; writing—original draft preparation, V.H.; writing—review and editing, I.A. and S.S. (Saqib Shamim); visualisation, S.S. (Sidra Saleem); supervision, I.A. and S.S. (Saqib Shamim); project administration, I.A. and S.S. (Sidra Saleem); funding acquisition, S.S. (Saqib Shamim). All authors have read and agreed to the published version of the manuscript.

Funding

This research received no external funding.

Institutional Review Board Statement

The study was approved by the Ethics Committee of Teesside University (Project: 17576 B1670536 and 13 October 2023). Additionally, this study did not involve humans or animals.

Data Availability Statement

The original contributions presented in the study are included in the article, further inquiries can be directed to the corresponding author.

Acknowledgments

We would like to acknowledge the support of Teesside University library team and research colleagues.

Conflicts of Interest

The authors declare no conflicts of interest.

Appendix A

Figure A1. Frequency of major and minor skills (product owner).
Systems 12 00149 g0a1
Figure A2. Frequency of major and minor skills (scrum master).
Systems 12 00149 g0a2
Figure A3. Frequency of major and minor skills (web developer).
Systems 12 00149 g0a3

Appendix B

Figure A4. Required skill patterns between levels.
Systems 12 00149 g0a4

Appendix C

Figure A5. Level-specific skill patterns.
Systems 12 00149 g0a5

Appendix D

Figure A6. Deviant skill patterns.
Systems 12 00149 g0a6

Appendix E

Figure A7. Total major and minor skill counts (without lack of progression patterns).
Systems 12 00149 g0a7

Appendix F

Figure A8. Business model of SEEM.
Systems 12 00149 g0a8

References

  1. Rodriguez-Repiso, L.; Setchi, R.; Salmeron, J.L. Modelling IT projects success: Emerging methodologies reviewed. Technovation 2007, 27, 582–594. [Google Scholar] [CrossRef]
  2. Pollack, J.; Helm, J.; Adler, D. What is the Iron Triangle, and how has it changed? Int. J. Manag. Proj. Bus. 2018, 11, 527–547. [Google Scholar] [CrossRef]
  3. Iriarte, C.; Bayona, S. IT projects success factors: A literature review. Int. J. Inf. Syst. Proj. Manag. 2020, 8, 49–78. [Google Scholar] [CrossRef]
  4. Yel, İ.; Baysal, M.E.; Sarucan, A. A new approach to developing software projects by assigning teams to projects with interval-valued neutrosophic Z numbers. Eng. Appl. Artif. Intell. 2023, 126, 106984. [Google Scholar] [CrossRef]
  5. Patil, M.; Suresh, M. Modelling the enablers of workforce agility in IoT projects: A TISM approach. Glob. J. Flex. Syst. Manag. 2019, 20, 157–175. [Google Scholar] [CrossRef]
  6. Jassawalla, A.R.; Sashittal, H.C. Building collaborative cross-functional new product teams. Acad. Manag. Perspect. 1999, 13, 50–63. [Google Scholar] [CrossRef]
  7. Lohman, M.C. Cultivating problem-solving skills through problem-based approaches to professional development. Hum. Resour. Dev. Q. 2002, 13, 243–261. [Google Scholar] [CrossRef]
  8. Maurer, T.J.; Weiss, E.M. Continuous learning skill demands: Associations with managerial job content, age, and experience. J. Bus. Psychol. 2010, 25, 1–13. [Google Scholar] [CrossRef]
  9. da Cunha, J.A.O.; da Silva, F.Q.; de Moura, H.P.; Vasconcellos, F.J. Towards a substantive theory of decision-making in software project management: Preliminary findings from a qualitative study. In Proceedings of the 10th ACM/IEEE International Symposium on Empirical Software Engineering and Measurement, Ciudad Real, Spain, 8–9 September 2016; pp. 1–10. [Google Scholar]
  10. Heinsman, H. The Competency Concept Revealed: Its Nature, Relevance, and Practice. Ph.D. Thesis, Research and Graduation Internal, Vrije Universiteit Amsterdam, Amsterdam, The Netherlands, 2008. [Google Scholar]
  11. Gingnell, L.; Franke, U.; Lagerström, R.; Ericsson, E.; Lilliesköld, J. Quantifying success factors for IT projects—An expert-based Bayesian model. Inf. Syst. Manag. 2014, 31, 21–36. [Google Scholar] [CrossRef]
  12. Soja, P. Success factors in ERP systems implementations: Lessons from practice. J. Enterp. Inf. Manag. 2006, 19, 418–433. [Google Scholar] [CrossRef]
  13. Pecherskaya, E.; Kamaletdinov, Y.; Zhabin, A.; Grishina, P. Key success factors analysis in the context of enterprise resourcesplanning systems projects implementation. Int. J. Proj. Organ. Manag. 2015, 9, 199–226. [Google Scholar] [CrossRef]
  14. Pecherskaya, E.P.; Averina, L.V.; Kamaletdinov, Y.A.; Tretyakova, N.V.; Magomadova, T.L. Assessment of critical success factors transformation in ERP projects. Int. Electron. J. Math. Educ. 2016, 11, 2608–2625. [Google Scholar]
  15. Aranyossy, M.; Blaskovics, B.; Horváth, Á.A. How universal are IT project success and failure factors? Evidence from Hungary. Inf. Syst. Manag. 2018, 35, 15–28. [Google Scholar] [CrossRef]
  16. Conboy, K.; Fitzgerald, B. Toward a conceptual framework of agile methods: A study of agility in different disciplines. In Proceedings of the 2004 ACM Workshop on Interdisciplinary Software Engineering Research, Newport Beach, CA, USA, 5 November 2004; pp. 37–44. [Google Scholar]
  17. State of Agile Report. Available online: https://stateofagile.com/ (accessed on 4 October 2023).
  18. Ciancarini, P.; Giancarlo, R.; Grimaudo, G. Scrum@PA: Tailoring an Agile Methodology to the Digital Transformation in the Public Sector. Information 2024, 15, 110. [Google Scholar] [CrossRef]
  19. Kadenic, M.D.; Koumaditis, K.; Junker-Jensen, L. Mastering scrum with a focus on team maturity and key components of scrum. Inf. Softw. Technol. 2023, 153, 107079. [Google Scholar] [CrossRef]
  20. Chow, T.; Cao, D. A survey study of critical success factors in agile software projects. J. Syst. Softw. 2008, 81, 961–971. [Google Scholar] [CrossRef]
  21. Papoutsoglou, M.; Ampatzoglou, A.; Mittas, N.; Angelis, L. Extracting knowledge from on-line sources for software engineering labor market: A mapping study. IEEE Access 2019, 7, 157595–157613. [Google Scholar] [CrossRef]
  22. Li, S.; Shi, B.; Yang, J.; Yan, J.; Wang, S.; Chen, F.; He, Q. Deep job understanding at linkedin. In Proceedings of the 43rd International ACM SIGIR Conference on Research and Development in Information Retrieval, Xi’an, China, 25–30 July 2020; pp. 2145–2148. [Google Scholar]
  23. Lappas, T. Mining career paths from large resume databases: Evidence from IT professionals. ACM Trans. Knowl. Discov. Data (TKDD) 2020, 14, 1–38. [Google Scholar] [CrossRef]
  24. 2023–24 Global Recruiting Site Trends Survey. Available online: https://www.jobboarddoctor.com/survey-results/ (accessed on 17 November 2023).
  25. Smuts, S.; Smuts, H. Society 5.0 and the Future of Work Skills for Software Engineers and Developers. 2022. Available online: http://hdl.handle.net/2263/91094 (accessed on 5 September 2023).
  26. The Scrum Guide. Available online: https://scrumguides.org/docs/scrumguide/v2020/2020-Scrum-Guide-US.pdf (accessed on 30 October 2023).
  27. Project Management Institute. Agile Practice Guide; Project Management Institute: Newtown Square, PA, USA, 2017; p. 182. [Google Scholar]
  28. Maier, P.; Ma, Z.; Bloem, R. Towards a secure scrum process for agile web application development. In Proceedings of the 12th International Conference on Availability, Reliability and Security, Calabria, Italy, 29 August–1 September 2017; pp. 1–8. [Google Scholar]
  29. Kashive, N.; Khanna, V.T. Emerging HR analytics role in a crisis: An analysis of LinkedIn data. Compet. Rev. Int. Bus. J. 2023, 33, 1179–1204. [Google Scholar] [CrossRef]
  30. Hsia-Ching, C.; Chen-Ya, W.; Hawamdeh, S. Emerging trends in data analytics and knowledge management job market: Extending KSA framework. J. Knowl. Manag. 2019, 23, 664–686. [Google Scholar] [CrossRef]
  31. Garg, R.; Kumar, R.; Garg, S. MADM-based parametric selection and ranking of E-learning websites using fuzzy COPRAS. IEEE Trans. Educ. 2018, 62, 11–18. [Google Scholar] [CrossRef]
  32. Farshidi, S.; Jansen, S.; Deldar, M. A decision model for programming language ecosystem selection: Seven industry case studies. Inf. Softw. Technol. 2021, 139, 106640. [Google Scholar] [CrossRef]
  33. Shvetsova, O.; Feroz, M.; Salkutsan, S.; Efimov, A. Artificial Intelligence Application for Healthcare Industry: Cases of Developed and Emerging Markets; Lecture Notes in Networks and Systems, 673 LNNS; Springer Nature: Singapore, 2023; pp. 419–432. [Google Scholar]
  34. Mendes, F.F.; Mendes, E.; Salleh, N. The relationship between personality and decision-making: A Systematic literature review. Inf. Softw. Technol. 2019, 111, 50–71. [Google Scholar] [CrossRef]
  35. Sadabadi, A.T.; Kama, N. Generating policy for software project management decision support paradigm. In Proceedings of the 2014 IEEE 5th International Conference on Software Engineering and Service Science, Beijing, China, 27–29 June 2014; IEEE: New York, NY, USA, 2014; pp. 58–63. [Google Scholar]
  36. İmamoğlu, M.Y.; Çetinkaya, D. A rule based decision support system for programming language selection. In Proceedings of the 2017 2nd International Conference on Knowledge Engineering and Applications (ICKEA), London, UK, 21–23 October 2017; pp. 71–75. [Google Scholar]
  37. Eastham, J.; Tucker, D.J.; Varma, S.; Sutton, S.M. PLM software selection model for project management using hierarchical decision modeling with criteria from PMBOK® knowledge areas. Eng. Manag. J. 2014, 26, 13–24. [Google Scholar] [CrossRef]
  38. Akbar, S.; Ullah, R.; Khan, R.; Asghar, I.; Zubair, M.; Zheng, Z. A Multi-Criteria Decision-Making Framework for Software Project Management Tool Selection. In Proceedings of the 2023 9th International Conference on Computer Technology Applications, Vienna, Austria, 10–12 May 2023; pp. 184–191. [Google Scholar]
  39. Capturing the Value of Project Management through Decision Making. Available online: https://www.pmi.org/learning/thought-leadership/pulse/capture-value-decision-making (accessed on 15 October 2023).
  40. Standish Group 2015 Chaos Report—Q&A with Jennifer Lynch. Available online: https://www.infoq.com/articles/standish-chaos-2015/ (accessed on 2 September 2023).
  41. BMG Research Factors in Project Success; The Association for Project Management (APM): Birmingham, UK, 2014.
  42. Al Neimat, T. Why IT projects fail. Proj. Perfect White Pap. Collect. 2005, 8, 1–8. [Google Scholar]
  43. Paklina, S.; Shakina, E. Which professional skills value more under digital transformation? J. Econ. Stud. 2022, 49, 1524–1547. [Google Scholar] [CrossRef]
  44. Deutsch, M.S. An exploratory analysis relating the software project management process to project success. IEEE Trans. Eng. Manag. 1991, 38, 365–375. [Google Scholar] [CrossRef]
  45. Florea, R.; Stray, V.; Sjøberg, D.I. On the roles of software testers: An exploratory study. J. Syst. Softw. 2023, 111742. [Google Scholar] [CrossRef]
  46. Potter, L.E. Preparing for projects: It student self-evaluation of technical and professional skills. In Proceedings of the 2020 on Computers and People Research Conference, Nuremberg, Germany, 19–21 June 2020; pp. 63–69. [Google Scholar]
  47. Hranický, R.; Breitinger, F.; Ryšavý, O.; Sheppard, J.; Schaedler, F.; Morgenstern, H.; Malik, S. What do incident response practitioners need to know? A skillmap for the years ahead. Forensic Sci. Int. Digit. Investig. 2021, 37, 301184. [Google Scholar] [CrossRef]
  48. Romanko, O.; O’Mahony, M. The use of online job sites for measuring skills and labour market trends: A review. In Economic Statistics Centre of Excellence (ESCoE) Technical Reports; Office for National Statistics: Newport, UK, 2022. [Google Scholar]
  49. Galster, M.; Mitrovic, A.; Malinen, S.; Holland, J. What soft skills does the software industry* really* want? An exploratory study of software positions in New Zealand. In Proceedings of the 16th ACM/IEEE International Symposium on Empirical Software Engineering and Measurement, New Orleans, LA, USA, 26–27 October 2022; pp. 272–282. [Google Scholar]
  50. Gottipati, S.; Shim, K.J.; Sahoo, S. Glassdoor Job Description Analytics—Analyzing Data Science Professional Roles and Skills. In Proceedings of the 2021 IEEE Global Engineering Education Conference (EDUCON), Vienna, Austria, 20–23 April 2021; pp. 1329–1336. [Google Scholar]
  51. Smaldone, F.; Ippolito, A.; Lagger, J.; Pellicano, M. Employability skills: Profiling data scientists in the digital labour market. Eur. Manag. J. 2022, 40, 671–684. [Google Scholar] [CrossRef]
  52. Sun, Y.; Zhuang, F.; Zhu, H.; He, Q.; Xiong, H. Cost-effective and interpretable job skill recommendation with deep reinforcement learning. In Proceedings of the Web Conference, Virtual, Slovenia, 19–23 April 2021; pp. 3827–3838. [Google Scholar]
  53. Anwar, Z.; Bibi, N.; Ahsan, A. Expertise based skill management model for effective project resource allocation under stress in software industry of Pakistan. In Proceedings of the 2013 6th International Conference on Information Management, Innovation Management and Industrial Engineering, Xi’an, China, 23–24 November 2013; pp. 509–513. [Google Scholar]
  54. Cui, B.; Hong, W.; Zhu, J.; Wu, X. Digitalization capability evaluation system and practice. In Proceedings of the 2021 16th International Conference on Computer Science & Education (ICCSE), Lancaster, UK, 17–21 August 2021; pp. 164–167. [Google Scholar]
  55. Ericsson, A.; Towne, T.J. Expertise. Wiley Interdiscip. Rev. Cogn. Sci. 2010, 1, 404–416. [Google Scholar] [CrossRef] [PubMed]
  56. Stylianou, C.; Andreou, A.S. Investigating the impact of developer productivity, task interdependence type and communication overhead in a multi-objective optimization approach for software project planning. Adv. Eng. Softw. 2016, 98, 79–96. [Google Scholar] [CrossRef]
  57. Vega-Velázquez, M.Á.; García-Nájera, A.; Cervantes, H. A survey on the Software Project Scheduling Problem. Int. J. Prod. Econ. 2018, 202, 145–161. [Google Scholar] [CrossRef]
  58. Ramirez, A.; Romero, J.R.; Ventura, S. A survey of many-objective optimisation in search-based software engineering. J. Syst. Softw. 2019, 149, 382–395. [Google Scholar] [CrossRef]
  59. Ferrucci, F.; Harman, M.; Sarro, F. Search-based software project management. Softw. Proj. Manag. Chang. World 2014, 373–399. [Google Scholar]
  60. McKim, C.A. The value of mixed methods research: A mixed methods study. J. Mix. Methods Res. 2017, 11, 202–222. [Google Scholar] [CrossRef]
  61. Oates, B.J.; Griffiths, M.; McLean, R. Researching Information Systems and Computing, 2nd ed.; Sage: London, UK, 2022. [Google Scholar]
  62. Petersen, K.; Feldt, R.; Mujtaba, S.; Mattsson, M. Systematic mapping studies in software engineering. In Proceedings of the 12th International Conference on Evaluation and Assessment in Software Engineering (EASE), Bari, Italy, 26–27 June 2008; pp. 1–10. [Google Scholar]
  63. Research, Journal Articles & Databases. Available online: https://libguides.tees.ac.uk/computing/research (accessed on 2 September 2023).
  64. Wang, C.; Cui, P.; Daneva, M.; Kassab, M. Understanding what industry wants from requirements engineers: An exploration of RE jobs in Canada. In Proceedings of the 12th ACM/IEEE International Symposium on Empirical Software Engineering and Measurement, Oulu, Finland, 11–12 October 2018; pp. 1–10. [Google Scholar]
  65. Wang, C.; Tang, Y.; Liang, P.; Daneva, M.; van Sinderen, M. What industry wants from requirements engineers in China? An exploratory and comparative study on RE job ads. In Proceedings of the 14th ACM/IEEE International Symposium on Empirical Software Engineering and Measurement (ESEM), Bari, Italy, 5–9 October 2020; pp. 1–11. [Google Scholar]
  66. Pejic-Bach, M.; Bertoncel, T.; Meško, M.; Krstić, Ž. Text mining of industry 4.0 job advertisements. Int. J. Inf. Manag. 2020, 50, 416–431. [Google Scholar] [CrossRef]
  67. Europe: Human Geography. Available online: https://education.nationalgeographic.org/resource/europe-human-geography/ (accessed on 10 November 2023).
  68. Microsoft Power BI. Available online: https://powerbi.microsoft.com/en-gb/desktop/ (accessed on 5 September 2023).
  69. European Centre for the Development of Vocational Training. Online Job Vacancies and Skills Analysis: A Cedefop Pan-European Approach; Cedefop: Luxembourg, 2019.
  70. Oanda Currency Converter. Available online: https://www.oanda.com/ (accessed on 5 November 2023).
  71. Hidayati, A.; Budiardjo, E.K.; Purwandari, B. Hard and soft skills for scrum global software development teams. In Proceedings of the 3rd International Conference on Software Engineering and Information Management, Sydney, NSW, Australia, 12–15 January 2020; pp. 110–114. [Google Scholar]
  72. Vadlamani, S.L.; Baysal, O. Studying software developer expertise and contributions in Stack Overflow and GitHub. In Proceedings of the 2020 IEEE International Conference on Software Maintenance and Evolution (ICSME), Adelaide, Australia, 28 September–2 October 2020; pp. 312–323. [Google Scholar]
  73. Kadenic, M.D.; de Jesus Pacheco, D.A.; Koumaditis, K.; Tjørnehøj, G.; Tambo, T. Investigating the role of Product Owner in Scrum teams: Differentiation between organisational and individual impacts and opportunities. J. Syst. Softw. 2023, 206, 111841. [Google Scholar] [CrossRef]
  74. Daneva, M.; Wang, C.; Hoener, P. What the job market wants from requirements engineers? An empirical analysis of online job ads from the Netherlands. In Proceedings of the 2017 ACM/IEEE International Symposium on Empirical Software Engineering and Measurement (ESEM), Toronto, ON, Canada, 9–10 November 2017; pp. 448–453. [Google Scholar]
  75. Unger-Windeler, C.; Schneider, K. Expectations on the Product Owner role in systems engineering-A scrum team’s point of view. In Proceedings of the 2019 45th Euromicro Conference on Software Engineering and Advanced Applications (SEAA), Kallithea-Chalkidiki, Greece, 28–30 August 2019; 276–283. [Google Scholar]
  76. Pham, Y.D.; Montgomery, L.; Maalej, W. Renovating requirements engineering: First thoughts to shape requirements engineering as a profession. In Proceedings of the 2019 IEEE 27th International Requirements Engineering Conference Workshops (REW), Jeju, Republic of Korea, 23–27 September 2019; pp. 7–11. [Google Scholar]
  77. Gupta, R.K.; Reddy, P.M. Adapting agile in a globally distributed software development. In Proceedings of the 2016 49th Hawaii International Conference on System Sciences (HICSS), Koloa, HI, USA, 5–8 January 2016; pp. 5360–5367. [Google Scholar]
  78. Petrescu, M.A.; Motogna, S.; Berciu, L. Women in Scrum Master Role: Challenges and Opportunities. In Proceedings of the 2023 IEEE/ACM 4th Workshop on Gender Equity, Diversity, and Inclusion in Software Engineering (GEICSE), Melbourne, Australia, 20 May 2023; pp. 49–55. [Google Scholar]
  79. Khurana, M.; Kaur, K. Impact of Agile Scrum Methodology on Team’s Productivity and Client Satisfaction–A Case Study. In Proceedings of the 2021 3rd International Conference on Advances in Computing, Communication Control and Networking (ICAC3N), Greater Noida, India, 17–18 December 2021; pp. 1686–1691. [Google Scholar]
  80. Portman, H. The Ideal Scrum Master. XI. 1–7. 2022. Available online: https://pmworldlibrary.net/ (accessed on 28 October 2023).
  81. Shastri, Y.; Hoda, R.; Amor, R. The role of the project manager in agile software development projects. J. Syst. Softw. 2021, 173, 110871. [Google Scholar] [CrossRef]
  82. Groeneveld, W.; Becker, B.A.; Vennekens, J. Soft skills: What do computing program syllabi reveal about non-technical expectations of undergraduate students? In Proceedings of the 2020 ACM Conference on Innovation and Technology in Computer Science Education, Trondheim, Norway, 15–19 June 2020; pp. 287–293. [Google Scholar]
  83. Stamm, S. Desired Qualifications Sought in Entry Level Software Engineers. In Proceedings of the 54th ACM Technical Symposium on Computer Science Education, Toronto, ON, Canada, 15–18 March 2023; pp. 854–860. [Google Scholar]
  84. Galster, M.; Mitrovic, A.; Malinen, S.; Holland, J.; Peiris, P. Soft skills required from software professionals in New Zealand. Inf. Softw. Technol. 2023, 160, 107232. [Google Scholar] [CrossRef]
  85. Christensen, E.L.; Paasivaara, M. Learning soft skills through distributed software development. In Proceedings of the International Conference on Software and System Processes and International Conference on Global Software Engineering, Pittsburgh, PA, USA, 19–20 May 2022; pp. 93–103. [Google Scholar]
  86. Data Analysis Expressions (DAX) Reference. Available online: https://learn.microsoft.com/en-us/dax/ (accessed on 7 November 2023).
  87. Research Ethics. Available online: https://www.tees.ac.uk/sections/research/ethics.cfm (accessed on 12 November 2023).
  88. The GDPR. Available online: https://www.legislation.gov.uk/ukpga/2018/12/part/2/chapter/2/enacted (accessed on 24 November 2023).
  89. Rêgo, B.S.; Lourenço, D.; Moreira, F.; Pereira, C.S. Digital transformation, skills and education: A systematic literature review. Ind. High. Educ. 2023, 09504222231208969. [Google Scholar] [CrossRef]
  90. Luo, Y.; Liang, P.; Wang, C.; Shahin, M.; Zhan, J. Characteristics and challenges of low-code development: The practitioners’ perspective. In Proceedings of the 15th ACM/IEEE International Symposium on Empirical Software Engineering and Measurement (ESEM), Bari, Italy, 11–15 October 2021; pp. 1–11. [Google Scholar]
  91. Richardson, C.; Rymer, J.R. Vendor Landscape: The Fractured, Fertile Terrain of Low-Code Application Platforms; Forrester: Cambridge, MA, USA, 2016; Volume 12. [Google Scholar]
  92. Poe, L.; Mew, L. The effects of using the agile methodology as an instructional format for software development courses. Ind. High. Educ. 2022, 36, 638–646. [Google Scholar] [CrossRef]
  93. Gürcan, F.; Taentzer, G. Using Microsoft PowerApps, Mendix and OutSystems in two development scenarios: An experience report. In Proceedings of the 2021 ACM/IEEE International Conference on Model Driven Engineering Languages and Systems Companion (MODELS-C), Fukuoka, Japan, 10–15 October 2021; pp. 67–72. [Google Scholar]
  94. Goulart, V.G.; Liboni, L.B.; Cezarino, L.O. Balancing skills in the digital transformation era: The future of jobs and the role of higher education. Ind. High. Educ. 2022, 36, 118–127. [Google Scholar] [CrossRef]
  95. Change Chrome Languages and Translate Web Pages. Available online: https://support.google.com/chrome/answer/173424 (accessed on 28 October 2023).
Figure 1. The overall literature review process.
Systems 12 00149 g001
Figure 2. Research process model.
Systems 12 00149 g002
Figure 3. Research process model.
Systems 12 00149 g003
Figure 4. Skill categorisation of associate level.
Systems 12 00149 g004
Figure 5. Overall major and minor skill counts.
Systems 12 00149 g005
Figure 6. The industry standard values.
Systems 12 00149 g006
Figure 7. Standard industry position of the employee.
Systems 12 00149 g007
Figure 8. Domain model of SEEM.
Systems 12 00149 g008
Figure 9. Microflow of the initial rating.
Systems 12 00149 g009
Figure 10. User interfaces of SEEM.
Systems 12 00149 g010
Figure 11. Main values of SEEM.
Systems 12 00149 g011
Table 1. Factors of skill classification.
StudyJob Advertisements (e.g., Job Boards/
Professional Social Networks
Skill Categorisation (e.g., Soft, Hard, Technical)Role-Specific SkillsExperience-Level Specific SkillsSalarySkill Evaluation
[21]YesYesNoNoNoNo
[23]YesNoNoNoNoNo
[25]NoNoYesNoNoYes
[36]YesNoNoNoNoNo
[46]NoYesNoNoNoYes
[47]YesYesYesNoNoYes
[48]YesYesYesNoYesNo
[49]YesYesYesNoNoNo
[50]YesYesYesNoNoNo
[51]YesYesYesNoNoNo
[52]YesNoNoNoYesNo
[53]NoYesNoYesNoYes
Current studyYesYesYesYesYesYes
Table 2. Keywords and synonyms.
KeywordsSynonyms/Other Names
SkillExpertise, competence
ScrumScrum roles, scrum teams
Software projectsIT projects
ModelApplication, systems, frameworks
Digital transformation-
Job advertisementsJob adverts, job posts, vacancies
Job boardsJob portals
Table 3. Count of sample data.
Job RoleExperience LevelCodeTotal EntriesSelected Entries
Product Owner (PO)EntryPOE140100
AssociatePOA402100
Mid-seniorPOM811100
Scrum Master (SM)EntrySME112100
AssociateSMA192100
Mid-seniorSMM1229100
Web Developer (WD)EntryWDE425100
AssociateWDA115100
Mid-seniorWDM263100
Total3689900
Table 4. Factors used for data extraction.
Extracted DataType of DataLocated in the AdvertResearch Objective
SkillsUnstructuredJob description1, 2
SalaryUnstructured
Experience yearsUnstructuredJob description or header section2–4
Experience levelStructuredHeader section as predefined value1–4
Table 5. Structure of data collection.
Job PostsExperience LevelExperience Years (ExYrs)Minimum Salary (MinSal)Maximum Salary (MaxSal)S1S2S3
P1EntryExYrs 1MinSal 1MaxSal 1101
P2EntryExYrs 2MinSal 2MaxSal 2011
P3EntryExYrs 3MinSal 3MaxSal 3111
P4EntryExYrs 4MinSal 4MaxSal 4110
Table 6. Refined themes from the literature.
Scrum RolesTechnical SkillsSoft Skills
Product owner [19,73,74,75,76,77]Overall strategic and visionImprove team productivityLanguage fluencyConceptual skills
Return on investment (ROI) responsibilityProduct delivery and release managementTeamwork and collaborationProblem solving and decision making
Customer satisfactionRisk assessmentCommunication skillsSelf-organisation
Business savvy Analytical skillsInnovation and creativity
Overall domain knowledge Responsibility and accountabilityIntrapersonal skills
Lead product lifecycle FlexibilityLeadership
Product backlog management Customer and stakeholder orientationValidation and negotiation
Scrum master [19,78,79,80,81]Databases and InfrastructureScrum methodologyTeamwork and collaborationServant leadership
Programming and technical skillsAgile techniquesManagementPlanning and organisation skills
Software engineeringKnowledge about the project domainNegotiationCreativity and innovation
ArchitectureCommunicationProblem solving and decision makingActive listening
Quality and testingFlexibilityFacilitating
Improve team productivity Mentoring, coaching, and teaching
Process improvement Coordinating
Software development
team [71,72,82,83,84,85]
Programming and technicalSoftware engineering best practicesCommunicationIntrapersonal skills
Agile and scrum expertiseSoftware integration and cloud development techniquesAnalytical thinkingOrganisational and planning
Database Teamwork and collaborativeWillingness to learn
Vision and requirements LeadershipCreativity and innovation
Self-tracking and time-tracking tools Problem solving and decision makingInternal/external stakeholder management
Debugging skills and testing tools Language fluencyMentoring
Table 7. Industry skills in demand.
Scrum RolesTechnical SkillsSoft Skills
Product ownerScrum methodologyDesigning knowledgeCoordinating skill
Software quality managementProject management tools
Other agile methodologiesMicrosoft and other tools
IT and software knowledgeProduct road mapping
Scrum masterIdentify and eliminate obstaclesProject deliveryWillingness to learn
Other agile methodologiesProduct management skillsAnalytical skills
Internal and external stakeholder managementCustomer interactionLanguage fluency
Project tracking and toolsModerating workshopsIntrapersonal skills
Agile scaling frameworks
Web developerFrontend web technologies and frameworksCMSFlexible and adaptability
Backend web technologies and frameworksWeb performance and optimisationAccessibility and usability
Web design and toolsMicrosoft and other toolsCommitted and responsible
Table 8. Possible lack of progression patterns.
EntryAssociateMid-Senior
MinorMajorMinor
MajorMinorMajor
MajorMajorMinor
MajorMinorMinor
Table 9. Description of variables.
Variable/NotationInterpretation
S m a x Maximum salary in a dataset
S m i n Minimum salary in a dataset
S d i f f Salary difference between actual and expected
E m a x Maximum experience in a dataset
E m i n Minimum experience in a dataset
S e x p Expected salary for a given experience in industry
S a Actual salary from the recruited company in GBP
E a Actual previous work experience in years
Table 10. Description of individual skill variables.
Variable/NotationInterpretation
E D i f f ( a v g ) Role-specific average experience difference between two sequence levels
D y e a r Working days per year
T d a y Working hours per day
H n e x t Total hours to work until next level
F ( m a j o r ) Role-specific frequency count for majors
F ( m i n o r ) Role-specific frequency count for minors
S K ( m a j o r ) Role-specific major skills count
S K ( m i n o r ) Role-specific minor skills count
H ( m a j o r ) Hours per major skill
H ( m i n o r ) Hours per minor skill
Table 11. An example of a skill matrix [47].
Skills R 1 R 2 R 3 R 4 R 5 R 6 R 7 R 8
DFIR (L1)XXXXXXXX
         L2 skillX XXX XX
               L3 skill XX X
               L3 skillX XXX X
                    L4 skill X X
                    L4 skillX XX
         L2 skillXXX XX X
               L3 skillX X
               L3 skill X X
Each row represents the skill levels from L1 to L4 as tree-based classification and each column represents a data record ( R 1 , R 2 , ).
Disclaimer/Publisher’s Note: The statements, opinions and data contained in all publications are solely those of the individual author(s) and contributor(s) and not of MDPI and/or the editor(s). MDPI and/or the editor(s) disclaim responsibility for any injury to people or property resulting from any ideas, methods, instructions or products referred to in the content.

