Article

Performance Evaluation and Influencing Factors of Scientific Communication in Research Institutions

1
School of Economics and Management, University of Chinese Academy of Sciences, 3 Zhongguancun Nanyitiao, Beijing 100190, China
2
Department of General Administration, Chinese Academy of Sciences, 52 Sanlihe Road, Beijing 100864, China
3
MOE Social Science Laboratory of Digital Economic Forecasts and Policy Simulation at UCAS, 3 Zhongguancun Nanyitiao, Beijing 100190, China
4
Key Laboratory of Big Data Mining and Knowledge Management, Chinese Academy of Sciences, 80 Zhongguancun East Road, Beijing 100190, China
*
Author to whom correspondence should be addressed.
Systems 2024, 12(6), 192; https://doi.org/10.3390/systems12060192
Submission received: 4 April 2024 / Revised: 25 May 2024 / Accepted: 29 May 2024 / Published: 30 May 2024

Abstract

:
Scientific communication holds a pivotal role within research institutions. This study establishes three distinct categories of indicators, tailored to the unique attributes of these institutions, aiming to assess their performance in scientific communication. Employing a rigorous two-stage data envelopment analysis (DEA) approach, we meticulously calculate output efficiency, feedback efficiency, and overall efficiency. Subsequently, we cluster the efficiency outcomes and delve into the factors that influence them. Drawing from the clustering insights and identified influencing factors, we formulate targeted scientific communication strategies tailored to the needs of these research institutions.

1. Introduction

The essence of scientific advancement and technological innovation lies in effective communication, a component often underestimated yet critical to unlocking a nation’s full innovative potential. In recent decades, fostering robust scientific communication has emerged as a pressing imperative for societal growth, aligned with the broader aspirations of an innovation-driven society. This endeavor assumes profound importance in elevating public scientific literacy and harnessing innovation as the primary engine for societal development.
Inadequate attention to scientific communication can significantly stunt the growth and diffusion of technological breakthroughs, emphasizing the need to accord it equal, if not greater, significance than the research itself. Such communication connects the esoteric world of research with the general populace, ensuring that the fruits of scientific labor are not confined within the ivory towers of academia but rather translated into tangible societal benefits.
Leading research institutions are responsible for being the forerunners in this realm, charged with disseminating their findings objectively and precisely while actively engaging in public outreach efforts aimed at science popularization. They must also serve as custodians of scientific integrity, celebrating the achievements of their researchers and promoting scientific temperament and the inherent values of scientific inquiry.
As we strive to optimize the allocation of resources dedicated to scientific communication and forge impactful collaborations with media organizations, the imperative for a comprehensive, objective assessment of research institutions’ performance in this domain becomes clear. Such an evaluation can inform strategies, drive institutional reforms, and guide management practices, ensuring that scientific communication remains at the forefront of our collective endeavor toward a knowledge-driven future.
It is important to emphasize that the research institutions addressed in this study pertain to organizations with well-defined research directions and objectives, specializing in in-depth research and development within specific fields. Scientific communication can increase public recognition of research institutions and obtain more financial support. The production of scientific achievements and the attainment of societal recognition are of paramount importance to these institutions. Therefore, it becomes imperative for them to prioritize and actively pursue effective scientific communication. Based on this premise, our study addresses a pivotal research question: How can we effectively measure and assess the scientific communication performance of research institutions, and what are the key factors that shape this performance?
Our study makes several significant contributions to the field:
  • Firstly, we introduce a comprehensive and objective evaluation framework tailored to research institutions. The research institutions discussed in this paper only include those in the field of natural sciences whose main work is scientific research. This framework incorporates a scientific communication performance evaluation index system and utilizes the two-stage DEA method to assess efficiency. This approach ensures a rigorous and unbiased assessment of scientific communication performance, considering the unique characteristics of research institutions.
  • Secondly, our study employs advanced analytical techniques, including K-means clustering and the Tobit Model, to delve deeper into the similarities and differences among research institutions. This analysis reveals critical patterns and identifies the influencing factors that impact scientific communication efficiency. These insights provide a deeper understanding of the factors that drive performance variations across institutions.
  • Lastly, based on our evaluation and analysis findings, we offer practical recommendations tailored to enhance the scientific communication performance of research institutions. These recommendations aim to guide institutions in leveraging their strengths, addressing weaknesses, and capitalizing on opportunities for improvement. By implementing these recommendations, institutions can foster a more robust scientific communication ecosystem, leading to enhanced research outcomes and a more significant impact.
This study contributes to the existing literature by providing a comprehensive evaluation framework, identifying key influencing factors, and offering practical guidance for improving scientific communication performance in research institutions. Our findings have implications for researchers, policymakers, and institutional leaders seeking to enhance the effectiveness and impact of scientific communication within their organizations.
The organization of this paper proceeds as follows. Section 2 reviews pertinent literature on scientific communication and efficiency evaluation, providing a theoretical backdrop for our study. Section 3 introduces the research methods, specifically the two-stage DEA and Tobit approaches. In Section 4, we employ our indicator system to calculate the two-stage efficiency of research institutions and categorize them into distinct clusters. Additionally, we delve into the key factors influencing scientific communication efficiency. Finally, Section 5 concludes our findings and offers recommendations tailored to research institutions.

2. Literature Review

2.1. Scientific Communication

Throughout time, issues pertaining to science communication have garnered significant attention from numerous scholars. Burns et al. [1] defined scientific communication as the utilization of methods aimed at generating awareness and interest in science among people. It is with such a clear and precise definition that scientific communication can be subject to deeper discussions and effectively evaluated. Numerous researchers have put forward unique insights and targeted suggestions to further enrich our understanding of this worthy and noteworthy field. Nosek et al. [2] contended that existing norms of scientific communication are inadequate for contemporary contexts, potentially leading to diminished efficiency. Fischhoff [3] emphasized the importance of staffing, internal collaboration, and external collaboration in the realm of scientific communication. Scheufele et al. [4] asserted that inadequate evaluation methods can undermine the quality of scientific communication, whereas effective evaluations ought to take into account goals, research skills, and the potential for improvement.

2.2. Efficiency Evaluation

There are many methods for evaluating efficiency, mainly divided into subjective evaluation methods and objective evaluation methods. The subjective evaluation method is obtained by experts based on their experience to make subjective judgments and obtain weights. Classic methods include Analytic Hierarchy Process [5] and Fuzzy Comprehensive Evaluation [6]. Objective evaluation methods determine weights based on the correlation between indicators or the coefficient of variation of each indicator, such as Grey Relational Analysis [7] and the TOPSIS method [8]. The data envelopment analysis method used in this paper is an objective evaluation method.
Since the seminal work of Charnes et al. [9], data envelopment analysis (DEA) has been extensively be leveraged to assess the relative efficiency of decision making units (DMUs) and applied to performance evaluation in various fields. DEA method is more objective because it does not require prior assumptions about the form of the production function [10]. In recent years, the application and improvement of DEA method have emerged in an endless stream.
The DEA method is constantly improving with the increasing demand for applications. Seiford and Zhu [11], attempted to decompose the production process into subprocesses. However, if the overall efficiency and the efficiency of the two phases are calculated separately, this will make the two phases unconnected and independent of each other, affecting the accuracy of the efficiency results and often resulting in irrational evaluation results that lack realistic guidance. Kao et al. [12] proposed a multiplicative two-stage DEA method with constant returns to scale in 2008, providing a better approach for multi-stage DEA model. Within this model, inputs are processed in the first stage to produce intermediate products, which then feed into the second stage, ultimately generating outputs. When calculating the overall efficiency of the sequential two-stage DEA model, the constraints of the efficiency of the two substages are considered. By making the weight vectors of the products in between the two substages equal, the overall efficiency can be obtained as the product of the efficiency of the two substages. There are many variations of network DEA methods. Li et al. [13] proposed a two-stage DEA with additional inputs to the second stage. Kao [14] transformed a general network structure system into series stages and parallel processes, which can perform more detailed efficiency decomposition. The two-stage DEA method has been applied to real-world problems. Zhou et al. [15] proposed a novel integrated DEA-Tobit model, using a multi-period two-stage DEA model to evaluate green development efficiency (GDE) from the provincial and municipal dimensions. Although the DEA-Tobit method is widely used, there has not been any research using network DEA models in evaluating the efficiency of scientific communication. This study improves the DEA-Tobit method by combining two-stage DEA with Tobit regression to study the efficiency of scientific communication.

2.3. Scientific Communication Evaluation

Currently, there is a paucity of research on the evaluation of scientific communication. However, the development of a scientific communication evaluation system tailored to contemporary societal contexts is imperative. Such a system would not only facilitate accurate assessments of the effectiveness of scientific communication but also provide targeted recommendations for enhancing its efficiency and impact. At present, the rapid development of new media has enriched the channels for the dissemination of scientific knowledge [16] and expanded the scope of the main body of scientific knowledge dissemination [17]. It has also prompted the consideration of incorporating new media-related indicators into the evaluation of scientific communication. According to Liang X et al. [18], scholars engaging in public communication on platforms such as Twitter (now known as X), including interactions with the public, can contribute to their scientific impact and influence the effectiveness of scientific communication. As such, the likes, views, and publication numbers related to mass media have gradually become new dimensions in evaluating the effectiveness of scientific communication. Moreover, Jencen et al. [19] have explored the perspective of the audience in assessing the quality of scientific communication, recognizing the pivotal role that the audience plays in shaping the success of such efforts. However, despite the significance of audience feedback, its integration into the evaluation process remains underexplored [20]. In this study, we incorporate new media indicators and audience feedback into our evaluation system, recognizing its significance in assessing the effectiveness of scientific communication.

3. Method

3.1. Two-Stage DEA

This study innovatively divides the indicators into three categories: scientific communication input, scientific communication output, and scientific communication feedback. These three categories enable the evaluation of the scientific communication process across two distinct stages. The method we used comes from Kao et al. [12] and Liang et al. [21]. In the first stage, the inputs are defined as the scientific communication input, encompassing the resources allocated to scientific communication activities. The outputs of this stage, correspondingly, represent the scientific communication output, reflecting the achievements and results obtained from the inputs. In the second stage, the outputs of the first stage serve as inputs, feeding into the subsequent evaluation. This approach provides a comprehensive understanding of the scientific communication process and its effectiveness. The specific stages are illustrated in Figure 1.
We use the sequential two-stage DEA method in network DEA for the two-stage efficiency evaluation. Consider a scenario where there are n decision-making units, labeled as D M U j (j = 1, 2, …, n). Within the first stage, each decision-making unit is characterized by m inputs and q outputs, represented as x i j (i = 1, 2, …, m; j = 1, 2, …, n) and z p j (p = 1, 2, …, q; j = 1, 2, …, n), respectively. Notably, the outputs of the first stage, z p j , serve as intermediate products and constitute the inputs for the subsequent second stage. During the second stage, s outputs are generated, designated as y r j (r = 1, 2, …, s; j = 1, 2, …, n).
Assuming that the input weights are set as v i (i = 1, 2, …, m) for the first stage, the intermediate product weights are represented by w p (p = 1, 2, …, q), and the output weights for the second stage are denoted as u r (r = 1, 2, …, s). Within this comprehensive framework, the overall efficiency of D M U k is formulated as E k , encapsulating both stages of the process. On the other hand, the substage efficiencies, E k 1 for the first stage and E k 2 for the second stage, offer a more granular analysis, allowing for a deeper understanding of efficiency levels within each individual stage.
The weight of intermediate products is equal in the efficiency calculation of the first and second stages. According to Formulas (1)–(3), E k = E k 1 × E k 2 can be obtained. This result can connect the efficiency of the two stages together, creating a numerical connection between the overall efficiency and the efficiency of the two stages; compared to separately calculating the efficiency of two stages, it would be more meaningful:
E k = r = 1 s u r y r k i = 1 m v i x i k 1
E k 1 = p = 1 b w p z p k i = 1 m v i x i k 1
E k 2 = r = 1 s u r y r k p = 1 b w p z p k 1
The overall efficiency E k can be determined by solving the following linear programming problem:
E k = m a x r = 1 s μ r y r k s . t . r = 1 s v i x i k = 1 r = 1 s μ r y r j r = 1 s v i x i j 0 , j = 1 , 2 , , n p = 1 b w p z p j r = 1 s v i x i j 0 , j = 1 , 2 , , n r = 1 s μ r y r j p = 1 b w p z p j 0 , j = 1 , 2 , , n μ r , w p , v i 0 ; r = 1 , 2 , , s ; p = 1 , 2 , , q ; i = 1 , 2 , , m
Due to the inherent complexities surrounding optimization problems, there can be occasions where multiple optimal weight vectors exist, rendering a single unique solution elusive. This non-uniqueness poses a challenge when calculating the substage efficiencies, E k 1 and E k 2 , as these values may vary depending on the choice of optimal weights. Consequently, it becomes necessary to adopt a focused approach. For instance, we can prioritize the maximization of either the first or the second stage efficiency, while ensuring that the overall efficiency, E k , remains constant. By doing so, we can narrow down the search space and solve the corresponding programming problem effectively. To further illustrate, let us consider maximizing efficiency in the first stage:
E k 1 = m a x p = 1 b w p z p j s . t . r = 1 s μ r y r j r = 1 s v i x i j 0 , j = 1 , 2 , , n p = 1 b w p z p j r = 1 s v i x i j 0 , j = 1 , 2 , , n r = 1 s μ r y r j p = 1 b w p z p j 0 , j = 1 , 2 , , n r = 1 s μ r y r k E k r = 1 s v i x i k = 0 r = 1 s v i x i k = 1 μ r , w p , v i 0 ; r = 1 , 2 , , s ; p = 1 , 2 , , q ; i = 1 , 2 , , m
Ultimately, we can derive the efficiency of the second stage by calculating the ratio of the overall optimal efficiency, E k , to the optimal efficiency of the first stage, E k 1 , resulting in E k 2 .

3.2. Tobit Regression

Tobit regression, named after economist James Tobin [22], is a statistical method used to handle dependent variables exhibiting lower or upper truncation. This approach has gained extensive application spanning diverse economic fields, including areas such as productivity, wages, and consumption expenditure. Specifically, the uses of the Tobit model include but are not limited to addressing situations where the dependent variable is restricted, such as income data in socio-economic surveys, which may be influenced by the lower limit of the minimum wage or the upper limit of the maximum income [23]. After considering the limitation of data, this model can more accurately estimate and explain the relationship between variables. The standard model for Tobit regression is as follows:
y = β x i + u i y i = y i i f y i > 0 y i = 0 i f y i 0
where the potential dependent variable, denoted as y i , is observable only when it exceeds the value of 0, at which point it takes on the value of y i . If y i is less than or equal to 0, the observation is truncated at 0. The independent variable is represented by x i , and β stands for the regression coefficient. The error term, u i , is assumed to be independent and follows a normal distribution.
In this study, Tobit regression serves as an appropriate tool for identifying the influencing factors of efficiency values, given that these values, computed through data envelopment analysis (DEA), fall within the range of 0 to 1.

4. Results and Discussions

4.1. Indicator System

Scientific communication input refers to the strategic allocation of resources by research institutions aimed at facilitating the dissemination of scientific knowledge. The specific indicators, encompassing the number of personnel involved and the funding allocated, are comprehensively enumerated in Table 1. These metrics clearly reflect the institutions’ commitment and investment in scientific communication.
On the other hand, scientific communication output includes the achievements generated by these institutions through news coverage and online promotional efforts. Promoting on official websites or in collaboration with the media is the output of promotional content, representing the productivity of scientific communication. This includes a series of indicators, such as News Media Coverage, website operation, and social platform WeChat operation. These specific output indicators, outlined in Table 2, provide a quantitative measure of the various efforts made by institutions towards scientific communication.
Scientific communication feedback indicators serve as crucial metrics for assessing the effectiveness and quality of the institutions’ news and online promotional activities. These indicators capture the responses and engagements achieved, encompassing metrics such as the total website clicks and the readership of WeChat articles. By leveraging a scoring mechanism that takes into account both the number of coverages and the significance or influence of the respective media outlets, a quantitative measure of the institutions’ communication impact can be derived. The specific indicators used to quantify these outcomes are precisely specified in Table 3, providing a robust framework for evaluating the success and effectiveness of scientific communication efforts.

4.2. Descriptive Statistics of Indicators

We have collected scientific communication data from 41 research institutions in 2022, providing us with a comprehensive dataset for analysis. We intend to undertake preliminary processing of the collected data and compute various indicators within our established indicator system, providing quantitative insights into the scientific communication efforts of these institutions. However, it is crucial to recognize that the DEA method is particularly sensitive to outliers, which could potentially skew our results. Therefore, we have carefully screened the dataset, excluding samples with significant missing values, narrowing our focus to data collected from 37 institutions. The descriptive statistics of each indicator are presented in Table 4.

4.3. Two-Stage Efficiency

We have completed the preparatory work for the data, ensuring its accuracy and suitability for analysis. Now, we are in the process of calculating the efficiency value for scientific communication, which will provide crucial data support for our subsequent analysis.
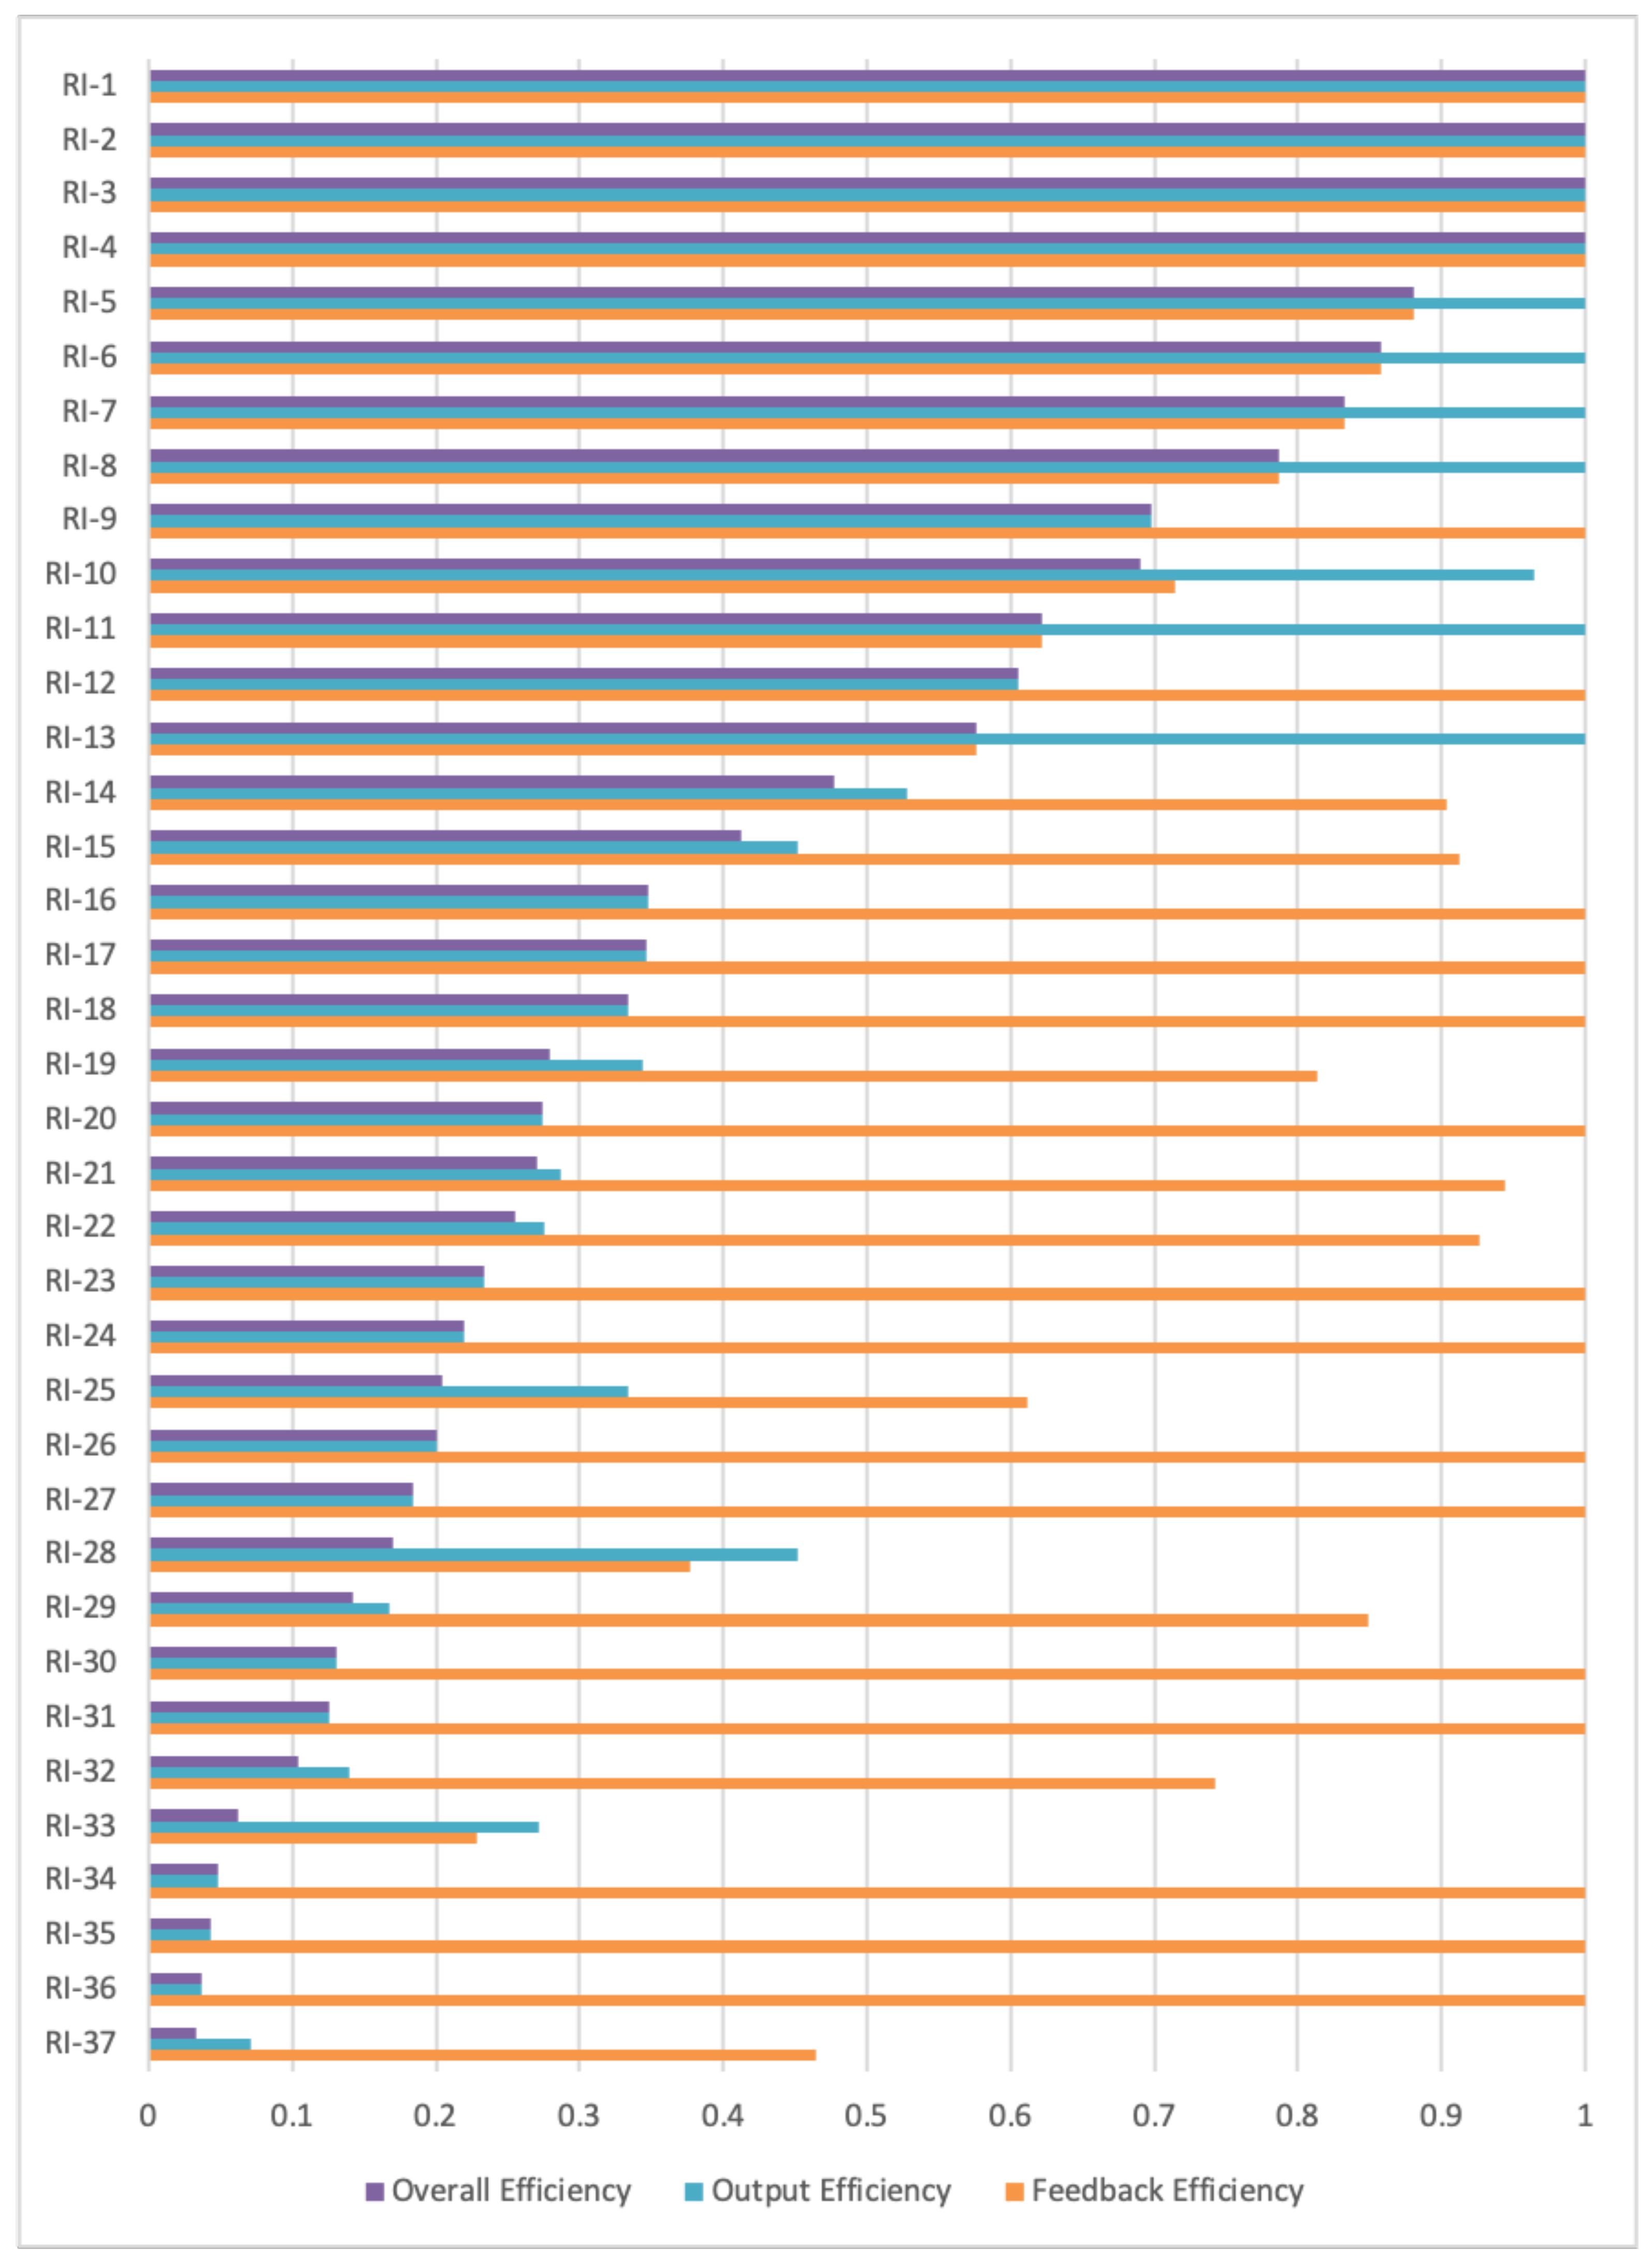
First, we employ the input data and feedback data from scientific communication activities to compute the overall efficiency value. This comprehensive calculation allows us to gain a deeper insight into the overall performance of the scientific communication process. We prioritize the calculation of the second stage, as the audience of scientific communication is the general public, and the feedback stage reflects the level of public participation, which is critical for understanding the public’s needs, preferences, and reactions to scientific topics. With the aim of maximizing the efficiency of the second stage, we calculate the efficiency value for the research institution at the feedback stage. Finally, we compute the efficiency value for the output stage by dividing the overall efficiency value by the efficiency value of the feedback stage. To ensure the precision and accuracy of our computations, we leveraged Python to determine the efficiency values for the research institutions. The results of this rigorous efficiency evaluation are presented in Figure 2, providing a visual representation of our findings that are both clear and informative.
Based on the efficiency values obtained from the two stages, we are able to offer recommendations to the research institutions. Some research institutions have high feedback efficiency but low output efficiency, such as RI-16, RI-17, etc., indicating that the quality of the content produced by the institution is high but the output is low. For these institutions, it is crucial to enhance the efficiency of content output in order to boost the production of scientific communication content. Some research institutions have high output efficiency and low feedback efficiency, such as RI-11, RI-13, etc., indicating that their output content efficiency is high, but the content quality is relatively low. This type of research institution should improve the quality of scientific communication content, create high-liquaty content, and improve output efficiency while ensuring quality.

4.4. Cluster Analysis

Clustering algorithms can be used to study the efficiency values of scientific communication. By clustering two types of scientific communication efficiency, similarities or differences in certain aspects of each research institution can be discovered. This helps to understand which research institutions have more efficient scientific communication methods and technologies. Based on the two-stage efficiency results calculated in the previous section, we will conduct cluster analysis on each research institution.
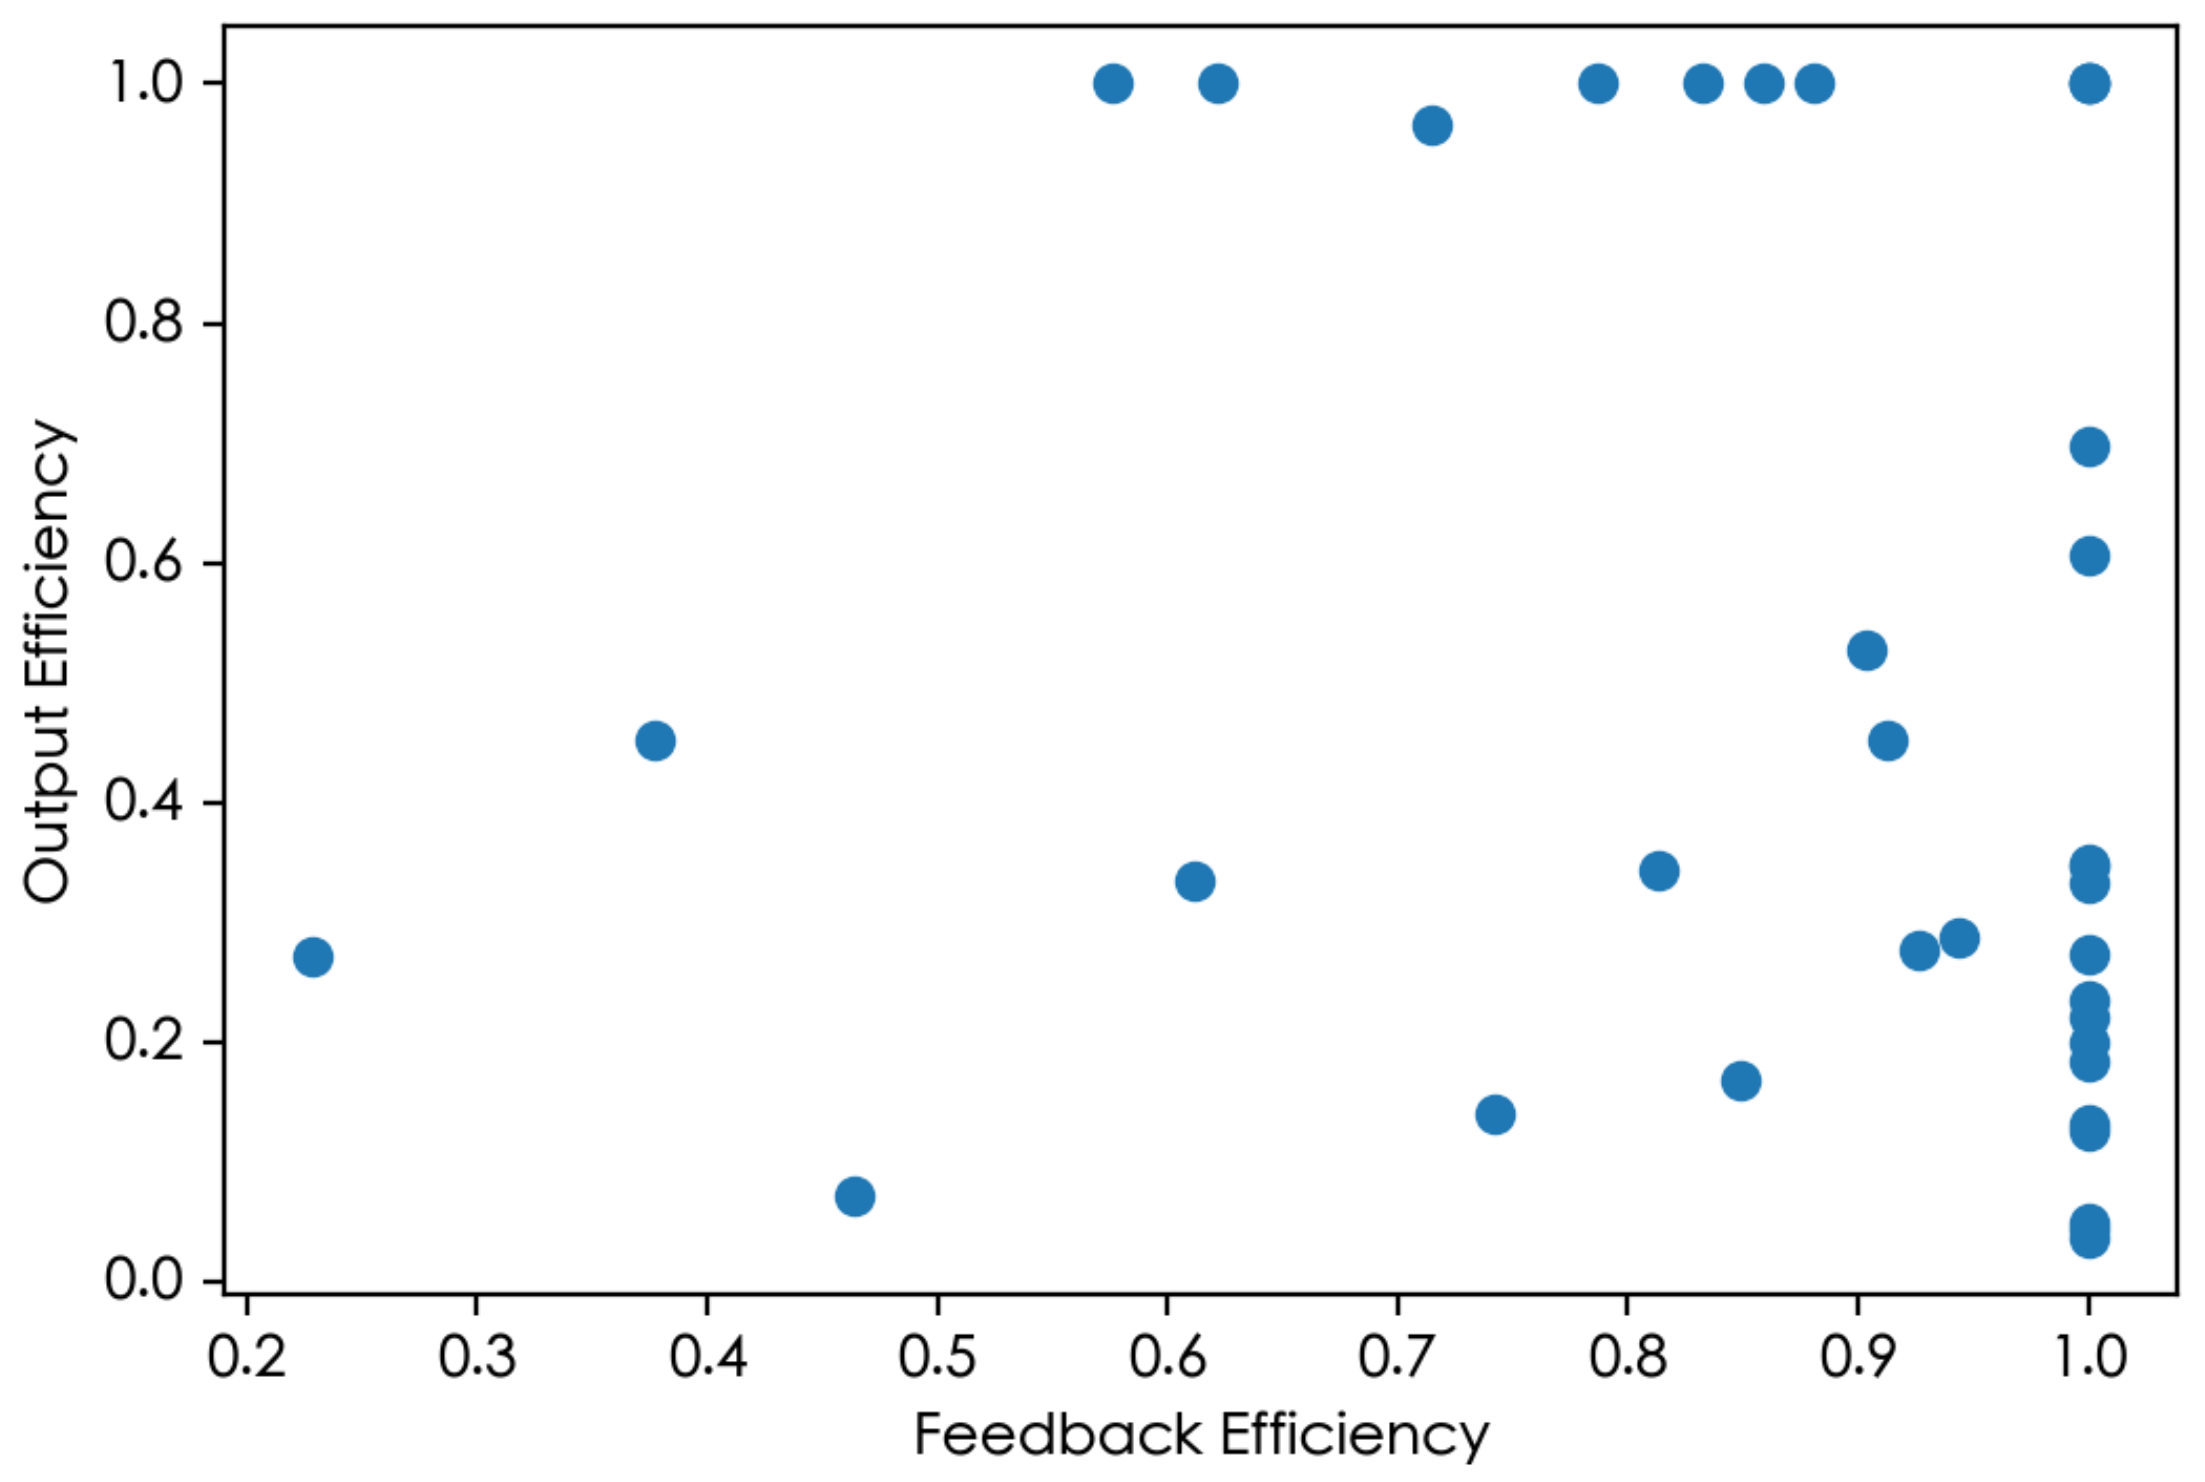
The K-means clustering algorithm, widely recognized as one of the most commonly used clustering techniques [24], designates the average value of each category’s data as its clustering center. This approach offers numerous benefits. Firstly, it is relatively simple and intuitive, making it easy to understand and implement. Secondly, it exhibits high computational efficiency on large datasets. Thirdly, it demonstrates good scalability and performs well on datasets with numerous observations. Lastly, it is widely applicable and, in most cases, produces reasonable clustering results [25]. In this study, we utilize the K-means clustering method to categorize various research institutions. By using feedback efficiency as the horizontal axis and output efficiency as the vertical axis, we can generate a scatter plot of efficiency values, as depicted in Figure 3.
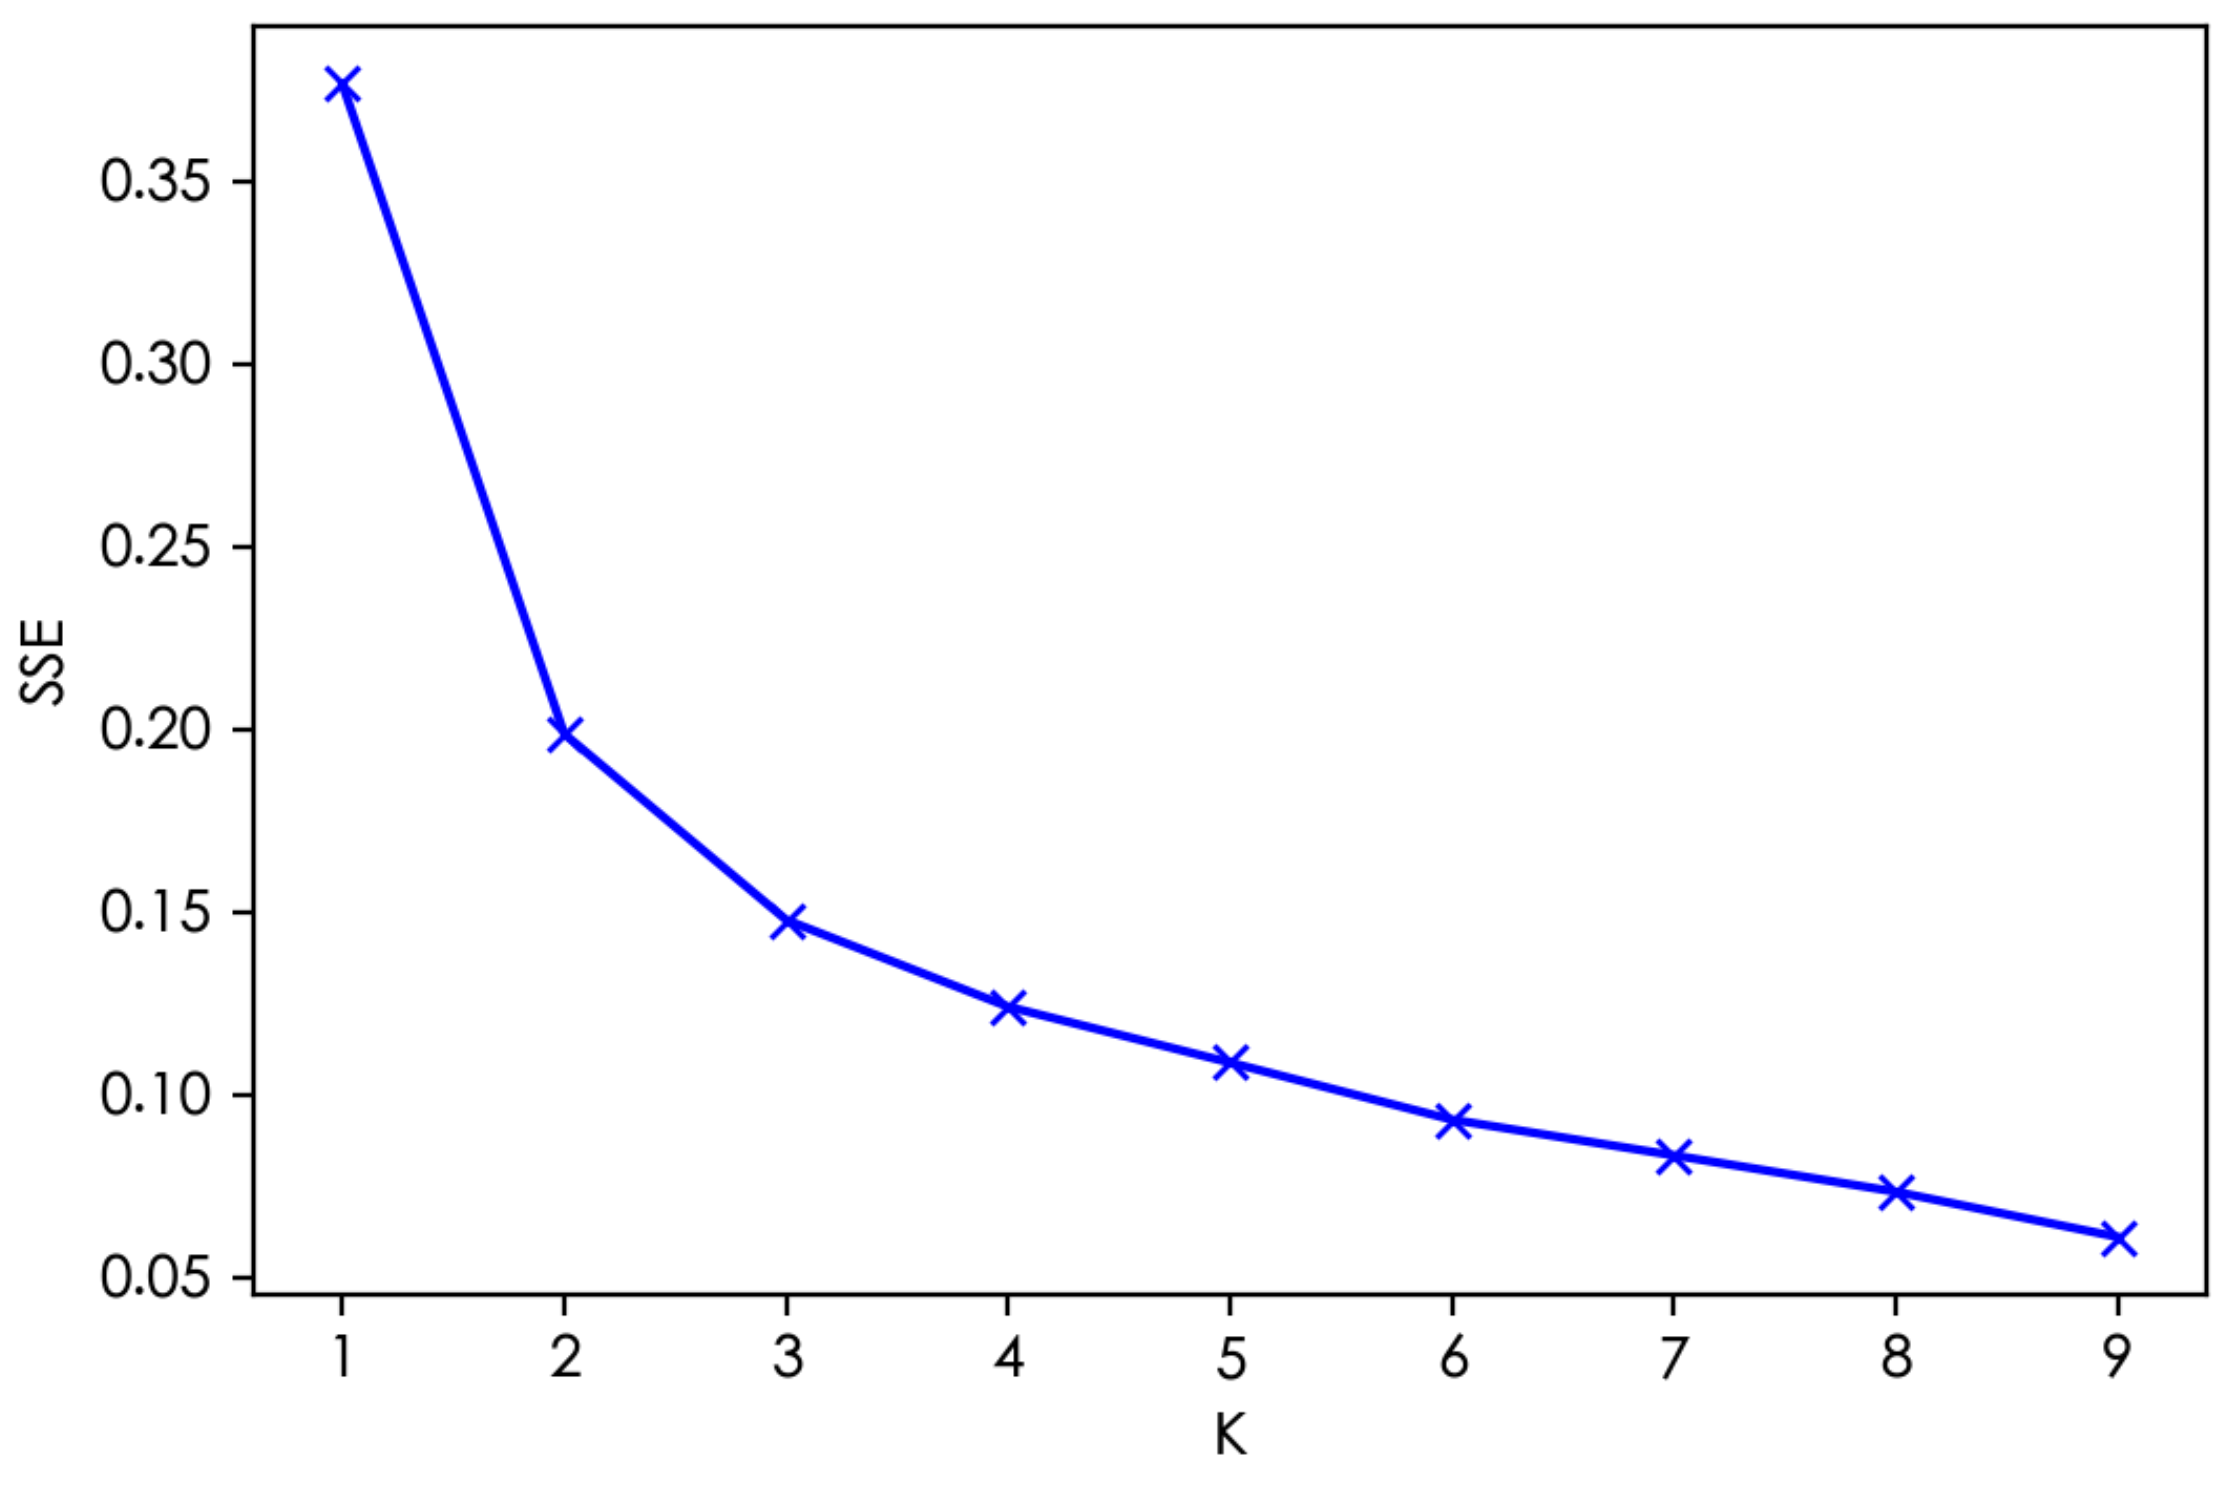
We calculate the sum of squared errors (SSE) between the data points within each cluster and their respective cluster centers. Based on the SSE, we determine the optimal number of clusters. Figure 4 illustrates the SSE variations across different numbers of clusters, K, thereby facilitating the selection of an appropriate clustering configuration.
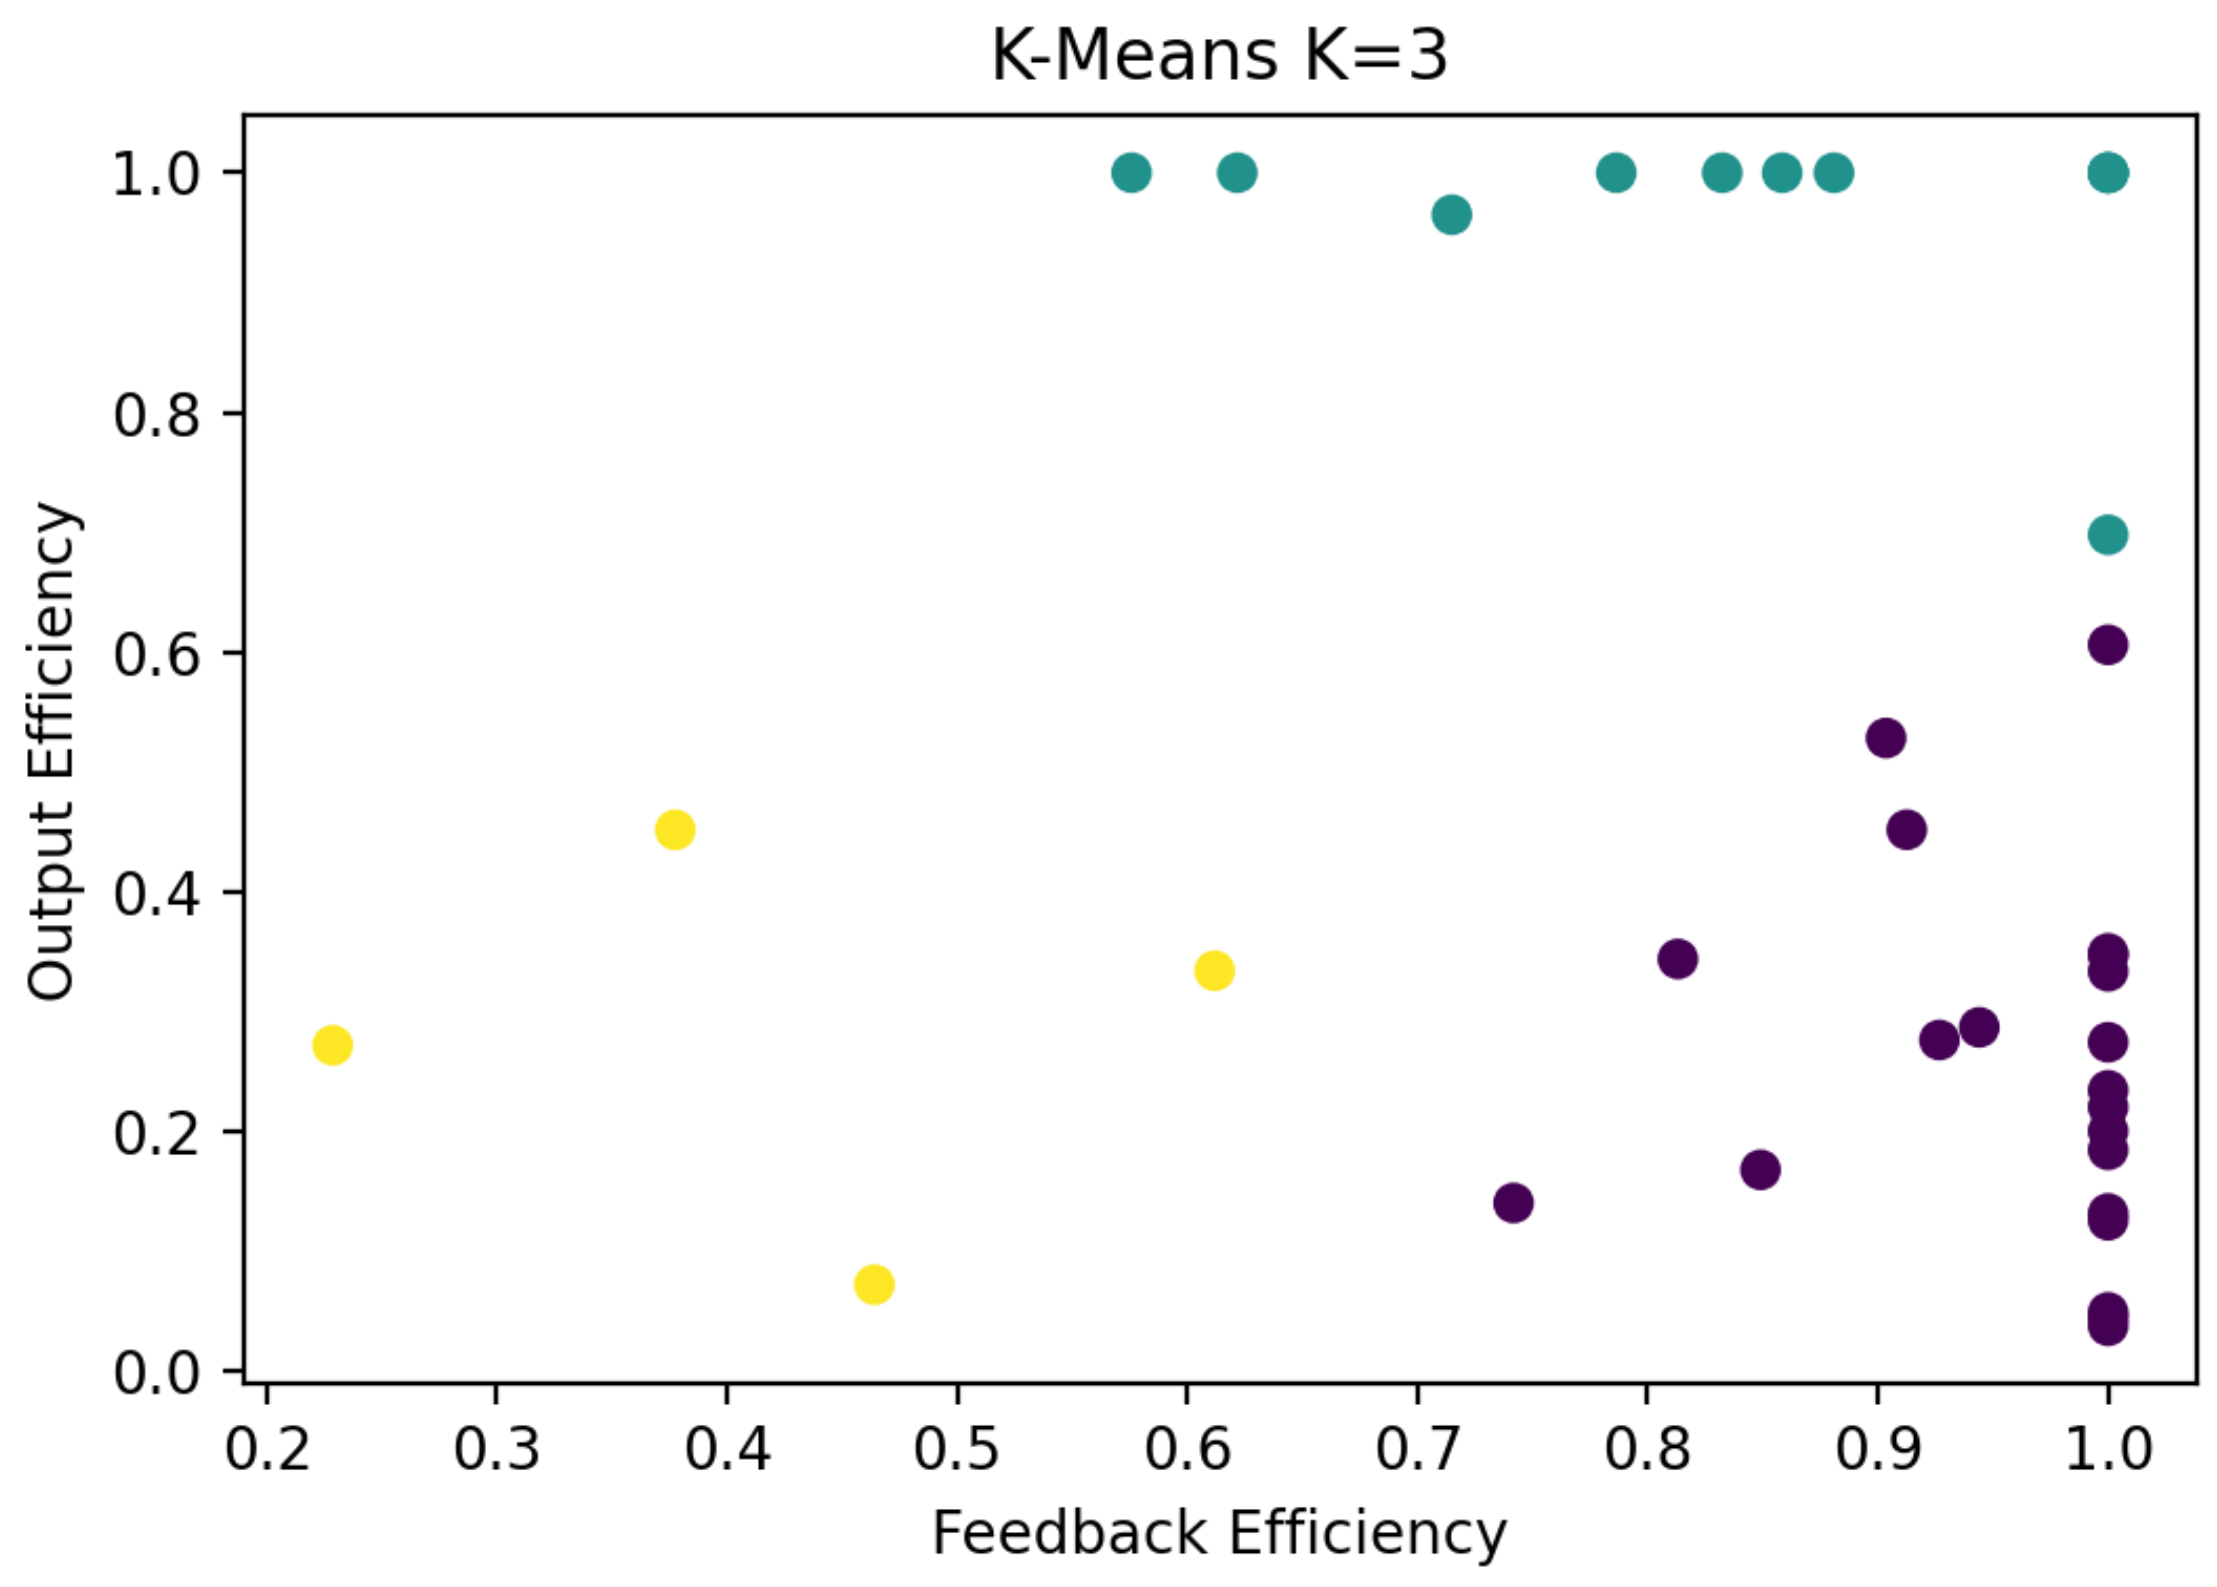
It is evident that the “elbow point” is reached at K = 3, and thus we have chosen to categorize research institutions into three clusters. The clustering results can be found in Figure 5.
Green points represent research institutions that exhibit high feedback efficiency and output efficiency, with cluster centers at (0.856, 0.972). Yellow points, on the other hand, represent those with low feedback efficiency and medium output efficiency, centered at (0.421, 0.282). Meanwhile, purple points signify research institutions with high feedback efficiency but low output efficiency, with their cluster centers situated at (0.957, 0.254). The specific classification of each research institution is shown in Table 5.

4.5. Influence Factor Analysis

To investigate the disparities in scientific communication efficiency, we employ the Tobit model to assess the factors influencing this efficiency. As independent variables, we have chosen the number of formal employees x 1 and total expenditure x 2 of the research institution. At the same time, we convert the clustering category results into two 0–1 variables and add them to the independent variables. x 3 is 1, indicating that the variable belongs to the purple category, and x 4 is 1, indicating that the variable belongs to the green category. If both x 3 and x 4 are 0, it represents the yellow category. The dependent variables under consideration are output efficiency, feedback efficiency, and overall efficiency, respectively. After normalizing the variables, we conducted Tobit regression analysis. The results are presented in Table 6.
Each column in the table represents the result of a regression. In the regression of the feedback stage, the regression coefficients of all four independent variables were significant. The coefficients observed for total expenditure in the results are all positive, suggesting that their increase positively impacts the efficiency of scientific communication.
However, it is worth noting that in the last two regression groups, the coefficient for the number of formal employees is negative. This indicates that an increase in employees does not necessarily improve the efficiency of scientific communication. Therefore, research institutions should prioritize improving the scientific communication capabilities of existing employees to enhance the efficiency of scientific communication, rather than simply pursuing more employees. This involves the correct combination of formal employees to maximize the impact of scientific communication work.

4.6. Discussions

After conducting the aforementioned analysis, the following suggestions are proposed:
1.
Enhancing content output efficiency: For research institutions that exhibit high feedback efficiency but relatively low output efficiency, such as the purple institutions identified in Table 5, the low output efficiency may be attributed to factors such as inefficient work processes, resource constraints, or a lack of focused content production strategies. To address this issue, it is advisable to prioritize the optimization of their workflows. This optimization should aim to streamline processes, allocate resources more effectively, and establish clear content production goals. By doing so, not only will the volume of scientific communication output increase, but the maintenance of content quality will also be ensured. A thorough analysis of existing workflows is crucial in identifying and eliminating any bottlenecks or obstacles, thereby enabling a smoother and more efficient production process for scientific content.
2.
Improving content quality: Institutions like RI-11 and RI-13 in Figure 2, which demonstrate low feedback efficiency despite high output efficiency, may be facing challenges in terms of content relevance, target audience engagement, or the quality of their communication channels. This could be due to a lack of focus on content quality, limited interaction with stakeholders, or ineffective dissemination strategies. To enhance their overall effectiveness, it is strongly recommended that these institutions focus on strengthening content quality control. This should involve conducting deeper research, enhancing the originality and practicality of their findings, and refining the way they present and disseminate their content to better engage their target audience. By doing so, they can create more influential, high-quality scientific communication content that not only establishes their academic credibility, but also fosters meaningful interactions and feedback loops.
3.
Leveraging technology and tools: Nowadays, the significance of online social networks in information dissemination cannot be overstated [26]. Our evaluation indicators system, encompassing both traditional and online media, reflects this reality. However, merely acknowledging their importance is insufficient. Research institutions must actively harness modern technology and digital tools to revolutionize scientific communication. We propose a multifaceted approach: firstly, leveraging social media platforms to engage directly with target audiences, disseminating research findings in real-time and fostering meaningful discussions; secondly, developing comprehensive online resources, such as repositories and interactive visualizations, to enhance both the accessibility and usability of scientific information; and finally, creating interactive websites that incorporate feedback loops from users, allowing institutions to gather insights, refine communication strategies, and ultimately broaden their impact. By embracing these strategies, research institutions can optimize their communication processes as well as significantly enhance the visibility and influence of their scientific work. Certainly, while pursuing these improvements, it is imperative to maintain the rigorousness and professionalism inherent to research institutions, ensuring the uncompromised scientific integrity of their work while maintaining an appropriate level of interaction.
4.
Balancing efficiency and investments in personnel and funding: Our analysis in Section 4.5 reveals correlations between the number of formal employees, total expenditure and the efficiency of scientific communication. Research institutions must strike a delicate balance between efficiently utilizing existing funds and optimizing their personnel investments. By prioritizing both the effective use of funds and the deployment of a capable workforce, research institutions can achieve improvements in scientific communication efficiency.
5.
Regular evaluation and adjustment: As time goes by, the way science is disseminated is also changing, and inappropriate evaluation methods can have adverse effects on science dissemination [4]. Therefore, institutions should establish a comprehensive monitoring and evaluation mechanism that regularly assesses the efficiency of their communication efforts. This includes quantitative and qualitative measures to gauge the reach, engagement, and overall impact of their scientific messages. Based on these evaluations, strategic adjustments and workflow optimizations must be made to align with current trends and best practices. By continuously evaluating and adapting their approaches, research institutions can maximize the impact of their scientific communication, ensuring that their work is recognized and valued, and contributes to the advancement of knowledge and science.
6.
Awareness of data bias: In this study, we used data such as reading volume in the second stage to evaluate the quality of scientific communication content, which may lead to some biases. The reading volume of scientific communication content is not only related to the quality of the content, but also to the theme of the communication content. The related content of hot topics will lead to wider dissemination and reading. In addition, feedback indicators are collected at the end of the year, which can lead to poor feedback data on scientific communication content released at the end of the year.

5. Conclusions

In this study, we established an indicator system encompassing three categories of indicators: input, output, and feedback, aimed at assessing the scientific communication efforts of research institutions. Input indicators include personnel and funding investment. Output indicators include news and online promotion. Feedback indicators include the audience’s response to news and online promotional content. These three types of indicators cover the entire process of scientific communication by research institutions, from the inputs required for scientific communication to the output of content related to scientific communication, and finally considering the impact and feedback from the audience.
The indicator system we have developed divides the process of scientific communication into two distinct stages: the output stage and the feedback stage. By employing a two-stage efficiency calculation process, we were able to derive output efficiency, feedback efficiency, and overall efficiency metrics. Compared to a single-stage calculation, this multi-stage approach offers a more nuanced understanding of the scientific communication efficiency of research institutions, thereby enabling the provision of tailored improvement suggestions based on the strengths and weaknesses of each stage.
Utilizing output efficiency and feedback efficiency as clustering criteria, research institutions can be categorized into three distinct groups. The first group comprises institutions exhibiting high output and feedback efficiencies, indicating excellent performance in both stages. For these institutions, maintaining their efficient practices is paramount. The second group consists of institutions with superior feedback efficiency but relatively lower output efficiency, necessitating the enhancement of scientific output efficiency and an increase in the production of scientific communication content. Finally, the third group encompasses institutions exhibiting low feedback efficiency but moderate output efficiency. For these institutions, it is crucial to prioritize the improvement of scientific communication content quality while maintaining a certain level of output. They must strike a balance between quantity and quality while simultaneously seeking to enhance efficiency.
From the analysis of influencing factors, it can be inferred that an increase in the total expenditure positively impacts the efficiency of scientific communication, thus having a beneficial effect on activities or projects. Conversely, merely increasing employees does not necessarily translate into efficiency gains. Therefore, research institutions should allocate personnel and funds reasonably to improve the efficiency of scientific communication.
In the present study, the selection of data was constrained by accessibility, resulting in the inclusion of data solely from 37 research institutes during the year 2022. For subsequent investigations, it would be beneficial to consider the inclusion of data across multiple years to facilitate a comprehensive long-term assessment of the efficiency of scientific communication. The current evaluation framework operates with data measured in terms of years, thereby limiting the frequency of evaluations to once per annum. Further studies may explore a dynamic evaluation system. Such a system would provide research institutions with the capability to gain real-time insights into the effectiveness of their scientific communication efforts, thereby enabling them to make adjustments to their strategies in a timely manner. As new technologies emerge, future research should investigate how they can be incorporated into the scientific communication assessment framework.

Author Contributions

Conceptualization, W.Z. and Z.H.; methodology, C.L.; formal analysis, C.L. and S.F.; investigation, W.Z.; writing—original draft preparation, W.Z. and C.L.; writing—review and editing, C.L. and S.F.; supervision, Z.H.; project administration, W.Z. and Z.H.; funding acquisition, W.Z. All authors have read and agreed to the published version of the manuscript.

Funding

This research was funded by the Bureau of Science Communication of the Chinese Academy of Sciences (grant number E2E90803), the Youth Innovation Promotion Association CAS (grant number 110800EAG2), the MOE Social Science Laboratory of Digital Economic Forecasts and Policy Simulation at UCAS, and the Weiqiao Guoke Joint Laboratory at UCAS.

Data Availability Statement

Origin data are not publicly available. Desensitized data are available from the corresponding author on reasonable request.

Conflicts of Interest

The authors declare no conflicts of interest.

References

  1. Burns, T.W.; O’Connor, D.J.; Stocklmayer, S.M. Science communication: A contemporary definition. Public Underst. Sci. 2003, 12, 183–202. [Google Scholar] [CrossRef]
  2. Nosek, B.A.; Bar-Anan, Y. Scientific utopia: I. Opening scientific communication. Psychol. Inq. 2012, 23, 217–243. [Google Scholar] [CrossRef]
  3. Fischhoff, B. Evaluating science communication. Proc. Natl. Acad. Sci. USA 2019, 116, 7670–7675. [Google Scholar] [CrossRef] [PubMed]
  4. Scheufele, D.A. Science communication as political communication. Proc. Natl. Acad. Sci. USA 2014, 111, 13585–13592. [Google Scholar] [CrossRef]
  5. Saaty, R.W. The analytic hierarchy process—What it is and how it is used. Math. Model. 1987, 9, 161–176. [Google Scholar] [CrossRef]
  6. Zadeh, L.A. Fuzzy sets. Inf. Control 1965, 8, 338–353. [Google Scholar] [CrossRef]
  7. Julong, D. Introduction to grey system theory. J. Grey Syst. 1989, 1, 1–24. [Google Scholar]
  8. Hwang, C.L.; Yoon, K.; Hwang, C.L.; Yoon, K. Methods for multiple attribute decision making. In Multiple Attribute Decision Making: Methods and Applications a State-of-the-Art Survey; Springer: Berlin/Heidelberg, Germany, 1981; pp. 58–191. [Google Scholar]
  9. Charnes, A.; Cooper, W.W.; Rhodes, E. Measuring the efficiency of decision making units. Eur. J. Oper. Res. 1978, 2, 429–444. [Google Scholar] [CrossRef]
  10. Song, M.; Wang, R.; Zeng, X. Water resources utilization efficiency and influence factors under environmental restrictions. J. Clean. Prod. 2018, 184, 611–621. [Google Scholar] [CrossRef]
  11. Seiford, L.M.; Zhu, J. Profitability and marketability of the top 55 US commercial banks. Manag. Sci. 1999, 45, 1270–1288. [Google Scholar] [CrossRef]
  12. Kao, C.; Hwang, S.N. Efficiency decomposition in two-stage data envelopment analysis: An application to non-life insurance companies in Taiwan. Eur. J. Oper. Res. 2008, 185, 418–429. [Google Scholar] [CrossRef]
  13. Li, Y.; Chen, Y.; Liang, L.; Xie, J. DEA models for extended two-stage network structures. Omega 2012, 40, 611–618. [Google Scholar] [CrossRef]
  14. Kao, C. Efficiency decomposition in network data envelopment analysis: A relational model. Eur. J. Oper. Res. 2009, 192, 949–962. [Google Scholar] [CrossRef]
  15. Zhou, F.; Si, D.; Hai, P.; Ma, P.; Pratap, S. Spatial-temporal evolution and driving factors of regional green development: An empirical study in Yellow River Basin. Systems 2023, 11, 109. [Google Scholar] [CrossRef]
  16. Welbourne, D.J.; Grant, W.J. Science communication on YouTube: Factors that affect channel and video popularity. Public Underst. Sci. 2016, 25, 706–718. [Google Scholar] [CrossRef] [PubMed]
  17. Mou, Y.; Lin, C.A. Communicating food safety via the social media: The role of knowledge and emotions on risk perception and prevention. Sci. Commun. 2014, 36, 593–616. [Google Scholar] [CrossRef]
  18. Liang, X.; Su, L.Y.F.; Yeo, S.K.; Scheufele, D.A.; Brossard, D.; Xenos, M.; Nealey, P.; Corley, E.A. Building Buzz: (Scientists) Communicating Science in New Media Environments. J. Mass Commun. Q. 2014, 91, 772–791. [Google Scholar] [CrossRef]
  19. Jensen, E. Evaluating impact and quality of experience in the 21st century: Using technology to narrow the gap between science communication research and practice. JCOM J. Sci. Commun. 2015, 14, 1–9. [Google Scholar] [CrossRef]
  20. Olesk, A.; Renser, B.; Bell, L.; Fornetti, A.; Franks, S.; Mannino, I.; Roche, J.; Schmidt, A.L.; Schofield, B.; Villa, R.; et al. Quality indicators for science communication: Results from a collaborative concept mapping exercise. J. Sci. Commun. 2021, 20, A06. [Google Scholar] [CrossRef]
  21. Liang, L.; Cook, W.D.; Zhu, J. DEA models for two-stage processes: Game approach and efficiency decomposition. Nav. Res. Logist. (NRL) 2008, 55, 643–653. [Google Scholar] [CrossRef]
  22. Tobin, J. Estimation of relationships for limited dependent variables. Econom. J. Econom. Soc. 1958, 26, 24–36. [Google Scholar] [CrossRef]
  23. Kenny, L.W.; Lee, L.F.; Maddala, G.; Trost, R.P. Returns to college education: An investigation of self-selection bias based on the project talent data. Int. Econ. Rev. 1979, 20, 775–789. [Google Scholar] [CrossRef]
  24. Kodinariya, T.M.; Makwana, P.R. Review on determining number of Cluster in K-Means Clustering. Int. J. 2013, 1, 90–95. [Google Scholar]
  25. Wu, J.; Wu, J. Cluster analysis and K-means clustering: An introduction. In Advances in K-Means Clustering: A Data Mining Thinking; Springer: Berlin/Heidelberg, Germany, 2012; pp. 1–16. [Google Scholar]
  26. Guille, A.; Hacid, H.; Favre, C.; Zighed, D.A. Information diffusion in online social networks: A survey. ACM Sigmod Rec. 2013, 42, 17–28. [Google Scholar] [CrossRef]
Figure 1. Two stages of the scientific communication process.
Systems 12 00192 g001
Figure 2. Two-stage efficiency of the 37 DMUs (RIs).
Systems 12 00192 g002
Figure 3. Efficiency values scatter plot.
Systems 12 00192 g003
Figure 4. The variation of SSE with K.
Systems 12 00192 g004
Figure 5. The clustering results of DMUs (RIs) with K = 3.
Systems 12 00192 g005
Table 1. Input indicators of the scientific communication DMUs (RIs).
First-Level IndicatorsSecond-Level Indicators
Personnel InvestmentNumber of Personnel Engaged
in Scientific Communication
Proportion of Total Employees
Funding InvestmentFunding for Scientific Communication
The Proportion of Self Raised Funds
Table 2. Output indicators (Stage 1) of the scientific communication DMUs (RIs).
First-Level IndicatorsSecond-Level IndicatorsThird-Level Indicators
News PromotionNews Media
Coverage
Number of Reports in Traditional Media
Number of Reports in New Media
Online PromotionWebsite OperationNumber of Reports in Wechat
Wechat OperationNumber of Reports in RI Websites
Table 3. Feedback indicators (Stage 2) of the scientific communication DMUs (RIs).
First-Level IndicatorsSecond-Level IndicatorsThird-Level Indicators
News PromotionNews QualityThe Score for Traditional
Media Coverage
The Score for New
Media Coverage
Online PromotionWebsite OperationPage Clicks
Wechat OperationArticle Reading Volume
Table 4. Descriptive statistical characteristics of all indicators.
MinimumMaximumMeanStandard
Deviation
Number of Personnel Engaged
in Scientific Communication
0172.583.68
Proportion of Total Employees0109.093.5217.87
Funding for Scientific Communication0100.5716.2623.04
The Proportion of Self Raised Funds010055.1847.57
Traditional Media Coverage411191269.59259.28
New Media Coverage8654141.14144.78
Number of Information Releases352381621.45507.58
WeChat Information Releases0400123.1194.28
The Score for Traditional Media Coverage33517,0953740.143904.56
The Score for New Media Coverage8065401411.351447.8
Page clicks111,3501544.582150.19
Article reading volume026523.2746
Table 5. Three clusters of DMUs (RIs).
Research Institutions
PurpleRI-12, RI-14∼RI-24, RI-26, RI-27, RI-29∼RI-32, RI-34∼RI-36
GreenRI-1∼RI-11, RI-13
YellowRI-25, RI-28, RI-33, RI-37
Table 6. Tobit regression results.
Output EfficiencyFeedback EfficiencyOverall Efficiency
Constant0.217 ***0.419 ***0.087
β 1 0.506−0.479 *−0.301
β 2 −0.3830.572 *0.381
β 3 −0.0140.566 ***0.134
β 4 0.836 ***0.438 ***−0.4810 ***
Asterisks represents the confidence level, “***”: 0.01, “*”: 0.1.
Disclaimer/Publisher’s Note: The statements, opinions and data contained in all publications are solely those of the individual author(s) and contributor(s) and not of MDPI and/or the editor(s). MDPI and/or the editor(s) disclaim responsibility for any injury to people or property resulting from any ideas, methods, instructions or products referred to in the content.