Abstract
This paper delves into optimizing the rotation of relief supplies within the relief supply chain system, concentrating on reserve quantity decisions for governments and humanitarian organizations involved in disaster response. By integrating a trade-in strategy with suppliers, it ensures a precise and timely response to the fluctuating demand for relief supplies post-disaster. Utilizing the newsvendor model, optimization theory, and supply chain coordination principles, we developed a comprehensive model that calculates optimal reserve quantities for pre-positioning demanders. It also outlines the expected profit function for suppliers and a robust supply chain coordination model. The findings highlight that optimal stockpiling decisions for relief supplies are heavily influenced by cost parameters, material characteristics, and the relationship between trade-in pricing and market resale values. Notably, higher trade-in prices generally reduce the government’s optimal reserve quantities, impacting strategic decisions within supply chain coordination. This research adds to disaster management literature by offering strategic insights into how coordination and pricing strategies can improve disaster preparedness and response efficiency and effectiveness.
1. Introduction
In recent years, frequent natural disasters and public health incidents, such as the super typhoon “Wilson” and the COVID-19 outbreak in 2020, have posed increasingly severe threats to the global economy and public safety, demanding higher standards for national relief supply security systems [1,2]. Relief supplies refer to essential materials needed for effective responses to sudden events, such as natural disasters and accidents, including emergency rescue materials, emergency response resources, and basic living supplies for affected individuals [3]. The pre-positioning of relief supplies is a critical support for emergency response and a vital means to enhance a nation’s capability to prevent and mitigate major risks. Therefore, enhancing the emergency supply security system and pre-positioning supplies in advance to ensure their efficient and effective use in emergencies has become especially urgent.
In relief supply pre-positioning systems, to reduce the wastage of expired resources and address shortages, governments worldwide have encouraged emergency management departments or humanitarian organizations to collaborate with businesses in stockpiling relief supplies. This collaboration integrates the physical storage capabilities and production capacities of businesses [1,3,4]. For instance, the Chinese government has implemented a series of policies such as the “National Natural Disaster Relief Emergency Plan (2016)”, which emphasize the diversification of rescue and disaster relief material reserves and promote a socialized storage mechanism for emergency supplies [1,2,5].
To ensure that supplies reach the required locations accurately and on time, thereby ensuring supply reliability, it is necessary to pre-position resources at emergency management departments or humanitarian organizations [6,7]. However, given the unpredictability of disasters, managing unused supplies and updating and rotating stockpiled materials pose significant challenges [1,2,5]. On one hand, if the rotation of supplies is not timely, the quality of stockpiled materials may degrade, affecting the effectiveness of the rescue efforts. On the other hand, due to the unpredictability of disasters, these supplies might not be used at all during the storage period, or there might be excessive leftovers, necessitating efficient and timely management and renewal of supplies by the government.
The trade-in rotation of supplies not only effectively conserves resources and reduces waste [6,7] but also generates additional revenue for companies providing these services [7,8]. This approach helps businesses maintain competitiveness [9,10], fulfill social responsibilities, and establish a positive corporate image [11]. It represents an excellent business model that aligns with the principles of the circular economy and sustainable development [12].
Based on this, the paper developed an optimal pre-positioning strategy for government resource rotation using the “trade-in” approach when collaborating suppliers possess the capability to refurbish end-of-life products. The rotation reserve process of relief supplies with trade-in strategy is illustrated in Figure 1. In this model, the government pays a refurbishment fee proportional to the wear and tear of the materials. The refurbished relief supplies, improved in quality, are then re-supplied to the market at discounted prices, while suppliers provide new materials to the government, ensuring an effective renewal of resources.
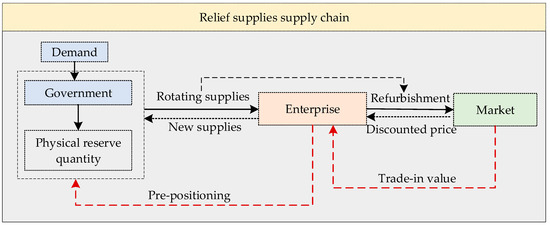
Figure 1.
Trade-in strategy for relief supplies.
Integrating trade-in strategies within the relief supply-chain system is crucial for refurbishing and reusing previously used or outdated relief supplies. This approach not only minimizes material waste and boosts resource efficiency but also ensures that relief supplies remain high quality and current, facilitating swift and effective disaster responses. The primary objective of this research is to identify the optimal pre-positioning decisions for disaster relief supplies, illustrating how trade-in strategies can enhance disaster preparedness and response while supporting sustainability goals. Consequently, this paper has delved into the following research questions:
- In the relief supply-chain system, what is the optimal decision for pre-positioning relief supplies under a trade-in strategy?
- How does the profit function of suppliers of relief supplies change with different decisions?
- What are the conditions for achieving coordination between procurement organizations and suppliers in the relief supply chain?
- How do certain characteristics of relief supplies, such as urgency and storability, impact the optimal decision and the overall relief supply-chain system?
To address the question mentioned, we developed a model for relief supply reserves under a trade-in rotation strategy. This model explores the optimal pre-positioning decisions of governments, integrated with the profit functions of enterprises, to find the conditions for supply-chain coordination under the trade-in model. Our research reveals several important findings: under the trade-in strategy, the optimal pre-positioning of relief supplies is differentially affected by the cost of spot purchases post-disaster, influencing the expected costs for the buyer. Additionally, the optimal decision on supply quantities is affected by the probability of disasters, the difficulty of stocking these supplies, and their urgency. This is evident as higher disaster probabilities, lower stocking difficulties, and greater urgency lead to larger optimal decisions. Finally, when the supply chain is coordinated, both the optimal pre-positioning quantities for the buyer and the expected profits for the supply chain increase as a function of the resale prices under the trade-in model, whereas the physical reserve quantities for the buyer and the expected profits for the supply chain decrease as a function of the refurbishment costs of recycled relief supplies.
The contributions of this paper are primarily manifested in three areas. First, we developed a model to optimize the pre-positioning decisions of disaster relief supplies through the refurbishment and reuse of obsolete materials. This not only enhances the efficiency of relief supplies management and resource utilization but also provides new theories and tools for multi-criteria decision-making in complex supply-chain systems. Lastly, this paper demonstrates the adjustment strategies for optimal pre-positioning quantities under varying decision parameters, aiming to achieve optimization within the relief supply-chain system.
The remainder of this study is organized as follows: Section 2 provides a brief review of the relevant literature. Section 3 discusses the optimal decision model for relief supplies and the results. Section 4 introduces the coordination model for the relief supply-chain system and analyzes the results. Section 5 presents a case study analysis of the research. Section 6 summarizes the conclusions and implications.
2. Literature Review
Due to the uncertainty regarding the timing of disasters, governments need to stockpile a certain number of supplies to be ready for post-disaster relief. In this section, we review the literature on the optimal decision-making quantity for pre-positioning in disaster relief supply chains and the coordination of these supply chains.
2.1. Optimal Decision-Making in Relief Supply Chains
Relief supplies pre-positioning is one of the key functions of government and other relief organizations. During planning, there is a need to strike a balance between cost and responsiveness [13]. Factors, such as the timing, location, severity of disasters, and regional stability, need to be considered when stockpiling supplies, which increases the complexity of the government procurement process [14,15,16]. Therefore, to streamline the process and ensure cost-effectiveness and rapid delivery of emergency supplies, emergency management departments typically establish contracts and agreements with suppliers before disasters, aiming to have procurement flexibility and mitigate demand uncertainties [17,18,19,20].
In the realm of relief supply chains, scholars focus on precise prediction of relief supplies needs and optimizing stockpile decisions. For instance, predictive models combining intuitionistic fuzzy sets and grey Markov methods have been employed to accurately forecast relief supplies demands during large-scale pandemics, aiming to optimize inventory levels and enhance distribution efficiency [21]. Simultaneously, research has utilized Bayesian decision models, integrating official forecast models from the National Hurricane Center, to balance the trade-off between forecast accuracy and cost efficiency, thereby optimizing strategies for relief supplies stockpiling [22].
Some scholars, building upon the fixed shelf-life characteristic of relief supplies, consider time windows by introducing expiration cost functions [23]. They have designed inventory models for emergency materials considering factors such as the frequency of sudden events, occurrence time intervals, and randomness in occurrence time [24,25]. Others divide the relief supplies reserve period into two phases, based on critical time points and implement inventory transfer decisions at these junctures [26]. Innovative approaches have been proposed for optimizing perishable emergency material inventory under the emergency reserve center and supplier recovery replacement mode, suggesting two replacement mechanisms based on the remaining lifecycle of emergency materials and the number of emergency reserve centers [27,28].
Compared to existing studies in the literature, our research introduces a strategy that achieves sustainable development through a circular supply chain. Existing studies mainly focus on predicting relief supply needs and optimizing stockpile decisions, using various models to address procurement complexity, forecast accuracy, and cost efficiency. However, they often overlook the subsequent risk management after supply transfers and tend to shift loss risks from emergency management departments to suppliers. Our strategy, by refurbishing and reintroducing supplies, not only reduces waste but also integrates sustainability into the relief supply chain, addressing gaps in the current research.
2.2. Emergency Supply Pre-Positioning Optimization
In the realm of pre-positioning emergency supplies, scholars have developed numerous strategies to boost disaster response efficiency. These strategies are often categorized based on their technical characteristics and research focus.
Within supply-chain management, researchers have examined ways to improve disaster response through enhanced supply-chain coordination. Some studies, for instance, optimize the coordination of emergency and non-emergency supplies using options contracts and supply-chain models [29,30]. Others employ fuzzy AHP and TOPSIS methods to determine optimal warehouse locations, considering national stability and cooperation, and evaluating pre-positioning strategies from both macro and micro perspectives [31,32]. Additionally, Chen et al. [33] used a multi-product newsvendor approach to create a model for reserving relief supplies for non-profit organizations, factoring in the uncertainty of post-disaster demand and donations.
Regarding optimization strategies for service quality and specific disaster scenarios, Duran et al. [34] showcased the effectiveness of optimizing the pre-positioning of relief supplies in collaboration with CARE International. Their work improved response times and illustrated an ideal configuration of the global network. Sotelo-Salas et al. [35] introduced a multi-objective optimization model to strategically allocate critical infrastructure for vertical evacuation in tsunami-prone areas, tested with data from Coquimbo-La Serena, Chile, aimed at minimizing costs, maximizing population coverage, and reducing evacuation time. Another study highlighted the practical application of optimization models in disaster response, incorporating service quality constraints [36]. Moreover, some research has addressed the vulnerabilities of post-disaster roads and facilities, utilizing stochastic planning models and heuristic solutions to optimize pre-positioning and response operations [37].
Finally, the application of complex planning and stochastic models represents a significant research area [38,39,40,41,42,43,44,45]. These studies use various complex mathematical models to address the challenges of disaster response, characterized by high uncertainty and dynamic demand changes. These models not only tackle multi-stage and multi-period optimization issues but also achieve multi-objective optimization concerning cost, efficiency, and reliability. Additionally, they explore the use of emerging technologies, such as Internet of Things (IoT), in disaster management.
Existing studies have focused on enhancing response efficiency through various approaches, including supply-chain coordination, optimizing warehouse locations, improving service quality, and utilizing complex planning and stochastic models. This research pioneers the introduction of the “trade-in” strategy, examining the optimal pre-positioning of government resources when suppliers can refurbish end-of-life products. The model emphasizes multi-objective optimization of cost, efficiency, and reliability, while simultaneously boosting resource circulation efficiency. By refurbishing outdated or obsolete relief supplies, this strategy significantly enhances the speed and quality of disaster responses, thereby exploring a previously unaddressed gap in the literature.
2.3. Relief Supply-Chain Coordination
In relief supply chains operating within market mechanisms, the objectives of supply-chain members tend to become increasingly decentralized and self-serving, leading to a conflict between maximizing individual interests and maximizing overall supply-chain benefits, thus giving rise to bilateral marginal issues [46]. Within relief supply-chain systems, governmental and humanitarian organizations, along with suppliers, optimize the performance of the entire supply chain through coordinated actions and information sharing. This ensures effective collaboration among all members of the supply chain, thereby reducing costs, enhancing efficiency, and improving response times.
Supply-chain contracts constrain the decision-making behavior of supply-chain members, enabling them to achieve Pareto improvements in profit realization. These contracts are a concrete manifestation of pre-disaster agreements and are therefore widely used in relief supply-chain coordination. Most research focuses on option contracts within relief supply chains. Option contracts, initially utilized in financial derivatives, have been introduced into emergency supply chains due to their flexibility, serving as future commitments to simplify the procurement process [47]. They effectively mitigate inventory risks for buyers and production surplus risks for suppliers. Existing research mainly examines option contract pricing [48], the selection of proprietary reserves and negotiated agreement contracts [49,50], incentive conditions and mechanisms [51,52,53], and feasible quantity ranges [54,55]. Other supply-chain contracts, such as repurchase contracts [23,56], quantity flexibility contracts [14], quantity commitment contracts [23], and revenue-sharing contracts [28,57], have also been studied by relevant scholars. For instance, Nikkhoo et al. [58] explore the use of quantity flexibility contracts, allowing for adjustments in both upward and downward raw material purchases to address demand uncertainty while reducing shortage costs and waste caused by overestimation. Zhang, Tian, Fung and Dang [23] designed a quantity commitment contract taking into account factors such as the shelf life of materials, emergency demand, and stock distribution. Doganoglu and Inceoglu [56] showed that repurchase clauses can help upstream suppliers mitigate opportunistic issues arising from strategic uncertainty. However, these studies primarily focus on reserve strategies under single contracts, emphasizing contract design and parameters, which may pose challenges in effectively coordinating complex and dynamic relief supply chains in practical applications. In actual relief supply-chain systems, there is a need to develop optimization and integration of disaster relief resources under joint government–enterprise reserves, promoting complementary advantages of different entities’ reserves. The academic community has also conducted extensive research on this topic [51,59]. Under conditions of asymmetric information between government and enterprises, incentive mechanisms based on principal–agent theory can be constructed [46].
The strategy used in the previous literature to renew the rotation of relief supplies was mainly the buyback approach. Buyback is mainly applied in the commercial field, which refers to the buyback of unsold products by retailers at a pre-agreed price, thus stimulating retailers to order more products and increase product sales, mainly for commodities with uncertain demand and short life cycle [60]. Buyback is essentially a supplier’s sharing of the retailer’s sales risk arising from demand uncertainty, which improves the overall risk resistance of the supply chain, and then improves the overall operational efficiency of the supply chain so that supply-chain performance reaches a coordinated operational state [56,61]. The introduction of the buyback model to the contingency field is also well developed, mainly used to explore the coordination and strategy under contingencies. Doganoglu and Inceoglu [56] verified that the buyback can help upstream suppliers to alleviate the opportunism problem due to strategic uncertainty. However, although the buyback strategy can, to a certain extent, guarantee the renewal of material rotation and avoid certain wastage, it fails to comprehensively consider the process of disposal of materials after buyback and the possible economic losses to the firm.
Faced with the above challenges, this paper proposes to trade-in via a supplier that has the capability and willingness to process recycling [62,63,64]. This approach has been adopted in several scenarios such as in manufacturing product supply chains or dual-channel supply chains. There are studies on trade-in selection and thresholds in dual-channel supply chains and traditional retail channels [65,66], or on the impact of online consumer reviews on trade-in decisions in dual-channel supply chains [67]. Studies have also explored the use of trade-in strategies to recycle used products in manufacturing product supply chains to generate price discrimination and undermine the competitiveness of other manufacturers. Although such strategies have been applied in the commercial sector, they have not yet been applied to the relief supplies supply-chain system, and this study introduces them into the renewal rotation of government physical stockpiles in order to achieve the development goals of effective and available supply of emergency supplies and sustainable waste reduction.
3. Model Description and Assumption
3.1. Methodology
This paper employs the newsvendor model method combined with convex optimization theory to construct a comprehensive decision support framework for studying the optimal pre-positioning of relief supplies in disaster response by the government. Initially, we established a government cost model that takes into account the procurement cost, storage cost, and the loss cost due to obsolescence of relief supplies. These cost factors are critical variables in the model that directly influence government decisions on reserves under various scenarios. Additionally, to fully consider the interests of all parties in the supply chain, we also developed a profit model for enterprises, evaluating the economic benefits of enterprises recycling old materials and re-entering the market through a “trade-in” strategy. This profit model meticulously captures the costs and revenues associated with handling recycled materials.
To achieve overall coordination of the supply chain, we further developed a supply-chain coordination model. This model is based on a bilateral cooperation framework that considers the interdependencies between the government and enterprises, and minimizes the total system costs while maximizing benefits by adjusting decision variables of both the government and enterprises. Throughout the research process, we particularly focused on the impact of the “trade-in” strategy on the pre-positioning volumes of relief supplies. By applying the newsvendor model and supporting it with convex optimization theory, we were able to systematically analyze and solve the problem of optimal pre-positioning quantities. This methodology not only enhances the practical applicability of the model but also provides a theoretical basis for governments and enterprises to make more scientific and economical decisions in disaster management.
3.2. Problem Description
To effectively respond to emergencies, the purchasing party (government) needs to procure a certain quantity of emergency supplies in advance for stockpiling. However, due to the uncertainty of emergencies, the upfront procurement of relief supplies is costly and may result in wastage. During long-term storage, supplies may undergo natural wear and tear or become technologically obsolete, necessitating regular updates and replacements. Delayed updates may impede disaster response efficiency, and the uncertainty of disaster occurrence may render stockpiled supplies unusable, requiring effective management and updates by the government.
To share the risks between the purchasing and supplying parties, a “trade-in” contract is established between them. Under this strategy, at the end of each reserve cycle, the purchasing party has the right to request the supplying party to exchange old supplies for updated ones at an agreed-upon price. The old supplies are refurbished by enterprises and then reintroduced into the market at a discounted price. This allows the purchasing party to not only reduce costs but also compensate the supplying party. In summary, to address the government’s need for supply rotation, this study recommends adopting the “trade-in” approach, whereby the government pays refurbishment costs based on the condition of the supplies and acquires new supplies, while enterprises refurbish and offer them at discounted prices in the market, with the relevant research parameters, as shown in Table 1.

Table 1.
Model parameter settings.
3.3. Decision Sequence
Based on the previous problem description, the order of decision-making for pre-positioning relief supplies, considering the rotation of supplies under the “trade-in” model, is as follows:
- The government first sets the supplies rotation cycle , the emergency parameter of the supplies is , and the parameter of the ease of storing is ;
- Upon the arrival of the single-cycle stockpile period, the government needs to rotate and renew a certain amount of relief supplies in the physical stockpile. Firstly, when there are no disasters during the reserve period, and firms are capable of refurbishing and accepting new replacements, the government can choose the “trade-in” model for the rotation of supplies;
- Subject to the government’s willingness to “trade-in” some of the supplies, enterprises receive the supplies and then provide the government with brand-new supplies at a price . Enterprises can recondition these recovered goods and reintroduce them to the market at a more favorable price;
- When there is a disaster event within the stockpile cycle , the rotation of supplies varies with the change of demand, mainly in the following scenarios:
- (1)
- If , that is, the demand for relief supplies is less than the government’s physical reserves. In this case, the “trade-in” mode is similar to the no-disaster scenario, but the base number of materials that need to be replaced is .
- (2)
- When , the remaining supplies need to be purchased from the spot. With reference to the decision problem and process described above, Figure 2 illustrates the logical structure of the model.
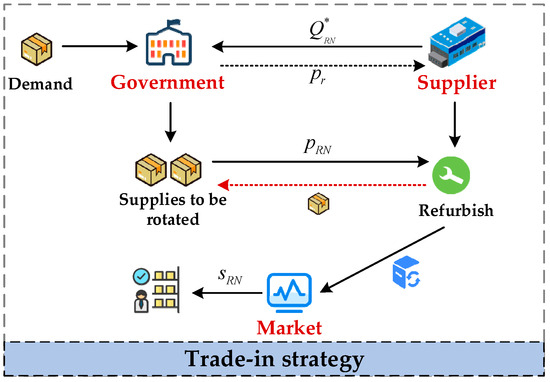 Figure 2. Relief supplies trade-in strategy decision process.
3.4. Assumption
- With reference to the assumptions of existing studies [1,15,48,68], the demand for emergency supplies is , and there exists a maximum value , reflecting the fact that the coverage of pre-stocked relief supplies is limited rather than unlimited;
- In combination with previous research [1,14,69,70], the government’s expected cost function covers not only reserve costs but also social welfare costs. For example, deprivation costs are considered in the urgency parameter. The urgency parameter also encompasses other considerations such as the number of suppliers, supply speed, daily consumption rate, general/specific applicability, and per capita daily demand. Therefore, parameter is a comprehensive metric ranging from 0 to 1, with deprivation cost being one of its factors. Specifically, it measures the cost that disaster victims are willing to bear due to the absence of the commodity by the third day after the disaster, as the initial three days post-disaster are considered an emergency relief period in emergency management;
- In the physical pre-positioning procurement phase, which consists of the Government (the purchaser of relief supplies) and enterprises (the suppliers of relief supplies), a single-cycle procurement contract is signed between the two parties. There are two main parties in the rotation of supplies: the Government and the suppliers who have the capacity to recover and refurbish the supplies. The purpose of the contract is for the government and enterprises to prearrange the implementation of the “trade-in” strategy during the procurement of relief supplies. This is formalized through the contract, serving as a tool for implementing the “trade-in” strategy;
- The logic requires that the sales price of the refurbished supplies brought back to the market after the “trade-in” is lower than the market purchase price of the supplies, that is, , ;
- Considering the introduction of the “trade-in” strategy, the cost incurred by the government for self-rotation, denoted as , needs to be greater than for the “trade-in” strategy to be viable. Therefore, .
4. Optimal Pre-Positioning Decision Model for Relief Supplies Based on Trade-In Strategy
4.1. Decision-Making Model for Purchasers (Government) under the Trade-In Strategy
When implementing the “trade-in” strategy, in order to study the optimal stockpile quantity of relief supplies for the government as the demand side, it is first necessary to categorize based on the demand for relief supplies , and consider the probabilities of different disasters to establish a cost function.
4.1.1. Government Cost Function in the Absence of Disasters
At the beginning of the agreement period, the government needs to pre-position units of relief supplies. If no disasters occur throughout the agreement period, the government will, at the end of the period, conduct a trade-in transaction in accordance with its “trade-in” policy to update its reserves with businesses. Therefore, if no disasters occur during the agreement period, the government’s cost function will be defined as follows:
The government’s cost function primarily includes two parts: the first is the purchase cost of spot supplies , and the second part is the cost of trading in supplies at the end of the agreement period, influenced by the government’s “trade-in” willingness parameter , calculated as .
Drawing from studies Zhu et al. [70] and Cao et al. [71], we set parameter as , indicating that as the difference between the government’s self-rotation cost of supplies and the trade-in price increases, the government’s willingness to adopt the trade-in strategy also increases.
Additionally, represents the cost of relief supplies that are expired or damaged due to storage difficulties and were not used; is the cost of purchasing emergency supplies that need to be rotated without a trade-in; is the residual value of these supplies. By simplifying the above formula, we obtain the following:
4.1.2. Government Cost Function in the Event of a Disaster
If a disaster occurs during the agreement period, the government’s cost function varies and is divided into two scenarios based on the different demand levels of relief supplies.
- When , meaning the demand for emergency supplies is less than the government’s physical stock , the government’s cost function is expressed as follows:
This cost function structurally resembles the government’s cost function in a no-disaster scenario. However, a key difference lies in the baseline quantity of supplies considered under the “trade-in” model. In a no-disaster scenario, this baseline comprises all unused supplies . In this context (), the baseline shifts to the remaining, unused supplies in the government’s stockpile . The simplification is as follows:
- When , meaning the government’s physical stock is insufficient to meet the demand for emergency supplies , additional supplies need to be purchased on the spot. The order of purchase prioritizes contracted businesses; if they cannot meet the demand, purchases are made on the open market. The resulting loss cost arises because the fixed supply channels (own reserves and contracted businesses) cannot satisfy the demand. The government’s cost expression at this point is the following:
Here, represents the cost of spot purchasing supplies not covered by the government’s physical stock, including purchases from contracted businesses and the open market; is the loss cost incurred because the demand exceeds the government’s physical reserves and contracted business supply. The formula, after simplification, is presented as follows:
Based on the aforementioned profit analysis and considering the probability of a disaster occurring within the agreement period, the cost function for the government (as the demand side) under the trade-in model is as follows:
Proposition 1.
When the government opts for the trade-in model to rotate relief supplies, the optimal physical reserve quantity is as follows:
where
Proof of Proposition 1.
To solve for the first derivative with respect to
for the government’s cost function under the trade-in model, as expressed in Equation (7), we have the following:
Further solving for the second derivative with respect to , the result is as follows:
Given that the second derivative of the government’s (as the demand side) cost function under the “trade-in” strategy with respect to , namely Equation (10), is greater than 0, it indicates that the government’s cost function is convex. Thus, there exists an optimal physical stock of emergency supplies that minimizes the government’s cost function. This is established based on the government’s willingness to engage in trade-ins, where , implying , as follows:
□
4.2. Profit Function for Suppliers (Enterprise) under the Trade-In Strategy
Next, we analyze the profit function of suppliers (enterprise).
4.2.1. Enterprise Profit Function in the Absence of Disasters
At the start of the agreement period, the government needs to pre-positioning units of relief supplies. If no disasters occur throughout the agreement period, the government will engage in a trade-in transaction with businesses at the end of the period, based on the trade-in willingness parameter , to update its reserves. Therefore, in the absence of disasters during the agreement period, the profit function for businesses is defined as follows:
The first half of the formula represents revenue items, including as income from the sale of government’s physical stock of relief supplies, and as income from trade-in transactions with the government at the end of the agreement period. Here, is the cost of replacing per unit of depleted supplies, and is the additional income from selling refurbished relief supplies. The second half of the formula includes cost items, such as for the production costs of government relief supplies, as the conventional loss cost of providing new supplies in trade-in transactions, and for the costs of refurbishing depleted supplies. After simplification, the formula is presented as follows:
4.2.2. Enterprise Profit Function in the Event of a Disaster
If a disaster occurs during the agreement period, the profit function for contracted enterprises is analyzed under different scenarios based on the varying demand for relief supplies .
- When , meaning that the demand for emergency supplies is less than the government’s physical reserve , the profit expression for enterprises is as follows:
The profit function structurally resembles the enterprise profit function in a no-disaster scenario. However, a key difference lies in the baseline quantity of supplies considered under the “trade-in” model. In a no-disaster scenario, this baseline comprises all unused supplies . In this scenario (), the baseline shifts to the remaining, unused supplies in the government’s stockpile . The formula, after simplification, is presented as follows:
- 2.
- When , meaning that the government’s physical stock is insufficient to meet the relief supplies demand , additional supplies need to be purchased from the spot market without any trade-in transactions. Under these circumstances, the profit expression for enterprises is as follows:
Here, represents the revenue from the sale of supplies from the government’s physical stock.
Based on the profit analysis above, considering the optimal physical stock of emergency supplies under the trade-in model for the purchaser, the profit function for the enterprise (supplier) under the trade-in model is as follows:
Proposition 2.
Under the “trade-in” strategy, when the government’s optimal physical stock
, the optimal stock is differentially affected by the cost of relief supplies. Specifically, as the post-disaster spot purchase cost increases, the government’s optimal physical stock will increase; however, as the regular purchase price of emergency supplies rises, the government will reduce its physical stock . Concurrently, the expected cost function of the government (as the purchaser) also increases with the rising costs and .
Proof of Proposition 2.
Under this strategy, when the government’s optimal stock reaches , we can derive the first derivatives of with respect to and using the following implicit function theorem:
Further, by solving for the first derivatives of the government’s cost function with respect to and , we obtain the following:
Therefore, Proposition 2 is proven. From a cost perspective, an increase in post-disaster spot purchase costs () indicates that supplies may become scarcer and more expensive in the market, leading to higher procurement costs for the government. To mitigate this risk, the government might lean towards utilizing its reserves. Moreover, a rise in supply prices post-disaster reflects the market’s response to scarcity, and the government may view this as a signal of future shortages, adjusting its reserve strategy accordingly. If the regular price () increases, it signifies a rise in reserve costs during non-disaster times, possibly leading the government to reduce stockpiles to fit the budget. Additionally, the government might consider strategies such as encouraging private stockpiling, international cooperation, or seeking alternative supply chains to lessen dependence on high-cost supplies. □
Proposition 3.
Under the “trade-in” strategy, the government’s optimal physical stock
. This optimal stock is influenced by the probability of disaster occurrence; the higher the probability, the greater the government’s physical stock
will be.
Proof of Proposition 3.
By applying the implicit function theorem, the first derivative of the government’s optimal physical stock with respect to the disaster occurrence probability is derived as follows:
In summary, Proposition 3 is proven. This proposition suggests that as the probability of disasters increases, the government is likely to enhance its emergency preparedness levels to mitigate risks and potential negative impacts. Economically, it is more prudent to pre-stock supplies. With the increased likelihood of disasters, the anticipated future costs, such as high post-disaster emergency procurement prices, support for the populace, and other related economic losses, are likely to exceed the current costs of boosting reserves. □
Proposition 4.
Under the trade-in strategy, the government’s optimal physical stock
is influenced by the characteristics of the supplies, primarily the difficulty of storage and the urgency of need . As the cost associated with storage difficulty increases, the optimal stock decreases; conversely, as the urgency and associated costs increase, the optimal stock increases. Consequently, an increase in the costs related to storage difficulty and urgency leads to an increase in the government’s cost function .
Proof of Proposition 4.
First, following the implicit function theorem, the first derivatives with respect to and are calculated as follows:
Next, the first derivatives of the government’s cost function with respect to and are calculated as follows:
Therefore, Proposition 4 is confirmed. The “trade-in” strategy necessitates an effective mechanism for recycling old supplies. For supplies that are difficult to store or require special handling, the government may reduce the stock due to the high costs and difficulties associated with replacement. In this model, the urgency might involve the rapid replacement of old supplies. Essential items, such as medical equipment, might need a swift “trade-in” to ensure uninterrupted service. For supplies with a high level of urgency, the government may increase stock levels to ensure old supplies can be quickly replaced and sufficient new supplies are available to meet emergency demands. Additionally, high costs associated with storage difficulty and the urgency of replacement can impact the recycling rate of old supplies and the procurement strategies for new supplies, thereby increasing the cost function . □
Proposition 5.
Under the “trade-in” strategy, the government’s trade-in priceis a decreasing function of the optimal physical reserve stock , whereas the residual value of supplies not traded-in is an increasing function of . Regarding the cost function, as the trade-in price increases, the government’s cost function also increases; conversely, the residual valueof the supplies acts as a decreasing function of the government’s cost function.
Proof of Proposition 5.
First, by applying the implicit function theorem, the first-order derivatives of with respect to and are computed as follows:
Further deriving the first-order derivatives of with respect to and yields the following results:
Proposition 5 is confirmed by Equations (28)–(31). As the price for trade-ins increases, the cost of such transactions becomes higher for the government, making it less inclined to engage in extensive trade-in activities. Consequently, they might opt to reduce their reserve quantities to decrease the future need for trade-in materials. The residual value reflects the remaining value of the materials. A higher residual value might imply that, even if the materials are not used for trade-ins, they still retain some value or utility. This could encourage the government to increase their reserve quantities, as the materials would not completely lose their value even without a transaction. The cost function increases with the trade-in price, also raising the government’s procurement costs. A higher residual value indicates that the materials still hold value. Therefore, even if the government cannot sell them through trade-in transactions, these materials would not lead to significant losses. This helps reduce the total cost for the government. □
4.3. Supply-Chain Coordination Model
Given the government’s cost function under the trade-in strategy, , and the profit function for the supply side enterprise, , supply-chain coordination is achieved when . The specific formula for the coordinated profit of the supply chain is as follows:
Proposition 6.
Under the trade-in strategy, the supply chain reaches a state of coordination when the following formula is satisfied:
Proof of Proposition 6.
Taking the first derivative of Equation (32) with respect to yields the following:
Taking the second derivative of further yields the following result:
From Equation (35), it is evident that the second derivative of the profit function under supply-chain coordination with respect to is less than zero, indicating that the profit function in the coordinated state is a convex function. Therefore, there exists an optimal government emergency material reserve quantity , which maximizes the profit function of the supply chain. The optimal reserve quantity can be determined by setting the first derivative of the supply-chain profit function with respect to to zero in on the coordinated state, as shown below:
When , the supply chain reaches a state of coordination, satisfying the following formula condition:
□
Proposition 7.
When the supply chain is in a state of coordination, both the government’s physical reserve quantity
and the expected profit of the supply chain are increasing functions of the trade-in resale price . Additionally, the government’s physical reserve quantity and the expected profit of the supply chain are decreasing functions of the refurbishment cost of the recovered emergency materials .
Proof of Proposition 7.
By applying the implicit function theorem to Equation (36), the first derivatives with respect to the trade-in resale price and the refurbishment cost of the recovered emergency materials are obtained as follows:
Similarly, by solving for the first derivatives of the profit function under supply-chain coordination with respect to and , we obtain the following:
Based on the above, Proposition 7 is proven. A higher resale price increases the attractiveness of the trade-in model because it represents greater potential profits. Consequently, a supply chain expecting higher profits might increase the optimal reserve quantity to enhance its profits . On the other hand, an increase in refurbishment costs directly affects the economic viability of trade-ins. As costs rise, the profit potential of the entire transaction decreases, leading the supply chain to potentially lower its expected profits and, consequently, reduce its physical reserves . □
Proposition 8.
When the supply chain is in a coordinated state, the buyer’s physical reserve quantity
and the expected profit of the supply chain are influenced by the trade-in price . Specifically, as the trade-in price increases, both the optimal physical reserve quantity of the supply chain and the expected profit decrease.
Proof of Proposition 8.
First, by applying the Implicit Function Theorem, the first derivatives of the optimal physical reserve and the supply-chain profit function with respect to are calculated as follows:
Thus, Proposition 8 is confirmed. When the supply chain is in a coordinated state, all participants (government and supply enterprises) strive to ensure the overall benefit of the supply chain. As increases, the costs faced by the buyer increase, which may reduce the expected overall profit throughout the supply chain. This is because the buyer might be less inclined to engage actively in trade-in transactions or might opt for trading smaller quantities of materials to maintain a certain profit margin. □
Proposition 9.
When the supply chain is in a coordinated state, the physical reserve quantity of the buyer (government) under the trade-in model, , and the expected profit of the supply chain are influenced by the characteristics of the materials themselves, primarily in two dimensions. The first dimension is influenced by the adjustment cost of storage difficulty ; as increases, the government’s optimal physical reserve quantity will decrease, and the profit function of the supply chain will also decline. The second dimension is influenced by the adjustment cost of emergency level ; as increases, the government’s optimal physical reserve quantity will also increase, but the profit function of the supply chain will decrease.
Proof of Proposition 9.
When the supply chain is in a coordinated state, solving for the first derivatives of the optimal reserve quantity with respect to the two variables related to material characteristics, and , yields the following results:
Furthermore, solving for the first derivatives of the supply-chain profit function with respect to and yields the following results:
Based on the above results, Proposition 9 is proven. Under the trade-in strategy, the storability of materials, especially characteristics related to their stability, storage conditions, and shelf life, becomes increasingly important. Higher storage difficulty implies higher storage costs, which may lead the government to reduce the reserve quantities of such materials, thereby decreasing the frequency of trade-in transactions. Increased storage costs can lead to a decrease in the overall profit of the supply chain, particularly under the trade-in strategy. The level of emergency demand for materials can influence how the government and supply-chain plan and implement these transactions. A high level of urgency means the government may need to maintain larger reserves to ensure sufficient supply in emergencies. While the government might be willing to pay more to ensure material availability, the high transaction costs could lead to a reduction in the overall profit of the supply chain. □
5. Numerical Examples
This chapter models and solves the problem of updating and rotating relief supplies. It includes a case study analysis under a trade-in rotation strategy, setting parameters based on real data from the “7·20” heavy rain event in Zhengzhou, Henan, and parameters found in emergency management literature. From 17–23 July 2021, Henan Province in China was struck by an unprecedented heavy rain event, triggering severe flood disasters. Especially on 20 July, Zhengzhou City faced extreme casualties and property losses, with a total of 398 people reported dead or missing throughout the province, of which 95.5% were from Zhengzhou alone. During this event, the average duration of the heavy rainfall in various areas of Henan reached 72 h, particularly in Xuchang and Xinxiang, which endured the longest periods of rain, followed by Anyang and Zhengzhou. The rainfall initially concentrated in northern Henan and Zhengzhou, with its intensity beginning to lessen on 23 July. This paper uses this case study to enhance the understanding and analysis of optimal pre-positioning decisions for relief supplies.
5.1. Parameter Setting
This section aims to explore how the trade-in strategy affects the updating and rotation of government emergency supplies in disaster environments. It uses the 2011 “7·20” extreme rainfall event in Zhengzhou, Henan as a case study. This flood disaster had a significant impact on Zhengzhou and its surrounding areas, causing severe casualties and property damage. Given the urgency of the situation, the pre-positioning of supplies and their timely dispatch to Zhengzhou after the disaster is especially crucial. This study randomly selected two types of supplies: medicines and life jackets, labeled as A and B respectively. By examining the prices of these supplies before and after the disaster, along with parameter settings from emergency management literature, as shown in Table 2, this paper further analyzes the setup of these parameters.
Table 2.
Model parameter assignment.
5.2. Optimal Decision-Making and Sensitivity Analysis
Figure 3 illustrates the impact of post-disaster spot purchase costs pm on the optimal physical reserve quantity , using the probability of disaster occurrence as the x-axis. From the graph, it can be observed that the optimal reserve quantities for materials A and B both increase with the rise in post-disaster spot purchase costs, consistent with the results stated in Proposition 2.
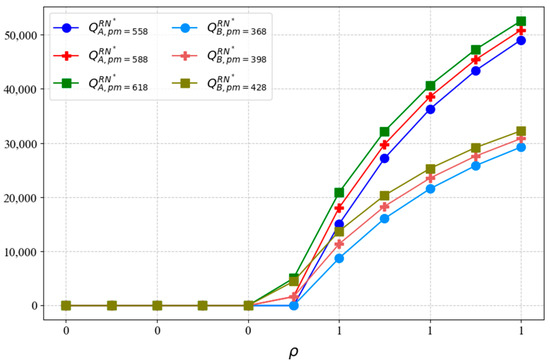
Figure 3.
Impact of on .
In the trade-in model, Figure 4 illustrates how the prices of emergency supplies purchased conventionally affect the government’s optimal physical reserve levels. The graph uses the likelihood of a disaster occurring as the x-axis and demonstrates that the optimal storage amounts for supplies A and B decrease with rising costs of conventionally purchased emergency supplies. These findings in Figure 4 align with the outcomes outlined in Proposition 2.
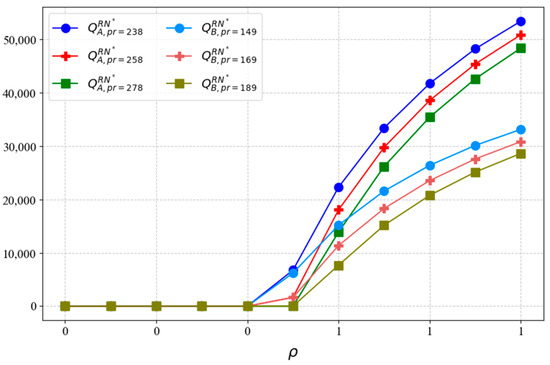
Figure 4.
Impact of on .
Figure 5, under the trade-in model, displays the impact of storage loss costs on the government’s optimal physical reserve quantity . The storage loss costs include the difficulty of storing the supplies as well as the urgency of the supplies . From Figure 5, we observe that the optimal reserve quantities for supplies A and B increase with the difficulty of storage but decrease as the urgency of the materials increases. These results are consistent with those presented in Proposition 4.
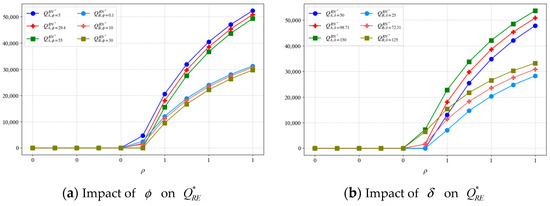
Figure 5.
Impact of and on .
Figure 6, under the trade-in model, demonstrates the impact of the trade-in price offered by the government to businesses on the government’s optimal physical reserve quantity . The graph shows that the optimal reserve quantities for materials A and B decrease as the trade-in price increases. The results presented in Figure 6 align with those described in Proposition 8.
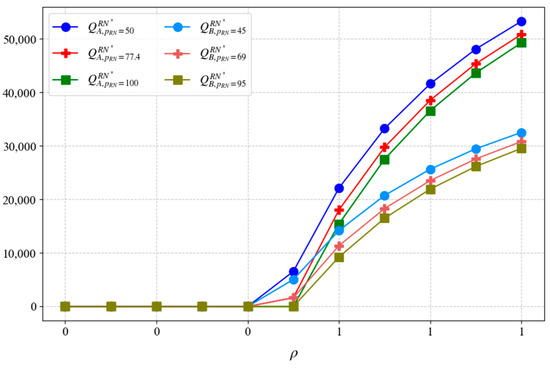
Figure 6.
Impact of on .
6. Discussion and Implications
6.1. Discussion
By introducing a trade-in strategy for pre-positioning relief supplies, this paper proposes an innovative resource management method that challenges traditional disaster response supply-chain management models. Our findings align with existing studies in the literature on the importance of cost-effectiveness and resource optimization in disaster management. However, by integrating supply-chain coordination with cost management, this research broadens our understanding of disaster relief supply management, highlighting the potential of the trade-in strategy to minimize resource waste and enhance response efficiency.
Proposition 1 demonstrates the complex impact of various parameters—such as the probability of disaster occurrence, supply purchase costs, and costs associated with storage and urgent needs—on the optimal reserve strategy. This aspect has not been sufficiently discussed in previous studies, especially concerning the influence of residual value and refurbishment costs on supply-chain coordination. By quantifying how these factors affect the optimal configuration of disaster relief supplies, this study provides more detailed theoretical support, informing future policymaking and practical operations.
Propositions 2 and 3 further reveal how the costs of disaster relief supplies and the likelihood of disasters impact the optimal physical reserve quantity. Specifically, an increase in post-disaster spot purchase costs will raise the optimal reserve quantity, whereas an increase in regular purchase prices will reduce it. Proposition 4 discusses the effects of storage difficulty and the urgency of needs on optimal inventory levels. Higher costs associated with storage difficulty lower the government’s optimal physical reserve quantity, while higher urgency costs increase it. This finding emphasizes the need for governments to consider the characteristics of supplies when formulating disaster relief supply strategies to optimize reserve configurations.
Propositions 5–9 explore cost functions and supply-chain coordination issues under the trade-in strategy, illustrating how trade prices, residual values of supplies, and refurbishment costs impact cost efficiency and operational effectiveness. Particularly, in a coordinated supply-chain state, the physical reserve quantity and expected profits are closely linked to trade prices and refurbishment costs. Higher trade-in prices lead to an increased optimal reserve quantity, while higher refurbishment costs lead to a reduction.
The discussion of these results suggests that governments should carefully consider the methods of rotating supplies within disaster relief supply chains, making optimal decisions based on cost parameters, the characteristics of supplies, and relevant parameters of the trade-in model to reduce costs and achieve supply-chain coordination.
6.2. Implications
This paper introduces a trade-in strategy to provide decision-making insights for governments and humanitarian organizations in pre-positioning relief supplies, as well as practical implications for policymakers and decisionmakers in a variety of public and private organizations.
For public organizations such as governments, pre-positioning relief supplies can significantly improve the efficiency of disaster response. Firstly, governments need to dynamically adjust their reserve strategies based on the predicted disaster probabilities, costs of supply procurement, storage difficulties, and the urgency of demand. Improving post-disaster spot procurement capacity and reducing regular procurement costs can effectively optimize inventory levels to meet diverse disaster response needs. Secondly, governments can optimize cost control by improving the efficiency of trade-in transactions and reducing material procurement and storage costs. Implementing more cost-effective material recycling and updating systems can reduce overall expenditures. Additionally, new technologies such as big data, blockchain, and smart algorithms can be utilized to monitor and optimize the use and storage of supplies, ensuring resources are used effectively and waste is minimized. Thirdly, public organizations should strengthen interdepartmental collaboration and encourage cooperation among different government departments and between public and private sectors. This facilitates resource sharing and information exchange, and improves the synergy between reserves and disaster responses.
For private sector stakeholders such as suppliers, who also play a crucial role in the relief supply-chain and trade-in processes, several responsibilities are highlighted. First, as key players in emergency response, suppliers should enhance supply-chain resilience by optimizing supply-chain design to bolster the robustness of material supply. Advanced technologies like big data can be employed to monitor supply chains, analyze data, predict potential risks, and enhance risk response capabilities. Secondly, while ensuring robust supply, profitability must also be safeguarded through effective cost analysis. Pricing strategies should be adjusted based on the residual value and refurbishment costs of supplies to ensure social responsibilities are met without incurring losses. Lastly, from a long-term perspective, companies can invest in disaster prevention and response capabilities to mitigate disaster risks and ensure reliable supply. Establishing partnerships with government agencies, non-governmental organizations, and other businesses can provide additional resources and information, share best practices, and collectively enhance disaster response efficiency.
7. Conclusions and Limitation
7.1. Conclusions
This paper offers a detailed analysis of the government’s strategy for pre-positioning disaster relief supplies through a trade-in model. We examined how this approach affects the government’s optimal reserve quantities, revealing the combined impact of several factors: the cost of relief supplies, the likelihood of disaster occurrence, storage challenges, and the urgency of demand on reserve decisions. Our findings indicate that as the cost of post-disaster spot purchases rises, the government should bolster its reserves. Conversely, when the regular purchase price increases, reserves should be scaled back. Additionally, we investigated how supply chains can achieve coordination under a trade-in strategy, analyzing the effects of trade-in prices and refurbishment costs on the overall supply-chain benefits. We discovered that with appropriate trade-in prices and low refurbishment costs, the supply chain can maximize mutual benefits. This research not only provides theoretical and practical guidance for governmental management of supplies in disaster response but also offers valuable insights into improving supply-chain coordination and disaster response efficiency.
7.2. Limitations
This paper has certain limitations. First, in the trade-in model, the clientele for enterprises is not limited to government entities but extends to a broad market demand. This paper only considers the volume of emergency supplies that businesses sell to the government for rotation and does not account for the broader market demand that businesses face, thereby overlooking the potential profits that could be garnered from market-driven demands. Additionally, there is significant uncertainty associated with disaster occurrences, and governments cannot predict the exact timing of these events. In such cases, governments often need to make multi-period decisions. However, this paper only considers a single-period decision and does not address the issues related to the rotation of emergency reserves over multiple periods. These aspects present directions for future research.
Author Contributions
Conceptualization, J.Y. (Jianliang Yang) and H.H.; methodology, J.Y. (Jianliang Yang); software, Y.J.; validation, Y.J., J.Y. (Jimei Yang) and Y.R.; formal analysis, Y.R.; investigation, Y.R.; resources, Y.J.; data curation, Y.J.; writing—original draft preparation, J.Y. (Jianliang Yang); writing—review and editing, H.H.; visualization, H.H.; supervision, H.H.; project administration, Y.J.; funding acquisition, H.H. All authors have read and agreed to the published version of the manuscript.
Funding
This research was funded by Hanping Hou under the Ministry of Education of Humanities and Social Sciences project, grant number 21YJA630029.
Data Availability Statement
The data presented in this study are available on request from the author.
Acknowledgments
We gratefully acknowledge the funding received from the Ministry of Education of Humanities and Social Sciences project under Grant No. 21YJA630029 for supporting this work.
Conflicts of Interest
The authors declare no conflicts of interest.
References
- Patra, T.D.P.; Jha, J.K. Bidirectional option contract for prepositioning of relief supplies under demand uncertainty. Comput. Ind. Eng. 2022, 163, 107861. [Google Scholar] [CrossRef]
- Hu, Z.; Tian, J.; Feng, G. A relief supplies purchasing model based on a put option contract. Comput. Ind. Eng. 2019, 127, 253–262. [Google Scholar] [CrossRef]
- Ai, Y.-F.; Tian, J.; Feng, G.-Z. Pre-positioning and procurement strategy for relief supplies with the critical raw material participation. Comput. Ind. Eng. 2024, 187, 109780. [Google Scholar] [CrossRef]
- Liu, Y.; Tian, J.; Feng, G. Pre-positioning strategies for relief supplies in a relief supply chain. J. Oper. Res. Soc. 2022, 73, 1457–1473. [Google Scholar] [CrossRef]
- Wang, X.; Wu, Y.; Liang, L.; Huang, Z. Service outsourcing and disaster response methods in a relief supply chain. Ann. Oper. Res. 2016, 240, 471–487. [Google Scholar] [CrossRef]
- Hu, S.; Ma, Z.-J.; Sheu, J.-B. Optimal prices and trade-in rebates for successive-generation products with strategic consumers and limited trade-in duration. Transp. Res. Part E-Logist. Transp. Rev. 2019, 124, 92–107. [Google Scholar] [CrossRef]
- Xiao, Y.; Zhou, S.X. Trade-in for Cash or for Upgrade? Dynamic Pricing with Customer Choice. Prod. Oper. Manag. 2020, 29, 856–881. [Google Scholar] [CrossRef]
- Tang, F.; Ma, Z.-J.; Dai, Y.; Choi, T.-M. Upstream or Downstream: Who Should Provide Trade-in Services in Dyadic Supply Chains? Decis. Sci. 2021, 52, 1071–1108. [Google Scholar] [CrossRef]
- Tang, F.; Dai, Y.; Ma, Z.-J. Optimal joint trade-in rebate strategies in a retailer-led supply chain. Manag. Decis. Econ. 2023, 44, 399–415. [Google Scholar] [CrossRef]
- Shi, P.; Chen, X. Analysis on trade-in strategy of manufacturers competing with informal recycling enterprises. Environ. Sci. Pollut. Res. 2023, 30, 66274–66290. [Google Scholar] [CrossRef]
- Feng, L.; Li, Y.; Fan, C. Optimization of pricing and quality choice with the coexistence of secondary market and trade-in program. Ann. Oper. Res. 2020. [Google Scholar] [CrossRef]
- Li, W.; Tian, L. Optimizing prices in trade-in strategies for vehicle retailers. Expert Syst. Appl. 2024, 238, 122004. [Google Scholar] [CrossRef]
- Natarajarathinam, M.; Capar, I.; Narayanan, A. Managing supply chains in times of crisis: A review of literature and insights. Int. J. Phys. Distrib. Logist. Manag. 2009, 39, 535–573. [Google Scholar] [CrossRef]
- Balcik, B.; Ak, D. Supplier Selection for Framework Agreements in Humanitarian Relief. Prod. Oper. Manag. 2014, 23, 1028–1041. [Google Scholar] [CrossRef]
- Cankaya, E.; Ekici, A.; Ozener, O.O. Humanitarian relief supplies distribution: An application of inventory routing problem. Ann. Oper. Res. 2019, 283, 119–141. [Google Scholar] [CrossRef]
- Day, J.M.; Melnyk, S.A.; Larson, P.D.; Davis, E.W.; Whybark, D.C. Humanitarian and Disaster Relief Supply Chains: A Matter of Life and Death. J. Supply Chain Manag. 2012, 48, 21–36. [Google Scholar] [CrossRef]
- Gossler, T.; Wakolbinger, T.; Burkart, C. Outsourcing in humanitarian logistics—Status quo and future directions. Int. J. Phys. Distrib. Logist. Manag. 2020, 50, 403–438. [Google Scholar] [CrossRef]
- Upadhyay, A.; Mukhuty, S.; Kumari, S.; Garza-Reyes, J.A.; Shukla, V. A review of lean and agile management in humanitarian supply chains: Analysing the pre-disaster and post-disaster phases and future directions. Prod. Plan. Control 2022, 33, 641–654. [Google Scholar] [CrossRef]
- Wang, D.; Yang, K.; Yang, L.; Dong, J. Two-stage distributionally robust optimization for disaster relief logistics under option contract and demand ambiguity. Transp. Res. Part E-Logist. Transp. Rev. 2023, 170, 103025. [Google Scholar] [CrossRef]
- Fan, Y.; Shao, J.; Wang, X.; Liang, L. Contract design between relief organisations and private-sector vendors: A humanitarian logistics framework. Transp. Res. Part E-Logist. Transp. Rev. 2024, 182, 103395. [Google Scholar] [CrossRef]
- Wang, Z.Y.; Jia, H.M. An intuitionistic fuzzy grey-Markov method with application to demand forecasting for emergency supplies during major epidemics. Grey Syst.-Theory Appl. 2024, 14, 185–208. [Google Scholar] [CrossRef]
- Taskin, S.; Lodree, E.J. A Bayesian decision model with hurricane forecast updates for emergency supplies inventory management. J. Oper. Res. Soc. 2011, 62, 1098–1108. [Google Scholar] [CrossRef]
- Zhang, L.; Tian, J.; Fung, R.Y.K.; Dang, C.Y. Materials procurement and reserves policies for humanitarian logistics with recycling and replenishment mechanisms. Comput. Ind. Eng. 2019, 127, 709–721. [Google Scholar] [CrossRef]
- Yadavalli, V.S.S.; Sundar, D.K.; Udayabaskaran, S. Two substitutable perishable product disaster inventory systems. Ann. Oper. Res. 2015, 233, 517–534. [Google Scholar] [CrossRef]
- Rezaei-Malek, M.; Tavakkoli-Moghaddam, R.; Zahiri, B.; Bozorgi-Amiri, A. An interactive approach for designing a robust disaster relief logistics network with perishable commodities. Comput. Ind. Eng. 2016, 94, 201–215. [Google Scholar] [CrossRef]
- Zhou, Q.S.; Olsen, T.L. Rotating the medical supplies for emergency response: A simulation based approach. Int. J. Prod. Econ. 2018, 196, 1–11. [Google Scholar] [CrossRef]
- Meng, Q.C.; Guo, Y.; Zhao, P.X.; Lu, T.X.; Wan, X.L.; Rong, X.X.; Pan, W. Optimization and simulation for airport emergency inventory with replacement. Int. J. Simul. Model. 2017, 16, 133–144. [Google Scholar] [CrossRef] [PubMed]
- Arani, H.V.; Rabbani, M.; Rafiei, H. A revenue-sharing option contract toward coordination of supply chains. Int. J. Prod. Econ. 2016, 178, 42–56. [Google Scholar] [CrossRef]
- Charles, A.; Lauras, M.; Van Wassenhove, L.N.; Dupont, L. Designing an efficient humanitarian supply network. J. Oper. Manag. 2016, 47–48, 58–70. [Google Scholar] [CrossRef]
- Roh, S.Y.; Shin, Y.; Seo, Y.J. The Pre-positioned Warehouse Location Selection for International Humanitarian Relief Logistics. Asian J. Shipp. Logist. 2018, 34, 297–307. [Google Scholar] [CrossRef]
- Roh, S.; Pettit, S.; Harris, I.; Beresford, A. The pre-positioning of warehouses at regional and local levels for a humanitarian relief organisation. Int. J. Prod. Econ. 2015, 170, 616–628. [Google Scholar] [CrossRef]
- Chen, J.X.; Liang, L.; Yao, D.Q. Pre-positioning of relief inventories: A multi-product newsvendor approach. Int. J. Prod. Res. 2018, 56, 6294–6313. [Google Scholar] [CrossRef]
- Duran, S.; Gutierrez, M.A.; Keskinocak, P. Pre-Positioning of Emergency Items for CARE International. Interfaces 2011, 41, 223–237. [Google Scholar] [CrossRef]
- Sotelo-Salas, C.; Monardes-Concha, C.A.; Pérez-Galarce, F.; Santa González, R. A multi-objective optimization model for planning emergency shelters after a tsunami. Socio-Econ. Plan. Sci. 2024, 93, 101909. [Google Scholar] [CrossRef]
- Rawls, C.G.; Turnquist, M.A. Pre-positioning planning for emergency response with service quality constraints. OR Spectr. 2011, 33, 481–498. [Google Scholar] [CrossRef]
- Aslan, E.; Çelik, M. Pre-positioning of relief items under road/facility vulnerability with concurrent restoration and relief transportation. IISE Trans. 2019, 51, 847–868. [Google Scholar] [CrossRef]
- Hu, S.L.; Hu, Q.M.; Tao, S.; Dong, Z.S. A multi-stage stochastic programming approach for pre-positioning of relief supplies considering returns. Socio-Econ. Plan. Sci. 2023, 88, 101617. [Google Scholar] [CrossRef]
- Torabi, S.A.; Shokr, I.; Tofighi, S.; Heydari, J. Integrated relief pre-positioning and procurement planning in humanitarian supply chains. Transp. Res. Part E-Logist. Transp. Rev. 2018, 113, 123–146. [Google Scholar] [CrossRef]
- Ni, W.J.; Shu, J.; Song, M. Location and Emergency Inventory Pre-Positioning for Disaster Response Operations: Min-Max Robust Model and a Case Study of Yushu Earthquake. Prod. Oper. Manag. 2018, 27, 160–183. [Google Scholar] [CrossRef]
- Che, A.; Li, J.; Chu, F.; Chu, C.B. Optimizing emergency supply pre-positioning for disaster relief: A two-stage distributionally robust approach. Comput. Oper. Res. 2024, 166, 106607. [Google Scholar] [CrossRef]
- Yang, M.; Liu, Y.K.; Yang, G.Q. Multi-period dynamic distributionally robust pre-positioning of emergency supplies under demand uncertainty. Appl. Math. Model. 2021, 89, 1433–1458. [Google Scholar] [CrossRef]
- Rezaei-Malek, M.; Tavakkoli-Moghaddam, R.; Cheikhrouhou, N.; Taheri-Moghaddam, A. An approximation approach to a trade-off among efficiency, efficacy, and balance for relief pre-positioning in disaster management. Transp. Res. Part E-Logist. Transp. Rev. 2016, 93, 485–509. [Google Scholar] [CrossRef]
- Arnette, A.N.; Zobel, C.W. A Risk-Based Approach to Improving Disaster Relief Asset Pre-Positioning. Prod. Oper. Manag. 2019, 28, 457–478. [Google Scholar] [CrossRef]
- Wang, J.; Cai, J.P.; Yue, X.H.; Suresh, N.C. Pre-positioning and real-time disaster response operations: Optimization with mobile phone location data. Transp. Res. Part E-Logist. Transp. Rev. 2021, 150, 102344. [Google Scholar] [CrossRef]
- Kouvelis, P.; Zhao, W.H. Who Should Finance the Supply Chain? Impact of Credit Ratings on Supply Chain Decisions. MSom-Manuf. Serv. Oper. Manag. 2018, 20, 19–35. [Google Scholar] [CrossRef]
- Ergun, Ö.; Gui, L.; Heier Stamm, J.L.; Keskinocak, P.; Swann, J. Improving Humanitarian Operations through Technology-Enabled Collaboration. Prod. Oper. Manag. 2014, 23, 1002–1014. [Google Scholar] [CrossRef]
- Cai, J.H.; Zhong, M.; Shang, J.F.; Huang, W.L. Coordinating VMI supply chain under yield uncertainty: Option contract, subsidy contract, and replenishment tactic. Int. J. Prod. Econ. 2017, 185, 196–210. [Google Scholar] [CrossRef]
- Wang, X.H.; Li, F.; Liang, L.; Huang, Z.M.; Ashley, A. Pre-purchasing with option contract and coordination in a relief supply chain. Int. J. Prod. Econ. 2015, 167, 170–176. [Google Scholar] [CrossRef]
- Xue, K.L.; Li, Y.J.; Zhen, X.P.; Wang, W. Managing the supply disruption risk: Option contract or order commitment contract? Ann. Oper. Res. 2020, 291, 985–1026. [Google Scholar] [CrossRef]
- Wang, X.H.; Fan, Y.; Liang, L.; De Vries, H.; Van Wassenhove, L.N. Augmenting Fixed Framework Agreements in Humanitarian Logistics with a Bonus Contract. Prod. Oper. Manag. 2019, 28, 1921–1938. [Google Scholar] [CrossRef]
- Noham, R.; Tzur, M. Design and incentive decisions to increase cooperation in humanitarian relief networks. Iise Trans. 2020, 52, 1297–1311. [Google Scholar] [CrossRef]
- Cai, J.H.; Hu, X.Q.; Han, Y.; Cheng, H.F.; Huang, W.L. Supply chain coordination with an option contract under vendor-managed inventory. Int. Trans. Oper. Res. 2016, 23, 1163–1183. [Google Scholar] [CrossRef]
- Elçi, Ö.; Noyan, N. A chance-constrained two-stage stochastic programming model for humanitarian relief network design. Transp. Res. Part B-Methodol. 2018, 108, 55–83. [Google Scholar] [CrossRef]
- Nosoohi, I.; Nookabadi, A.S. Outsource planning through option contracts with demand and cost uncertainty. Eur. J. Oper. Res. 2016, 250, 131–142. [Google Scholar] [CrossRef]
- Doganoglu, T.; Inceoglu, F. Buyback contracts to solve upstream opportunism. Eur. J. Oper. Res. 2020, 287, 875–884. [Google Scholar] [CrossRef]
- Kremer, M.; Van Wassenhove, L.N. Willingness to Pay for Shifting Inventory Risk: The Role of Contractual Form. Prod. Oper. Manag. 2014, 23, 239–252. [Google Scholar] [CrossRef]
- Nikkhoo, F.; Bozorgi-Amiri, A.; Heydari, J. Coordination of relief items procurement in humanitarian logistic based on quantity flexibility contract. Int. J. Disaster Risk Reduct. 2018, 31, 331–340. [Google Scholar] [CrossRef]
- Aghajani, M.; Torabi, S.A.; Heydari, J. A novel option contract integrated with supplier selection and inventory prepositioning for humanitarian relief supply chains. Socio-Econ. Plan. Sci. 2020, 71. [Google Scholar] [CrossRef]
- Qin, Y.H.; Shao, Y.F.; Gu, B. Buyback contract coordination in supply chain with fairness concern under demand updating. Enterp. Inf. Syst. 2021, 15, 725–748. [Google Scholar] [CrossRef]
- Zhao, X.; Xia, X.H.; Yu, G.D. Buyback contract of reverse supply chains with different risk attitudes under fuzzy demands. J. Intell. Fuzzy Syst. 2018, 34, 47–56. [Google Scholar] [CrossRef]
- Vafaeinejad, K.; Sajadieh, M.S. Trade-in price and base warranty length: A heuristic algorithm for concurrent optimization. Comput. Ind. Eng. 2022, 171, 108504. [Google Scholar] [CrossRef]
- Tang, F.; Dai, Y.; Ma, Z.-J.; Choi, T.-M. Trade-in operations under retail competition: Effects of brand loyalty. Eur. J. Oper. Res. 2023, 310, 397–414. [Google Scholar] [CrossRef]
- Li, Y.; Wang, K.; Xu, F.; Fan, C. Management of trade-in modes by recycling platforms based on consumer heterogeneity. Transp. Res. Part E-Logist. Transp. Rev. 2022, 162, 102721. [Google Scholar] [CrossRef]
- Xiao, L.; Wang, X.J.; Chin, K.S. Trade-in strategies in retail channel and dual-channel closed-loop supply chain with remanufacturing. Transp. Res. Part E-Logist. Transp. Rev. 2020, 136, 101898. [Google Scholar] [CrossRef]
- Feng, L.P.; Li, Y.J.; Xu, F.C.; Deng, Q.Z. Optimal pricing and trade-in policies in a dual-channel supply chain when considering market segmentation. Int. J. Prod. Res. 2019, 57, 2828–2846. [Google Scholar] [CrossRef]
- Xiao, L.; Chen, Z.S.; Govindan, K.; Skibniewski, M.J. Effects of Online Consumer Reviews on a Dual-Channel Closed-Loop Supply Chain With Trade-In. IEEE Trans. Eng. Manag. 2024, 71, 2168–2183. [Google Scholar] [CrossRef]
- Dowty, R.A.; Wallace, W.A. Implications of organizational culture for supply chain disruption and restoration. Int. J. Prod. Econ. 2010, 126, 57–65. [Google Scholar] [CrossRef]
- Boroumand, A.; Nojavan, M.; Mohammaditabar, D.; Ghaemi, R. Competitive Relief Supply Chain under the Uncertain Conditions. Discret. Dyn. Nat. Soc. 2023, 2023, 3352255. [Google Scholar] [CrossRef]
- Shokr, I.; Jolai, F.; Bozorgi-Amiri, A. A collaborative humanitarian relief chain design for disaster response. Comput. Ind. Eng. 2022, 172, 108643. [Google Scholar] [CrossRef]
- Zhu, R.; Chen, X.L.; Dasgupta, S. Can trade-ins hurt you? Exploring the effect of a trade-in on consumers’ willingness to pay for a new product. J. Mark. Res. 2008, 45, 159–170. [Google Scholar] [CrossRef]
- Cao, K.Y.; Xu, X.Y.; Bian, Y.W.; Sun, Y.H. Optimal trade-in strategy of business-to-consumer platform with dual-format retailing model. Omega-Int. J. Manag. Sci. 2019, 82, 181–192. [Google Scholar] [CrossRef]
Disclaimer/Publisher’s Note: The statements, opinions and data contained in all publications are solely those of the individual author(s) and contributor(s) and not of MDPI and/or the editor(s). MDPI and/or the editor(s) disclaim responsibility for any injury to people or property resulting from any ideas, methods, instructions or products referred to in the content. |
© 2024 by the authors. Licensee MDPI, Basel, Switzerland. This article is an open access article distributed under the terms and conditions of the Creative Commons Attribution (CC BY) license (https://creativecommons.org/licenses/by/4.0/).