Abstract
Virtual try-on services, which significantly reduce return rates and enhance user shopping experiences, pose a crucial question: how can user willingness to use these services be increased? Additionally, “Generation Z” consumers, known for their unique traits and significant consumption potential, have been relatively understudied in this context. To address this theoretical gap, this study employs the Stimulus–Organism–Response (S-O-R) theory as its research framework, using online virtual shoe try-on services as a case study. Focusing on “Generation Z” consumers, this study utilizes literature review, user research, factor analysis, and linear regression to establish a user experience evaluation scale and behavior model. The user experience evaluation scale identifies positive elements such as convenience, price value, visual information acquisition, emotional value, and social interaction. The negative elements include technical limitations, personalized service deficiencies, and uncertainty. In the behavior model, all elements influence user attitudes. Notably, only the negative elements directly affect users’ willingness to use the service, except social interaction among the positive elements, which positively impacts usage intention. This study also reveals that “Generation Z” consumers have novel requirements for social interaction. This research effectively addresses existing theoretical gaps and provides a foundational theory for the development of related services and technologies.
1. Introduction
Currently, the concept of a sustainable economy has gradually gained worldwide attention, with reducing fossil energy consumption and minimizing product redundancy being essential strategies for promoting a circular economy [1]. However, with the rapid development of the internet, online shopping has become the preferred choice for many consumers, gradually replacing the operational model of traditional brick-and-mortar stores [2,3]. Although online retail brings significant economic benefits, it also poses numerous environmental challenges. Online retail heavily relies on the development of transportation logistics [4], which, in turn, depends extensively on fossil fuels [5]. Studies project that by 2050, logistics will contribute up to 40% of global carbon emissions [5]. While necessary logistics transportation cannot be entirely avoided, consumer return behaviors exacerbate the waste associated with logistics. Moreover, due to the unpredictability of return quantity and timing, retailers may face excessive inventory and product redundancy if the return process is not adequately managed [6]. A core reason for the high rate of consumer returns is that consumers cannot fully evaluate the products solely through photos or videos provided by online stores [7]. In fact, 20% of users may purchase the same item from multiple online stores for trial purposes, returning the items they do not select [8]. Therefore, helping users to fully evaluate products during the online shopping process is an effective means to reduce the probability of returns, minimize the waste of logistic resources, and promote sustainable economic development.
In this context, augmented reality (AR) technology is poised to become an effective tool for helping users understand product specifics without physically interacting with them [9], significantly enhancing the user consumption experience [10]. Research indicates that nearly 40% of users are willing to pay more for AR product experiences, and 61% of consumers prefer purchasing products from brands that offer AR experience services [11]. Consequently, nearly two-thirds of global marketers and executives from the latest young generation consider the reasonable application of AR to be very important [12]. Furthermore, AR virtual experiences can effectively reduce user return rates and the abandonment rates of virtual shopping carts [13]. However, there is a persistent issue of low usage rates for virtual try-on applications in the realm of online shopping [14].
Despite numerous studies exploring factors influencing user intention to use virtual try-on applications through theoretical assumptions and analyses—such as curiosity [15], perceived usefulness and ease of use [16], perceived media characteristics [17], remote presentation [17], fashion leadership [18], vividness [19], technological visibility [20], technological anxiety [18], and privacy concerns [21]—these research methods can only examine the relationship between specific factors and user behavior. They fail to comprehensively summarize the fundamental user experience attributes of such services. Additionally, there is a scarcity of studies that comprehensively evaluate the pros and cons of virtual try-on applications and construct a well-defined user experience evaluation scale.
Therefore, this study adopts a combined approach of quantitative and qualitative analysis, integrating literature research, user interviews, and data analysis, to construct a comprehensive user experience evaluation scale for such services and further explore user behavioral logic. This approach effectively addresses current theoretical shortcomings and provides recommendations and support for the development of related services, thus holding significant theoretical and practical significance.
Simultaneously, “Generation Z” consumers are a demographic group warranting considerable attention. “Generation Z” refers to individuals born from the mid-1990s to the early 2010s [22]. Growing up during the 2000s, this group is significantly influenced by global issues such as climate change and resource scarcity, making them more inclined toward sustainability and responsible consumerism [23]. With a population exceeding one-third of the global total [24], “Generation Z” is a major driver of online consumption, accounting for over 60% of the global online market. In China, their annual spending surpasses 5 trillion RMB, making their online shopping return behavior more prevalent [25]. Moreover, “Generation Z” has been immersed in the internet since birth, rendering them technologically savvy and adept at utilizing various smart technologies to purchase products and services [22]. Their proclivity for hedonistic motivations also makes them more prone to impulsive buying [22,26]. Consequently, “Generation Z” is more likely to embrace innovative virtual fitting room services in online shopping. If these services can be widely adopted and effectively utilized by this demographic, it could significantly boost the development of the online retail economy, reduce return rates, and minimize unnecessary logistical costs. What is more, the research value of this consumer group is substantial, with scholars advocating for more academic studies focused on “Generation Z” [22,25]. Therefore, this study aimed to explore the user experience evaluation scale of virtual fitting room services for “Generation Z” and develop a related user intention model. This approach not only promotes the advancement of relevant services but also provides deeper insights into the consumption characteristics of “Generation Z”, offering a theoretical basis for the sustainable development of the online shopping industry and economy.
Therefore, the core objectives of this study consisted of two main parts. Firstly, a comprehensive and holistic user experience evaluation framework for “Generation Z” consumers was constructed through a combination of quantitative and qualitative research methods. Secondly, leveraging authoritative theoretical frameworks, this study utilized linear regression analysis to construct a behavioral model of user willingness to use virtual fitting rooms. This model aimed to determine the priority of various influencing elements and decipher the behavioral logic of “Generation Z” consumers.
To achieve the research objectives of this paper, Section 2 conducts a review of the pertinent literature to clarify the significance and value of this study. It formulates research hypotheses based on authoritative behavioral models. Section 3 outlines the research methods and procedures employed. Section 4 presents the findings of the data analysis, including results from factor analysis of the user experience evaluation scale and linear regression analysis used to develop the user behavior model. Section 5 begins by identifying factors of the user experience evaluation scale based on factor analysis results and the existing literature, using a temporary notation of “Factor + number” until formal naming. Subsequently, this study conducted additional analysis on the behavioral patterns of “Generation Z” consumers using results from linear regression analysis. Finally, this paper presents constructive design and management recommendations of theoretical significance, aiming to provide a framework for relevant enterprises. Section 6 offers a comprehensive summary of the study’s conclusions, emphasizing encountered limitations and suggesting future research and development directions.
2. Literature Review and Theoretical Framework
2.1. Virtual Try-On Applications
Virtual try-on applications exemplify a prominent use case of AR technology in the realm of clothing selection, offering consumers the ability to virtually experience different styles without physically trying them on, whether in-store or online [9]. Augmented reality seamlessly integrates digital elements into the physical environment, thereby creating a hybrid experience that merges real and virtual worlds, displaying digital and physical objects in tandem [27]. The underlying principle is to merge real and virtual environments, creating new settings and images that simultaneously display digital and physical elements, thereby aligning virtual objects with the user’s real-world experience [28]. By doing so, customers can perceive complex information more simply in the physical world [29,30], aiding them in selecting garments [31]. Furthermore, virtual try-on applications not only leave a lasting impression on users but also gather valuable user preferences, aiding sellers in refining recommendation systems [32]. Despite these benefits, the actual usage of AR technology remains relatively low [14], and academic assessments of virtual fitting rooms vary (see Table 1). This inconsistency contributes to brand hesitation in adopting such services, as leveraging advanced technologies without a clear understanding of their efficacy presents challenges [12]. Therefore, a systematic and comprehensive investigation into the user experience evaluation framework for these services can lay a solid foundation for technology providers in designing and developing enhanced experiences. By improving user experiences and assisting consumers in making informed purchasing decisions, such an evaluation framework can help reduce return rates. Additionally, it can provide brands with a deeper understanding of the strengths and weaknesses of these services, facilitating wider adoption of related technologies.

Table 1.
Literature review on virtual try-on descriptions.
While there exists a wealth of research on the intention to use AR technology [12,42,43], with numerous studies investigating factors such as curiosity [15], perceived usefulness and ease of use [16], perceived media characteristics [17], remote presentation [17], fashion leadership [18], vividness [19], technological visibility [20], technological anxiety [18], and privacy concerns [21], there remains a gap in comprehensive research that summarizes user experience attributes for such services and constructs relevant evaluation scales.
Meanwhile, the “Generation Z” consumers represent a highly promising consumer group for online virtual try-on shopping services, but they have been relatively overlooked in studies related to virtual try-on applications. Furthermore, “Generation Z” consumers exhibit significant differences in value orientation and behavioral logic compared to the general consumer population [22,25]. Therefore, only by thoroughly exploring the inherent logic between various user experience attributes of virtual fitting rooms and user willingness to use can we better determine the priority of each attribute and the behavioral characteristics of “Generation Z” consumers. This will provide more insightful recommendations for the design and optimization of related services.
To achieve this goal, the present study further relied on established behavioral model frameworks, integrating the user experience indicators identified in this study to establish a behavioral model of user willingness to use. This study not only effectively fills previous theoretical gaps but also promotes innovation and development in related services, thereby reducing the rate of product returns in shopping, minimizing the wastage of logistical resources, and fostering economic sustainability.
2.2. Stimulus–Organism–Response (S-O-R) Theory Framework
The Stimulus–Organism–Response (S-O-R) model, proposed by Mehrabian and Russell [44] in 1974, serves as a psychological framework comprising three core elements: Stimulus (S), Organism (O), and Response (R). Stimulus (S) refers to external environmental factors that may influence individual behavior, while Organism represents the psychological mechanism through which users internalize stimuli as information [45]. The Response (R) component represents the user’s behavioral response to the external stimulus information content [46]. This model effectively elucidates the inner logic and behavior of individuals when planning to take action, finding widespread application in research on user behavioral intentions across diverse fields such as marketing [45,47], education [48], and environmental sustainability [49,50]. This model framework systematically elucidates the intrinsic logic of how external product and service characteristics influence user behavior. This approach aided the current study in exploring the relationships between user experience elements and user behavior after constructing an evaluation scale for “Generation Z” consumers regarding virtual try-on services, thereby clarifying users’ psychological and behavioral processes. Although numerous other information system theories exist, such as UTAUT 2 and TAM, these models are overly specific and predefine certain features of information systems, such as usefulness, ease of use, playfulness, and social influence [51]. This study could not confirm that these elements would necessarily be present in the virtual try-on experience evaluation scale for “Generation Z” consumers. Using these pre-established influencing factors would compromise the objectivity of constructing the user experience evaluation scale, potentially interfering with the research results. Therefore, compared to other models, the theoretical framework provided by the S-O-R (Stimulus–Organism–Response) model was more aligned with the research objectives of this study. Consequently, this study used the S-O-R model as the basis for constructing the behavior model of “Generation Z” consumers.
User intention, often considered the Response (R) element in the S-O-R model, is crucial for specific actions, such as the use of services [49,50]. Meanwhile, users’ attitudes towards services, reflecting their positive or negative feelings towards new technology, align with the Organism (O) component in the theoretical framework [50]. Consequently, attitudes are often identified as the Organism (O) element in the S-O-R model [50]. Regarding the Stimulus (S) element, it refers to the external influence on users, such as the experience provided by the service. Thus, this study identified the “Stimulus” (S) element as the basic user experience attribute of online virtual try-on shopping services.
However, it is noteworthy that current behavioral models related to user experience often focus on exploring the impact of positive elements while overlooking the influence of negative elements on users [52,53]. Resistance, a concept long considered a key variable influencing technology adoption, is often overlooked [54]. To address this gap, this study categorized user experience elements into positive and negative factors, aiming to explore the inherent logic influencing user behavior more comprehensively.
There is also a wealth of research indicating that the user experience attributes possessed by services directly affect users’ attitudes and intention to use services [55,56], with positive elements positively affecting users’ attitudes and behavioral intentions, and negative elements negatively affecting users’ attitudes and behavioral intentions [57]. At the same time, attitude is also a key trigger for users’ intention to use [46]. Therefore, this study proposed the following hypotheses:
H1:
Positive experiential elements of online virtual try-on shopping services positively influence users’ attitudes.
H2:
Negative experiential elements of online virtual try-on shopping services negatively influence users’ attitudes.
H3:
Positive experiential elements of online virtual try-on shopping services positively influence users’ intention to use.
H4:
Negative experiential elements of online virtual try-on shopping services negatively influence users’ intention to use.
H5:
Users’ attitudes towards online virtual try-on shopping services positively influence their intention to use.
The theoretical hypothesis model for the literature discussion mentioned above is illustrated in Figure 1.
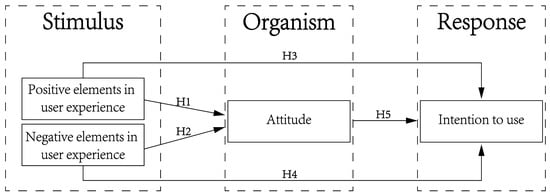
Figure 1.
Theoretical hypothesis model.
3. Materials and Methods
3.1. Research Design
The experiment in this study unfolded across seven stages. In Stage 1, user interviews targeted 57 individuals from “Generation Z”. Participants engaged with selected typical online virtual try-on shopping service software to complete a full shopping experience, followed by an evaluation of the service’s strengths and weaknesses.
In Stage 2, a literature review was conducted to complement the subjective user evaluations obtained during the interview phase. This review aimed to gather objective evaluations of similar services from the existing literature. As this study aimed to further explore the relationships between various user experience elements, user attitudes, and user willingness to use, it sought established evaluation scales for user attitudes and willingness to use. These scales were utilized in the data analysis for constructing the consumer behavior model.
In Stage 3, a synthesis and compilation of user survey results and the literature review findings occurred, followed by an expert review.
Stage 4 involved the distribution of evaluation questionnaires. Completed user evaluations, alongside established user attitude and intention-to-use scales, were compiled into questionnaire forms and widely disseminated to gather user feedback.
Stage 5 involved factor analysis. In that stage, this study referred to Wang’s method [57] for constructing a user experience evaluation scale. By employing factor analysis, this study clustered evaluations of virtual try-on shoe services to summarize multiple influencing factors, which formed the specific dimensions of the user experience evaluation scale constructed in this research. To ensure the coherence and logical flow of this paper, all user experience dimensions were denoted as “Factor + number” during this stage. The specific names of all factors are provided in the “Discussion on Factor Naming” section of this paper.
In Stage 6, linear regression analysis further explored the relationship between various dimensions of user experience and user attitudes as well as intention to use.
Finally, Stage 7 entailed the discussion of results. Analysis findings were combined with the existing literature to name specific dimensions of the evaluation scale, further exploring the underlying logic of user behavior, and providing recommendations for the design and operation of relevant services. This research path is illustrated in Figure 2.
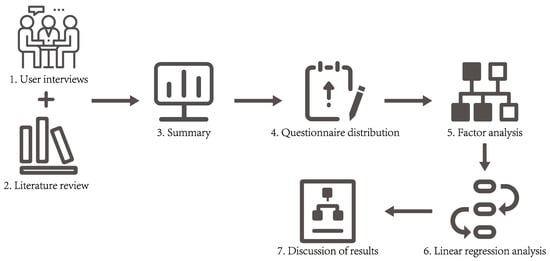
Figure 2.
Research path diagram.
3.2. Eligibility Criteria
In the user interview phase, the study first focused on the interviewees. Given that the target demographic of this research was “Generation Z” consumers, the interviewees had to be between 18 and 28 years old. Additionally, the interviewees should have had extensive online shopping experience.
Secondly, regarding the selection of typical cases, this study aimed to explore the online virtual fitting behavior of the broad “Generation Z” consumer base. However, since the research was primarily conducted within China, the respondents were predominantly Chinese. Consequently, the virtual fitting software or service needed to be easily accessible to a wide range of Chinese users, and the virtual fitting process needed to primarily take place online, without requiring entry into physical retail stores. Additionally, the core technology used in the virtual fitting rooms needed to be AR/VR technology.
In the literature review phase, this study focused on exploring the characteristics of user experience in virtual fitting rooms. Given that related technologies are continuously optimized over time, leading to constant improvements in user experience, it is crucial to avoid outdated perspectives. Therefore, the literature search was limited to relevant studies published within the past five years, and only English-language papers were considered. Furthermore, the selected research needed to primarily discuss aspects of user experience. Papers that focused on technological development and optimization or merely mentioned virtual try-on technology were excluded from this study.
During the distribution of the evaluation questionnaire, all respondents needed to be between 18 and 28 years old. Additionally, respondents were required to have prior experience using the typical virtual fitting room case identified in this study to ensure the authenticity and reliability of the questionnaire results.
3.3. Information Sources
Firstly, in selecting typical cases for the user interview phase, this study employed a comprehensive approach involving multiple information retrieval tools and platforms. These included search engines (such as Baidu, Google, etc.), fashion communication platforms (such as Xiaohongshu, Weibo, Zhihu, Twitter, etc.), and online shopping platforms (such as Tmall, Taobao, JD.com, etc.). By exploring these sources, this study aimed to identify widely used virtual fitting room services in China, thereby establishing appropriate cases for the research.
For participant recruitment in the user interview phase, this study leveraged the researcher’s personal network, university forums, and other platforms to disseminate recruitment information. Participants were recruited on a voluntary basis and received compensation of 5–10 yuan for their involvement.
During the literature review phase, this study primarily utilized ScienceDirect and Web of Science as the core databases to identify relevant research papers. These databases offer a wide range of academic and research resources covering various topics. They host numerous peer-reviewed journals, making them excellent tools for conducting a comprehensive literature review.
For the distribution of the evaluation scale questionnaire, this study employed “Wenjuanxing”, a well-known questionnaire collection website in China. Wenjuanxing has a large user base and provides features that allow researchers to set conditions for respondents, ensuring the effective identification of participants who meet the study’s criteria.
3.4. Search Strategy
3.4.1. Typical Case Selection Strategy
As virtual try-on technology in China is still in its nascent stage, there are relatively few virtual fitting room services that can be easily accessed by the majority of Chinese consumers. This study conducted searches through various information search engines, fashion exchange platforms, and online shopping applications within China to identify the main virtual fitting room service cases, as shown in Table 2.
Table 2.
Typical cases of virtual try-on services.
The first type is the virtual dressing mirror, which offers users a robust AR dressing experience primarily utilized in offline clothing stores to expedite or eliminate the need for changing rooms. However, its reliance on professional virtual dressing equipment renders it less user-friendly for online shoppers.
The second type encompasses the virtual fitting room feature provided by the renowned Chinese online shopping platform “Taobao”. This service operates by having users upload a personal photo, based upon which the software generates an AI model. Users can then preview their dressing effects based on this AI model. However, this service differs significantly from the AR/VR virtual fitting room targeted in this study, as users cannot accurately assess their real-time dressing effects.
The third type involves a virtual shoe try-on feature module provided by the emerging domestic shopping app “Dewu 5.40.1.” This service leverages the smartphone’s camera lens to showcase shoe effects in real-time. Users can observe their shoe try-on effects through the smartphone camera, with the shoe angle adjusting according to the angle of the user’s foot captured by the phone. Fundamentally aligned with the virtual fitting room described in Section 2.1 of this study, this service primarily targets trend-following “Generation Z” consumers, making it well-suited for this study’s objectives. While some professional clothing brands or international shopping apps may also offer virtual fitting room features, such software or websites often have a limited range of clothing brands. Additionally, Chinese consumers may encounter challenges in accessing them due to restrictions imposed by China’s internet policies. Therefore, this study focused on researching services readily accessible to Chinese users.
By comparing typical virtual fitting room services in the Chinese market, this study selected the virtual shoe try-on service provided by “Dewu 5.40.1” as a typical case study. Subsequent user research was conducted based on this service, ensuring its relevance and accessibility to the target audience.
3.4.2. User Interview Strategy
Before conducting formal user interviews, this study initially confirmed with users whether they had any experience using the “Dewu 5.40.1” app’s virtual try-on shoe feature. If the interviewee had used the software before, the interview proceeded directly. The interviews were conducted in a semi-structured format, with core questions focusing on the advantages and disadvantages of virtual try-on shoes. Interviewees were asked to provide at least three points for each question.
If the interviewee had never used this service before, this study required them to immediately download the “Dewu 5.40.1” app on their phone and use its virtual try-on shoe feature to spend no less than 20 min selecting shoes. They needed to select at least one pair for purchase to ensure that all interviewees fully utilized this service and completed an online transaction. After users had experienced the service, the same semi-structured interview was conducted. After the interview, interviewees were free to decide whether they wanted to cancel their order before the selected shoes were officially shipped.
Research personnel recorded the entire user research process with the user’s consent, and also documented key points in writing. Each user interview involved three research members, with one serving as the main interviewer and the other two responsible for recording the interview. Depending on the actual situation of the interview, the other two members could ask additional questions to expand on certain topics. After all interviews were completed, the research content was transcribed using audio-to-text software in conjunction with the written records, and further content summaries were conducted.
In the end, 33 eligible interviewees participated in the interviews directly, while 24 interviewees accepted the interview after completing the typical case experience. The overall sample size of user interviews far exceeded the interview standards proposed by Lee et al. [58] and Hartling et al. [59]. Additionally, there were 27 male and 30 female interviewees, approximately equal in gender proportion. Furthermore, among them, 36 were students and 21 were working professionals, with no significant difference in the number of individuals between the two groups. Moreover, various professions were represented among the working professionals, indicating that the sample selected during the user interview phase of this study was relatively representative.
3.4.3. Literature Retrieval Strategy
This study initiated literature searches using the keywords “virtual fitting room” on both the “Web of Science” and “ScienceDirect” platforms. To broaden the scope, this search was extended using the keyword “try-on technology”. To ensure relevance and timeliness, the publication period was restricted to papers published between 2019 and 2024. Ultimately, 52 papers were found on the “Web of Science” platform and 384 on “ScienceDirect”. After filtering out papers that merely mentioned virtual fitting rooms superficially or focused solely on technical optimization without discussing user experience, 35 valid papers were obtained from “Web of Science” and 28 from “ScienceDirect”. Upon merging and removing duplicates, this study obtained a total of 55 valid papers.
3.5. Data Collection Process
3.5.1. Observation Variable Summarization Process for the Evaluation Scale
First, during the data summarization stage of user interviews, three independent graduate students majoring in design, who had no vested interest in this study, were invited to consolidate the interview results. They merged similar or consistent user comments. After consolidation, three industry experts reviewed the summary results. If any issues were identified, the graduate students reorganized the data until all three industry experts had no objections to the summary.
Subsequently, during the literature content summarization stage, objective descriptive sentences about the characteristics of virtual fitting rooms were manually extracted and sorted from the 55 valid literature articles. After extraction, three graduate students, also with no vested interest in this study, were invited to merge sentences with similar or identical expressions. The summary results were then reviewed and corrected by experts until all experts had no objections.
Finally, these two parts were merged using the same method to generate the complete observation variables for the user experience evaluation scale. To further determine the dimensions of the user evaluation scale, factor analysis was used to cluster the observation variables. Prior to this, these observation variables served as questionnaire items in the testing phase of the user evaluation scale. For ease of discussion in this paper, the observation variables were coded in the form of “Q + number”, where “Q” stands for “Questionnaire”.
Meanwhile, to further construct the user behavioral intention model and explore the relationship between each dimension of the evaluation scale and user attitudes and intentions, this study used user attitude and intention evaluation scales with high authority and universality. These scales measured user evaluations of these two dimensions, as shown in Table 3. The complete process of obtaining the user evaluation scale is illustrated in Figure 3.
Table 3.
Summary of scale questionnaires.
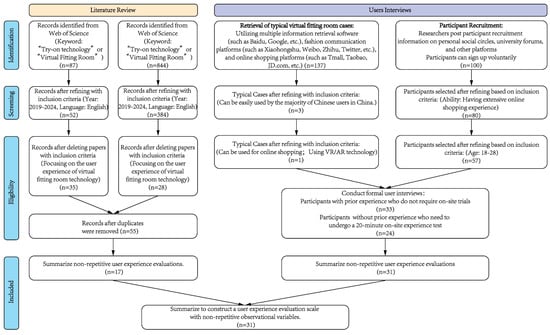
Figure 3.
Flowchart of evaluation scale compilation process.
3.5.2. Process of User Evaluation Scale Testing
This study utilized the well-known questionnaire collection website “Wenjuanxing” for data collection. Given that the research target was the “Generation Z” population, this study employed the targeted distribution function of the “Wenjuanxing” website, pushing the questionnaire exclusively to individuals aged 18–28. The formal evaluation was divided into four parts:
The first part was the “Informed Consent Form”, where detailed explanations of this study’s content and purpose were provided to the respondents. Respondents could only proceed with the questionnaire after selecting “Agree, I am informed”.
The second part consisted of screening questions. Here, detailed information about the virtual shoe try-on service was presented, and users were asked if they had used this service. If the respondent selected “No, never used”, the questionnaire automatically closed, preventing further participation. This approach ensured the authenticity and validity of the questionnaire results.
The third part collected basic information from the respondents, while the fourth part comprised the formal questionnaire scale evaluation. The questionnaire scale included descriptions of online virtual shoe try-on shopping services obtained through the literature review and user research, as well as well-established user attitude and intention evaluation scales. The content of the questionnaire scale is shown in Table 3. This study employed a Likert seven-point scale to assist users in their evaluations, where “1” represented “completely disagree”, and “7” represented “completely agree”.
3.6. Certainty Assessment
After conducting a large-scale questionnaire distribution, this study collected a total of 673 questionnaires. Following the elimination of disqualified questionnaires due to incomplete answers, excessively short response times, and duplicate responses, 532 valid questionnaires remained. This resulted in a qualification rate of 79%, aligning with expectations. Additionally, the sample size significantly exceeds the requirements for both factor analysis and linear regression analysis [61,62,63,64]. The demographic information of the respondents, detailed in Table 4, showed a balanced gender ratio and an equal proportion of students to working individuals, with representation across various professions. This indicated that the sample was relatively representative.
Table 4.
Basic information of respondents.
Subsequently, in summarizing the specific dimensions of the user experience evaluation scale through factor analysis, this study referred to the methodology proposed by Wang et al. [65,66]. Initially, exploratory factor analysis and reliability analysis were conducted using SPSS 26.0 software. This analysis revealed that 31 observed variables were clustered into 8 factors, each demonstrating high reliability. This indicated that the data exhibited good credibility and validity. Next, confirmatory factor analysis was performed using Amos 26.0 software to validate the results of the exploratory factor analysis. The analysis results demonstrated the presence of good discriminant validity among different factors, and each factor exhibited a strong association with its included observed variables. This indicated that the user experience dimensions identified in this study fully met the requirements.
During the construction of the behavior model, this study categorized all factors into “positive experience elements” and “negative experience elements” based on the observed variables contained in each factor. Furthermore, this study expanded upon the hypotheses proposed in Section 2.2 of the Stimulus–Organism–Response (S-O-R) theory framework. Subsequently, this study integrated the methodologies and processes of Calisir [67] and Wang [57], using exploratory factor analysis to test the discriminant validity between attitude, intention to use, and user experience influencing factors. Each factor also exhibited good internal consistency among its observed variables. Pearson correlation analysis was then employed to determine the correlation between each factor and attitude and intention to use. Finally, a linear regression analysis was conducted to construct the user behavior model, establishing the influence relationships between each factor. In conclusion, 4 hypotheses were rejected, and 13 hypotheses were supported. This study’s research data and results generally aligned with expectations.
4. Results
4.1. Analysis of the Evaluation Framework
4.1.1. Exploratory Factor Analysis
This study initially summarized the factors affecting users’ intentions to use through exploratory factor analysis. The research results are presented in Table 5. In the Bartlett’s sphericity test, p = 0.000 < 0.05, and the Kaiser–Meyer–Olkin (KMO) measure was 0.972 > 0.6, indicating that the data were suitable for factor analysis [68]. In the exploratory factor analysis, a total of eight factors were identified, with each factor corresponding to a set of observed variables. The factor loadings were all greater than 0.4, indicating a good correspondence between the observed variables and the factors. Additionally, the communalities of all variables included in the factors were greater than 0.4, suggesting a good association between the observed variables and the factors [69]. Among these factors, the observed variables of Factors 1, 3, and 7 corresponded to negative evaluations as presented in Table 5, indicating that Factors 1, 3, and 7 represent negative experiential elements that adversely affect users’ intentions to use. On the other hand, the observed variables included in Factors 2, 4, 5, 6, and 8 were positively evaluated, suggesting that these five factors represent positive experiential elements that influence user behavior.
Table 5.
Exploratory factor analysis of user experience scale.
4.1.2. Confirmatory Factor Analysis
To further examine the discriminant validity between factors and the associations among observed variables within each factor, this study conducted confirmatory factor analysis (CFA) on the data. The results are presented in Table 6. The standardized loadings of observed variables for each factor were all greater than 0.5 [70,71]. The average variance extracted (AVE) values for each factor exceeded 0.5, and the composite reliability (CR) values surpassed 0.6 [72,73], indicating strong correspondence between factors and their observed variables, as well as robust convergent validity among observed variables.
Table 6.
Confirmatory factor analysis.
To assess the discriminant validity between different factors, this study utilized the square root of the AVE for verification. The results are displayed in Table 7. Values in bold with shading along the diagonal of the table represent the square roots of the AVE for each factor. Each factor’s square root of the AVE exceeded the correlation coefficients between that factor and others, indicating excellent discriminant validity among the eight factors.
Table 7.
Discriminant validity.
Overall, these analyses demonstrated that the user intention assessment scale developed in this study met all requirements.
4.2. Analysis of the Behavioral Model
This study employed exploratory factor analysis to identify the evaluation factors of “Generation Z” consumers’ online virtual try-on user experience and the associated elements. Among them, three factors were identified as negative elements, while five factors were identified as positive elements. To further explore the relationship between these elements and user attitudes and intentions, this study extended the hypotheses proposed in Section 2.2:
H1a:
Factor 2 positively influences user attitudes.
H1b:
Factor 4 positively influences user attitudes.
H1c:
Factor 5 positively influences user attitudes.
H1d:
Factor 6 positively influences user attitudes.
H1e:
Factor 8 positively influences user attitudes.
H2a:
Factor 1 negatively influences user attitudes.
H2b:
Factor 3 negatively influences user attitudes.
H2c:
Factor 7 negatively influences user attitudes.
H3a:
Factor 2 positively influences user intentions.
H3b:
Factor 4 positively influences user intentions.
H3c:
Factor 5 positively influences user intentions.
H3d:
Factor 6 positively influences user intentions.
H3e:
Factor 8 positively influences user intentions.
H4a:
Factor 1 negatively influences user intentions.
H4b:
Factor 3 negatively influences user intentions.
H4c:
Factor 7 negatively influences user intentions.
The theoretical hypotheses are illustrated in Figure 4.
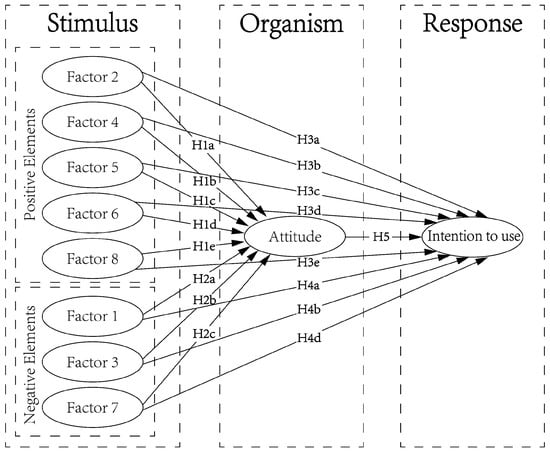
Figure 4.
Expanded theoretical hypothesis model diagram.
4.2.1. Exploratory Factor Analysis
Before further exploring the correlation between the eight elements of user experience and user attitudes and intentions, this study needed to verify the discriminant validity between these elements and attitudes, as well as intentions. Hence, exploratory factor analysis was conducted on all data. The results are shown in Table 8.
Table 8.
Exploratory factor analysis of all factors.
The analysis results indicated that the original eight elements and their corresponding observed variables remained unchanged. Attitudes and intentions also displayed good correspondence with their respective observed variables. Each observed variable exhibited a factor loading greater than 0.4 only in its corresponding factor, and the communalities were all greater than 0.4. This suggested that attitudes, intentions, and the eight factors of user experience demonstrated good discriminant validity, and the observed variables within each factor also exhibited good convergence. Therefore, the data were suitable for further linear regression analysis.
4.2.2. Correlation Analysis
Before conducting formal linear regression analysis, it was essential to establish a strong correlation between the independent variables and the dependent variables. Given this study’s focus on exploring the relationship between each factor and user attitudes and intentions, Pearson correlation analysis was initially performed, with attitudes serving as the dependent variable and the eight elements of user experience as independent variables. The results revealed that the p-values for each factor were all less than 0.01, indicating a significant correlation between each factor and user attitudes.
Subsequently, intentions were considered as the dependent variable, while attitudes and the eight factors of user experience were treated as independent variables for further analysis. The results demonstrated a correlation between each factor and user intentions, affirming the suitability of the data for subsequent linear regression analysis. The detailed analysis results are presented in Table 9.
Table 9.
Pearson correlation analysis.
4.2.3. Linear Regression Analysis
In this study, attitudes were initially considered as the dependent variable, with the eight factors of user experience treated as independent variables for linear regression analysis. The analysis results are shown in Table 10. The results revealed that the p-values for each factor were all less than 0.05, supporting hypotheses H1a, H1b, H1c, H1d, H1e, H2a, H2b, and H2c. Notably, the path coefficients between Factors 1, 3, and 7 and attitudes were negative, indicating their adverse effect on user attitudes. Conversely, the remaining five factors exhibited positive path coefficients, indicating a positive influence on user attitudes.
Table 10.
Linear regression analysis.
Subsequently, intentions were considered as the dependent variable, while attitudes and the eight factors of user experience were regarded as independent variables for regression analysis. The results showed that the p-values for H3a, H3b, H3c, and H3d were all greater than 0.05, suggesting that these hypotheses were not supported. However, the p-values for H3e, H4a, H4b, H4c, and H5 were all less than 0.05, indicating support for these hypotheses.
5. Discussion
5.1. Discussion on Factor Naming
Through exploratory factor analysis, this study identified eight user experience factors. In this section, we will further name these factors based on the existing literature and the content of each factor’s observed variables.
Factor 1 comprised six observed variables: Q27, Q24, Q20, Q26, Q29, and Q25. These items collectively reflected the level of technical quality provided to users by online virtual try-on shoe shopping services. Lin and Bhattacherjee [74] proposed a concept similar to this, termed “technical quality”, which pertains to the complexity of the technology itself in a specific entertainment system, enhancing both the system’s functionality and user experience. This encompasses factors such as operational complexity, clarity, and smoothness. Similarly, Lassar et al. [75] mentioned that technical quality involves the quality of content presentation. In this study, these six items described the deficiencies of such services in terms of technical quality. Therefore, we named this factor “Technical Limitation”, defined in this study as the extent to which virtual try-on services are constrained by the inadequacy of technology and scientific advancement, resulting in users’ inability to accurately and easily perceive projected clothing images.
Factor 2 comprised six observed variables: Q13, Q3, Q11, Q6, Q2, and Q12. These variables collectively demonstrated that online virtual try-on can effectively mitigate the limitations encountered during offline shopping processes, such as time constraints, location restrictions, limited brand availability, style options, and hygiene concerns, when compared to trying on clothes in physical stores. This reduction in limitations minimizes users’ cognitive effort during the shopping process, which aligns with the concept of convenience. Convenience refers to users’ ability to efficiently save time and cognitive effort when using a service [76,77]. Therefore, this factor was named “Convenience”. In this study, Convenience was defined as the ability of virtual try-on services to offer users fewer constraints compared to offline try-on shopping experiences.
Factor 3 comprised four observed variables: Q28, Q19, Q23, and Q21. These variables collectively demonstrated that users were unable to effectively comprehend detailed information about the selected clothing or understand how the service would utilize their personal information solely through the virtual try-on service, leading to feelings of uncertainty. Starrett et al. [78] defined uncertainty as the confusion and doubts individuals experience during the process of understanding or recognizing things. This concept aligns with the content of Factor 3. Therefore, this factor was named “Uncertainty”. In this study, Uncertainty was defined as the degree to which virtual try-on services fail to provide users with feedback to understand important information, consequently causing users to feel doubtful.
Factor 4 comprised three observed variables: Q9, Q10, and Q15. These variables described how users can effectively save money during their use of virtual try-on services. This aligned with the dimension of perceived value, specifically price value, which Venkatesh et al. [79] defined as the cognitive trade-off between the perceived benefits of using applications and the monetary costs associated with them. Therefore, this factor was named “Price Value”. In this study, Price Value was defined as the extent to which virtual try-on services can effectively help users reduce their monetary costs.
Factor 5 comprised three observed variables: Q1, Q5, and Q4. These variables described the visual information that users can obtain during their use of virtual try-on services. Visual information refers to materials, documents, etc., centered around personal vision [80], and Lischer-Katz [80] also emphasized the importance of visual information in the application of VR/AR technology. Therefore, this factor was named “Visual Information Acquisition”. In this study, Visual Information Acquisition was defined as the ability of virtual try-on services to help users obtain visual information about clothing.
Factor 6 consisted of three observed variables: Q14, Q7, and Q8. These variables described the positive emotions that users can experience when using the virtual try-on service. This aligned with the concept of emotional value, as defined by Dörnyei and Lunardo [81], who stated that emotional value refers to the positive emotions generated by users during interaction with a product or service, including enjoyment and relaxation. Therefore, this factor was named “Emotional Value”. In this study, Emotional Value was defined as the ability of virtual try-on services to help users experience positive emotions during usage.
Factor 7 comprised three observed variables: Q30, Q31, and Q22. These variables indicated a lack of satisfaction with the service’s ability to meet users’ personalized needs. Personalization refers to the ability of a product or service to provide specific services tailored to the individual preferences and requirements of users [82]. However, Factor 7 revealed the deficiency of the virtual try-on service in this aspect. Therefore, this factor was named “Personalized Service Deficiency”. In this study, Personalized Service Deficiency was defined as the virtual try-on service’s inability to provide customized services to users and meet their specific needs.
Factor 8 included three observed variables: Q16, Q17, and Q18. These variables demonstrated users’ need for social interaction with others and reflected users’ evaluations of other users in the community, as well as their reactions and requirements regarding others’ evaluations. This was akin to the concept of social interaction [83]. Therefore, this factor was named “Social Interaction”. In this study, Social Interaction was defined as the ability of the virtual try-on service to enable users to interact with others comfortably.
The naming results of the factors are presented in Table 11. Based on the factor naming results and the results of linear analysis, a model depicting the relationships is illustrated in Figure 5.
Table 11.
Factor naming results.
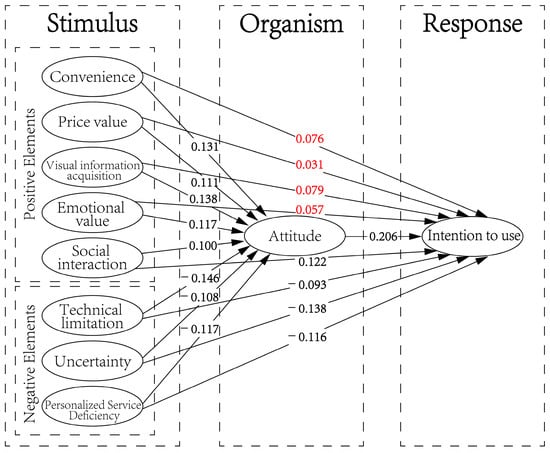
Figure 5.
Model diagram of factors influencing user intention to use.
5.2. Discussion on the Impact Relationships among Factors
5.2.1. Discussion on the Impact Relationships of Positive Factors
In the context of the positive factors’ influence relationships, H1a, H1b, H1c, H1d, and H1e were all supported, with positive path coefficients between each factor and attitude. This indicated that convenience, price value, visual information acquisition, emotional value, and social interaction all positively impacted users’ attitudes towards the service. Among these factors, visual information acquisition exhibited the highest path coefficient with attitude, suggesting that the ability of virtual try-on to assist users in acquiring visual information is a pivotal determinant of user attitude evaluation. This prominence can be attributed to the dominant role of visual information in modern information formats, progressively becoming central to various professional and daily activities [80]. Consequently, when evaluating the merits of virtual try-on, users tend to prioritize whether the service can facilitate the acquisition of desired visual information, such as the appearance characteristics of shoes, the degree of simulated projection on the body, and the basic details of the footwear. As previously discussed, attitude represents users’ comprehensive evaluations of specific entities [50]. Thus, when users can effectively obtain visual information from the service, they are more likely to provide higher evaluations of the service.
At the same time, the most noteworthy aspect was that H3a, H3b, H3c, and H3d were not supported, while H3e was supported. This indicated that social interaction within the service was the only positive factor directly influencing users’ intention to use, whereas H5 was supported, and the path coefficient between attitude and intention to use was significantly higher than that of other factors. This clearly demonstrated that attitude is a critical factor triggering users’ intention to use and serves as a mediating variable for other factors influencing users’ intention to use. It also suggested that convenience, price value, visual information acquisition, and emotional value all need to indirectly influence users’ intention to use through attitude. However, it is worth noting that the path coefficient between social interaction and attitude was 0.100, the lowest among all positive factors affecting user attitudes. This indicated that users do not overly focus on the social attributes of the service when evaluating its merits or shortcomings. Nevertheless, this attribute directly triggers users’ intention to use, as “Generation Z” consumers’ expectations for social interaction in online shopping contexts differ significantly from traditional social interaction norms.
Traditional social interaction [84] refers to proactive communication and interaction between consumers and others. However, in this study, social interaction encompassed three observed variables: the desire to avoid salespeople’s gaze, the desire to avoid excessive offline interaction with other consumers, and the preference for merely learning about others’ try-on experiences from online social platforms. These three observed variables all indicated that “Generation Z” consumers are reluctant to engage excessively in social relationships and, to some extent, demonstrated their willingness to seek solitude. This reluctance stems from the inherent perfectionistic tendencies prevalent among “Generation Z” individuals, leading them to invest considerable energy and time in achieving their high standards and thus being disinclined to actively establish interpersonal relationships [85]. Moreover, others’ evaluations can be perceived as “noise” to “Generation Z” consumers, potentially causing anxiety and further social withdrawal [86]. Therefore, when online virtual try-on shopping platforms effectively meet consumers’ social expectations in this regard, users are more inclined to use the service.
However, interpersonal needs are intrinsic motivators of individual behavior [83], and attributes like convenience, price value, visual information acquisition, and emotional value are tangible manifestations of the functional characteristics of virtual try-on services. In contrast, social interaction attributes are explicit expressions based on users’ intrinsic motivational needs, representing derived functionalities. Hence, users’ perception of social interaction is relatively low when evaluating the quality of the service experience.
Conversely, convenience, price value, visual information acquisition, and emotional value, as the fundamental functional characteristics of the service, do not directly influence users’ intention to use. This is because the advantages of the service in terms of convenience, price value, visual information acquisition, and emotional value are usually compared to conventional offline shopping. However, the “Generation Z” demographic is highly pragmatic [87], leading such consumers to not solely rely on the appearance of a product for purchase. Unlike appearance, users are more concerned about whether the products they purchase fit them in terms of size, material, style, and other factors. However, the convenience, price value, visual information acquisition, and emotional value offered by the service do not directly address this concern. Consequently, virtual try-on shoe services become an alternative rather than a direct facilitator of purchase. Therefore, these four factors cannot directly influence users’ intention to use; they can only indirectly affect users’ intention to use by improving users’ attitudes toward the service.
However, social interaction is an exception because virtual try-on platforms can provide a certain level of try-on experience to some extent, a feature lacking in conventional online shopping experiences. Moreover, as long as users engage in offline clothing try-ons, they inevitably encounter social interactions. However, due to the inherent social aversion traits characteristic of “Generation Z” consumers [86], these consumers, to some extent, prefer to avoid offline clothing try-ons and purchases, thereby prompting virtual try-on platforms to become the sole means that can provide users with a try-on experience while effectively avoiding excessive social interaction. Consequently, the social interaction offered by this service directly influences users’ intention to use.
5.2.2. Discussion on the Impact Relationships of Negative Factors
In the context of negative relationships, H2a, H2b, H2c, H4a, H4b, and H4c were all established, with each factor exhibiting negative path coefficients with attitudes and intention to use. This indicated that technical limitations, uncertainty, and personalized service deficiency directly negatively influenced users’ attitude evaluations and intention to use. As the path coefficients were negative, the higher the absolute value of the path coefficient, the greater the linear influence of each factor on attitudes and intention to use. By comparing the path coefficients between each influencing factor and attitudes or intention to use, it could be observed that the path coefficient between technical limitations and attitudes was −0.146, significantly higher in absolute value compared to other negative factors. However, the path coefficient between this factor and intention to use was −0.093, making it the lowest absolute value among all negative factors. Meanwhile, the path coefficient between uncertainty and attitudes was −0.108, considerably lower in absolute value compared to other negative factors. However, the path coefficient between uncertainty and intention to use was −0.138, making it the highest absolute value among all negative factors. This suggested that users prioritize each factor differently depending on the evaluation context they are in. The variations in the impact of each negative factor on user attitudes and intention to use are illustrated in Figure 6.
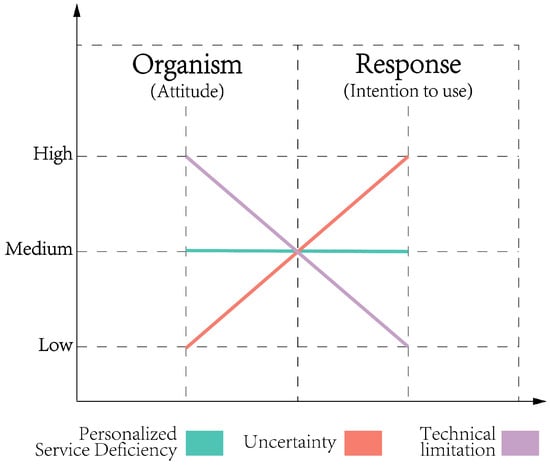
Figure 6.
Importance variation of negative factors.
During the “Organism” stage of attitude evaluation, technical limitations have the greatest impact on user attitudes. This is because at this stage, users tend to make overall evaluations of the product or service, and the limitations in technical presentation of the service are the most obvious and easily perceived by users. Consequently, this often leads to negative evaluations of service quality by users. However, when users decide to use this service for shopping, as previously mentioned, their primary concern is whether they can purchase clothing with the right size, good comfort, and high-quality materials, i.e., the practical value of the service. This diminishes the importance of technical issues in the service objectively to some extent.
Simultaneously, when virtual try-on services fail to fully present detailed information about the clothing to users, leading to feelings of uncertainty, users are significantly less inclined to use the service. Moreover, research indicates that users’ willingness to use diminishes when they are fearful of how their personal information will be utilized by others [21]. Therefore, when users intend to use this service to purchase clothing, uncertainty about aspects such as the material, size, comfort, and how personal privacy will be handled by the service significantly reduces their willingness to use it due to concerns. This is particularly evident during the “Response” stage when users express their intentions to use the service. The uncertainty associated with the service has the most substantial negative impact on users at this stage. However, such uncertainty is not evident during users’ cognitive evaluation stage; hence, the impact of uncertainty on user attitudes during the “Organism” stage of attitude evaluation is minimal.
Furthermore, the deficiency of personalized services remains consistently important, whether in the attitude evaluation stage or the usage planning stage. This indicates its stability, as it does not change with the user’s situational context. This is because the “Generation Z” population tends to be self-centered and has a strong desire for self-expression, leading them to favor personalized and customized services [87]. Therefore, during the attitude evaluation stage, after users assess the most tangible aspects of the technology presentation, they evaluate the personalized service content. In the actual usage stage, after users evaluate the potential uncertainties of the service, they also seek further personalized services. Simultaneously, personalized services facilitate users in selecting products that suit them, reducing uncertainty in their purchasing behavior. Therefore, providing excellent personalized services and addressing the deficiency of personalized services can effectively enhance the user’s intention to use, particularly for the “Generation Z” population.
5.3. Practical and Management Suggestions
This study combines quantitative and qualitative methods, including user interviews, literature review, factor analysis, and linear regression analysis, to establish a user experience evaluation scale for online virtual shoe try-on services. It identifies the components of user experience and clarifies the relationship between each influencing factor and user attitudes and intentions to use the service. Furthermore, it elucidates the psychological logic of “Generation Z” consumers when using this service for shopping. Based on the research findings, this study proposes the following practical and managerial suggestions to provide theoretical assistance and reference for the development, design, and operation of related technologies.
The attributes of service social interaction, uncertainty, personalized service deficiency, and technical limitations directly impact user behavior. Therefore, service social interaction should be prioritized, while efforts should also focus on optimizing issues related to uncertainty, personalized service deficiency, and technical limitations.
Firstly, regarding social interaction, “Generation Z” consumers exhibit different preferences compared to traditional notions of social interaction. They tend to be more solitary and less inclined to passive engagement with others, preferring to seek answers independently. Additionally, they often rely more on the opinions of other consumers rather than those of sales personnel. This contrasts with traditional approaches to personalized service, which heavily rely on frontline staff for real-time interaction [82].
Therefore, in designing online virtual try-on shopping services, it is crucial to minimize the need for intervention by human sales staff. This can be achieved by providing detailed product information and encouraging consumers to share their purchasing and usage experiences through the platform, incentivizing them with shopping points, vouchers, and similar rewards. Moreover, platforms should act as third-party entities to address inquiries from new consumers. Currently, many online shopping platforms in China incentivize consumers to leave positive reviews by offering cash rebates or vouchers, which often results in unreliable feedback. Thus, establishing a comprehensive user review platform can help consumers obtain genuine insights into the specifics of clothing items.
At the same time, to address the issue of personalized service deficiency, services should establish a comprehensive user feedback system. For instance, when users are selecting shoes or clothing items, they can manually input basic information such as their size, weight, shoe type, intended usage scenarios, preferred styles, and personal clothing preferences. The system would then automatically match consumers with products that correspond to their preferences, thereby providing personalized service. Moreover, the entire process should aim for minimal human intervention, allowing users to independently purchase desired products solely through the platform’s system and information.
Moreover, technical limitations rank as the least significant among all factors directly affecting users’ willingness to use the service. This suggests that users prioritize the service’s ability to mitigate uncertainty when planning to use it. Therefore, in addition to projecting clothing or shoe styles onto users’ bodies during virtual try-ons via smartphones, virtual fitting rooms could also furnish corresponding explanatory information and professional third-party reviews to help users grasp the comfort and material characteristics of the items. Furthermore, leveraging AR measurement technology could aid users in swiftly determining their basic information and selecting the appropriate size of clothing or shoes. Additionally, providing excellent after-sales service, such as facilitating direct returns and refunds in case of discrepancies with the size, color, and pattern shown in the video, can bolster user confidence. Finally, virtual fitting room platforms themselves should be officially registered and endorsed by authoritative organizations to ensure the security of their network information, thereby mitigating users’ perception of uncertainty regarding the service. However, addressing technical limitations largely hinges on technological advancements and may pose challenges to expedient resolution. Hence, operators should adopt diverse strategies to help users alleviate their perception of these limitations. For instance, for issues like low resolution, detail, and smoothness in AR projections, users could be presented with a module to select detailed display options on the projection interface. In instances where users are unable to discern details directly from AR projections, they can activate these modules, prompting the system to automatically furnish static magnified detail images or explanatory videos to aid users in comprehension. Concerning specific operations, the system should offer comprehensive instructional videos and AI assistants for voice questioning and feedback to aid users in promptly resolving operational queries.
Finally, although convenience, price value, visual information acquisition, and emotional value do not directly influence users’ willingness to use the service, they can enhance users’ attitude evaluations to some extent, thereby indirectly affecting their willingness to use the service. Therefore, it is appropriate to address these aspects in the design and optimization process. For example, extensive promotion could be conducted, more brands and merchants could be introduced on the platform, and more realistic models of clothing or shoes could be designed, allowing users to conveniently try on a variety of styles and brands of shoes and clothing to enhance the service’s convenience. When designing AR models for shoes, efforts could be made to improve the accuracy of the models and the rendering effects of the products to maximize the presentation of visual information about the shoes, thereby enhancing the service’s capability to provide visual information. Moreover, different modes could be provided for presenting AR fitting technologies, such as partial mode, where users can observe the projection effect at specific positions through the smartphone screen, and full-body mode, where users can use a regular full-body mirror, and the smartphone captures the user’s image in the mirror, allowing users to see their complete fitting effect on the smartphone screen. By offering these modes, users can experience virtual try-ons to the fullest extent without the need to purchase specialized AR products (such as AR fitting mirrors), thereby enhancing the service’s price value. Additionally, during the fitting process, the service could add interesting effects, patterns, and logos on the screen to enhance the service’s entertainment value and increase its emotional value.
5.4. Theoretical and Practical Significance
The evaluation scale constructed in this study holds significant theoretical and practical value for understanding user behavior. By targeting “Generation Z”, a population with substantial consumer potential, this study constructed a comprehensive evaluation scale for the user experience of online virtual try-on shopping services. Additionally, it established a user behavior model, elucidating the inner logic of users when engaging in online shopping behavior. Furthermore, it unveiled distinct requirements of “Generation Z” consumers regarding social interaction in shopping behavior, which differ significantly from traditional norms. These theoretical discoveries effectively address previous academic gaps and provide valuable insights and methodological references for future research endeavors.
Simultaneously, this study makes a significant contribution to the theoretical framework by expanding the S-O-R theory. Traditionally, the “S” in S-O-R theory primarily emphasizes positive stimuli, often overlooking the impact of negative stimuli from the external environment on individuals. To address this gap, this study extended the dimensions of external condition stimuli by categorizing “S” into both positive and negative stimuli. This modification optimizes and broadens the S-O-R framework, offering future researchers a new and enriched framework and research approach.
In addition, the conclusions of this study also hold significant implications for practical applications. Firstly, during the initial project planning and preparation phase, the findings of this research can serve as specific indicators to assist product managers and technical developers in setting precise design and development goals. Subsequently, during the implementation phase of technology, the user behavior model constructed in this study can help operators identify key factors that trigger users’ intention to use, thereby enabling the formulation of corresponding development strategies and the rational allocation of technical team resources. Moreover, during the technology validation phase, relevant operators can conduct small-scale pilot tests, and the evaluation scale developed in this study can serve as a tool to assist users in evaluating and assessing. Test subjects can evaluate and score each variable of observation for each factor, thereby helping operators identify the limitations and deficiencies of existing services for immediate optimization and improvement. Finally, during the formal operation phase, the service can regularly distribute this evaluation scale as a questionnaire within the system to users, thereby determining the current strengths and weaknesses of the service and making targeted adjustments, thus continuously optimizing and enhancing the service’s competitiveness.
In summary, whether at the theoretical or practical level, this study on online virtual try-on shopping services for “Generation Z” consumers holds significant significance and value.
6. Conclusions
6.1. Conclusions of This Study
In the context of the increasing emphasis on sustainable economies, this study addresses the issue of resource waste and consumption resulting from traditional online shopping behaviors, particularly returns. It aims to mitigate consumer return behaviors by assisting users in swiftly selecting suitable clothing through the exploration of online virtual try-on shopping services, thereby promoting the development of a green and sustainable economy. Focused on the “Generation Z” consumers, this study takes virtual try-on shoe services as a typical case, employing the S-O-R theory as a research framework to establish a user experience evaluation scale for online virtual try-on shopping services and to construct a behavioral model for “Generation Z” consumers. This study has partially filled existing theoretical gaps and provided design suggestions and theoretical support for relevant designers and operators. The main conclusions of this study are as follows:
- The user experience evaluation scale for online virtual try-on shopping services comprises eight elements, including five positive elements: convenience, price value, visual information acquisition, emotional value, and social interaction; and three negative elements: technical limitations, personalized service deficiency, and uncertainty. These elements collectively influence users’ attitudes.
- Among the elements of the user experience evaluation scale, only social interaction, technical limitations, personalized service deficiency, and uncertainty directly impact users’ intention to use the service. Among the negative elements, uncertainty serves as the core factor diminishing users’ intention to use.
- Among the positive elements, only social interaction directly and positively impacts users’ intention to use. Furthermore, “Generation Z” consumers exhibit distinct requirements for social interaction in services compared to traditional norms. They tend to engage with others in a solitary and proactive manner rather than passively participating in social connections.
- Users’ attitudes represent the core factors influencing their intention to use the service and play a significant mediating role in the user’s intention-to-use behavior model.
6.2. Limitations and Prospects
Although this study initially targeted “Generation Z” consumers and developed a user experience evaluation scale for online virtual try-on shopping services, along with a consumer intention-to-use model, and proposed constructive design and operational suggestions, there are still some limitations. Firstly, the behavioral model constructed in this study primarily focuses on the attributes and characteristics of the service itself during the “stimulus” stage, which relates to users’ experience with clothing. However, users’ intentions to engage in certain activities are influenced to some extent by the social environment. This aspect has not been extensively explored in this study, so future research could supplement the existing findings by utilizing more established behavioral theoretical models.
Secondly, when constructing the user experience evaluation scale, this study primarily relied on user interviews and research methods, which may introduce a certain degree of subjectivity into the evaluation. Although efforts were made to mitigate this issue by supplementing user research results with objective evaluations obtained from literature research, there is still room for improvement in research methods. For instance, the utilization of professional monitoring equipment such as eye trackers could be employed to objectively monitor users’ behavioral performances during the use of such services. Additionally, collaboration with relevant companies to access backend data could provide another avenue to understand users’ actual preferences in practical usage, thereby enhancing the objectivity of the study to some extent.
Thirdly, while virtual try-on technology is relatively mature, its specific application in China is still in its infancy. This confines the research scale developed by this study to the current level of service technology. This suggests that there is significant room for expansion in evaluation scales for user experience, paralleling the evolution of technology and social development. Therefore, in future research, a more in-depth exploration could be undertaken on different types of virtual try-on services or those with higher technical levels and functional characteristics. This would offer more theoretical support for the development of relevant technologies and help reduce the return rate of online shopping, promoting green and sustainable development.
Fourth, this study primarily obtained user evaluations through interviews. Although the sample size of user interviews in this research meets the requirements for conducting related studies, future research could benefit from expanding the sample size of interviewees and adopting long-term observational survey methods to enhance the generalizability of the results.
Author Contributions
Investigation, conceptualization, software, validation, formal analysis, visualization, writing—original draft preparation, Z.W.; methodology, writing—review and editing, Q.J. All authors have read and agreed to the published version of the manuscript.
Funding
This research was funded by the Key Project of Philosophy and Social Science Research of the Ministry of Education “The Collation of Historical Materials of Han Textile Clothing and the Empirical Study of Chinese Style”, grant number JZD048.
Data Availability Statement
The data that support the findings of this study are available from the corresponding author, Z.W., upon reasonable request.
Conflicts of Interest
The authors declare no conflicts of interest.
References
- Sarma, R.N.; Vinu, R. An Assessment of Sustainability Metrics for Waste-to-Liquid Fuel Pathways for a Low Carbon Circular Economy. Energy Nexus 2023, 12, 100254. [Google Scholar] [CrossRef]
- Zheng, B.; Wang, H.; Golmohammadi, A.-M.; Goli, A. Impacts of logistics service quality and energy service of Business to Consumer (B2C) online retailing on customer loyalty in a circular economy. Sustain. Energy Technol. Assess. 2022, 52, 102333. [Google Scholar] [CrossRef]
- Singh, D.; Pandey, V. The Dimensions and Roles of Online Content in Social Commerce: A Systematic Literature Review and Future Research Agenda. Int. J. Consum. Stud. 2024, 48, e13004. [Google Scholar] [CrossRef]
- Fathollahi-Fard, A.M.; Hajiaghaei-Keshteli, M.; Tavakkoli-Moghaddam, R. Red deer algorithm (RDA): A new nature-inspired meta-heuristic. Soft Comput. 2020, 24, 14637–14665. [Google Scholar] [CrossRef]
- Ju, C.; Liu, H.; Xu, A.; Zhang, J. Green logistics of fossil fuels and E-commerce: Implications for sustainable economic development. Resour. Policy 2023, 85, 103991. [Google Scholar] [CrossRef]
- Xu, X.; Jackson, J.E. Investigating the influential factors of return channel loyalty in omni-channel retailing. Int. J. Prod. Econ. 2019, 216, 118–132. [Google Scholar] [CrossRef]
- Tian, X.; Sarkis, J. Emission burden concerns for online shopping returns. Nat. Clim. Change 2022, 12, 2–3. [Google Scholar] [CrossRef]
- Chen, J.; Yu, B.; Chen, B.; Liu, Z. Lenient vs. stringent returns policies in the presence of fraudulent returns: The role of customers’ fairness perceptions. Omega 2023, 117, 102843. [Google Scholar] [CrossRef]
- Lee, H.; Xu, Y.J. Influence of motivational orientations on consumers’ adoption of virtual fitting rooms (VFRs): Moderating effects of fashion leadership and technology visibility. Int. J. Fash. Des. Technol. Educ. 2022, 15, 297–307. [Google Scholar] [CrossRef]
- Hoyer, W.D.; Kroschke, M.; Schmitt, B.; Kraume, K.; Shankar, V. Transforming the Customer Experience Through New Technologies. J. Interact. Mark. 2020, 51, 57–71. [Google Scholar] [CrossRef]
- Huang, T.-L.; Tsiotsou, R.H.; Liu, B.S. Delineating the role of mood maintenance in augmenting reality (AR) service experiences: An application in tourism. Technol. Forecast. Soc. Change 2023, 189, 122385. [Google Scholar] [CrossRef]
- Kim, J.-H.; Kim, M.; Park, M.; Yoo, J. Immersive interactive technologies and virtual shopping experiences: Differences in consumer perceptions between augmented reality (AR) and virtual reality (VR). Telemat. Inform. 2023, 77, 101936. [Google Scholar] [CrossRef]
- Lavoye, V.; Mero, J.; Tarkiainen, A. Consumer behavior with augmented reality in retail: A review and research agenda. Int. Rev. Retail Distrib. Consum. Res. 2021, 31, 299–329. [Google Scholar] [CrossRef]
- Ball, C.; Huang, K.-T.; Francis, J. Virtual reality adoption during the COVID-19 pandemic: A uses and gratifications perspective. Telemat. Inform. 2021, 65, 101728. [Google Scholar] [CrossRef] [PubMed]
- Beck, M. Moderating effects of trait curiosity and self-efficacy in the effect of the online virtual booth on specific curiosity and behavioral intention. Rech. Appl. Market. Engl. Ed. 2022, 37, 30–46. [Google Scholar] [CrossRef]
- Hwang, C.; Jin, B.; Linfeng, L.; Feng, J. Factors influencing older adults’ intention to use virtual fitting room technology during the COVID-19 pandemic. J. Fash. Mark. Manag. 2023, 28, 444–459. [Google Scholar] [CrossRef]
- Lee, H.; Xu, Y.J.; Porterfield, A. Consumers’ adoption of AR-based virtual fitting rooms: From the perspective of theory of interactive media effects. J. Fash. Mark. Manag. 2021, 25, 45–62. [Google Scholar] [CrossRef]
- Li, A.L.; Xu, Y.J. A study of Chinese consumers’ adoption behaviour toward virtual fitting rooms. Int. J. Fash. Des. Technol. Educ. 2020, 13, 140–149. [Google Scholar] [CrossRef]
- Zhang, W.K.; Wang, Y.N. What drives customers to use virtual fitting rooms? The moderating effect of fashion consciousness. J. Fash. Mark. Manag. 2023, 21. ahead of printing. [Google Scholar] [CrossRef]
- Lee, H.N.; Xu, Y.J.; Li, A.L. Technology visibility and consumer adoption of virtual fitting rooms (VFRs): A cross-cultural comparison of Chinese and Korean consumers. J. Fash. Mark. Manag. 2020, 24, 175–194. [Google Scholar] [CrossRef]
- Ameen, N.; Hosany, S.; Paul, J. The personalisation-privacy paradox: Consumer interaction with smart technologies and shopping mall loyalty. Comput. Hum. Behav. 2022, 126, 106976. [Google Scholar] [CrossRef]
- Djafarova, E.; Bowes, T. ‘Instagram made Me buy it’: Generation Z impulse purchases in fashion industry. J. Retail. Consum. Serv. 2021, 59, 102345. [Google Scholar] [CrossRef]
- Khalil, S.; Ismail, A.; Ghalwash, S. The rise of sustainable consumerism: Evidence from the Egyptian generation Z. Sustainability 2021, 13, 13804. [Google Scholar] [CrossRef]
- Mason, M.C.; Zamparo, G.; Marini, A.; Ameen, N. Glued to your phone? Generation Z’s smartphone addiction and online compulsive buying. Comput. Hum. Behav. 2022, 136, 107404. [Google Scholar] [CrossRef]
- Guo, W.; Luo, Q. Investigating the impact of intelligent personal assistants on the purchase intentions of Generation Z consumers: The moderating role of brand credibility. J. Retail. Consum. Serv. 2023, 73, 103353. [Google Scholar] [CrossRef]
- Berfin Ince, E.; Cha, K.; Cho, J. An investigation into generation Z’s mindsets of entertainment in an autonomous vehicle. Entertain. Comput. 2023, 46, 100550. [Google Scholar] [CrossRef]
- Ronaghi, M.H.; Ronaghi, M. A contextualized study of the usage of the augmented reality technology in the tourism industry. Decis. Anal. J. 2022, 5, 100136. [Google Scholar] [CrossRef]
- Bahri, H.; Krcmarik, D.; Moezzi, R.; Kočí, J. Efficient use of mixed reality for bim system using microsoft HoloLens. IFAC-Pap. 2019, 52, 235–239. [Google Scholar] [CrossRef]
- Tan, Y.-C.; Chandukala, S.R.; Reddy, S.K. Augmented reality in retail and its impact on sales. J. Mark. 2022, 86, 48–66. [Google Scholar] [CrossRef]
- Al-Adaileh, A.; Al-Kfairy, M.; Tubishat, M.; Alfandi, O. A sentiment analysis approach for understanding users’ perception of metaverse marketplace. Intell. Syst. Appl. 2024, 22, 200362. [Google Scholar] [CrossRef]
- Jessen, A.; Hilken, T.; Chylinski, M.; Mahr, D.; Heller, J.; Keeling, D.I.; de Ruyter, K. The playground effect: How augmented reality drives creative customer engagement. J. Bus. Res. 2020, 116, 85–98. [Google Scholar] [CrossRef]
- Xue, Y.; Sun, J.; Liu, Y.; Li, X.; Yuan, K. Facial expression-enhanced recommendation for virtual fitting rooms. Decis. Support Syst. 2023, 177, 114082. [Google Scholar] [CrossRef]
- Zhu, H.; Chao, Y. Drivers of the VR technologies user behaviour in e-commerce during the COVID-19 pandemic. Electron. Commer. Res. Appl. 2023, 62, 101319. [Google Scholar] [CrossRef]
- Joshi, R.; Basu, S.; Jonnalagedda, S.; Avittathur, B. Multichannel retailer’s channel choice and product pricing: Influence of investment in fit-disclosing technology by competing retailers. Int. J. Prod. Econ. 2023, 262, 108895. [Google Scholar] [CrossRef]
- Batool, R.; Mou, J. A systematic literature review and analysis of try-on technology: Virtual fitting rooms. Data Inf. Manag. 2023, 8, 100060. [Google Scholar] [CrossRef]
- Wedel, M.; Bigné, E.; Zhang, J. Virtual and augmented reality: Advancing research in consumer marketing. Int. J. Res. Mark. 2020, 37, 443–465. [Google Scholar] [CrossRef]
- Beck, M.; Crié, D. I virtually try it … I want it ! Virtual Fitting Room: A tool to increase on-line and off-line exploratory behavior, patronage and purchase intentions. J. Retail. Consum. Serv. 2018, 40, 279–286. [Google Scholar] [CrossRef]
- Szocs, C.; Kim, Y.; Lim, M.; Mera, C.A.; Biswas, D. The store of the future: Engaging customers through sensory elements, personalized atmospherics, and interpersonal interaction. J. Retail. 2023, 99, 605–620. [Google Scholar] [CrossRef]
- Hu, X.; Qiu, J.; Zhao, J.; Li, Y. Can in-store recommendations for online-substitutive products integrate online and offline channels? J. Retail. Consum. Serv. 2023, 70, 103142. [Google Scholar] [CrossRef]
- Boonbrahm, P.; Kaewrat, C.; Boonbrahm, S. Realistic Simulation in Virtual Fitting Room Using Physical Properties of Fabrics. Procedia Comput. Sci. 2015, 75, 12–16. [Google Scholar] [CrossRef]
- Ma, Y.; Zhang, C.; Li, Y. Strategies for the retail platform to counteract match uncertainty: Virtual showroom and return or exchange policy. Comput. Ind. Eng. 2023, 176, 108832. [Google Scholar] [CrossRef]
- Yim, M.Y.-C.; Chu, S.-C.; Sauer, P.L. Is Augmented Reality Technology an Effective Tool for E-commerce? An Interactivity and Vividness Perspective. J. Interact. Mark. 2017, 39, 89–103. [Google Scholar] [CrossRef]
- Hinsch, C.; Felix, R.; Rauschnabel, P.A. Nostalgia beats the wow-effect: Inspiration, awe and meaningful associations in augmented reality marketing. J. Retail. Consum. Serv. 2020, 53, 101987. [Google Scholar] [CrossRef]
- Mehrabian, A.; Russell, J.A. An Approach to Environmental Psychology; MIT Press: Cambridge, MA, USA, 1974. [Google Scholar]
- Hewei, T.; Youngsook, L. Factors affecting continuous purchase intention of fashion products on social E-commerce: SOR model and the mediating effect. Entertain. Comput. 2022, 41, 100474. [Google Scholar] [CrossRef]
- Mala Kalaiarasan, S.; Vafaei-Zadeh, A.; Hanifah, H.; Ramayah, T. Can we engage players with extended reality in gaming applications? A Stimulus-Organism-Response framework. Entertain. Comput. 2024, 50, 100651. [Google Scholar] [CrossRef]
- Errajaa, K.; Hombourger-Barès, S.; Audrain-Pontevia, A.-F. Effects of the in-store crowd and employee perceptions on intentions to revisit and word-of-mouth via transactional satisfaction: A SOR approach. J. Retail. Consum. Serv. 2022, 68, 103087. [Google Scholar] [CrossRef]
- Pandita, S.; Mishra, H.G.; Chib, S. Psychological impact of covid-19 crises on students through the lens of Stimulus-Organism-Response (SOR) model. Child. Youth Serv. Rev. 2021, 120, 105783. [Google Scholar] [CrossRef] [PubMed]
- Song, Y.; Zhang, L.; Zhang, M. Research on the impact of public climate policy cognition on low-carbon travel based on SOR theory—Evidence from China. Energy 2022, 261, 125192. [Google Scholar] [CrossRef]
- Rinot Levavi, L.; Friedmann, E.; Kalagy, T.; Cohen, C. Applying the SOR framework to mitigate single-use plastic tableware consumption and why does it work? Solving the dissonance with an extended SOR framework. J. Environ. Manag. 2023, 348, 119344. [Google Scholar] [CrossRef]
- Parhamnia, F. Investigating mobile acceptance in academic library services based on Unified Theory of Acceptance and Use of Technology Model (UTAUT-2). J. Acad. Librariansh. 2022, 48, 102570. [Google Scholar] [CrossRef]
- Claudy, M.C.; Garcia, R.; O’Driscoll, A. Consumer resistance to innovation—A behavioral reasoning perspective. J. Acad. Mark. Sci. 2015, 43, 528–544. [Google Scholar] [CrossRef]
- Sahu, A.K.; Padhy, R.; Dhir, A. Envisioning the future of behavioral decision-making: A systematic literature review of behavioral reasoning theory. Australas. Mark. J. 2020, 28, 145–159. [Google Scholar] [CrossRef]
- Rivard, S.; Lapointe, L. Information technology implementers’ responses to user resistance: Nature and effects. MIS Q. 2012, 36, 897–920. [Google Scholar] [CrossRef]
- Ben-Sasson, A.; Ben-Sasson, E.; Jacobs, K.; Malinovitch, R. The relationship between users’ technology approaches and experiences in a child development mobile application. Health Technol. 2020, 10, 1079–1094. [Google Scholar] [CrossRef]
- Besoain, F.; González-Ortega, J.; Gallardo, I. An Evaluation of the Effects of a Virtual Museum on Users’ Attitudes towards Cultural Heritage. Appl. Sci. 2022, 12, 14. [Google Scholar] [CrossRef]
- Wang, Z.; Wang, Z.; Deng, R. Assessment Scale and Behavioral Model Construction for AI Chat Information Retrieval and Processing Service Systems Based on Behavioral Reasoning Theory—Taking ChatGPT-Like Tools as an Example. Int. J. Hum. Comput. Interact. 2024, 1–22. [Google Scholar] [CrossRef]
- Lee, H.; Xu, Y.J.; Porterfield, A. Virtual Fitting Rooms for Online Apparel Shopping: An Exploration of Consumer Perceptions. Fam. Consum. Sci. Res. J. 2022, 50, 189–204. [Google Scholar] [CrossRef]
- Hartling, L.; Guise, J.-M.; Hempel, S.; Featherstone, R.; Mitchell, M.D.; Motu’apuaka, M.L.; Robinson, K.A.; Schoelles, K.; Totten, A.; Whitlock, E. Fit for purpose: Perspectives on rapid reviews from end-user interviews. Syst. Rev. 2017, 6, 32. [Google Scholar] [CrossRef]
- Huang, Y.; Qian, L. Understanding the potential adoption of autonomous vehicles in China: The perspective of behavioral reasoning theory. Psychol. Mark. 2021, 38, 669–690. [Google Scholar] [CrossRef]
- Price, B. A First Course in Factor Analysis by Andrew L. Comrey; Howard B. Lee. Technometrics 1993, 35, 453. [Google Scholar] [CrossRef]
- Comrey, A.L.; Lee, H.B. A First Course in Factor Analysis; Psychology Press: London, UK, 1992. [Google Scholar]
- Dai, H.M.; Teo, T.; Rappa, N.A.; Huang, F. Explaining Chinese university students’ continuance learning intention in the MOOC setting: A modified expectation confirmation model perspective. Comput. Educ. 2020, 150, 103850. [Google Scholar] [CrossRef]
- Hair, J.F., Jr.; Hult, G.T.M.; Ringle, C.M.; Sarstedt, M. A Primer on Partial Least Squares Structural Equation Modeling (PLS-SEM); Sage Publications: Thousand Oaks, CA, USA, 2021. [Google Scholar]
- Wang, Z.; Deng, R.; Jiang, Q.-L. Exploration and Study of the Factors Influencing Users’ Adoption of Games for Fitness Behavior. Int. J. Hum. Comput. Interact. 2023, 39, 3461–3472. [Google Scholar] [CrossRef]
- Wang, Z.; Jiang, Q.; Li, Z. How to promote online education through educational software—An analytical study of factor analysis and structural equation modeling with Chinese users as an example. Systems 2022, 10, 100. [Google Scholar] [CrossRef]
- Calisir, F.; Calisir, F. The relation of interface usability characteristics, perceived usefulness, and perceived ease of use to end-user satisfaction with enterprise resource planning (ERP) systems. Comput. Hum. Behav. 2004, 20, 505–515. [Google Scholar] [CrossRef]
- Nunnally, J.C. Psychometric Theory 3E; Tata McGraw-Hill Education: New York, NY, USA, 1994. [Google Scholar]
- Kaiser, H.F. The varimax criterion for analytic rotation in factor analysis. Psychometrika 1958, 23, 187–200. [Google Scholar] [CrossRef]
- Muilenburg, L.Y.; Berge, Z.L. Student barriers to online learning: A factor analytic study. Distance Educ. 2005, 26, 29–48. [Google Scholar] [CrossRef]
- Shevlin, M.; Miles, J.N. Effects of sample size, model specification and factor loadings on the GFI in confirmatory factor analysis. Personal. Individ. Differ. 1998, 25, 85–90. [Google Scholar] [CrossRef]
- Ahmad, S.; Zulkurnain, N.N.A.; Khairushalimi, F.I. Assessing the validity and reliability of a measurement model in Structural Equation Modeling (SEM). J. Adv. Math. Comput. Sci. 2016, 15, 1–8. [Google Scholar] [CrossRef]
- Fornell, C.; Larcker, D.F. Evaluating structural equation models with unobservable variables and measurement error. J. Mark. Res. 1981, 18, 39–50. [Google Scholar] [CrossRef]
- Lin, C.P.; Bhattacherjee, A. Extending technology usage models to interactive hedonic technologies: A theoretical model and empirical test. Inf. Syst. J. 2010, 20, 163–181. [Google Scholar] [CrossRef]
- Lassar, W.M.; Manolis, C.; Winsor, R.D. Service quality perspectives and satisfaction in private banking. J. Serv. Mark. 2000, 14, 244–271. [Google Scholar] [CrossRef]
- Seiders, K.B.; Leonard, L.; Gresham, L.G. Attention, Retailers! How Convenient Is Your Convenience Strategy? Sloan Manag. Rev. 2000, 41, 79–89. [Google Scholar]
- Chang, Y.-W.; Polonsky, M.J. The influence of multiple types of service convenience on behavioral intentions: The mediating role of consumer satisfaction in a Taiwanese leisure setting. Int. J. Hosp. Manag. 2012, 31, 107–118. [Google Scholar] [CrossRef]
- Starrett, E.; Jordan, M.; Chen, Y.-C.; Park, J.; Meza-Torres, C. Desirable uncertainty in science teaching: Exploring teachers’ perceptions and practice of using student scientific uncertainty as a pedagogical resource. Teach. Teach. Educ. 2024, 140, 104456. [Google Scholar] [CrossRef]
- Venkatesh, V.; Thong, J.Y.; Xu, X. Consumer acceptance and use of information technology: Extending the unified theory of acceptance and use of technology. MIS Q. 2012, 36, 157–178. [Google Scholar] [CrossRef]
- Lischer-Katz, Z. A methodological framework for studying visual information practices. Libr. Inf. Sci. Res. 2022, 44, 101188. [Google Scholar] [CrossRef]
- Dörnyei, K.R.; Lunardo, R. When limited edition packages backfire: The role of emotional value, typicality and need for uniqueness. J. Bus. Res. 2021, 137, 233–243. [Google Scholar] [CrossRef]
- Scholdra, T.P.; Wichmann, J.R.K.; Reinartz, W.J. Reimagining personalization in the physical store. J. Retail. 2023, 99, 563–579. [Google Scholar] [CrossRef]
- Guo, Y.; Ayoun, B. What’s in it for them? The role of social curiosity and social needs in motivating and retaining hospitality employees. Int. J. Hosp. Manag. 2023, 115, 103596. [Google Scholar] [CrossRef]
- Deci, E.L.; Ryan, R.M. The “what” and “why” of goal pursuits: Human needs and the self-determination of behavior. Psychol. Inq. 2000, 11, 227–268. [Google Scholar] [CrossRef]
- Shafiq, B.; Ali, A.; Iqbal, H. Perfectionism, mattering and loneliness in young adulthood of Generation-Z. Heliyon 2024, 10, e23330. [Google Scholar] [CrossRef] [PubMed]
- Sharma, M.; Kaushal, D.; Joshi, S. Adverse effect of social media on generation Z user’s behavior: Government information support as a moderating variable. J. Retail. Consum. Serv. 2023, 72, 103256. [Google Scholar] [CrossRef]
- Wang, Z.; Yuan, R.; Luo, J.; Liu, M.J.; Yannopoulou, N. Does personalized advertising have their best interests at heart? A quantitative study of narcissists’ SNS use among Generation Z consumers. J. Bus. Res. 2023, 165, 114070. [Google Scholar] [CrossRef]
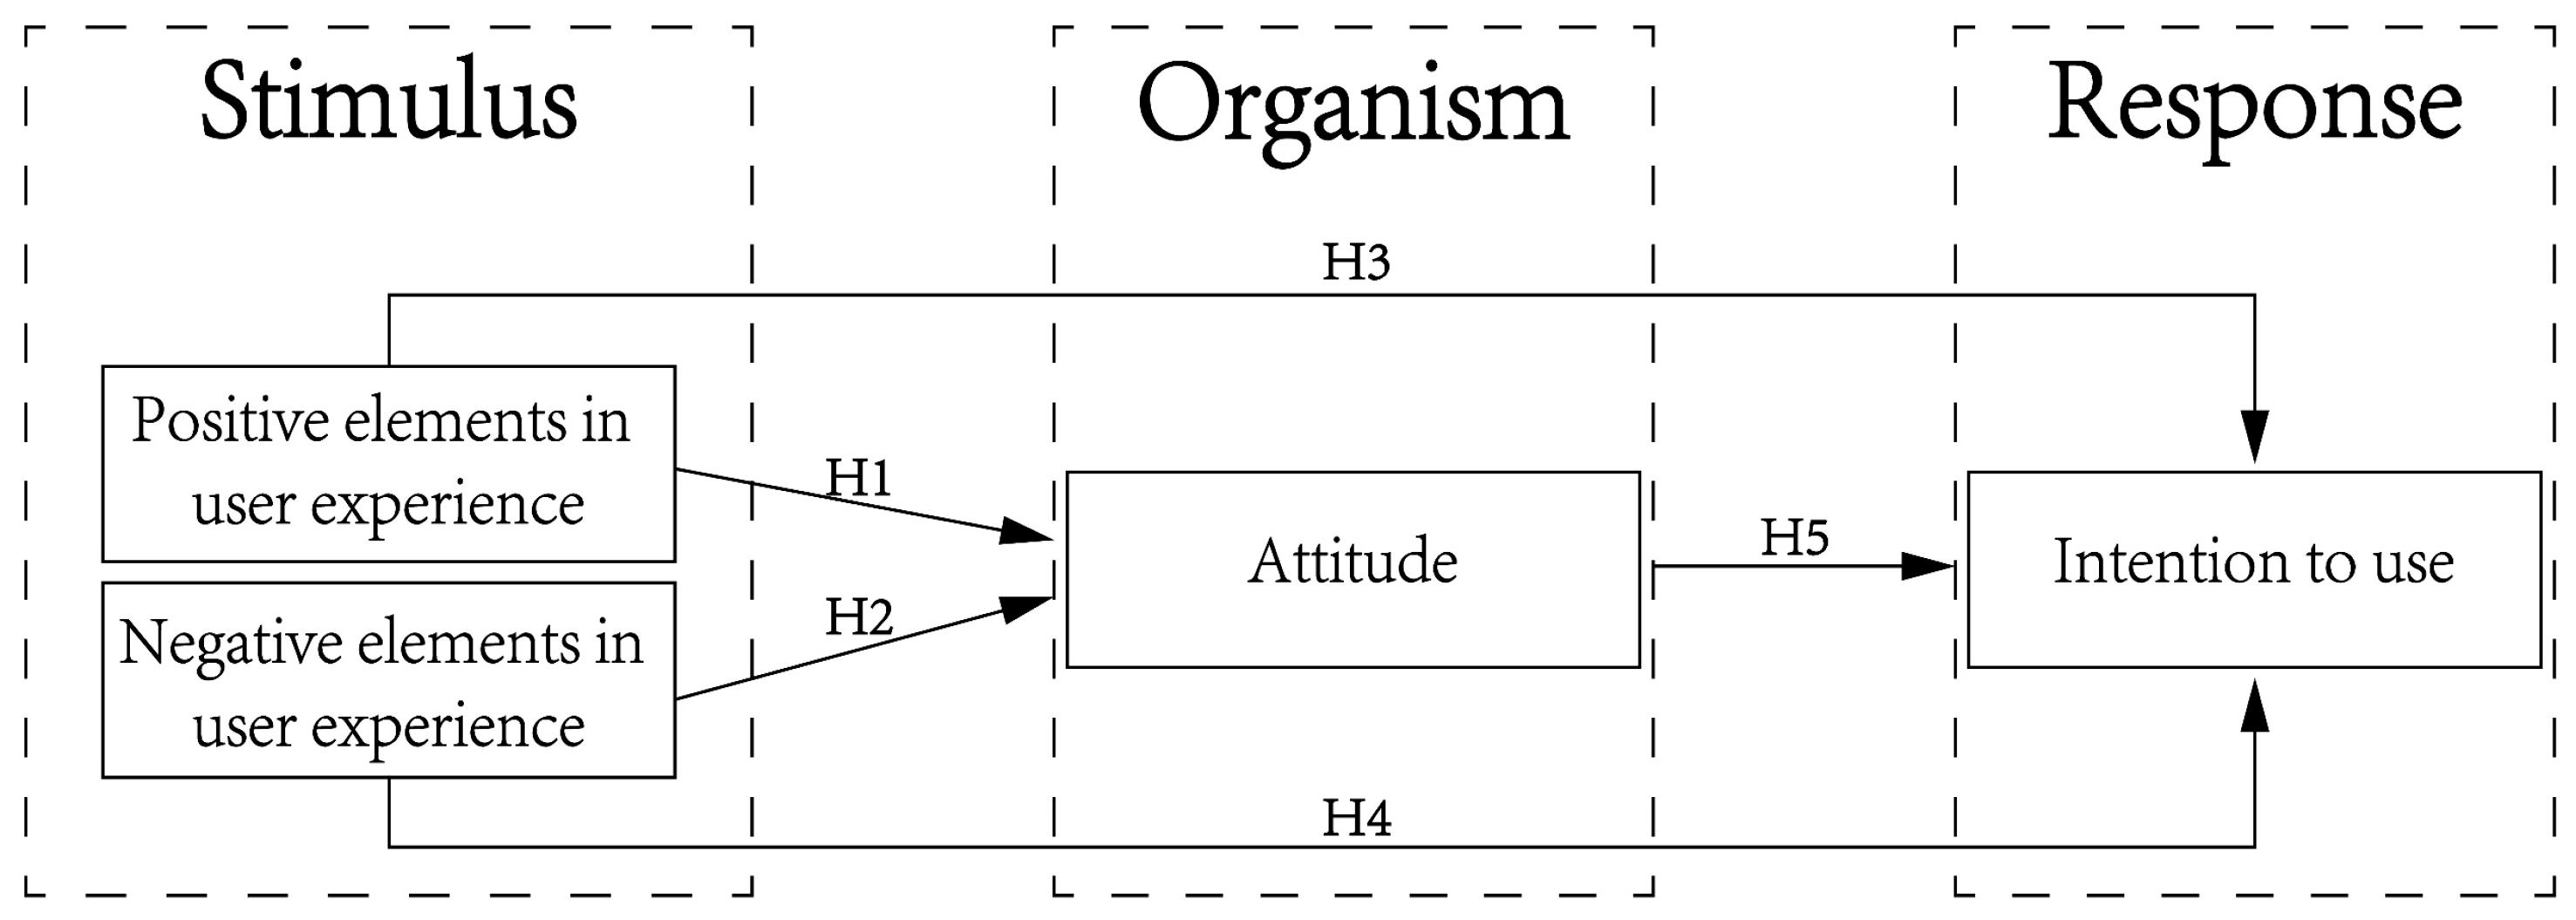
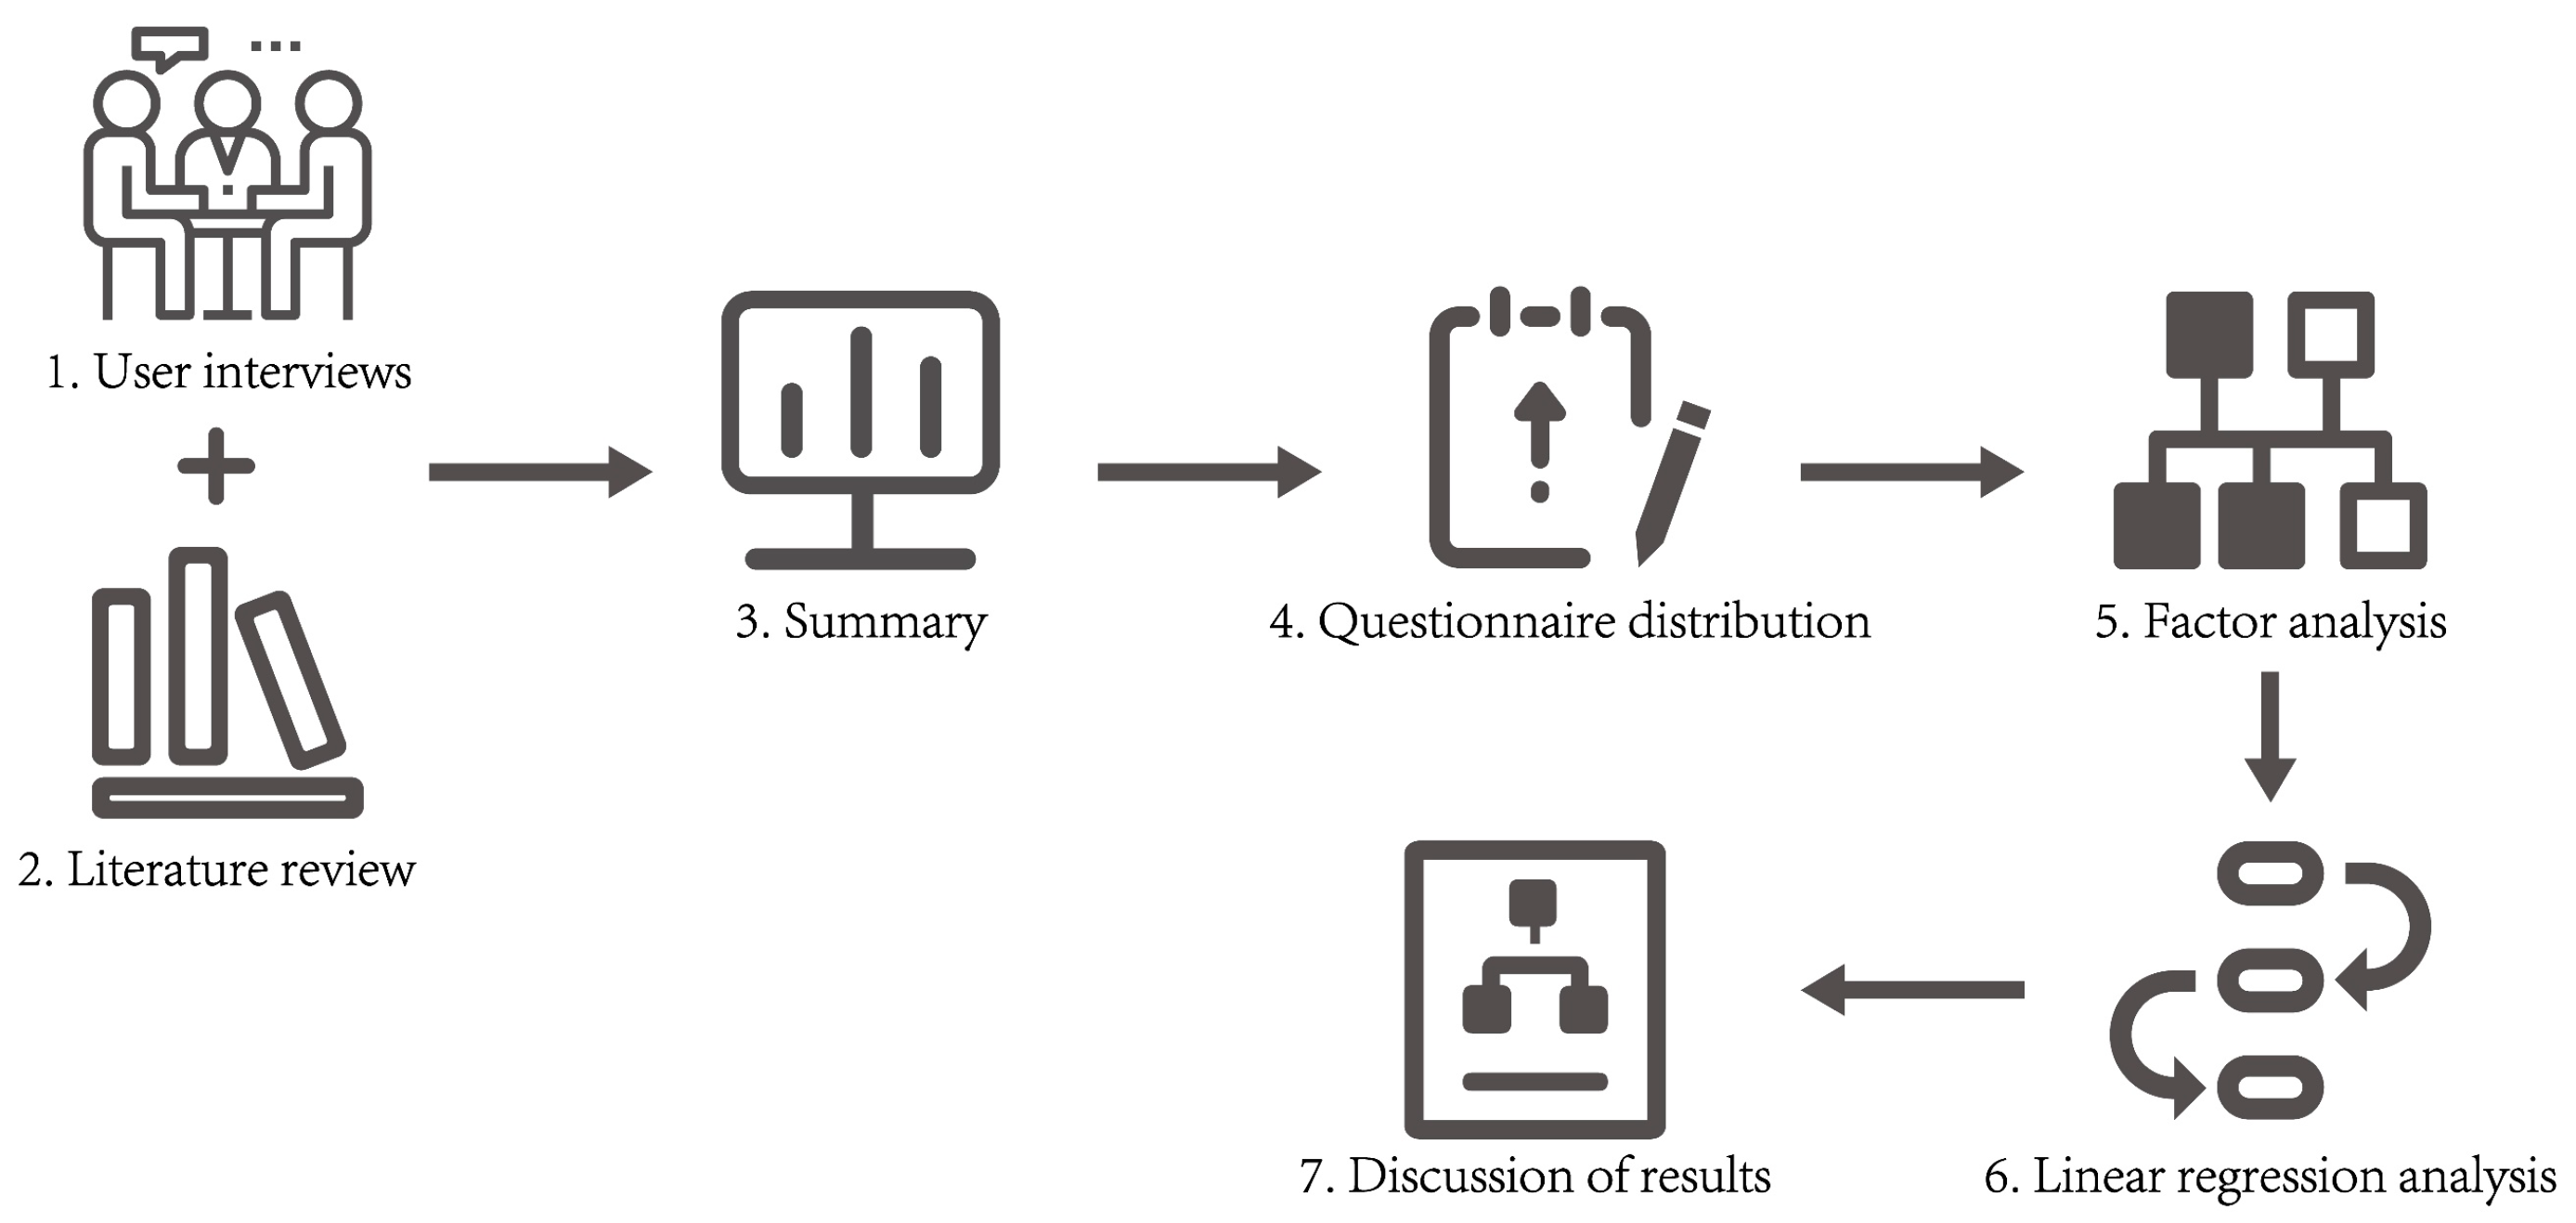
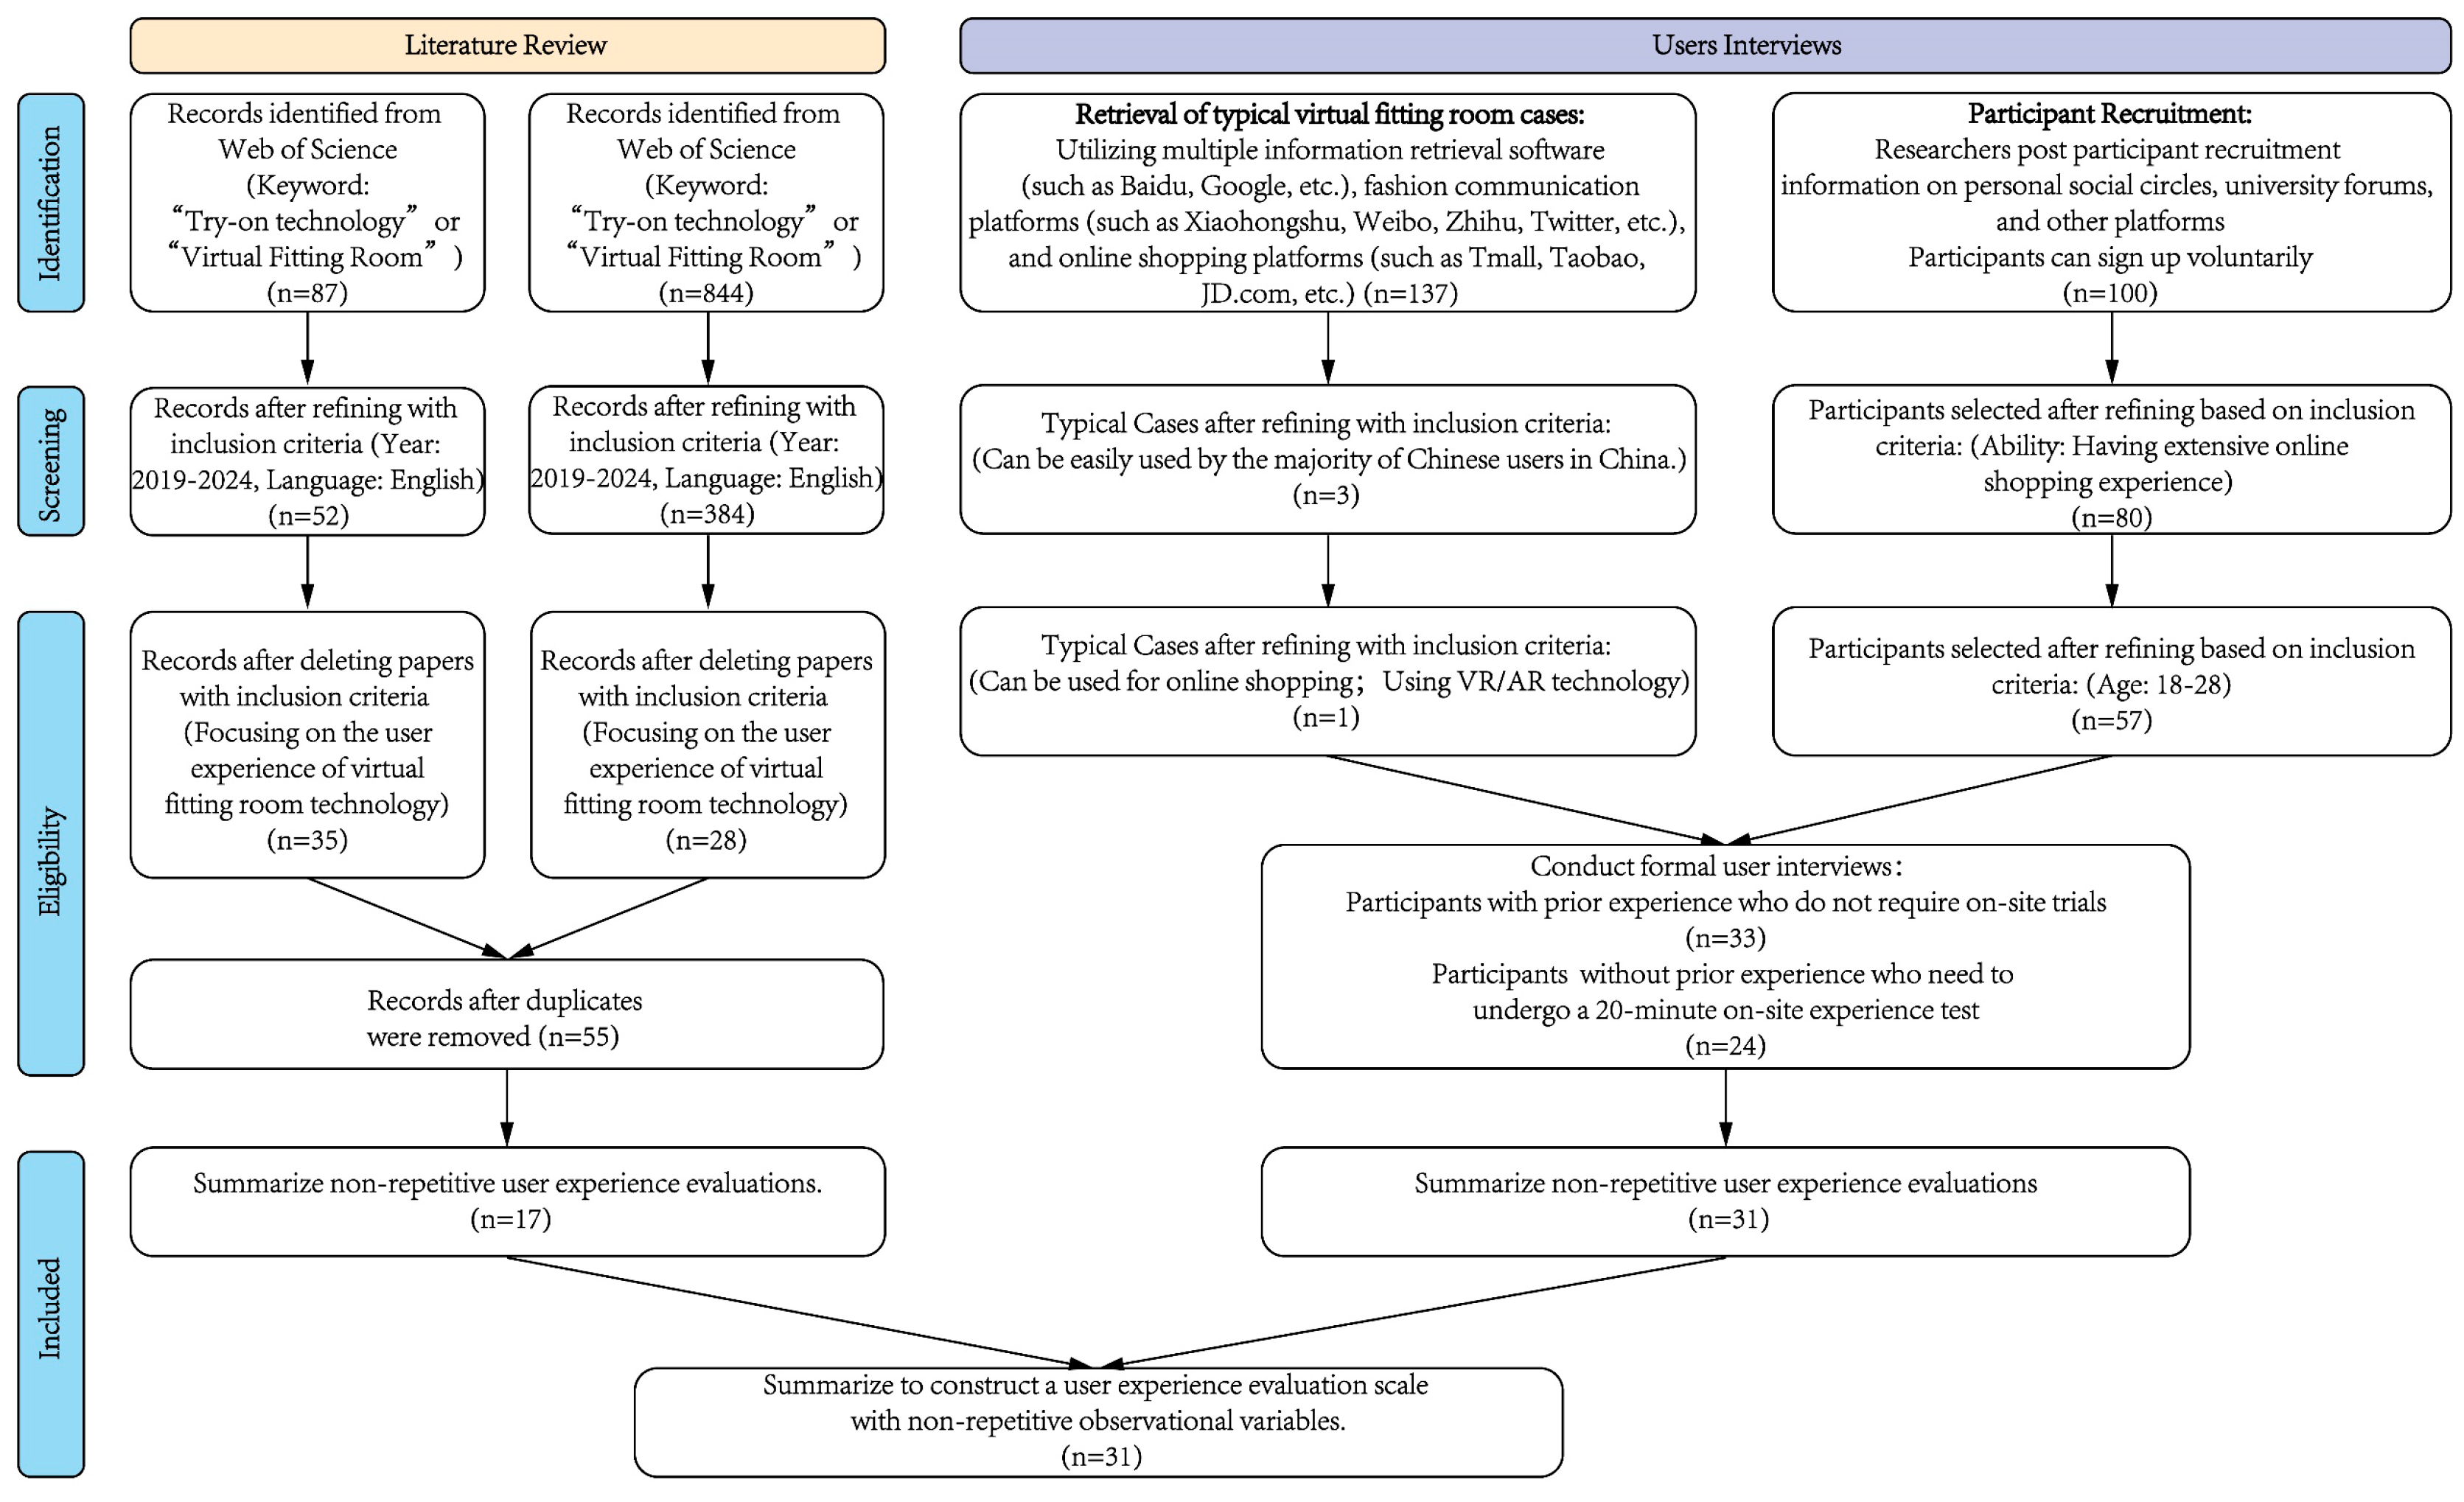
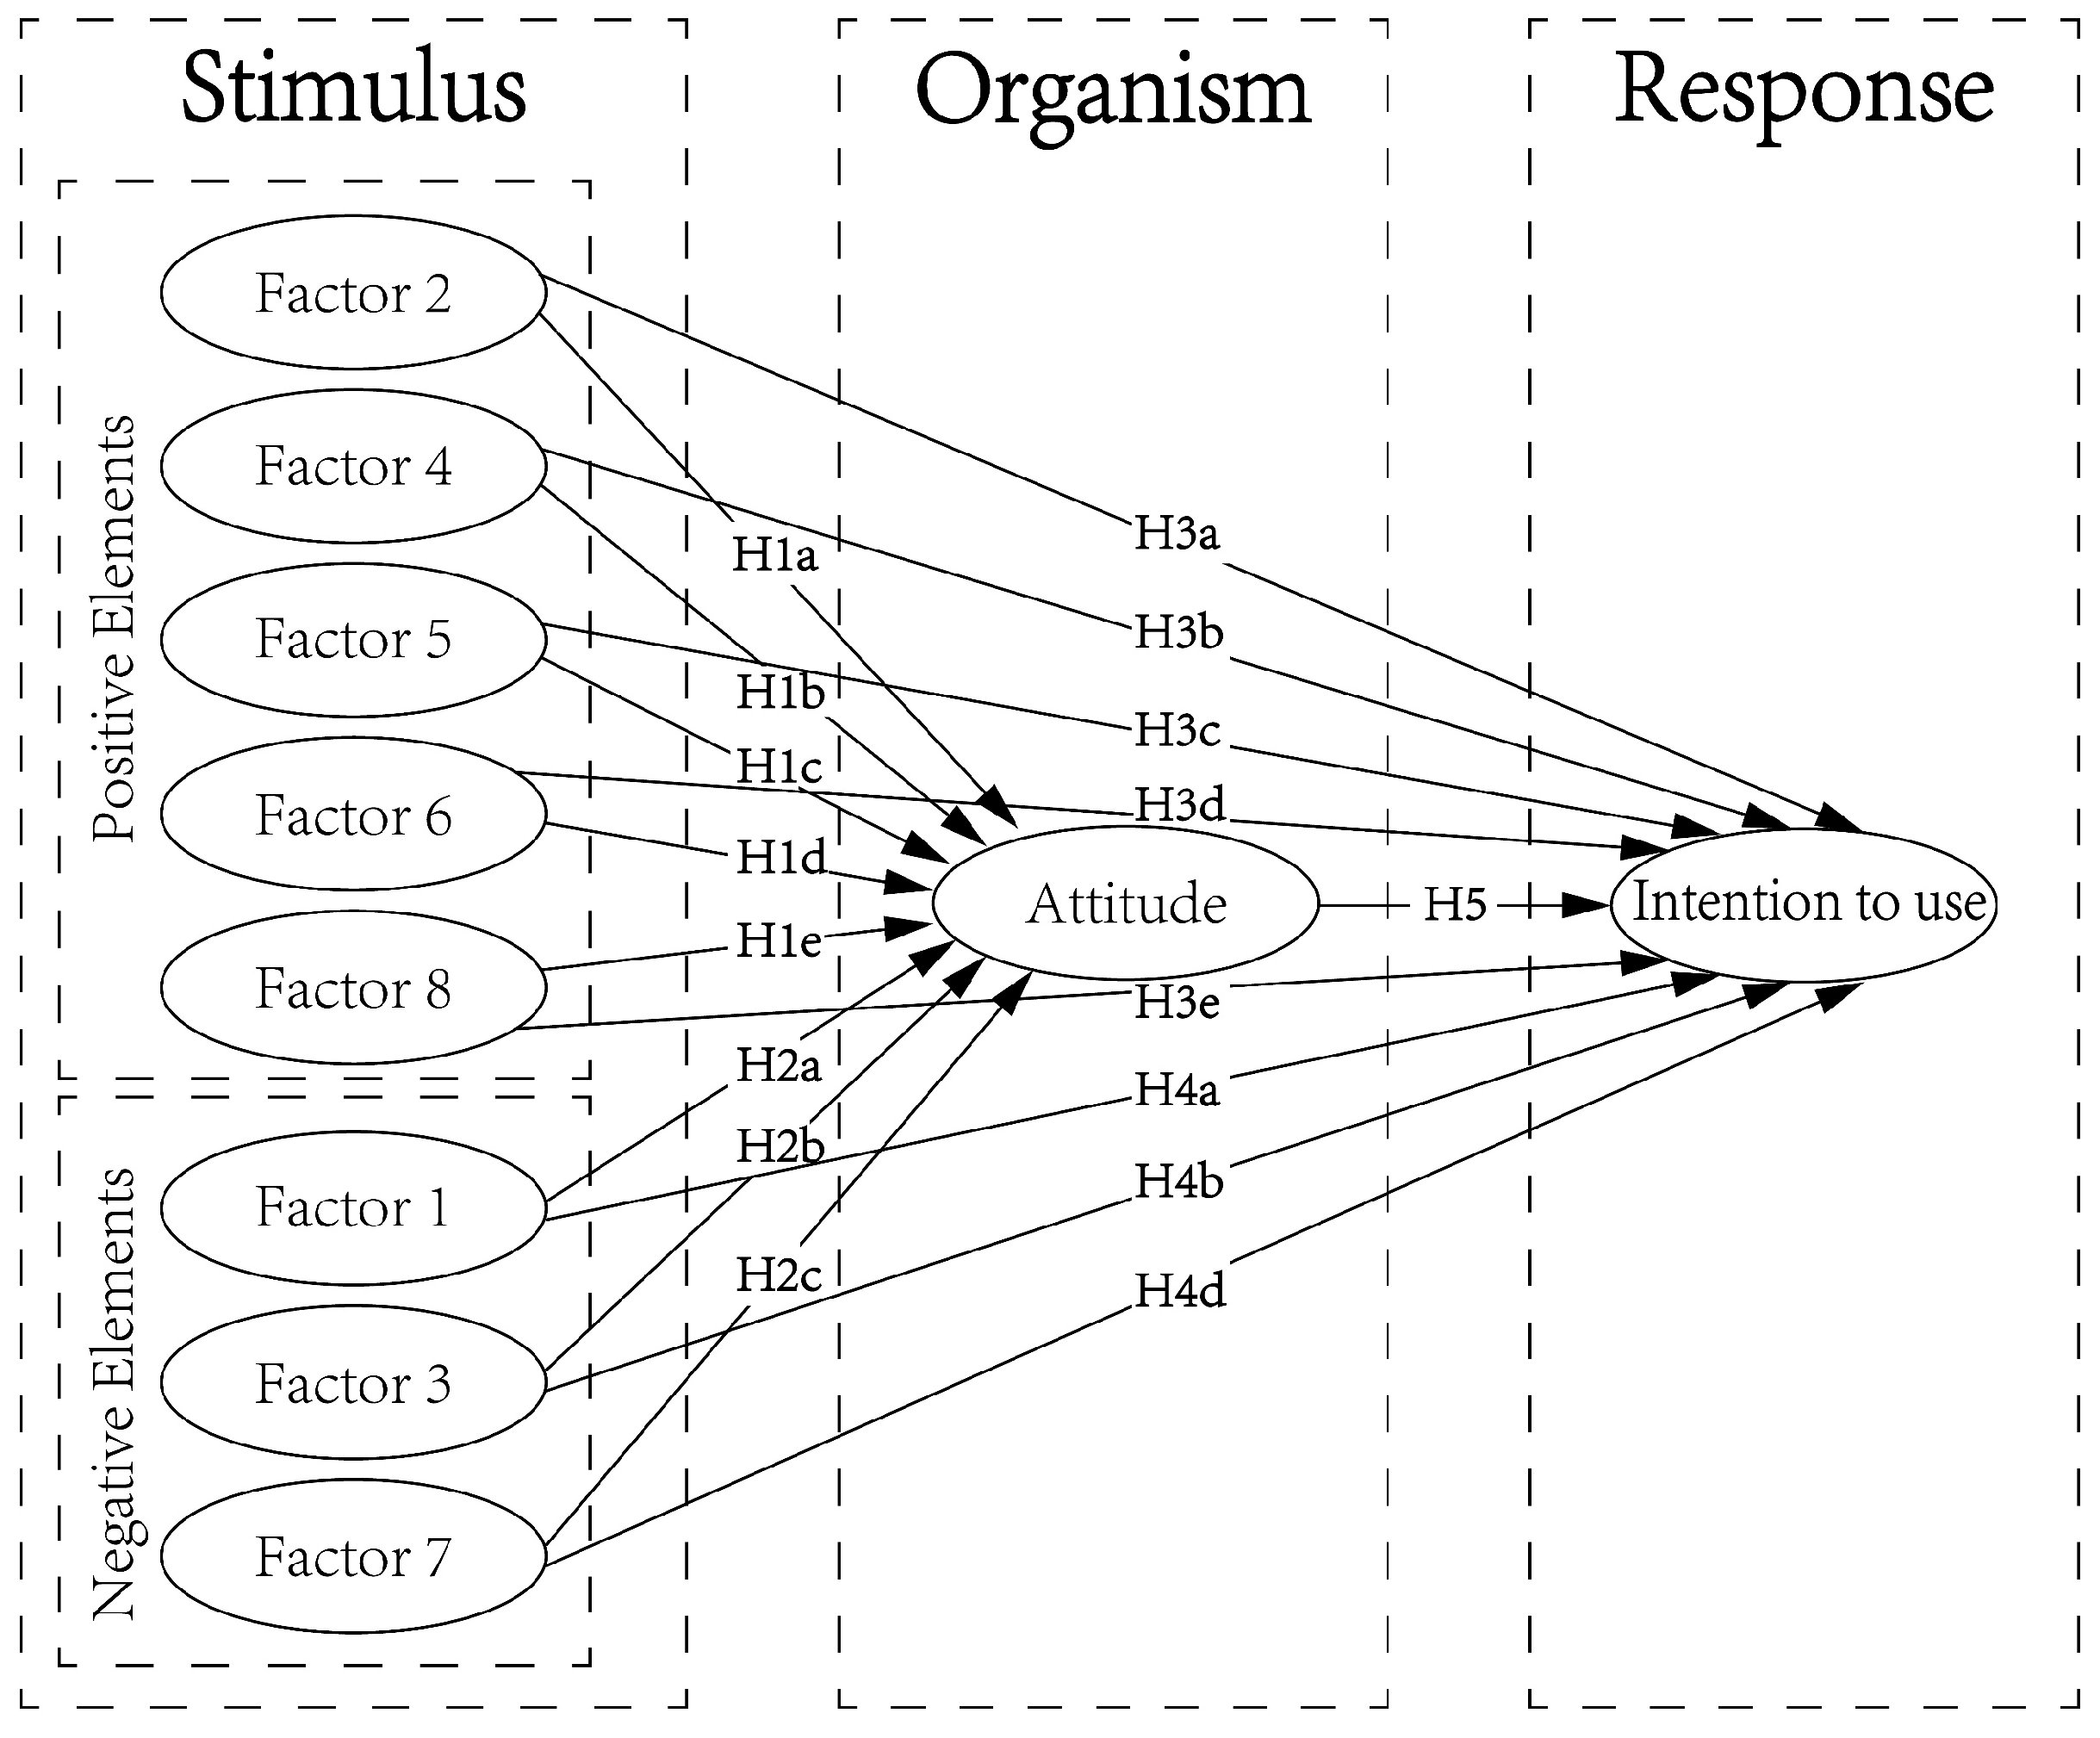
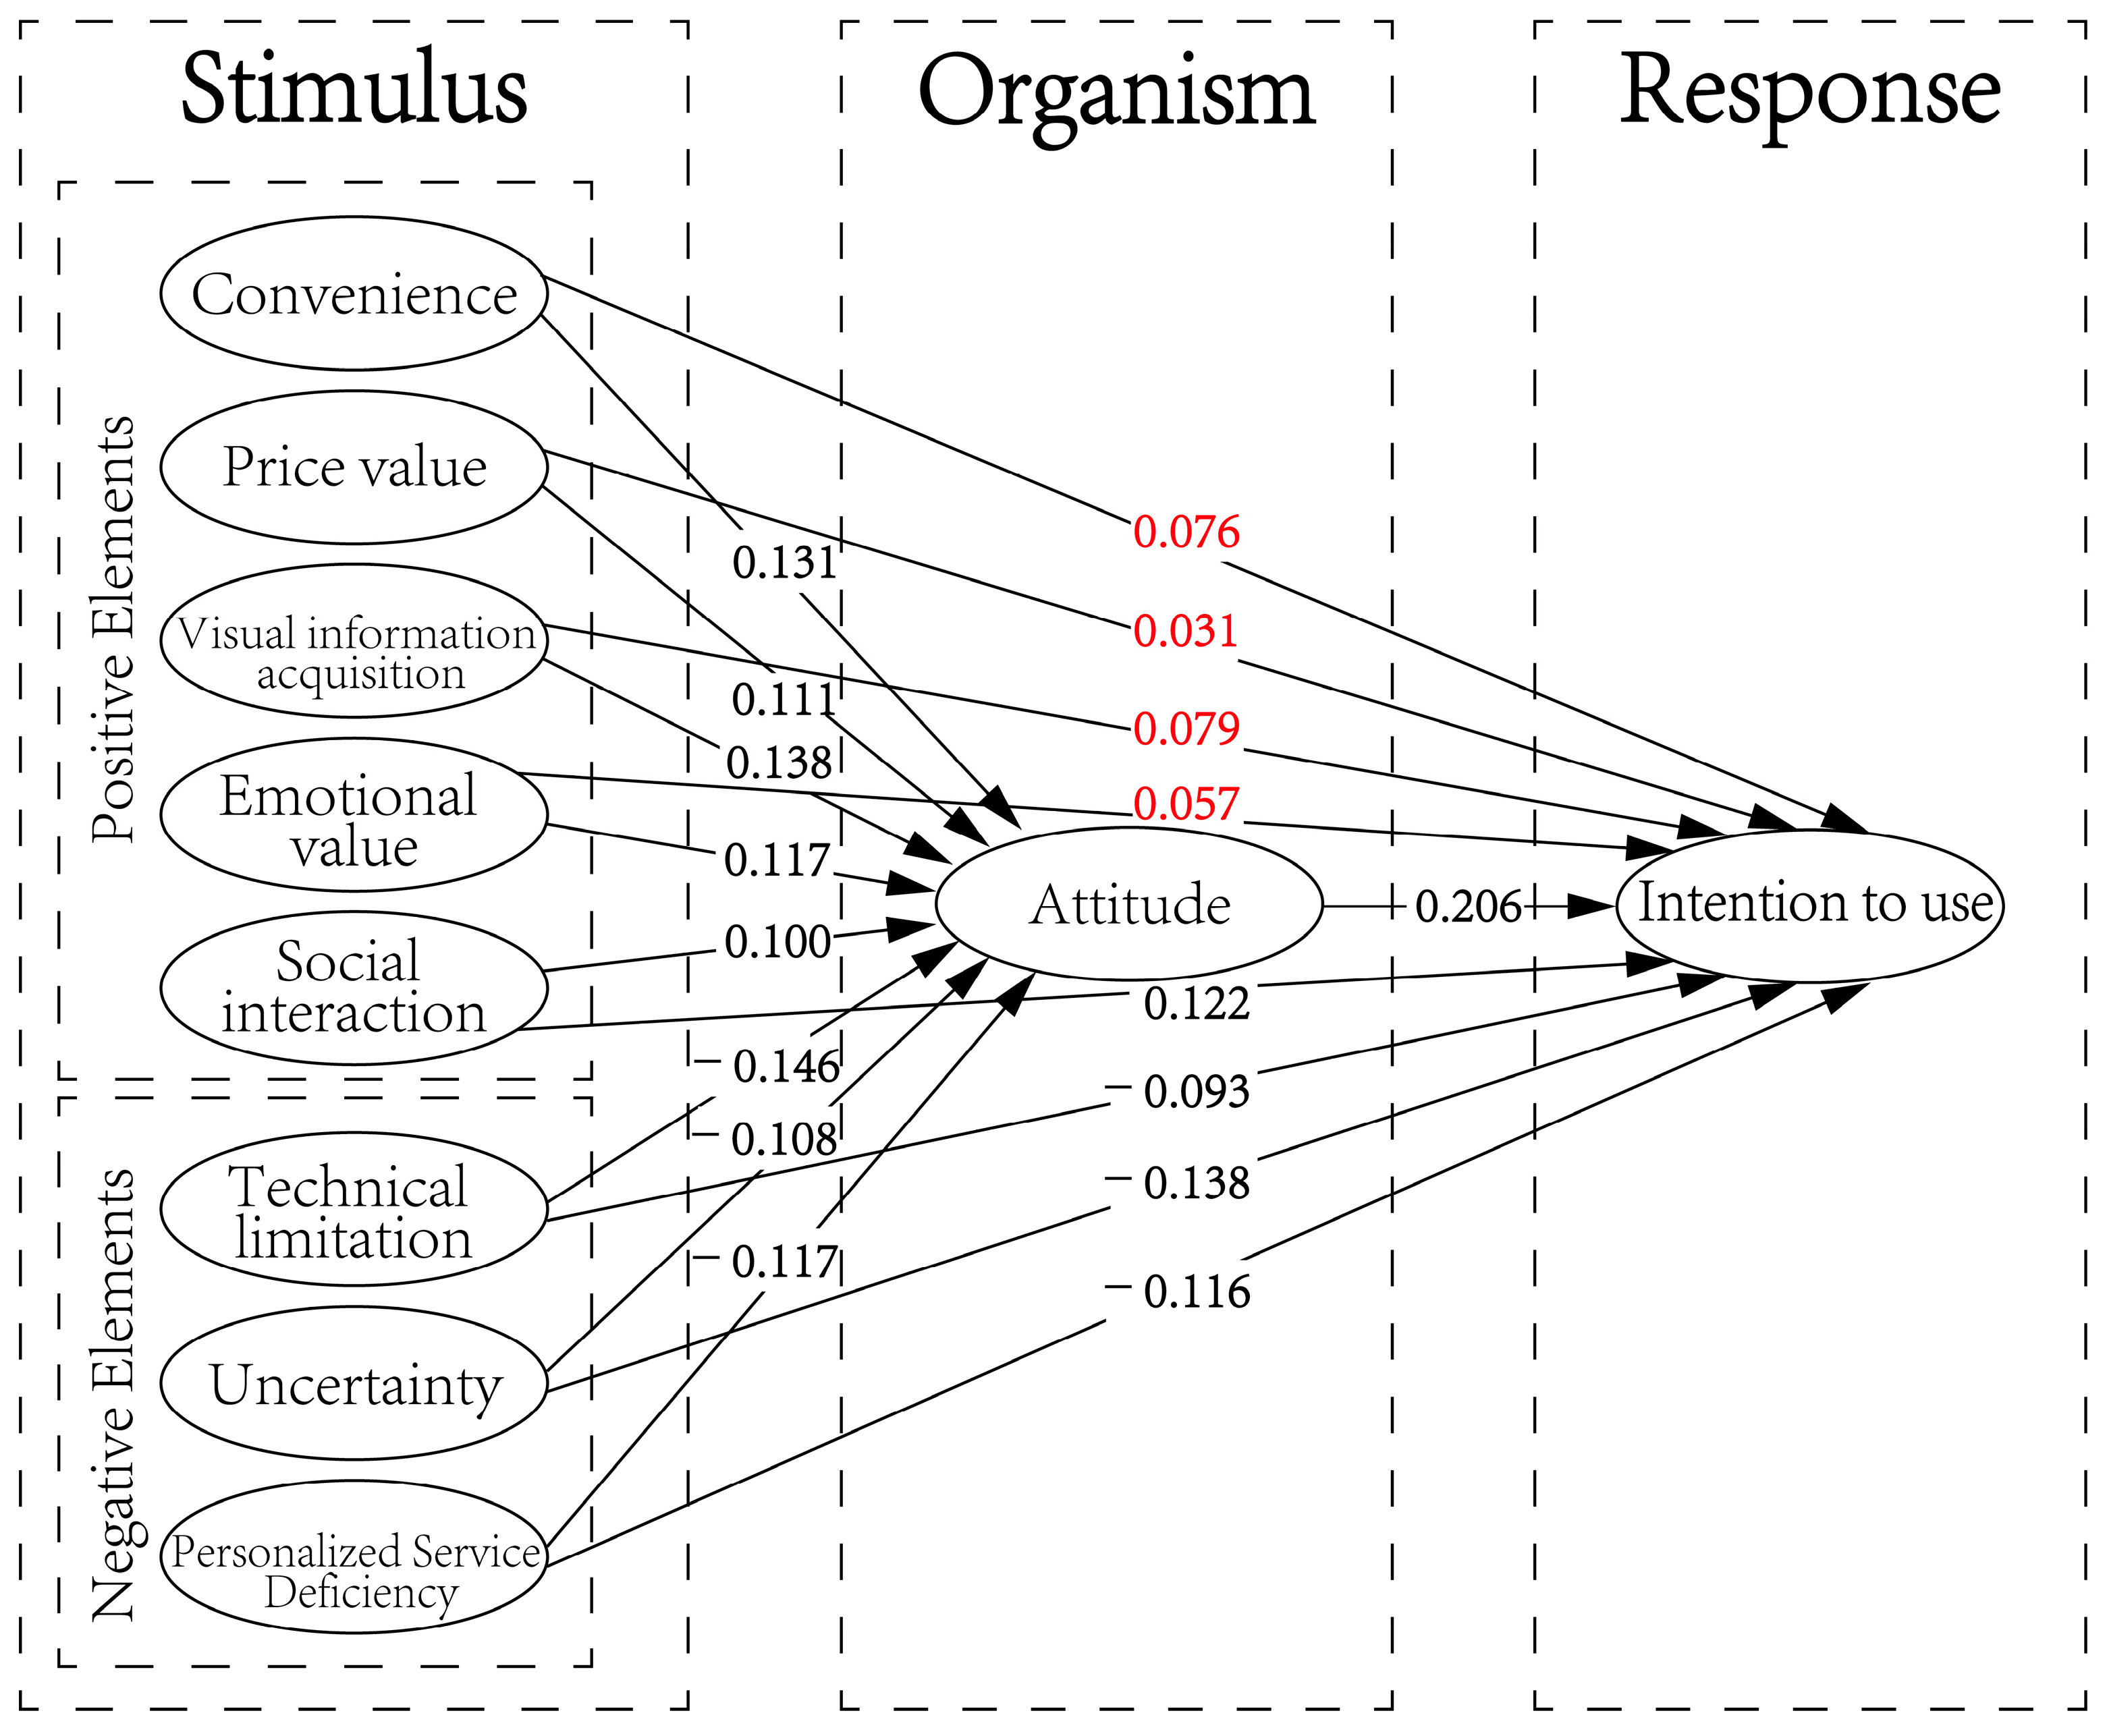
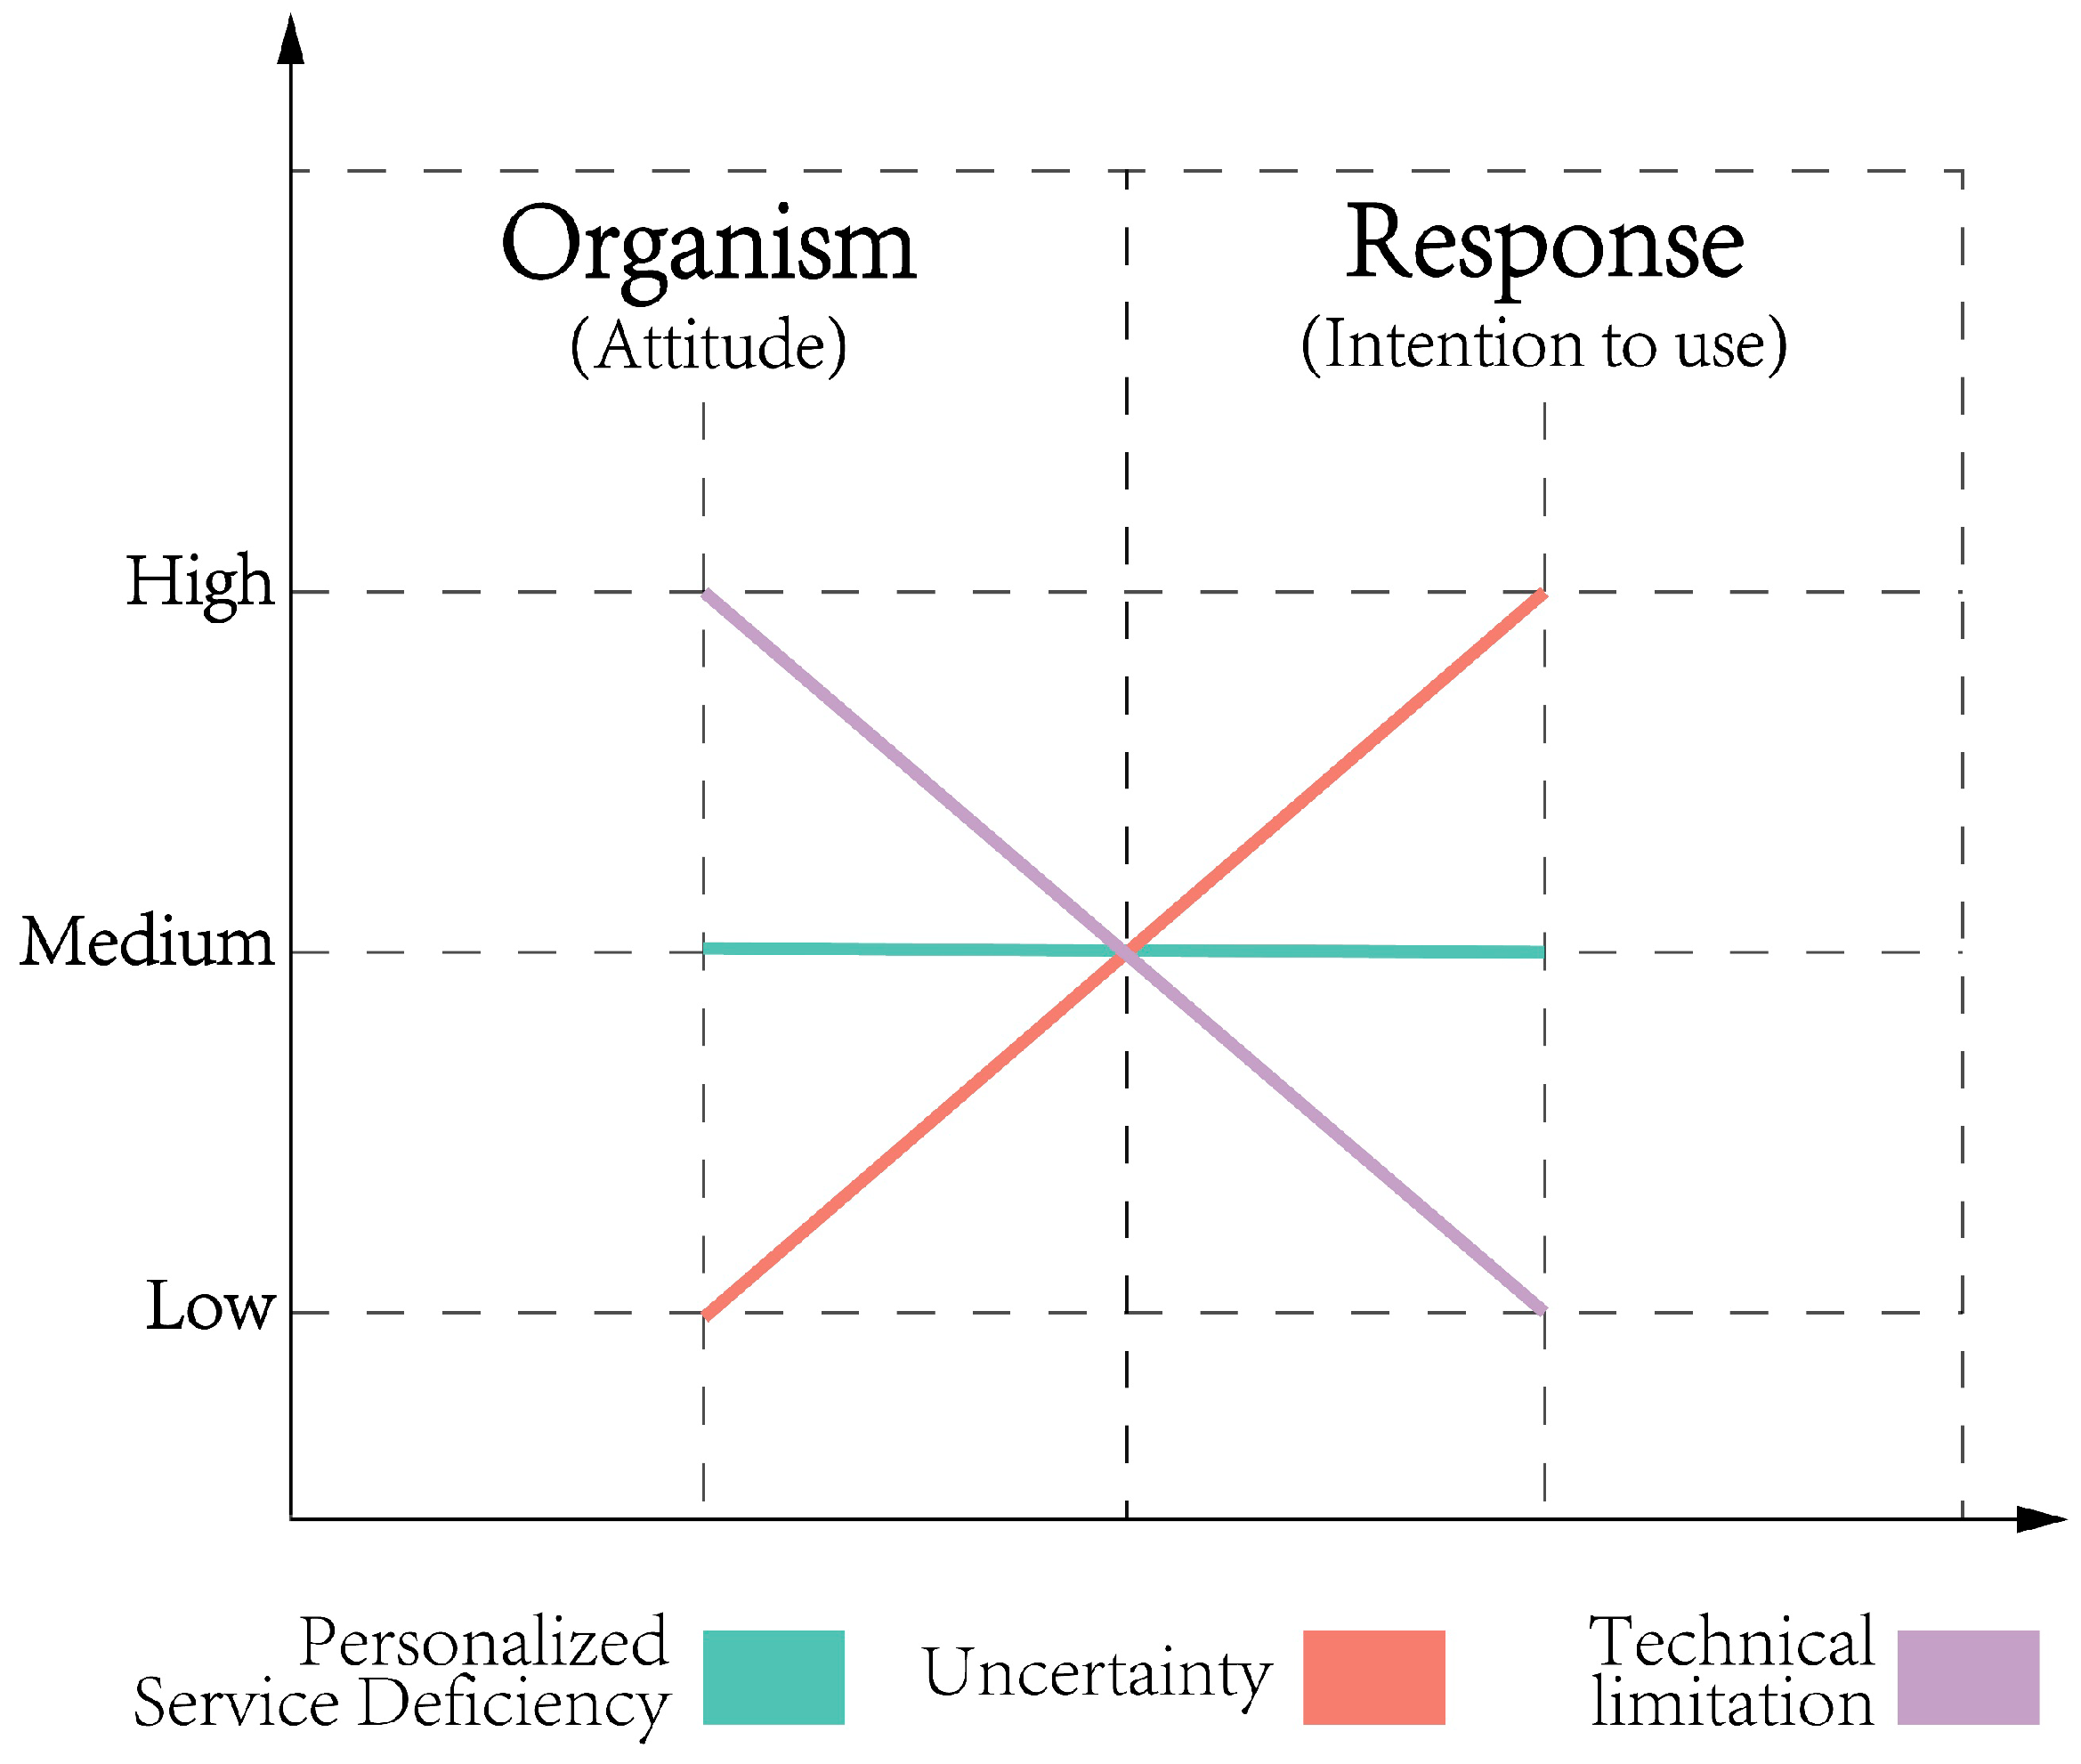
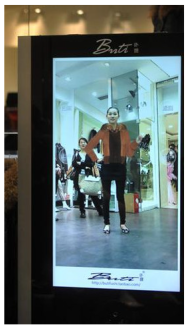
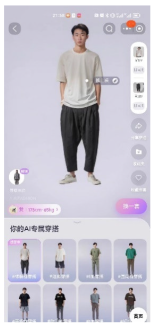

Disclaimer/Publisher’s Note: The statements, opinions and data contained in all publications are solely those of the individual author(s) and contributor(s) and not of MDPI and/or the editor(s). MDPI and/or the editor(s) disclaim responsibility for any injury to people or property resulting from any ideas, methods, instructions or products referred to in the content. |
© 2024 by the authors. Licensee MDPI, Basel, Switzerland. This article is an open access article distributed under the terms and conditions of the Creative Commons Attribution (CC BY) license (https://creativecommons.org/licenses/by/4.0/).