Article

Towards Assessing the Economic Sustainability of Reconfigurable Modularization in Semi-Automatic Assembly Systems: A System Dynamics Perspective

1
Department of Intelligent Production Systems, School of Engineering Science, University of Skövde, SE-541 28 Skövde, Sweden
2
Department of Product Development, Production and Design, School of Engineering, Jönköping University, SE-551 11 Jönköping, Sweden
*
Author to whom correspondence should be addressed.
Systems 2024, 12(6), 218; https://doi.org/10.3390/systems12060218
Submission received: 4 March 2024 / Revised: 4 June 2024 / Accepted: 16 June 2024 / Published: 19 June 2024

Abstract

:
The purpose of this paper is to investigate the economic sustainability implications of reconfigurable modularization and changeability in semi-automatic assembly systems using a system dynamics perspective. Through our applied research, using a multiple case study approach, we assess the potential and drawbacks of reconfigurable modularization to advance sustainable practices in the manufacturing industry with the purpose of improving overall long-term resource allocation in product realization processes. The traditional approach of developing and industrializing one product at a time is becoming obsolete due to factors such as more frequent product introductions, technological innovations, and sustainability requirements. This is due to the increasing trends of product variety and customization, which often necessitate costly modifications to production systems throughout their life cycles. To address these challenges, scholars advocate for the adoption of reconfigurable modular architectures in product and production system designs, facilitated through product platforming. However, when it comes to studies of the long-term economic impacts from the effects in operations, meaning the economic sustainability implications for the production system throughout its life cycle, there is limited research examining the economic rationale for this approach. Therefore, this paper proposes a systematic examination of the economic sustainability implications of reconfigurable modularization in semi-automatic assembly systems using a system dynamics perspective. By leveraging a system dynamics simulation, we structure and investigate the potential economic short- and long-term tradeoffs between the benefits and drawbacks of reconfigurable modularization derived from empirical findings across four case studies. The novelty of this study highlights not only the investment costs and related engineering implications and their costs but also the estimated operation costs encompassing multiple product introductions expected during the life cycle of a production system. We believe that such an approach offers valuable insights into how reconfigurable modularization can be useful from an economic sustainability viewpoint within semi-automatic assembly systems, thereby contributing to the ongoing industrial transformation towards sustainability.

1. Introduction

Large parts of the manufacturing industry on a global level are facing considerable changes towards increasing product variety and mass customization [1], shorter product life cycles [2], and increased sustainability requirements to rethink their use of materials and energy in a circular economy [3]. These global market trends will distinguish agile and progressive companies from contemporary ones with a traditional approach to product realization. Frequently, companies will face significant costs related to modifications to production systems throughout their life cycle, placing substantial pressure on companies to proactively develop their production systems. One significant path forward is to sustainably optimize the product realization process and steps within it, to enhance the integration productivity [4] and thereby the delivery precision of new product introductions (NPIs) to the market within budget on a longer time horizon. In the digitalization era and Industry 4.0, various simulation approaches have emerged in support of the product realization process, such as simulations in product design [5], evaluating reconfiguration assessments of manufacturing systems [6,7], various flow simulations in production development [8], and agile product development processes to reduce lead times and total costs [9], where reconfigurability has a pivotal role to play [10].
Consequently, companies in the manufacturing industry need to develop capabilities to address the pressing market challenges and find ways to sustainably improve the integration productivity in their product realization processes. This can be accomplished in various ways, where two prominent areas are co-platforming [10] and reconfigurable manufacturing systems (RMS) [11], recently motivated to underpin how circular production systems in the circular economy should be enabled [12]. With a theoretical foundation in these realms, Boldt et al. [13] proposed a bottom-up production engineering support to evaluate modularization levels of semi-automatic assembly systems by decomposing and describing their production capabilities to sustainably adapt to NPIs. However, the pursuit of greater decoupling between product features and modular production system design solutions, as advocated by their approach, introduces several cost-related considerations. In this project-based context, it becomes hard to justify the economic investments required to achieve a reconfigurable system based only on one product project. Especially when considering an investment in a reconfigurable system, it is crucial to note that production planning often lacks specific knowledge of future NPIs. As a result, cost reductions may only materialize after subsequent NPIs are implemented. Hence, this requires increased capabilities to plan future production systems without actually knowing and planning in detail when making the investment. This necessitates the careful consideration of how financial resources are allocated across the stream of planned NPIs throughout the life cycle of the production system and requires more of an economic sustainability viewpoint. However, to fully comprehend the economic consequences, in terms of potential costs and benefits, it is important to formulate systemic hypotheses of the economic rationale behind their development.
The problem is that few examples that propose the economic sustainability of investments in reconfigurable production solutions exist in the literature that encompass enough complexity of various costs and benefits. For example, Boldt et al. [13], in their bottom-up approach, include estimated costs to expand each specific production capability to an enhanced level of modularity using the theory of RMS, where the cost–benefit evaluation is limited to a design space framed and limited by product project budgets. Helbig et al. [14] propose a method to encompass the life cycle costs of decentralized component-based automation solutions and related costs. Andersen et al. [15] utilize a stochastic model with net present value (NPV) to evaluate various demand uncertainty, labor cost, investment cost, scaling cost, and cycle times. Examples using mathematical models [16] or discrete-event simulations [6] also exist that investigate various technical solutions in relation to their productivity and cost performances. However, neither of these implements a long-term strategic perspective on economic sustainability, especially considering evaluating the systemic behavior to support industrial management in their decision-making. Our research proposal aims to address this gap by enhancing strategic capabilities to increase ambidexterity in exploring and exploiting reconfigurability skills in the manufacturing industry. We propose a conceptual system dynamics model to assess the justification of investments in reconfigurable modularization throughout the life cycle of a production system, considering multiple NPIs and volume uncertainties.
To encompass an economic sustainability perspective, the system dynamics methodology [17] can offer powerful logic to deal with issues in strategic management and support resource allocation [18]. System dynamics models define system elements and their dependencies using equations and integrals to represent the conceptual structural knowledge within a certain problem boundary. This allows us to study the rationale behind the emergent behaviors and simulate their long-term economic consequences [19]. Therefore, based on experiences and knowledge combined with empirical findings in a multiple case study of four cases, the research approach herein utilizes system dynamics to conceptualize the economic sustainability effects of reconfigurable modularization.
Hence, the purpose of this paper is to investigate the economic sustainability implications of reconfigurable modularization and changeability in semi-automatic assembly systems using a system dynamics perspective. Through our applied and explorative research approach, we assess the potential to advance sustainable practices in the manufacturing industry by introducing a conceptual system dynamics model that evaluates various dependencies derived from empirical findings. In the model, we connect underpinning aspects affected by NPIs, exploring the increased level of reconfigurability and modularization and their effects on economic sustainability. Ultimately, this will aid in enhancing resource allocation in the product realization processes by elucidating the interconnectedness among system components and enabling the assessment of systemic behaviors in the long-term.
Consequently, the research questions guiding our work are: How can we fairly assess the systemic perspective of introducing reconfigurable modularization in semi-automatic assembly systems, and what components and aspects can we relate to the economic rationale behind such an assessment?
By applying a system dynamics model, we differ from previous works by introducing scenario planning that considers the long-term effects through evaluating the identified dynamic dependencies across time. Moreover, building a simulation model enables the exploration of multiple scenarios and the adaptability of the system boundary in future research as knowledge grows. Our hypothesis to motivate this approach is based on our belief that decision-makers need tools to understand and motivate the value of reconfigurability in multiple scenarios. Therefore, we in this paper propose a conceptual system dynamics model that considers multiple NPIs and volume uncertainties to assess the justification of investments in reconfigurable modularization throughout the life cycle of a production system. First, we present the model using two scenarios, one implementing a dedicated production system design and the other a more modular design based on their changeability levels; see [13]. Adopting a dedicated mindset resembles “thinking one product project at a time” when defining the production system solutions, and adopting a modular mindset implies using “a cross-project approach” by assessing future unknowns in the planning phases leading to encompassing a wider range of modular solutions in the first place. After the presentation of the model, we assess multiple scenarios to study multiple NPIs and volume uncertainties for the given setting. First, the effects of varying the NPIs between 1 to 5 for 10 years are studied to illustrate the potential breakeven of how many NPIs are required for the modular approach to surpass the dedicated approach in economic sustainability performance. Second, the effects of varying the NPIs between 1 to 5 for 10 years and considering volume uncertainties for the respective NPIs are studied.
The paper’s structure is as follows: In the theoretical background, we provide the relevant background literature on concepts such as product platforming, reconfigurable manufacturing for sustainable production development, and recent findings within the economics of RMS. In the research approach and model building section, we outline the development of the economic rationale behind the conceptual system dynamics model. In the subsequent model description section, we present the simulation results for a dedicated and modular scenario using three NPIs. Thereafter, we assess experiments of introducing between 1 and 5 NPIs throughout the life cycle of the production system and present a combined volume uncertainty analysis using a sensitivity analysis. Finally, we discuss model limitations, practical applications, and future research.

2. Theoretical Background

In the context of integrated product and production development, the two most protruding concepts to reduce lead time and cost in product realization to meet the increased market demands are product platforms and concurrent engineering [20]. The synergetic use of integrating product platforms and concurrent engineering is often referred to as co-platforming [10]. The concept of product platforming encompasses product platforms, production platforms, and other platforms existing in the entire value chain [21]. Product platforming involves predefined platforms for both products [22,23] and production systems [24], enabling flexible instantiation through reconfiguration or new development [25]. By sharing components and sub-systems, the development time and the time-to-market can be reduced while minimizing disruptions encountered in the production system.
Research has extensively explored product platforms, modular architectures, and manufacturing adaptability [26]. Within these studies, scholars emphasize efficient production and the reuse of manufacturing processes and equipment across various product variants. Similarly, within manufacturing, there is a focus on changeable paradigms and reconfigurable systems to address diverse product ranges and market dynamics [27]. Production platforms, including increasing levels of modularity, play a crucial role in co-platforming by promoting asset reuse and guiding change management [28].
However, despite the theoretical groundwork, practical reports on using platforms in production system design and reconfiguration are limited [29]. Scholars have pointed out that the research often emphasizes conceptual aspects rather than practical implementations [10,27]. In production system design, modularity aims to support more rapid adaptations, allowing systems to adjust capacities for changing product demands involving minor adjustments, such as adding, removing, or upgrading modules [11]. There exist various models and methods for changeable and RMS [30], where these cover initiation, conceptual design, detailed design, implementation, and reconfiguration phases. However, they tend to focus on process structure rather than providing practical guidance. Moreover, with a few exceptions [13,31], the co-platforming literature primarily concentrates on greenfield development, neglecting the difficulties of implementing increased levels of modularization in the context of legacy work, providing less guidance while considering existing production systems [28].
Another area of great concern that complements the practical implementation of reconfigurability and modularization is the economics of RMS; see part VI in [32]. The limited recent research proposes using mathematical modeling to evaluate the economic sustainability of various technical solutions, such as line balancing techniques, to compare investment costs with a Monte Carlo simulation to test the solutions with different demand uncertainties [16], selecting reconfigurable machining tools when having opted for RMS using mixed integer linear programming [33]. Another common method is life cycle costing (LCC) methods combined with net present value (NPV) calculations to include various cost parameters and consider a more sustainable time horizon; see, e.g., integrating carbon credits in the LCC in SMEs [34]. In [6] they propose using a Digital Twin-based approach using a discrete-event simulation to evaluate productivity associated with reconfigurations.
Consequently, there is a need for a shift in manufacturing practices towards increased reconfigurability and easiness to adapt to future product needs. This is driven by the need for frequent NPIs, technological innovations, and sustainability requirements. However, there is yet more support needed to bridge the gap between theoretical frameworks and practical implementations. Bridging the gap is crucial for companies undergoing transformative change towards a more sustainable economic rationale. While short-term investments are deemed necessary for the next business case to industrialize the next product, it is critical to consider the potential long-term benefits for manufacturing organizations. This includes more sustainable resource allocation, downtime reduction, and enhanced production capacity, all of which are crucial factors in formulating their economic rationale to support strategic decision-making.

3. Research Method and Model Building

The research method adopted in our study was grounded in several foundational elements. We collaborated with four companies within the context of a multiple case study, where our primary objective was to investigate how production systems could be better prepared and adapted to the challenges posed by shorter product life cycles, increased levels of product mixes, and thereto uncertain production volumes. To address these objectives, we applied an interactive research approach [35] together with the company representatives. According to the interactive research approach, the knowledge creation is generated through both the research system and practice system, as depicted by the model in Figure 1.
First, our interactions toward the primary objective resulted in developing a support tool for mapping production capabilities, as reported in [13]. A distinctive feature of this practical support tool was its capacity to assess each production solution’s capabilities to evaluate the level of reconfigurability. Specifically, it enabled identifying changeability levels based on the system’s modularity, such as exchangeable grippers, adaptable fixtures, flexibility of transfer lines, etc. It allowed us to assess the ease or difficulty of adapting a production solution to new potential product features. The tool was considered useful to equip production engineers to proactively prepare for eventualities, such as uncertain volumes and unexpected product introductions. However, the details of the support tool are not in further focus of this reported study. The brief explanations above served to provide background to how knowledge was created during the complete study, resulting in the herein reported findings building upon previous work. Moreover, we describe below how the interactive research resulted in knowledge creation during the development of the support tool that was useful as a foundation for the presented study.
Hence, the empirical basis for this study was collected during a multiple case study conducted in two phases. It involved 2–3 representatives from each company, including production engineering managers, production engineers, and project managers. The first phase included 13 months with two of the companies to explore and create the support tool mentioned above. Subsequently, over the next 12 months, we tested the support tool’s applicability, including also the other two companies. In this process, we leveraged workshops [36] as a data collection technique in an interactive research approach as described above, totaling 54.25 h of interactive engagement. The workshops were multifaceted, encompassing activities varying across on-site factory visits, discussions regarding product requirements and the uncertainties associated with customer behaviors, thorough mapping of existing and conceptual production systems to craft foremost the support tool, and coaching to facilitate the progress of the companies in applying it.
All these workshops and interactive engagements provided a platform for in-depth discussions. These discussions provided valuable empirical findings, underpinning the model building of the system dynamics model proposed in this study. We, together with the research participants at the case companies, explored topics ranging from the cost implications of implementing modular solutions instead of specific and dedicated production solutions. This provided us with multiple considerations related to the economic rationale for justifying investment costs. Consequently, the complete research engagement within the research project provided us with invaluable insights into the challenges and consequences when it came to transitioning from a single-project focus to a sustainable, cross-project approach.
One of the most prominent challenges we encountered was the difficulty of justifying increased investments to achieve modular and adaptive solutions when they could not be motivated within the current project budget, even if the proposals could be identified to reduce costs in subsequent product projects. However, there were exceptions when these types of considerations could be bridged, and it was in “strategic projects” that the constraints of a specific product project budget could be lifted. It became evident in our discussions that such a shift in mindset to consider strategic investments within restricted project budgets required further materialization and understanding. Therefore, we collected these data to comprehend how the economic motivations could be structured and materialized using a system dynamics model where we wanted to study the potential effects using a sustainable time frame enough to support justifying increased investments.
To translate the principles underpinning the economic rationale of reconfigurability and modularization from a strategic perspective to support practical implementation, we developed a conceptual system dynamics model. It was derived from a synthesis of all the empirical data collected across the four cases throughout the study, as described above. The system dynamics modeling technique serves as a powerful tool for transforming our identified principles into equations using integrals and feedback loops, allowing for a transparent discussion of the assumptions made, identified input elements, and their structural dependencies [17].
The system boundary of the model is within a cross-project context. One important criterion was to encompass the flow of product development projects, resulting in NPIs, throughout ten years in the same production system. The designed model considered a single semi-automatic assembly system and its evolutionary path. Consequently, the model examined effects stemming from production development projects as a consequence of product introductions.
A limitation of the current model proposal was that resource allocation conflicts within the product realization process were not included. The model focused on quantifying the impacts resulting from adopting either a dedicated or modular mindset in production development, with a focus on subsequent capacity constraints in operations [37] and the resulting economic performance. Thus, at this stage, we do not yet consider potential dynamic dependencies emerging from a broader organizational perspective, such as prioritization of the engineering resources among portfolio projects [9].
In the studied empirical cases, a distinct pattern emerged: adhering to the prevailing single-project focus was often associated with a dedicated mindset in production development. This mindset tended to yield dedicated production solutions, which, in turn, presented challenges downstream in subsequent NPIs. As a result, our proposed model considered the implications of maintaining a single-project focus, represented by a dedicated mindset, versus embracing a cross-project approach, including a shift towards employing modularized and changeable solutions when deemed suitable to a larger degree.

4. Model Description

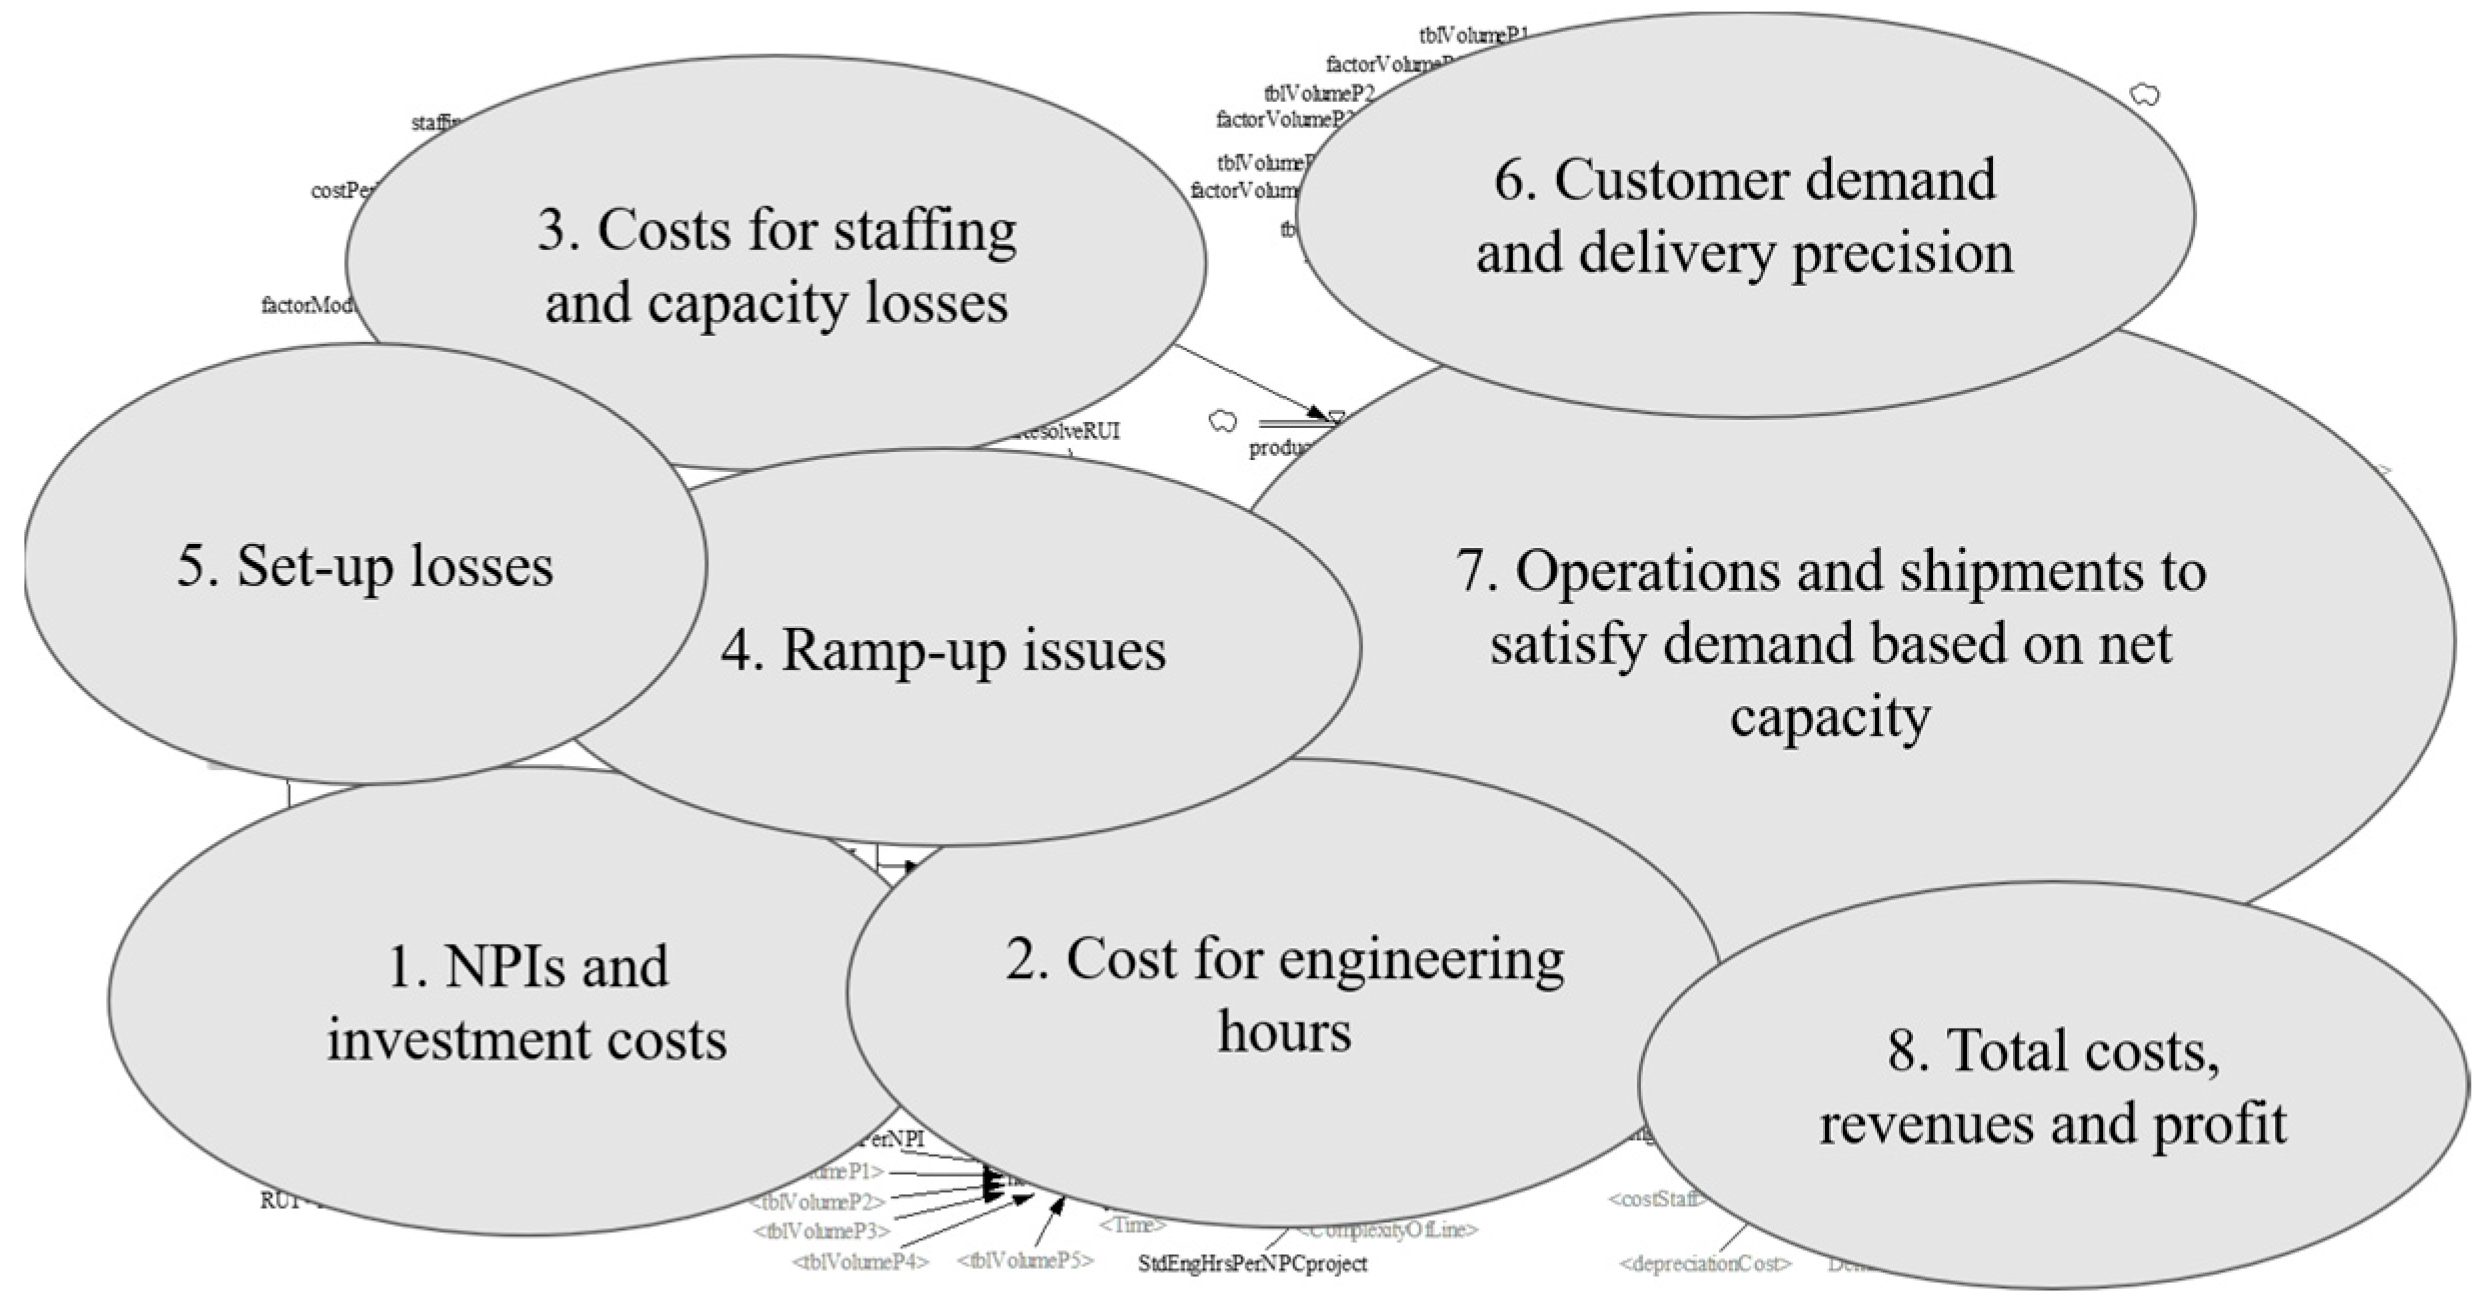
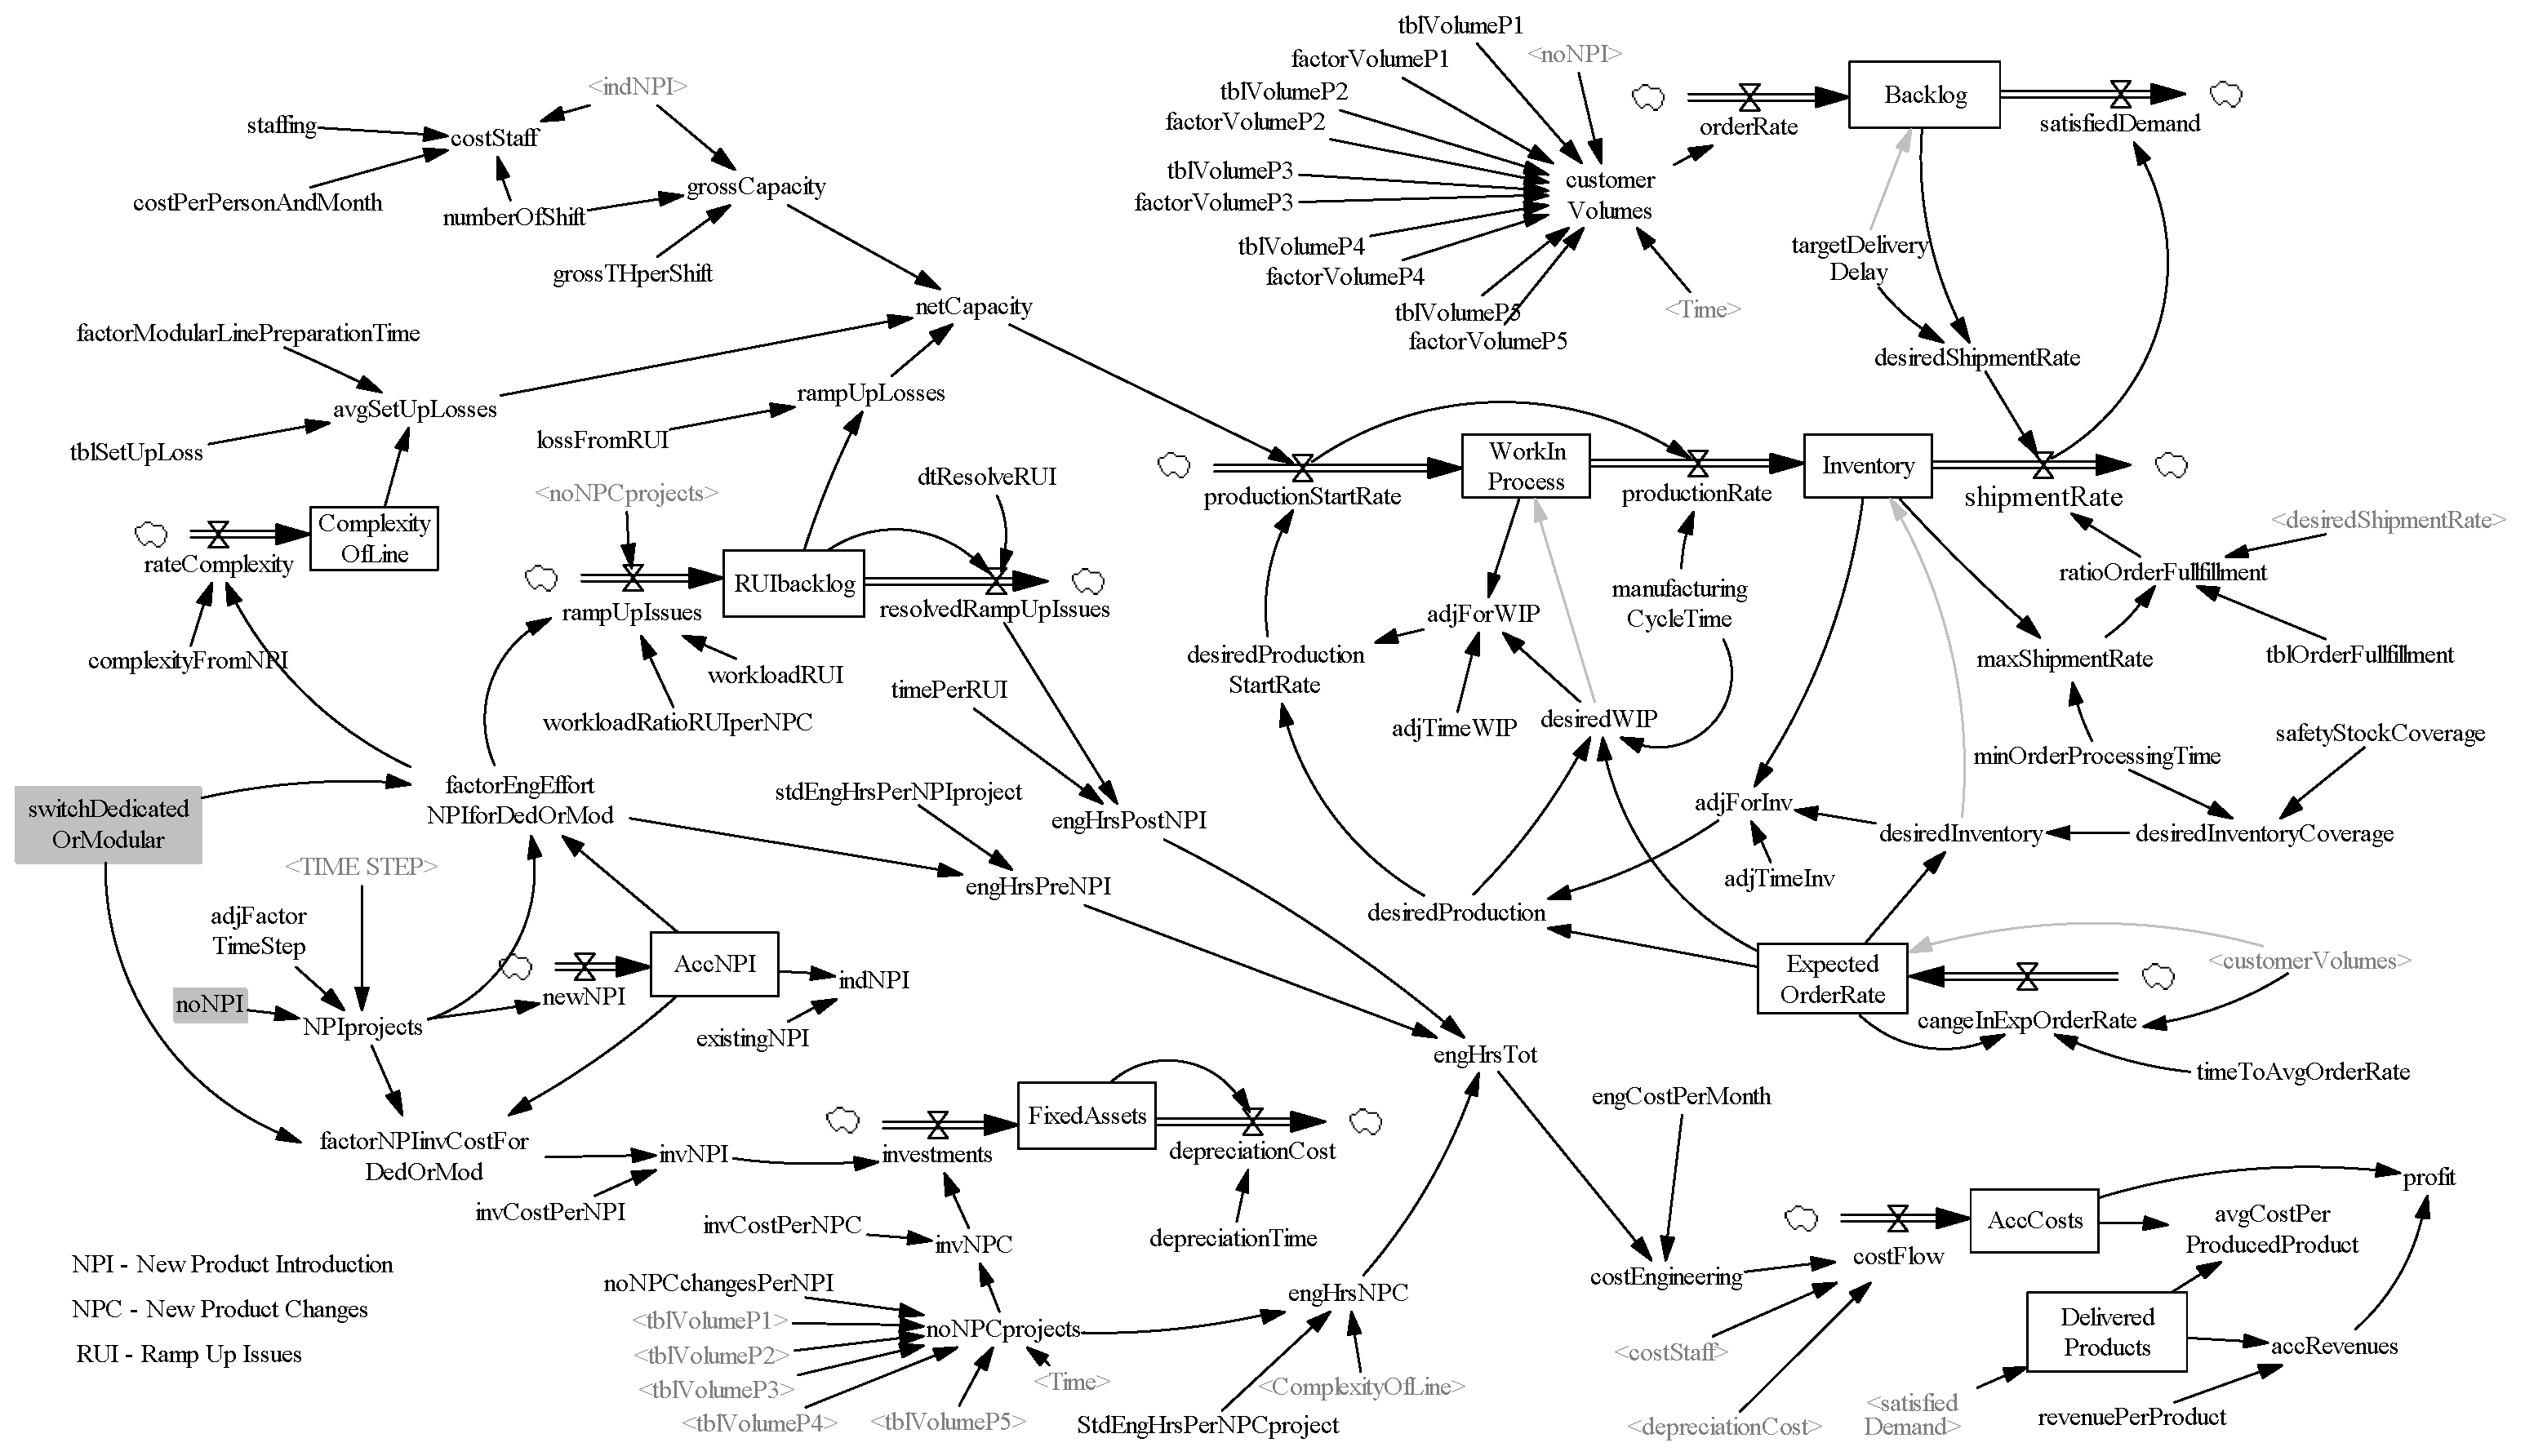
In the model description, we explain the main reasoning behind the model structure and equations divided into eight aspects. To make the presentation more graphical, it uses selected variables and simulated results from two scenarios. These represent a dedicated and modular approach where we introduce three products through the simulated time of ten years to enable a long-term analysis of their respective effects. In Figure 2, an overview of the eight aspects placed over the model layout is presented to help navigate the detailed model fully depicted in Figure 3. In the presentation, we focus on providing the main reasoning, and all equations for the variables are found in Appendix A. For an even more detailed review of model equations and system responses to various experiments, we refer to the Vensim model provided as a Supplementary Materials. We recommend using Figure 2 and Figure 3 together to more easily follow the model description. Also, needless to say, values presented in this conceptual model are generic and not from any of the specific cases and should be modified for each unique setting and application case.
The presentation of the model is supported using the simulation results, where we explain the base settings using two scenarios with the same starting conditions. The starting position represents an archetypical case company with a governing “dedicated mindset” in the context of developing a semi-automatic assembly system. A dedicated mindset implies a strong budget focus with a solution-oriented mindset towards solving the emergent need from the current NPI and its consequences for the specifications of the planned to-be-developed production system. Nonetheless, due to changing market dynamics, this dedicated approach may fall short, and a modular mindset may be more appropriate. This type of context is archetypical for the involved case companies and aligns with the global emerging challenges of shorter product life cycles, increased product mixes, and uncertain production volumes.
The story and narrative for the fictive archetypical case company used to present the model are the following. An assembly line was planned for one product (new product introduction—NPI) and expected updates (new product changes—NPC) during the product life cycle. However, in this case, shortly after the first product was launched and operations were up and running, the expected customer volumes were absent. To fix the problem of having an investment that is not paying off, another product had to be produced in the assembly line to make the investment profitable. However, yet again, the second product did not reach the expected sales volumes, and even a third product had to be incorporated into the assembly line. Now, all three products, with their rather extensive differences, would need to be interchangeably produced. In the case of the dedicated design, considerable investments in costly modifications were required for each NPI to compensate for the neglected flexibility using a “dedicated mindset”, and the NPCs were more complicated to introduce in the integrated design. The NPIs affected the specific production solutions, which was a result of the lowest investment and most limited solution space in mind when identifying their designs, which had to be changed. While this dedicated scenario follows a traditional sequential path of designing one specific production system solution per NPI, following a modular approach would have worked differently. In contrast, the modular scenario begins with investing more engineering hours in the conceptual phase to identify a production system design for the assembly line. This approach entails incorporating a higher degree of reconfigurable solutions with increased modularity and flexibility built in from the outset of each NPI project. As a consequence, several positive features may be created but at the cost of increased initial investments. It is the assessment of these tradeoffs, between short-term gains or costs and their long-term consequences, that is provided through the subsequent presentation of the two possible base scenarios for the archetypical case company.
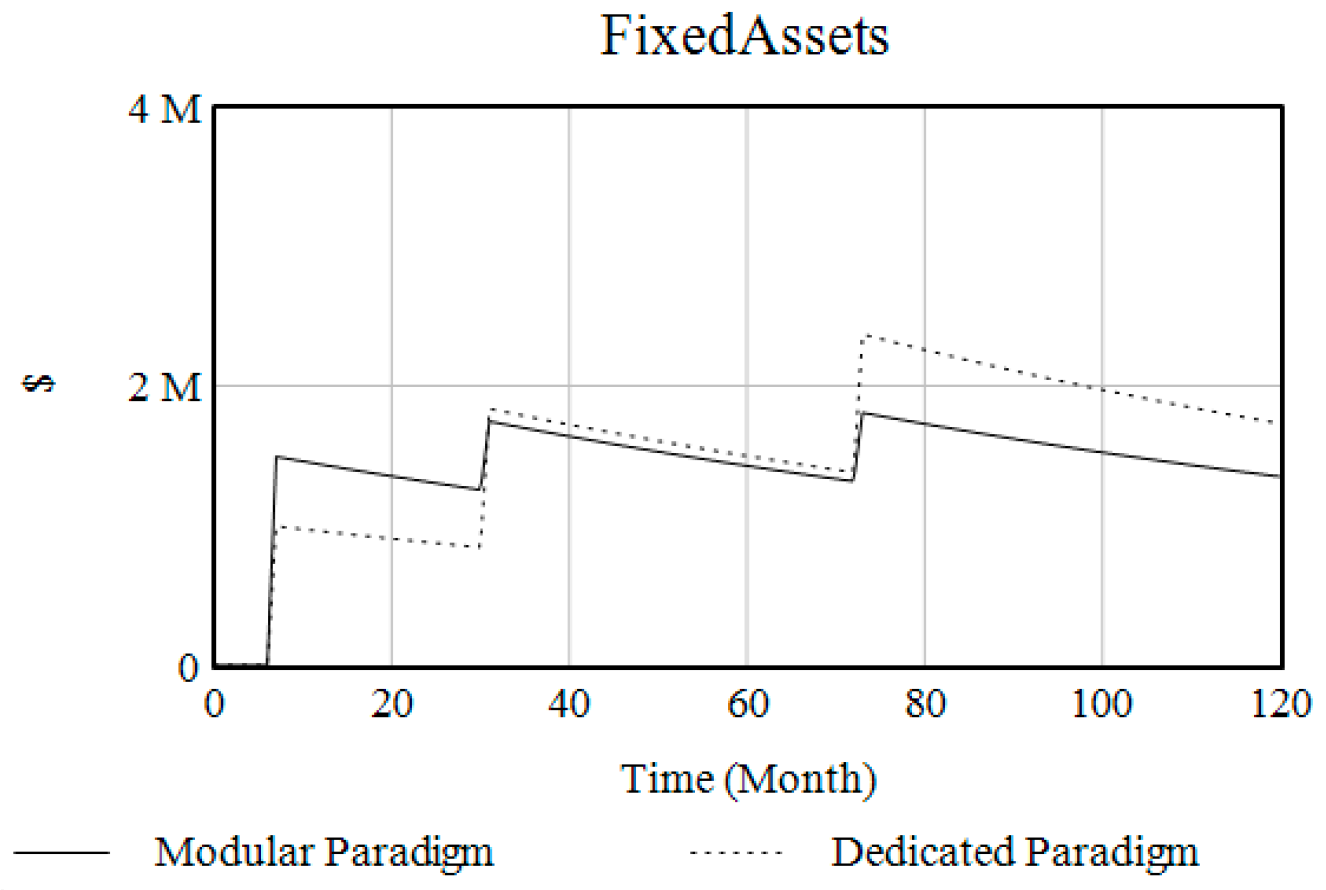
1. NPIs and investment costs. New product introduction projects (NPIs) and new product changes (NPCs) are introduced to the model within this aspect. Each NPI generates modification costs (invNPI), and together with a rate of NPCs (invNPC), these costs total the rate of investments. In the illustrations, three NPIs are introduced, one at 6 months, the second at 30 months, and the third at 70 months, accumulating in the stock AccNPI. For each NPI, four NPCs are introduced per year in both scenarios. To calculate the investment costs for NPIs, a factor is defined to distinguish the dedicated scenario from the modular one; see Figure 4. The factors imply the dedicated approach is neutral (factor = 1), meaning each investment follows a neutral approach, while for the modular approach, the first investment requires a factor equal to 1.5 of the dedicated and thereafter 0.5. Subsequently, this factor impacts the size of the investment costs in a similar pattern and accumulates into the FixedAssets stock, depicted in Figure 5. From the FixedAssets, the depreciation costs are calculated, depleting the asset value.
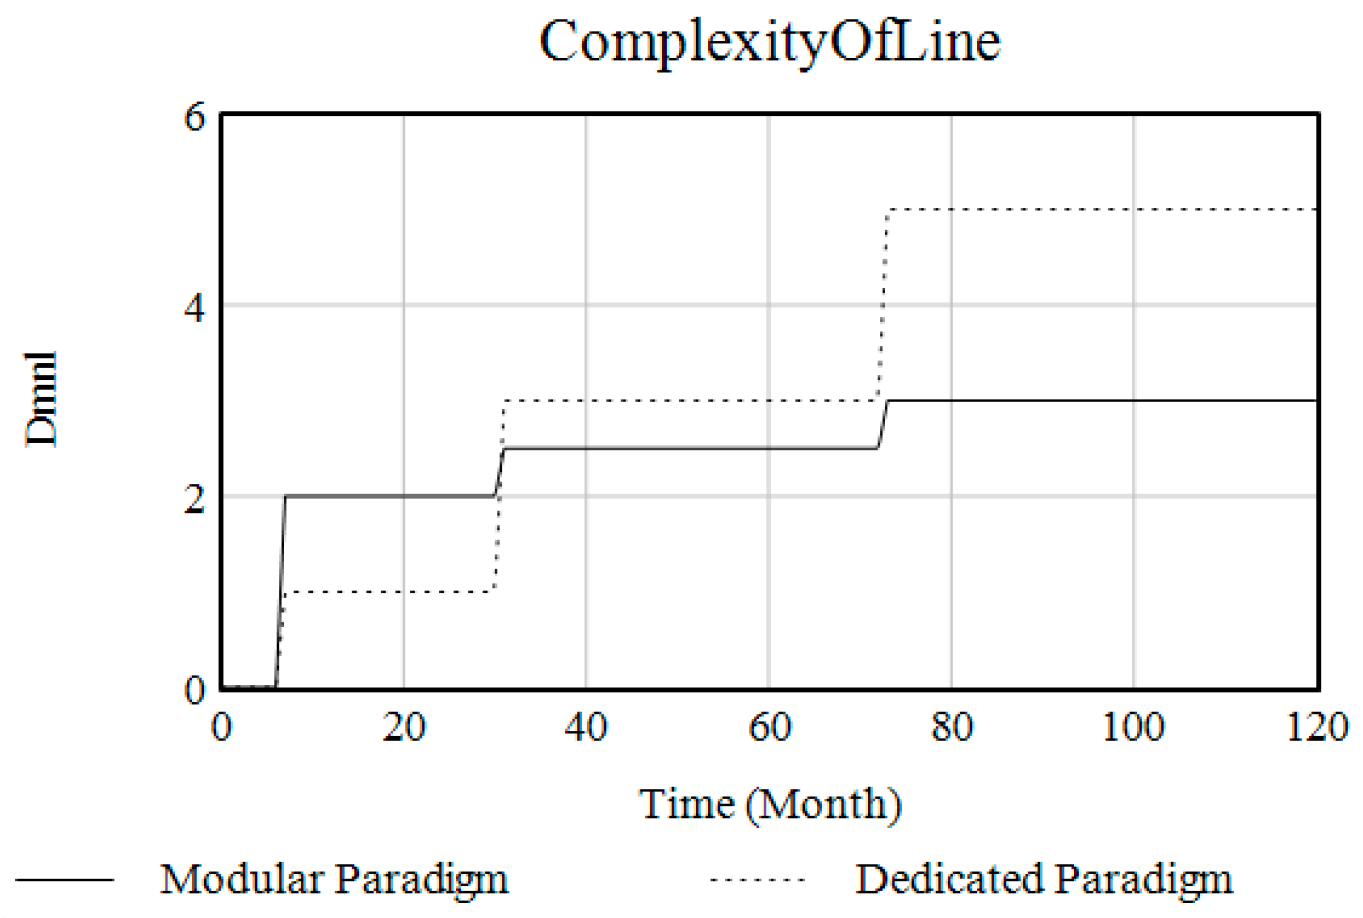
2. Cost for engineering hours. The associated engineering hours as an implication of the amount of work required to realize either a dedicated or modular production system is considered within this aspect. It captures the engineering hours needed before, during, and after the start of production and calculates the total engineering costs. To estimate the required engineering hours, in the variable engHrsPreNPI, for preparing either a dedicated or modular production system, we introduced effort factors. These factors are following the reasoning found in Table 1. On the one hand, preparing a dedicated solution is neutral for the first product P1, while for P2 and P3, twice the time is required due to major refitting needs to accommodate the new product features (because previous solutions were dedicated to P1). On the other hand, the modular solution has an initial effort factor of 2 to indicate the time required to prepare for a modular solution to realize P1. This represents the required engineering efforts to ensure well-thought solutions, while for P2 and P3, the effort is halved due to more flexible and adaptable production system solutions.
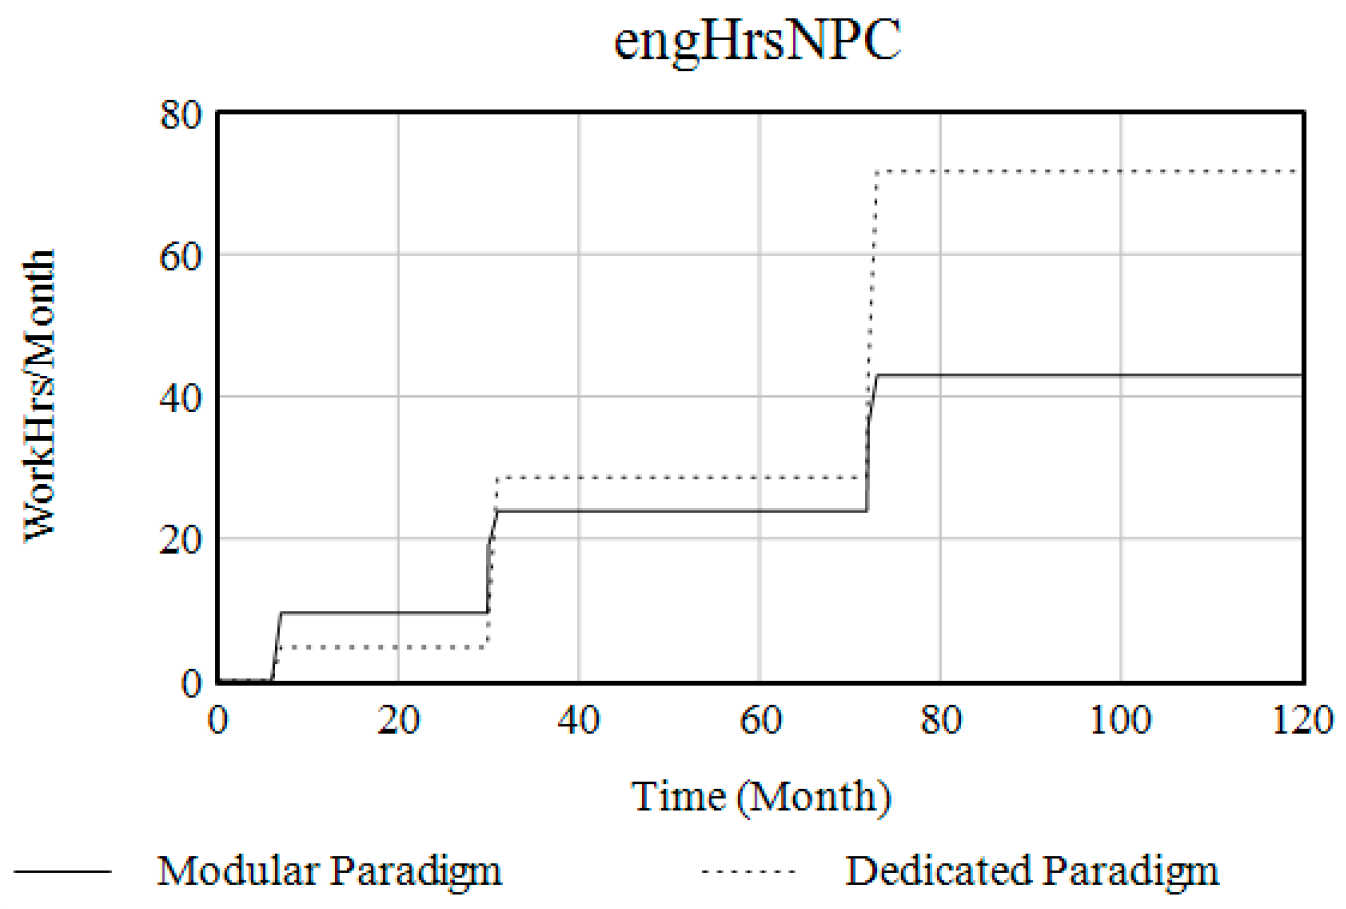
Furthermore, the effort factor accumulates into the ComplexityOfLine variable, depicted in Figure 6. As can be seen, the dedicated solution has an index that is lower at first and drastically increases per NPI. Since a dedicated solution is characterized by having only one purpose, therefore, each NPI thereafter creates a more complex modification. In comparison to the modular solution, which is more complex in the offset, it adds less complexity per NPI due to being more adaptable and resilient to changes. These characteristics of the underpinning line complexity impact in a similar pattern the engineering hours required for NPCs by multiplying the ComplexityOfLine with noNPCprojects and the standard engineering hours per NPC project (StdEngHrsPerNPCproject), as graphically depicted in Figure 7.
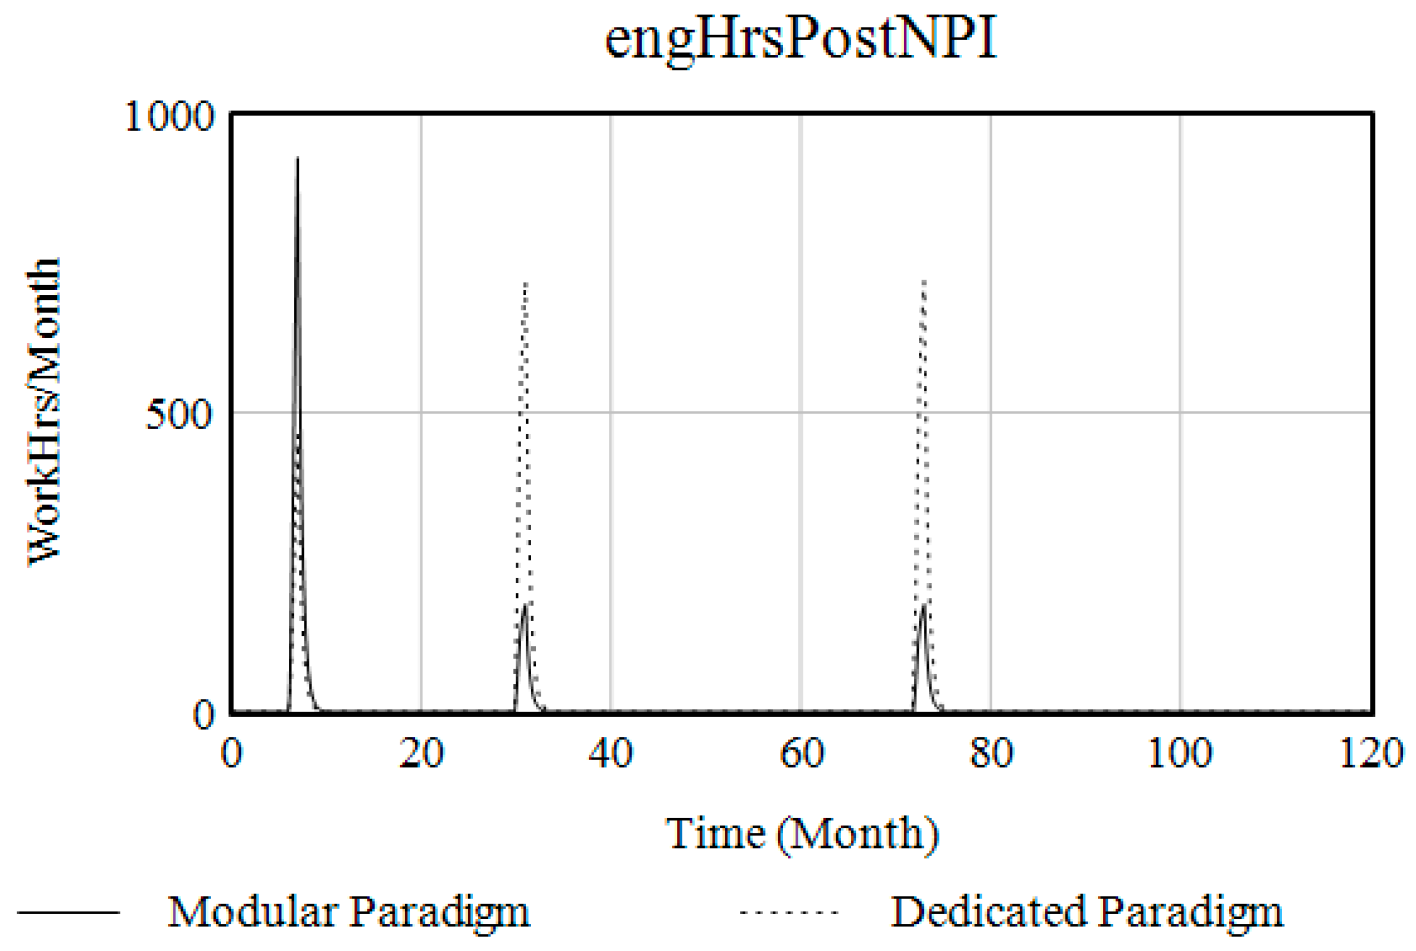
The remaining engineering hours included in the model are generated from resolving ramp-up issues (RUIs) after the start of production (see Figure 8) and are further explained in aspect 4 below. Additionally, Figure 9 illustrates the resulting rates of the total costs for engineering hours for the dedicated and modular solutions.
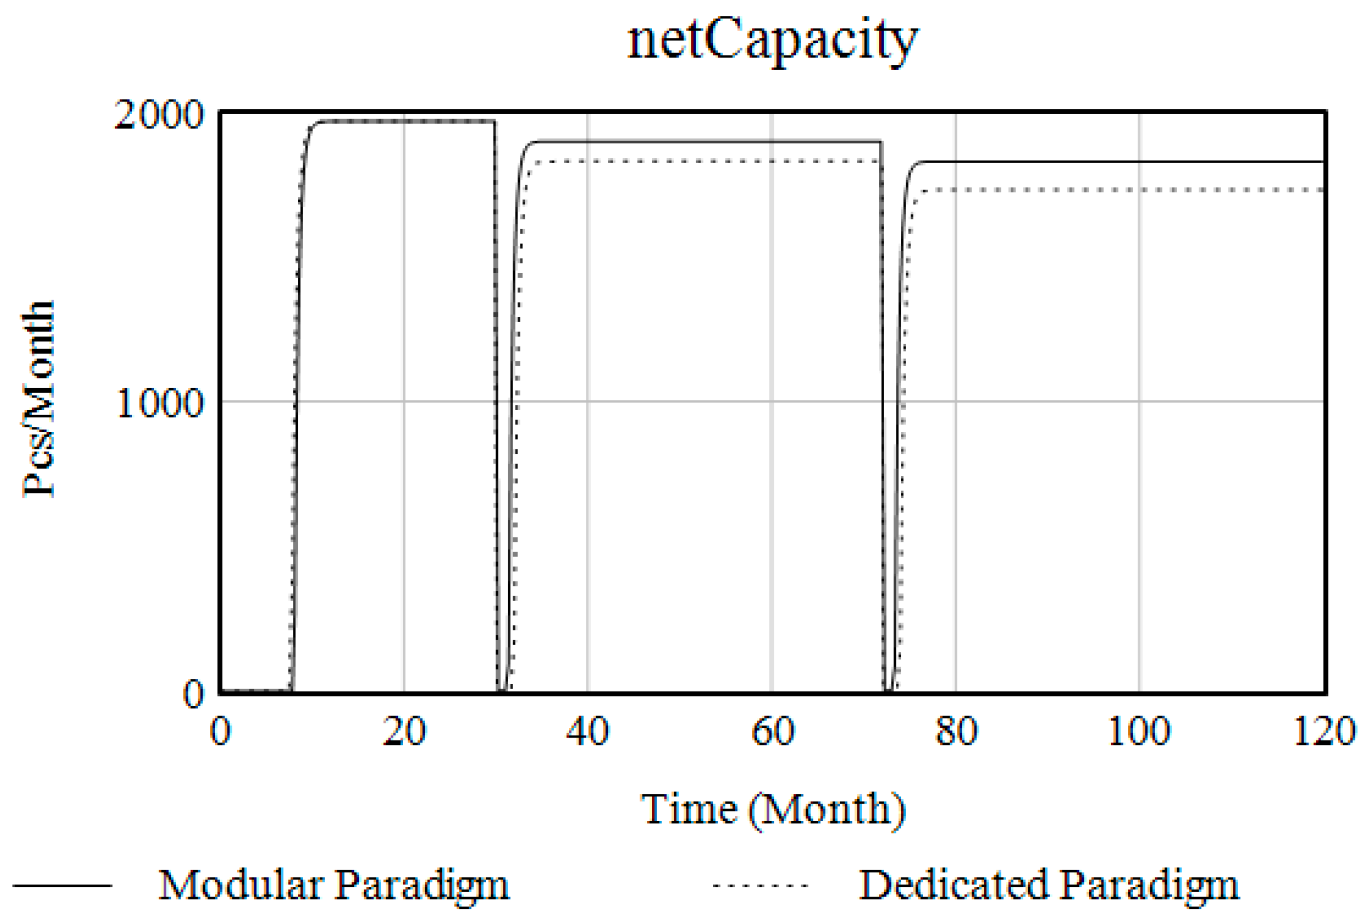
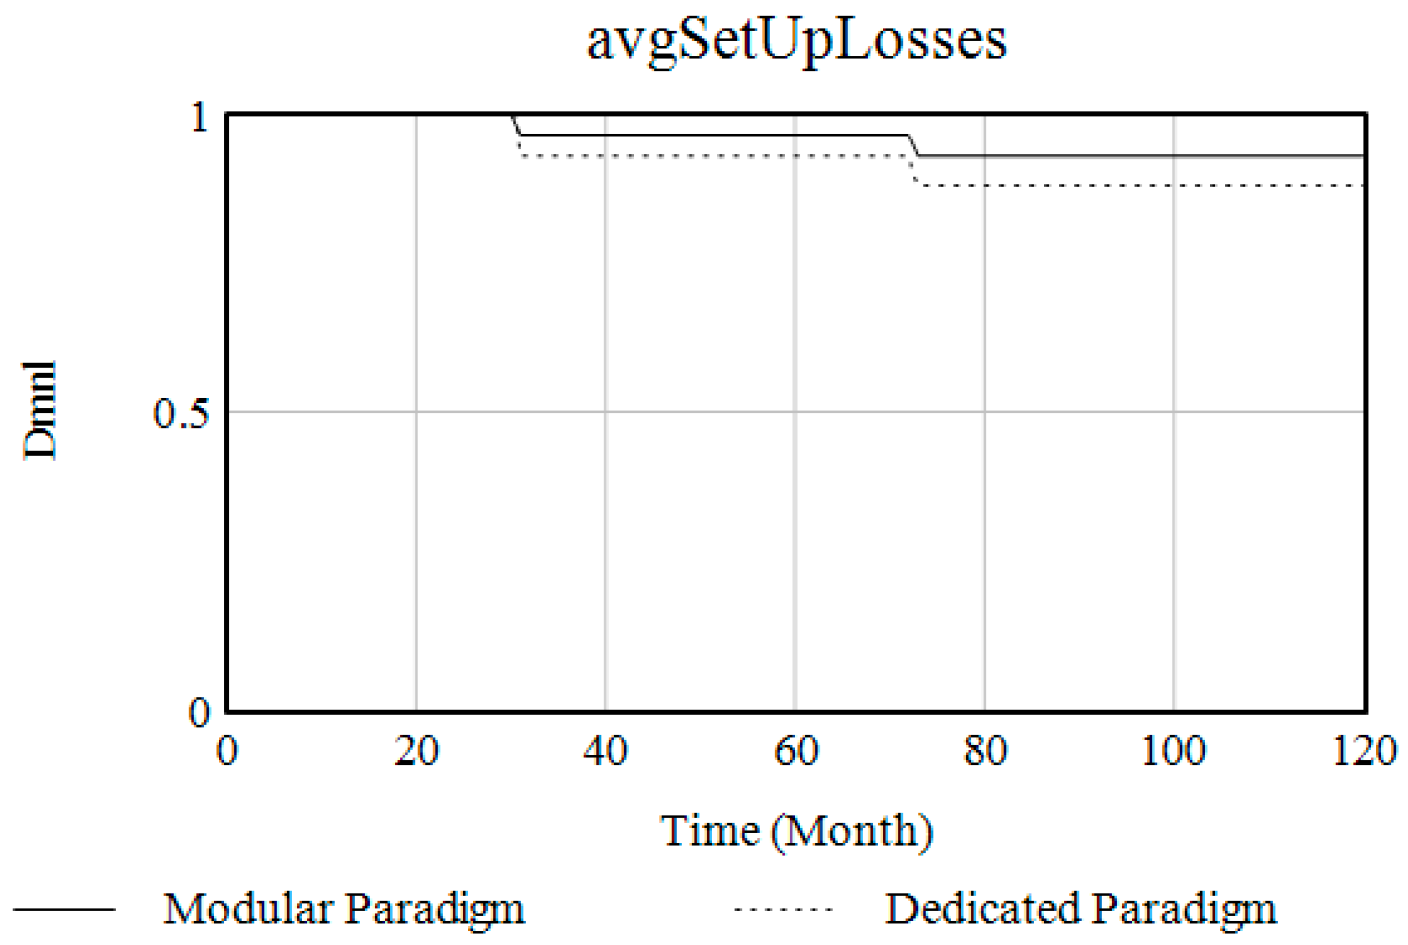
3. Costs for staffing and capacity losses. Within this aspect, the gross cost of staffing and resulting production system net capacity after considering capacity losses are defined. For simplicity reasons, our example uses a gross capacity with the same throughput for all NPIs (where it could be considered that the various products also have different throughput values). This implies that when having only one NPI in the first years, the gross capacity equals the net capacity because there are no changeovers between products. Hence, the net capacity is reduced by the avgSetUpLosses for each NPI; see after the second NPI in Figure 10. The net capacity is also reduced by temporal ramp-up issues (RUIs), which are represented by the temporal dips in netCapacity. The rampUpIssues in need of being resolved are depicted in Figure 11 and are described in the next aspect. From the graphs, we see the dedicated paradigm suffers more from capacity losses than the modular due to a more complex design causing more troublesome setups. In this way, the implications to production can be quantified (see later in aspect 7), including related staffing cost losses summed in aspect 8.
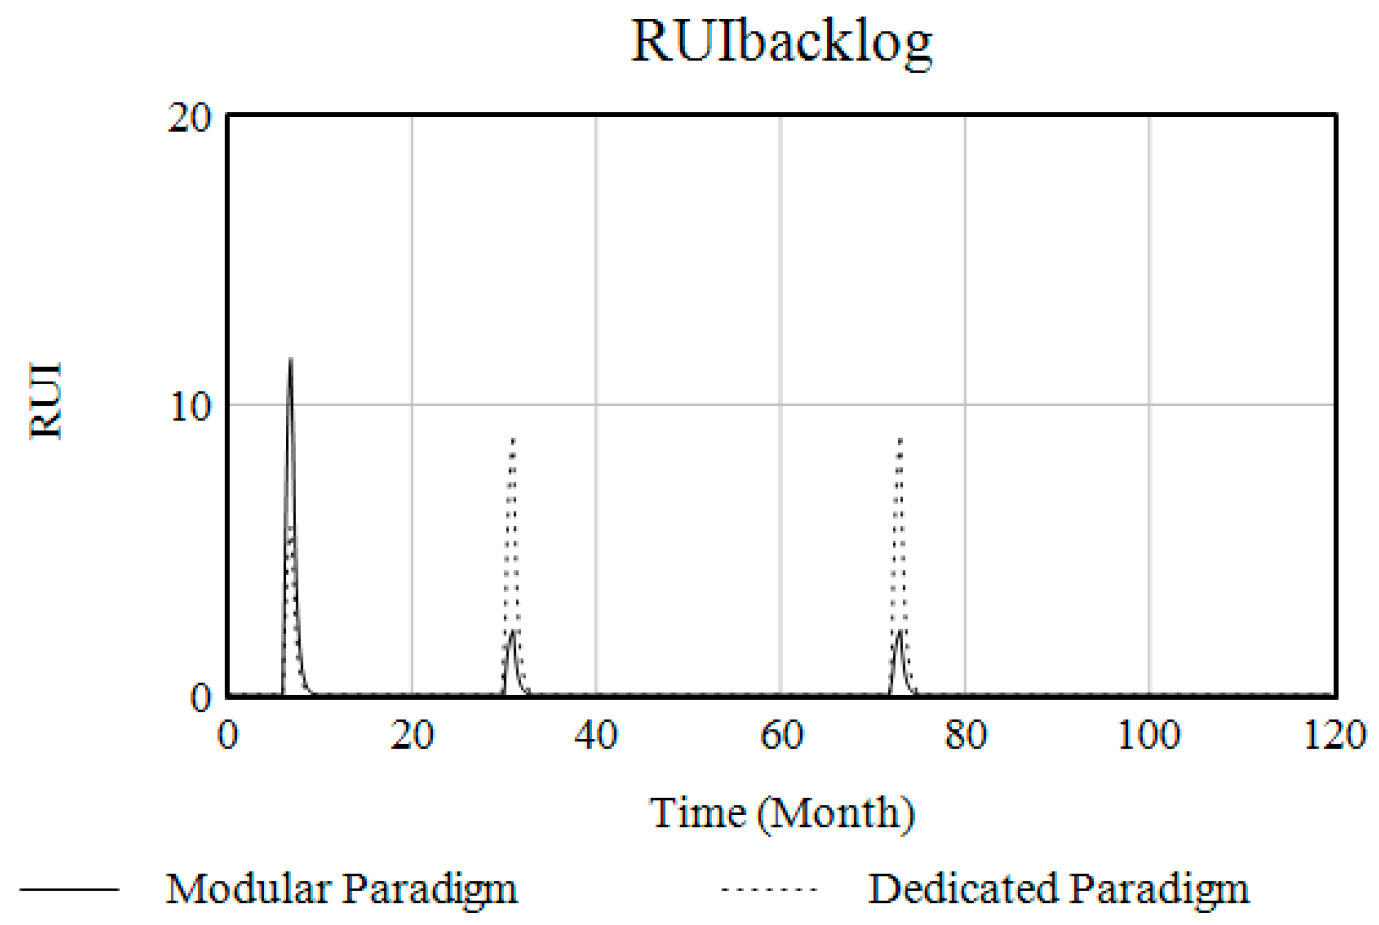
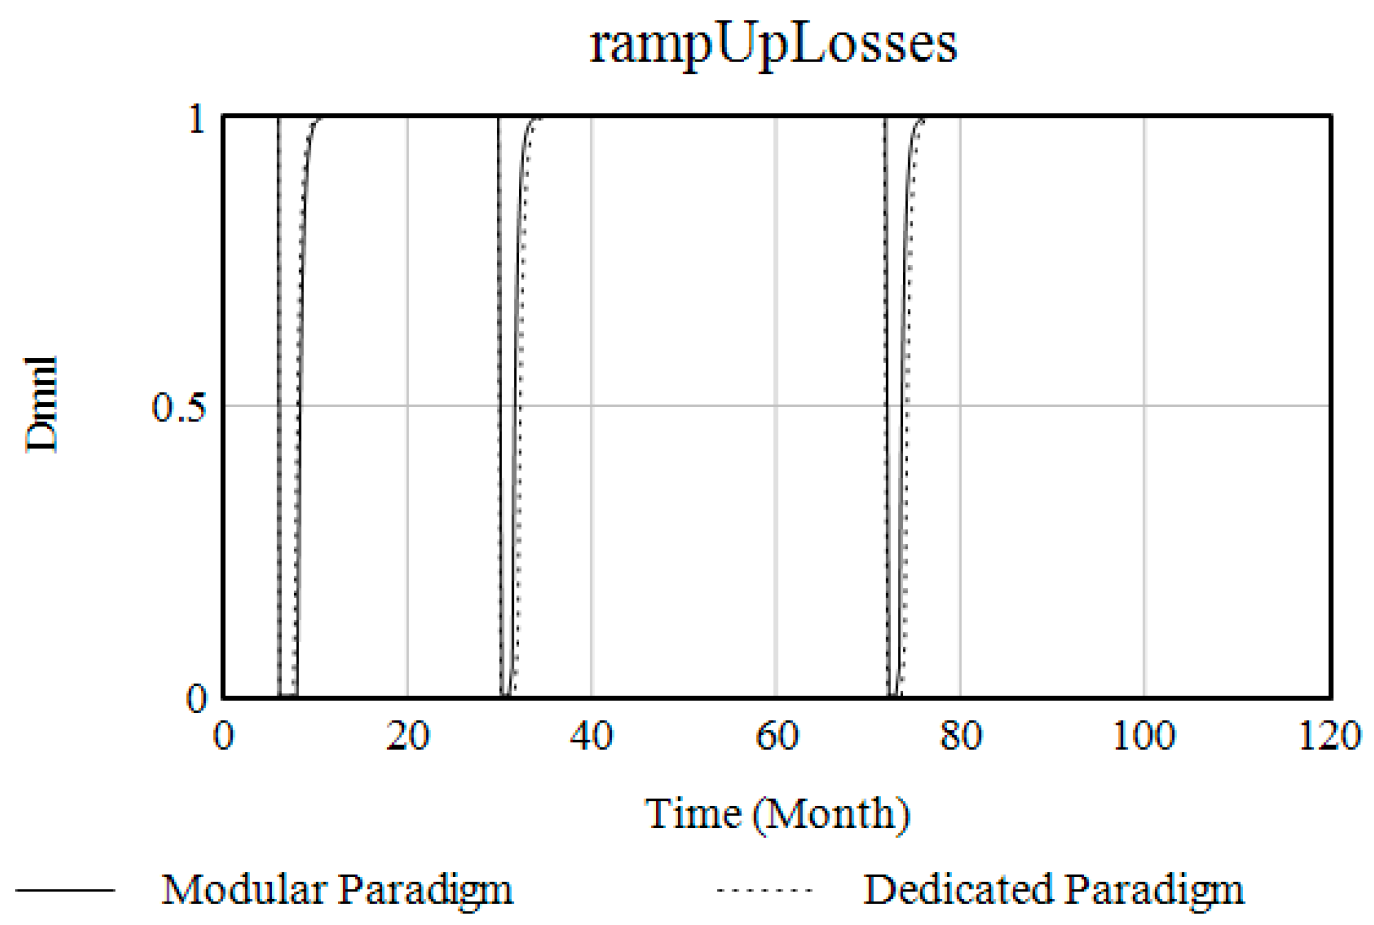
4. Ramp-up issues. Within this aspect, the effects of RUIs on capacity and engineering hours are considered to distinguish between dedicated or modular solutions. Here, the extent to which adhering to a dedicated or modular mindset requires more or less rework in integrated product and production development within the product realization processes is quantified. There are two sources of RUIs, those generated from NPIs and those from NPCs. In the model, the RUIs are considered strongly related to the variable ComplexityOfLine; thus, the effort factor described above in Table 1 is also applied to generate RUIs from NPIs. As depicted by Figure 11, the workload generated by RUIs in the modular scenario is twice as large for the first NPI compared to the dedicated scenario but is only one-fourth in the two subsequent NPIs. These RUIs flow into and accumulate in the stock RUIbacklog, depicted in Figure 12, simultaneously being reduced by the flow of resolved RUIs. Solving RUIs generates the post-NPI engineering hours (engHrsPostNPI) from reworking RUIs, depicted in Figure 8. This stock-and-flow structure for RUIs enables us to quantify the creation of RUIs and their resulting rework losses as a consequence of the time invested in the conceptual phase of designing the production solutions. Resolving these RUIs temporarily impacts the gross capacity, depicted in Figure 13, which also impacts operations, in aspect 6 and subsequently the delivery performance to the customers in aspect 7 and economic returns from the investment in aspect 8.
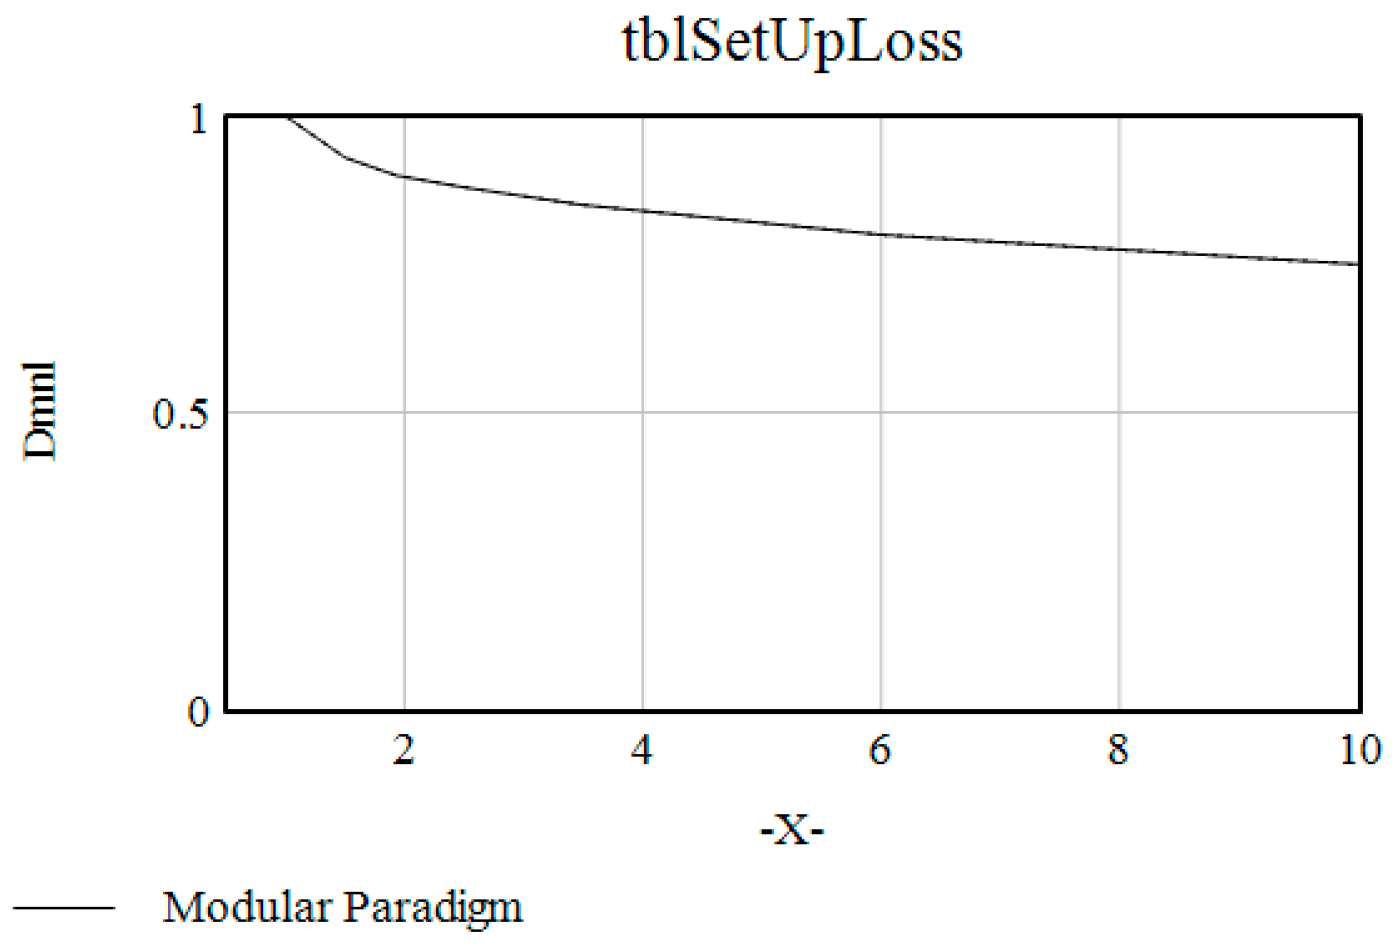
5. Set up losses. To quantify the average set-up losses (avgSetUpLosses), this aspect applies a table function, depicted in Figure 14 with its distinct values found in Appendix A. Together with the variable ComplexityOfLine, depicted in Figure 6, the average setup losses, depicted in Figure 15, are calculated. For both the dedicated and modular solutions, having one NPI provides zero set-up losses. However, in a dedicated scenario, more specific and dedicated solutions lead to more substantial set-up losses when introducing another product, while for the scenario of a modular solution, the implications tend to be less severe due to increased adaptive capabilities due to more reconfigurable and modular solutions. Using the model in an applied scenario, one needs to calibrate the estimated complexity to do changeovers based on evaluating the performance of the specific dedicated or modular solutions that are identified to guide the detailed selection. Moreover, one must determine how adjustments to the table function in Figure 14 configure the relationship between the number of concurrently produced items and the estimated complexity index.
6. Customer demand and delivery precision. Within this aspect, the respective product can be represented, and the uncertainty of expected production volumes can be explored. In our illustration, this is depicted by the graph summarizing all three product volumes, found in Figure 16, and by the sensitivity analysis exemplified by Figure 17. A sensitivity test of the volumes can be used to explore the combined uncertainty effects throughout vital model parameters, later illustrated by the experiments in the next section.
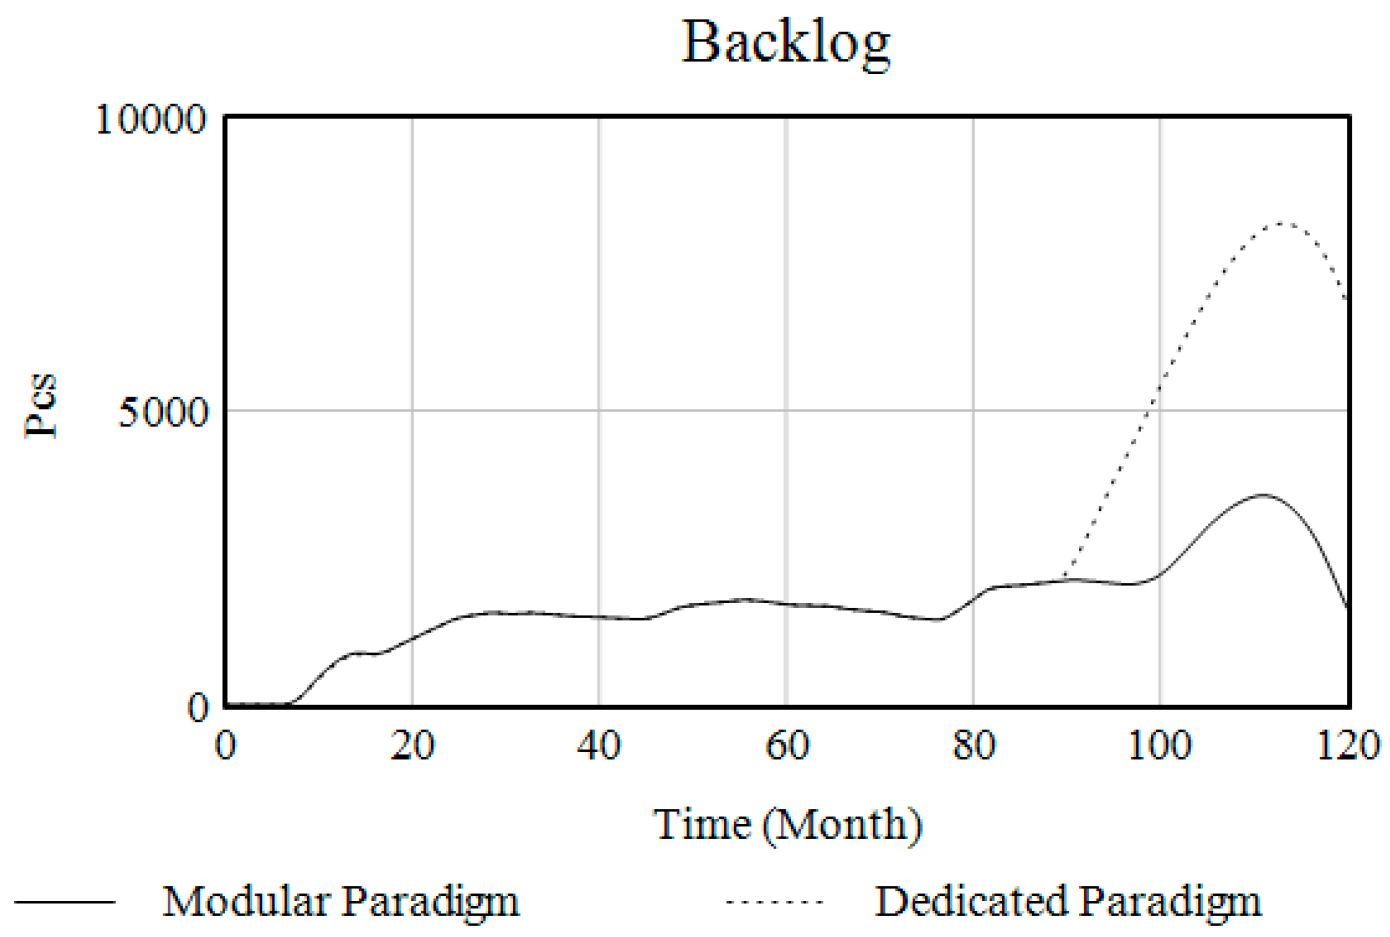
7. Operations and shipments to satisfy demand based on net capacity. This aspect includes an operations module, adopted from a supply chain model in [15], that transforms the customer backlog into shipments. In our case, the major constraint is the netCcapacity defined by the selected approach described above (dedicated or modular) that is affecting the resulting planning and manufacturing cycle time delays. Applying the simulation enables studying the period of interest to evaluate the operational implications from either dedicated or modular designs to the resulting delivery performance. In our model, we consider the life cycle of the production system, enabling studying the effects over the considered product generations. The operations and shipments aspect, consequently function to evaluate how the customer demand is satisfied or not. It can be noticed that the dedicated solution results in a backlog, see Figure 18, due to the lower net capacity discussed above. The output from operations aligns with the satisfiedDemand, depicted in Figure 19. It reveals that the dedicated solution falls short of meeting the customer demand in this illustrative case. Using the model in an applied scenario, one can explore how overtime, in aspect 3, can compensate to meet customer demand. However, automated overtime adjustments to compensate for insufficient net capacity are not yet included in the proposed model, indicating a useful extension for assessing extra overtime costs to compensate for the restricted capacity and attached losses.
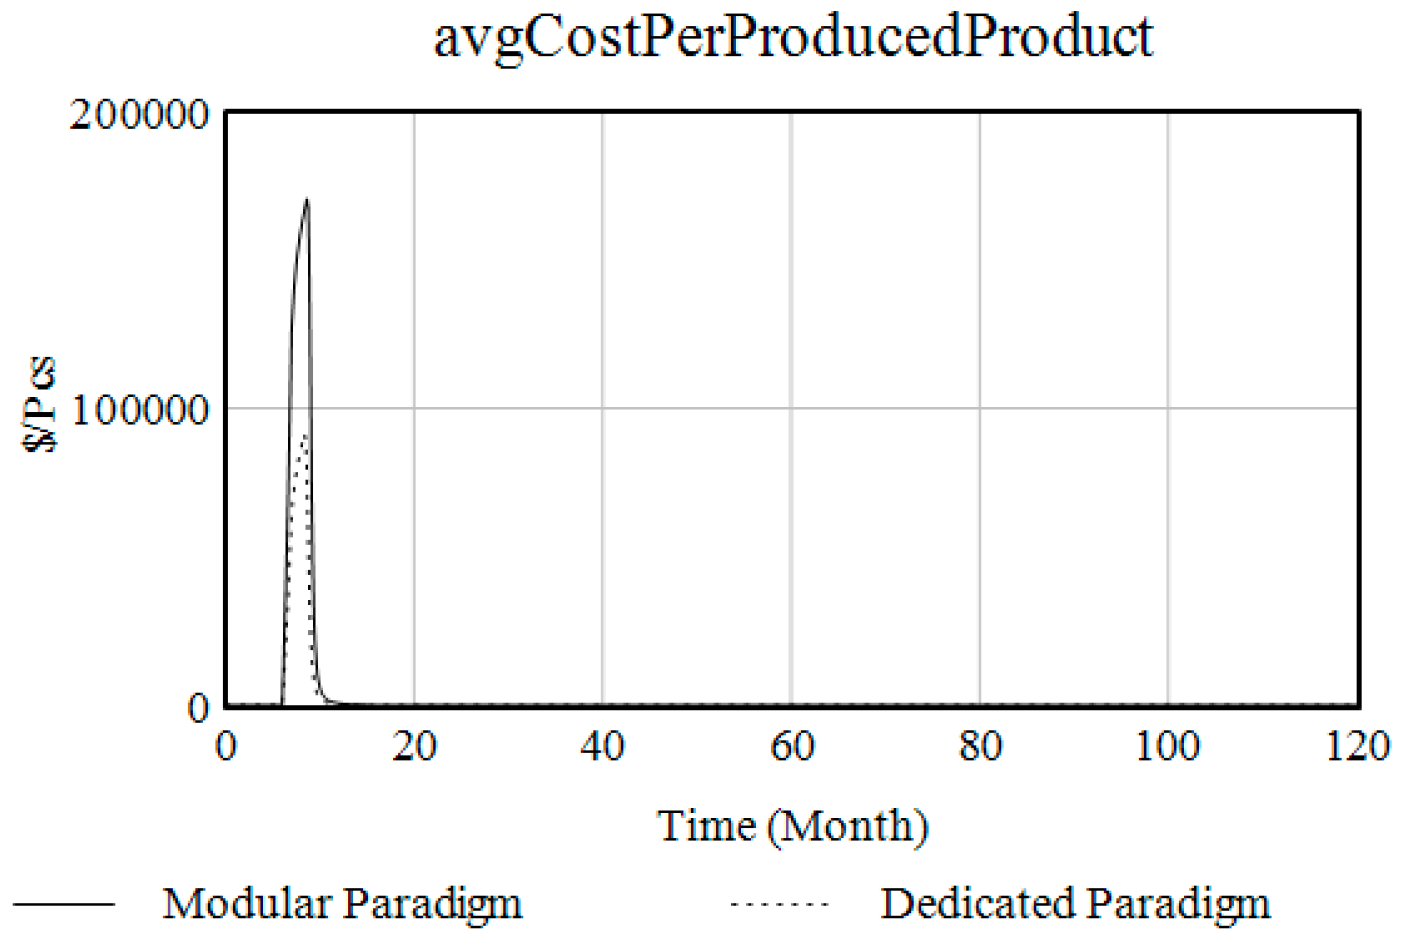
8. Total costs, revenues and profit. Within this final aspect, we accumulate all the cost flows, from engineering hours, staffing, and depreciations, to differentiate the performance of the two scenarios. To measure the overall performance in our example, we observe the differences in profit, depicted in Figure 20. It is noticed that the modular solution initially incurs higher costs during the first NPI, but by the second NPI, both scenarios show comparable profits. By the third NPI, our illustrative case demonstrates higher profitability for the modular approach. These distinctions can partly be traced back to the reduced net capacity, as discussed earlier and illustrated in Figure 18 and Figure 19. Additionally, the average cost per produced product is also noteworthy, as illustrated in Figure 21. Where we find the modular paradigm incurring a higher initial cost and upon closer examination, we observe that it takes until the second NPI in this example for the cost per product to parity. Specifically, just after 57 months, the smoothed cost per product for the modular solution becomes lower than that of the dedicated solution.

5. Experiments

In the experiment section, we assess how the model responses vary to the number of 1 to 5 NPIs and are also considering volume uncertainties for the two respective paradigms of dedicated and modular approaches.
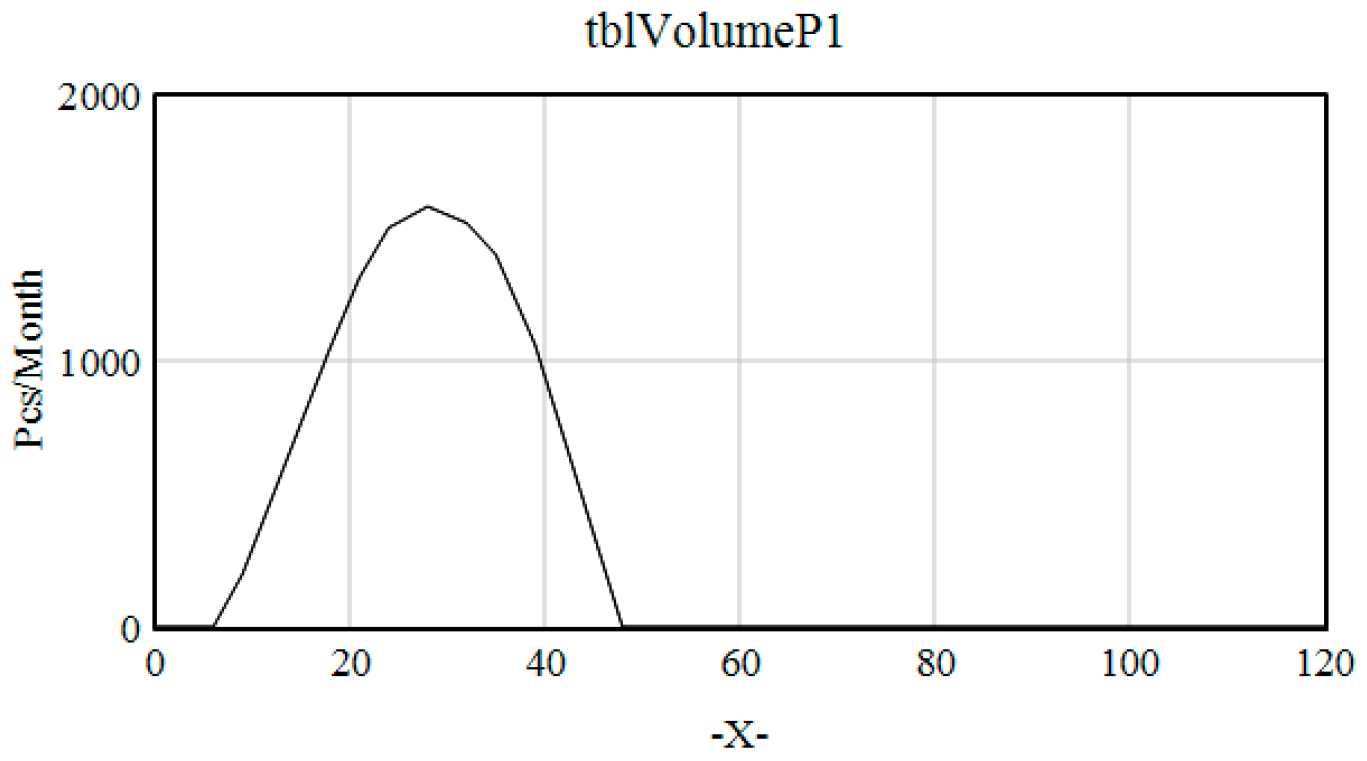
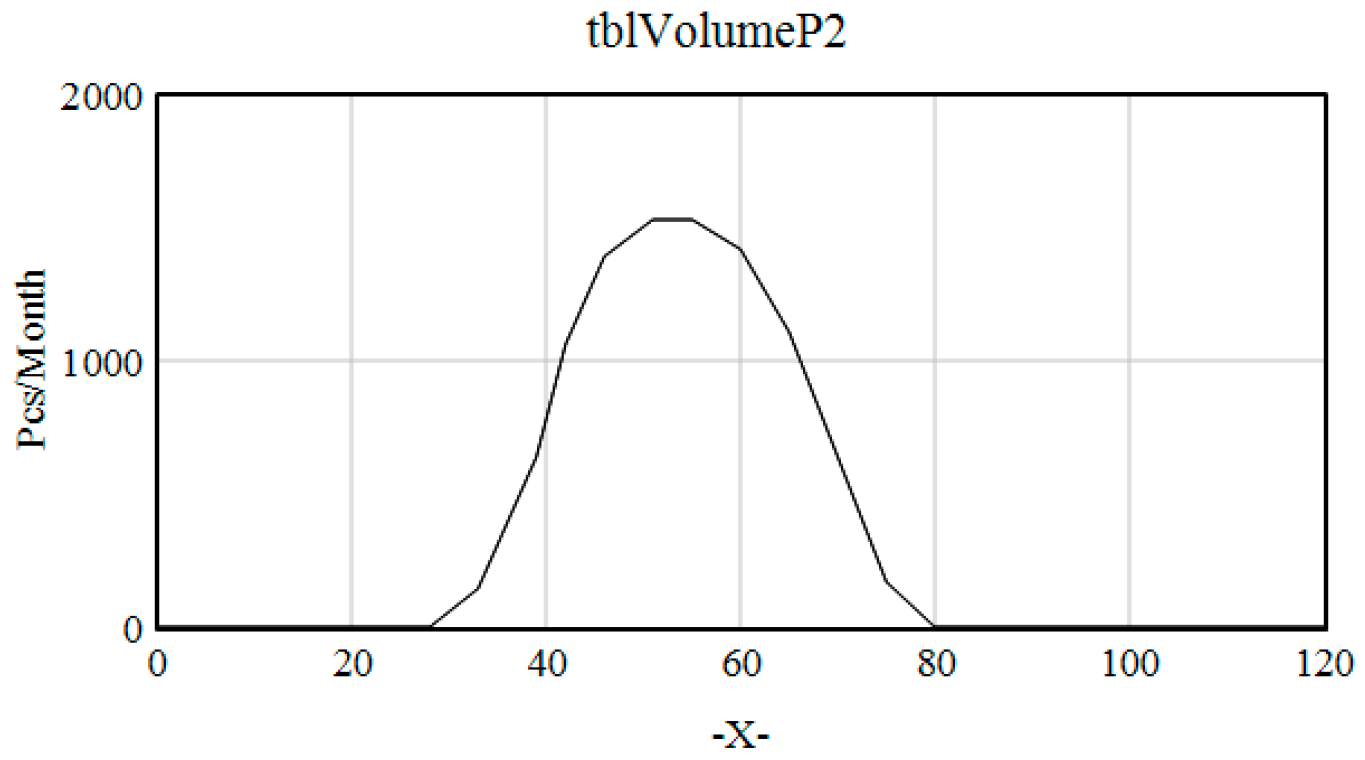
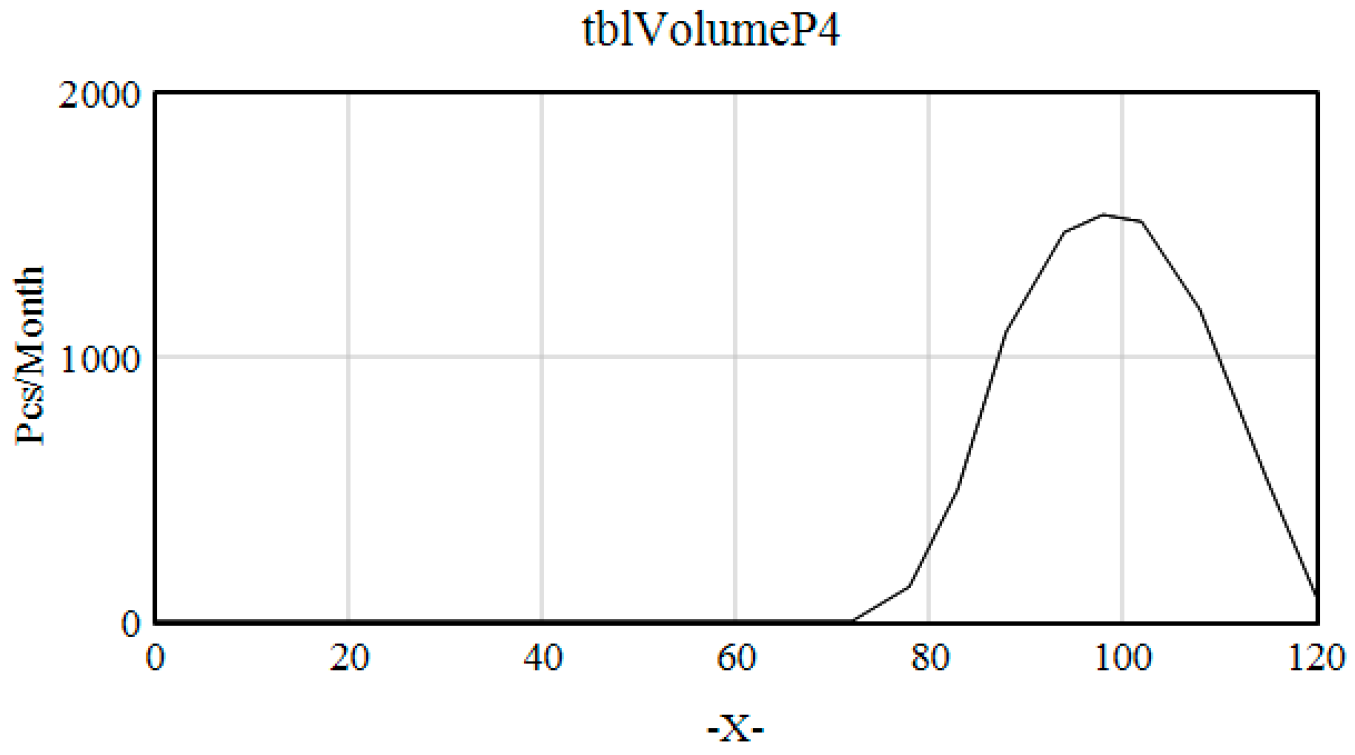
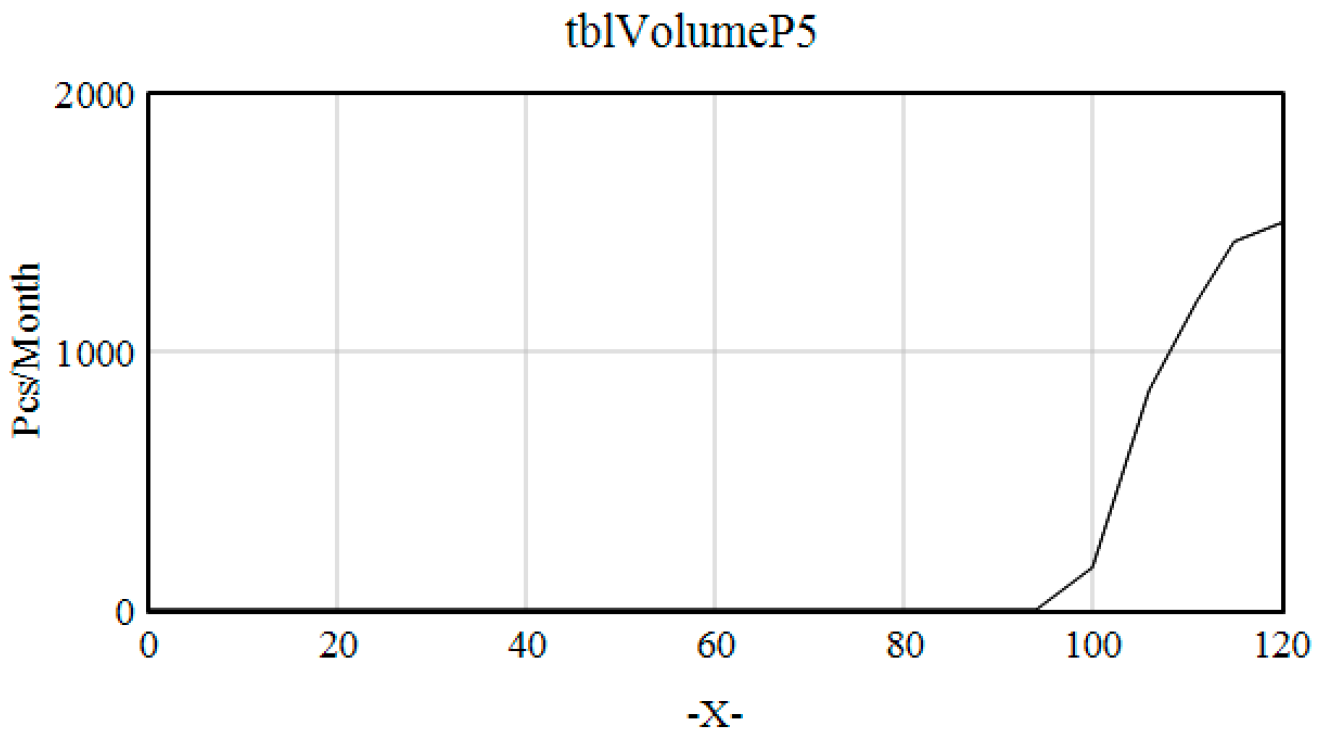
First, for each simulation run, see the first column in the plan of experiments in Table 2; we define the standard volume per product P1 to P5. The specific product volume for each product P1 to P5 follows the table functions graphically depicted in Figure 22, Figure 23, Figure 24, Figure 25 and Figure 26, also specified in Appendix A. Depending on the number of NPIs (noNPI in column two) during the simulated time, this activates the applicable tblVolumePη according to column three in Table 2. The noNPI also sets the corresponding NPIprojects and noNPCprojects, following the introduction schedule according to column four in Table 2.
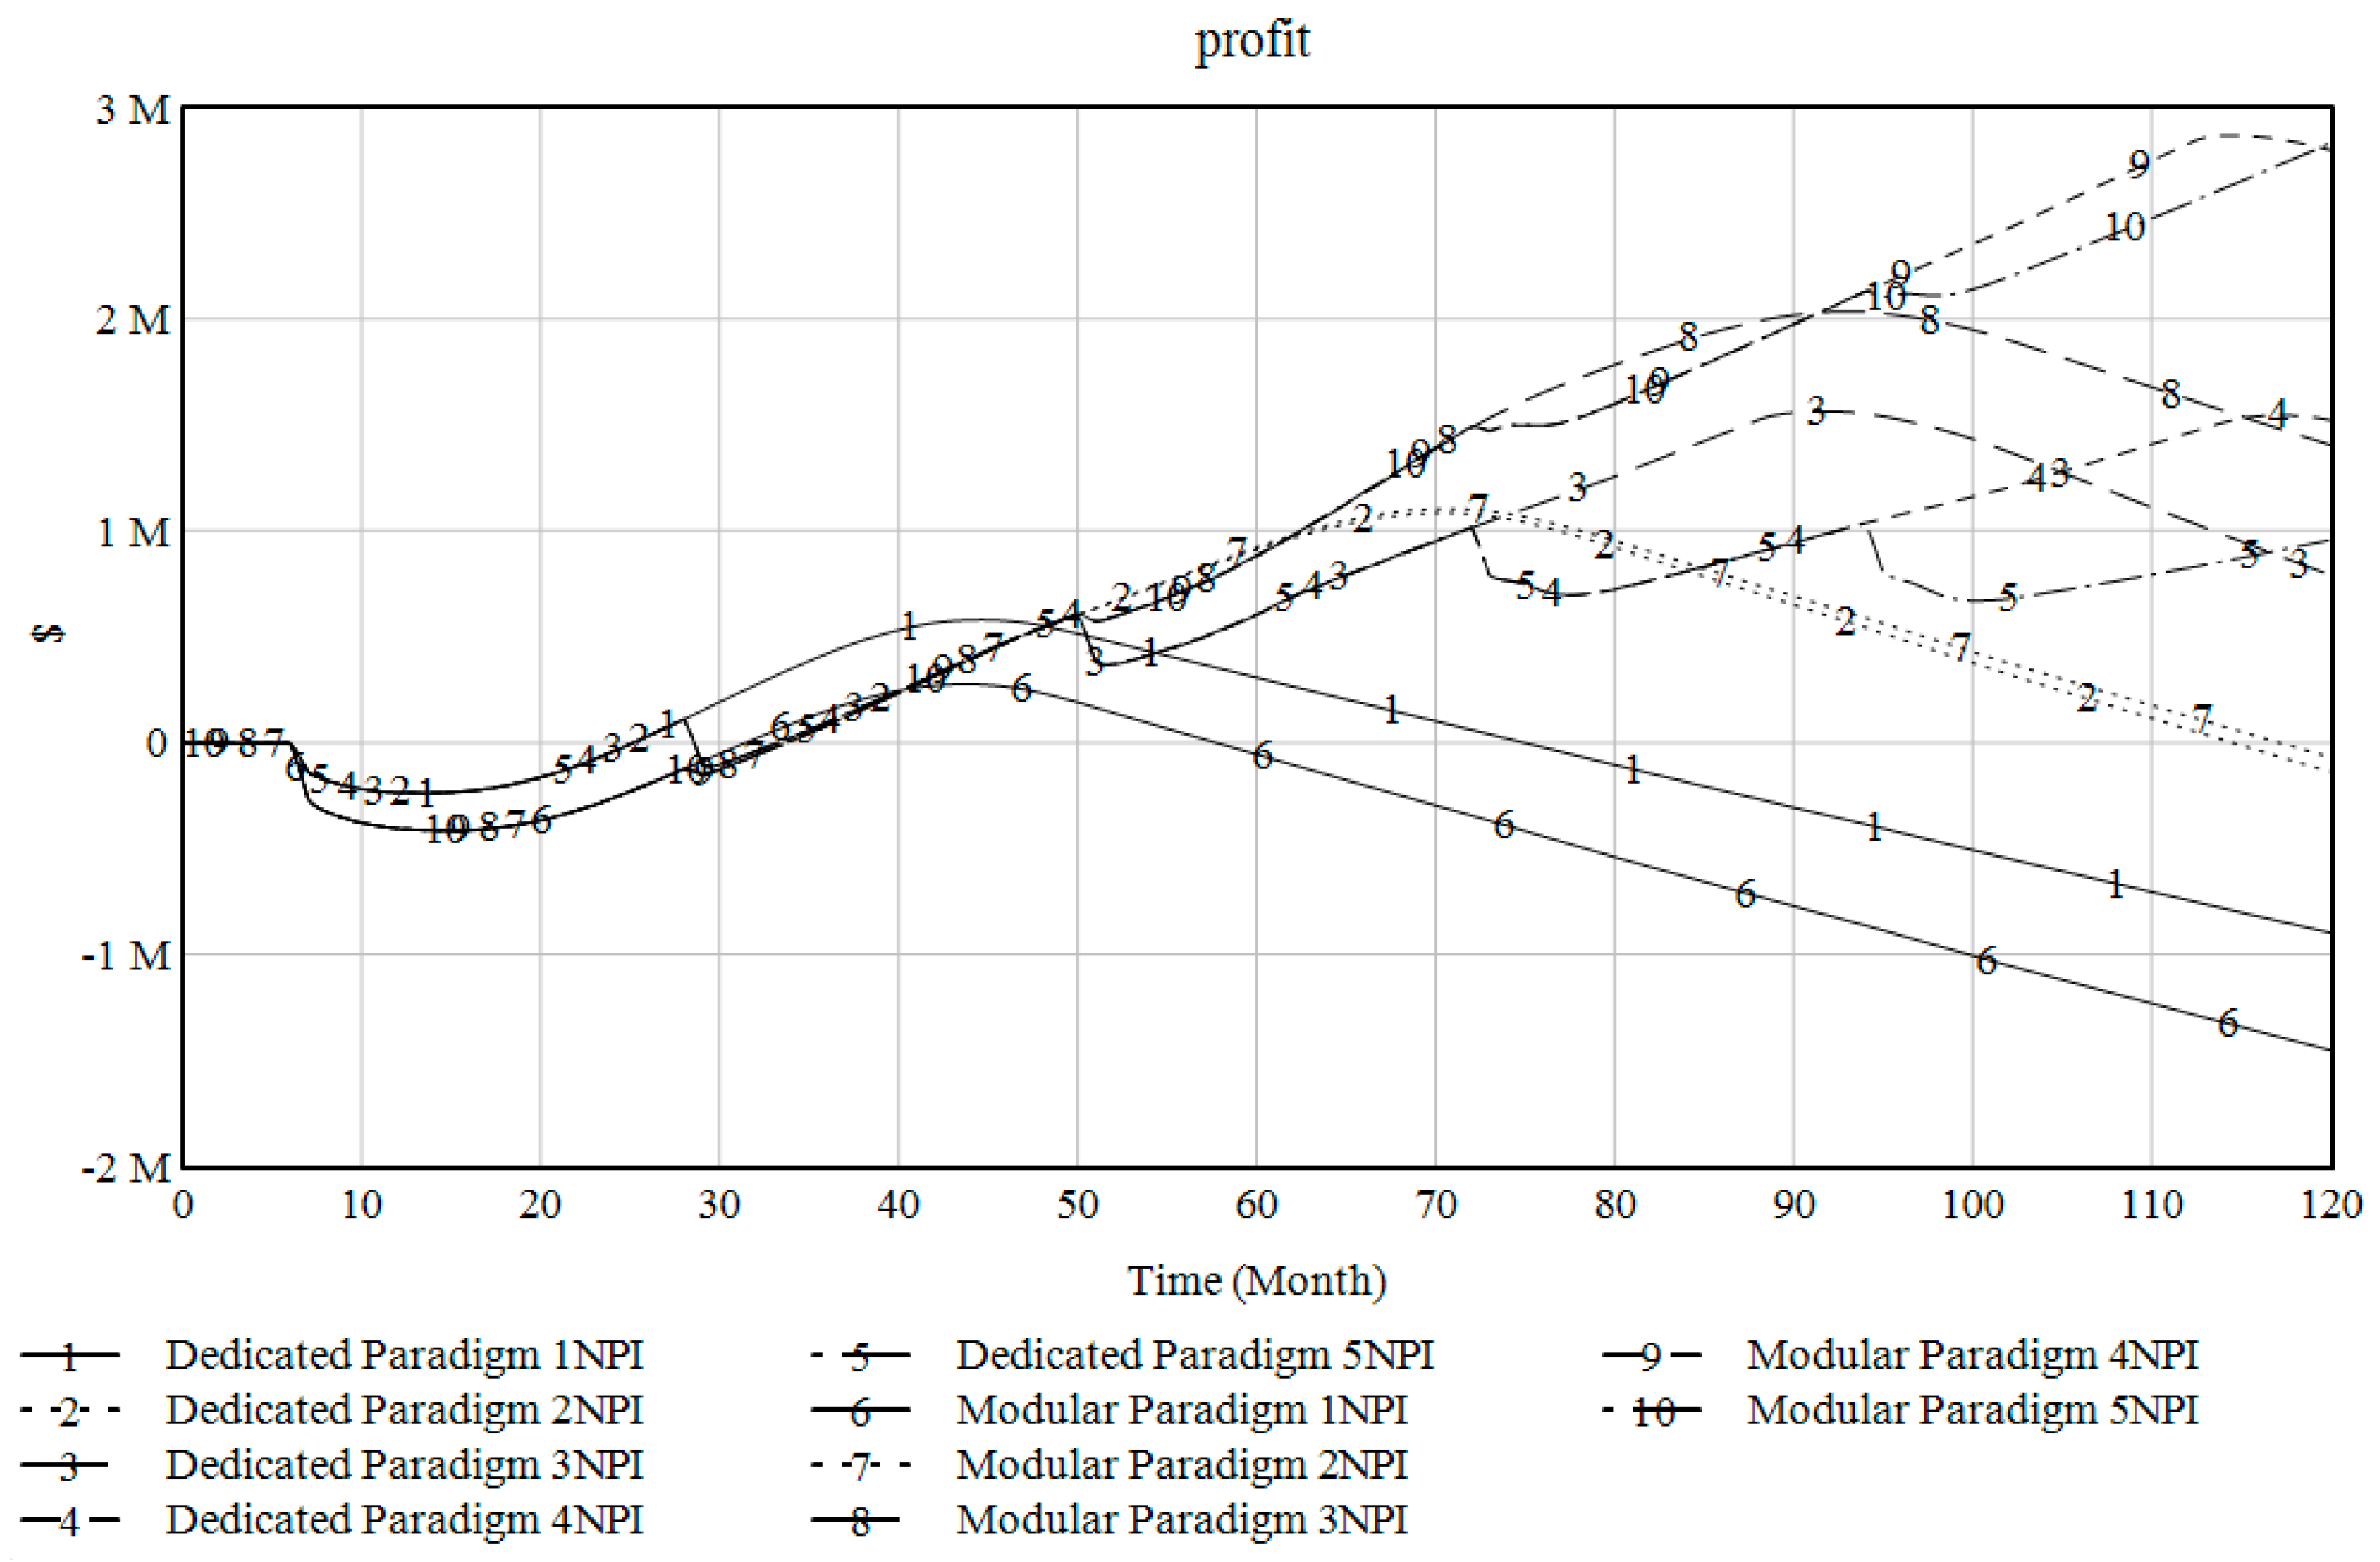
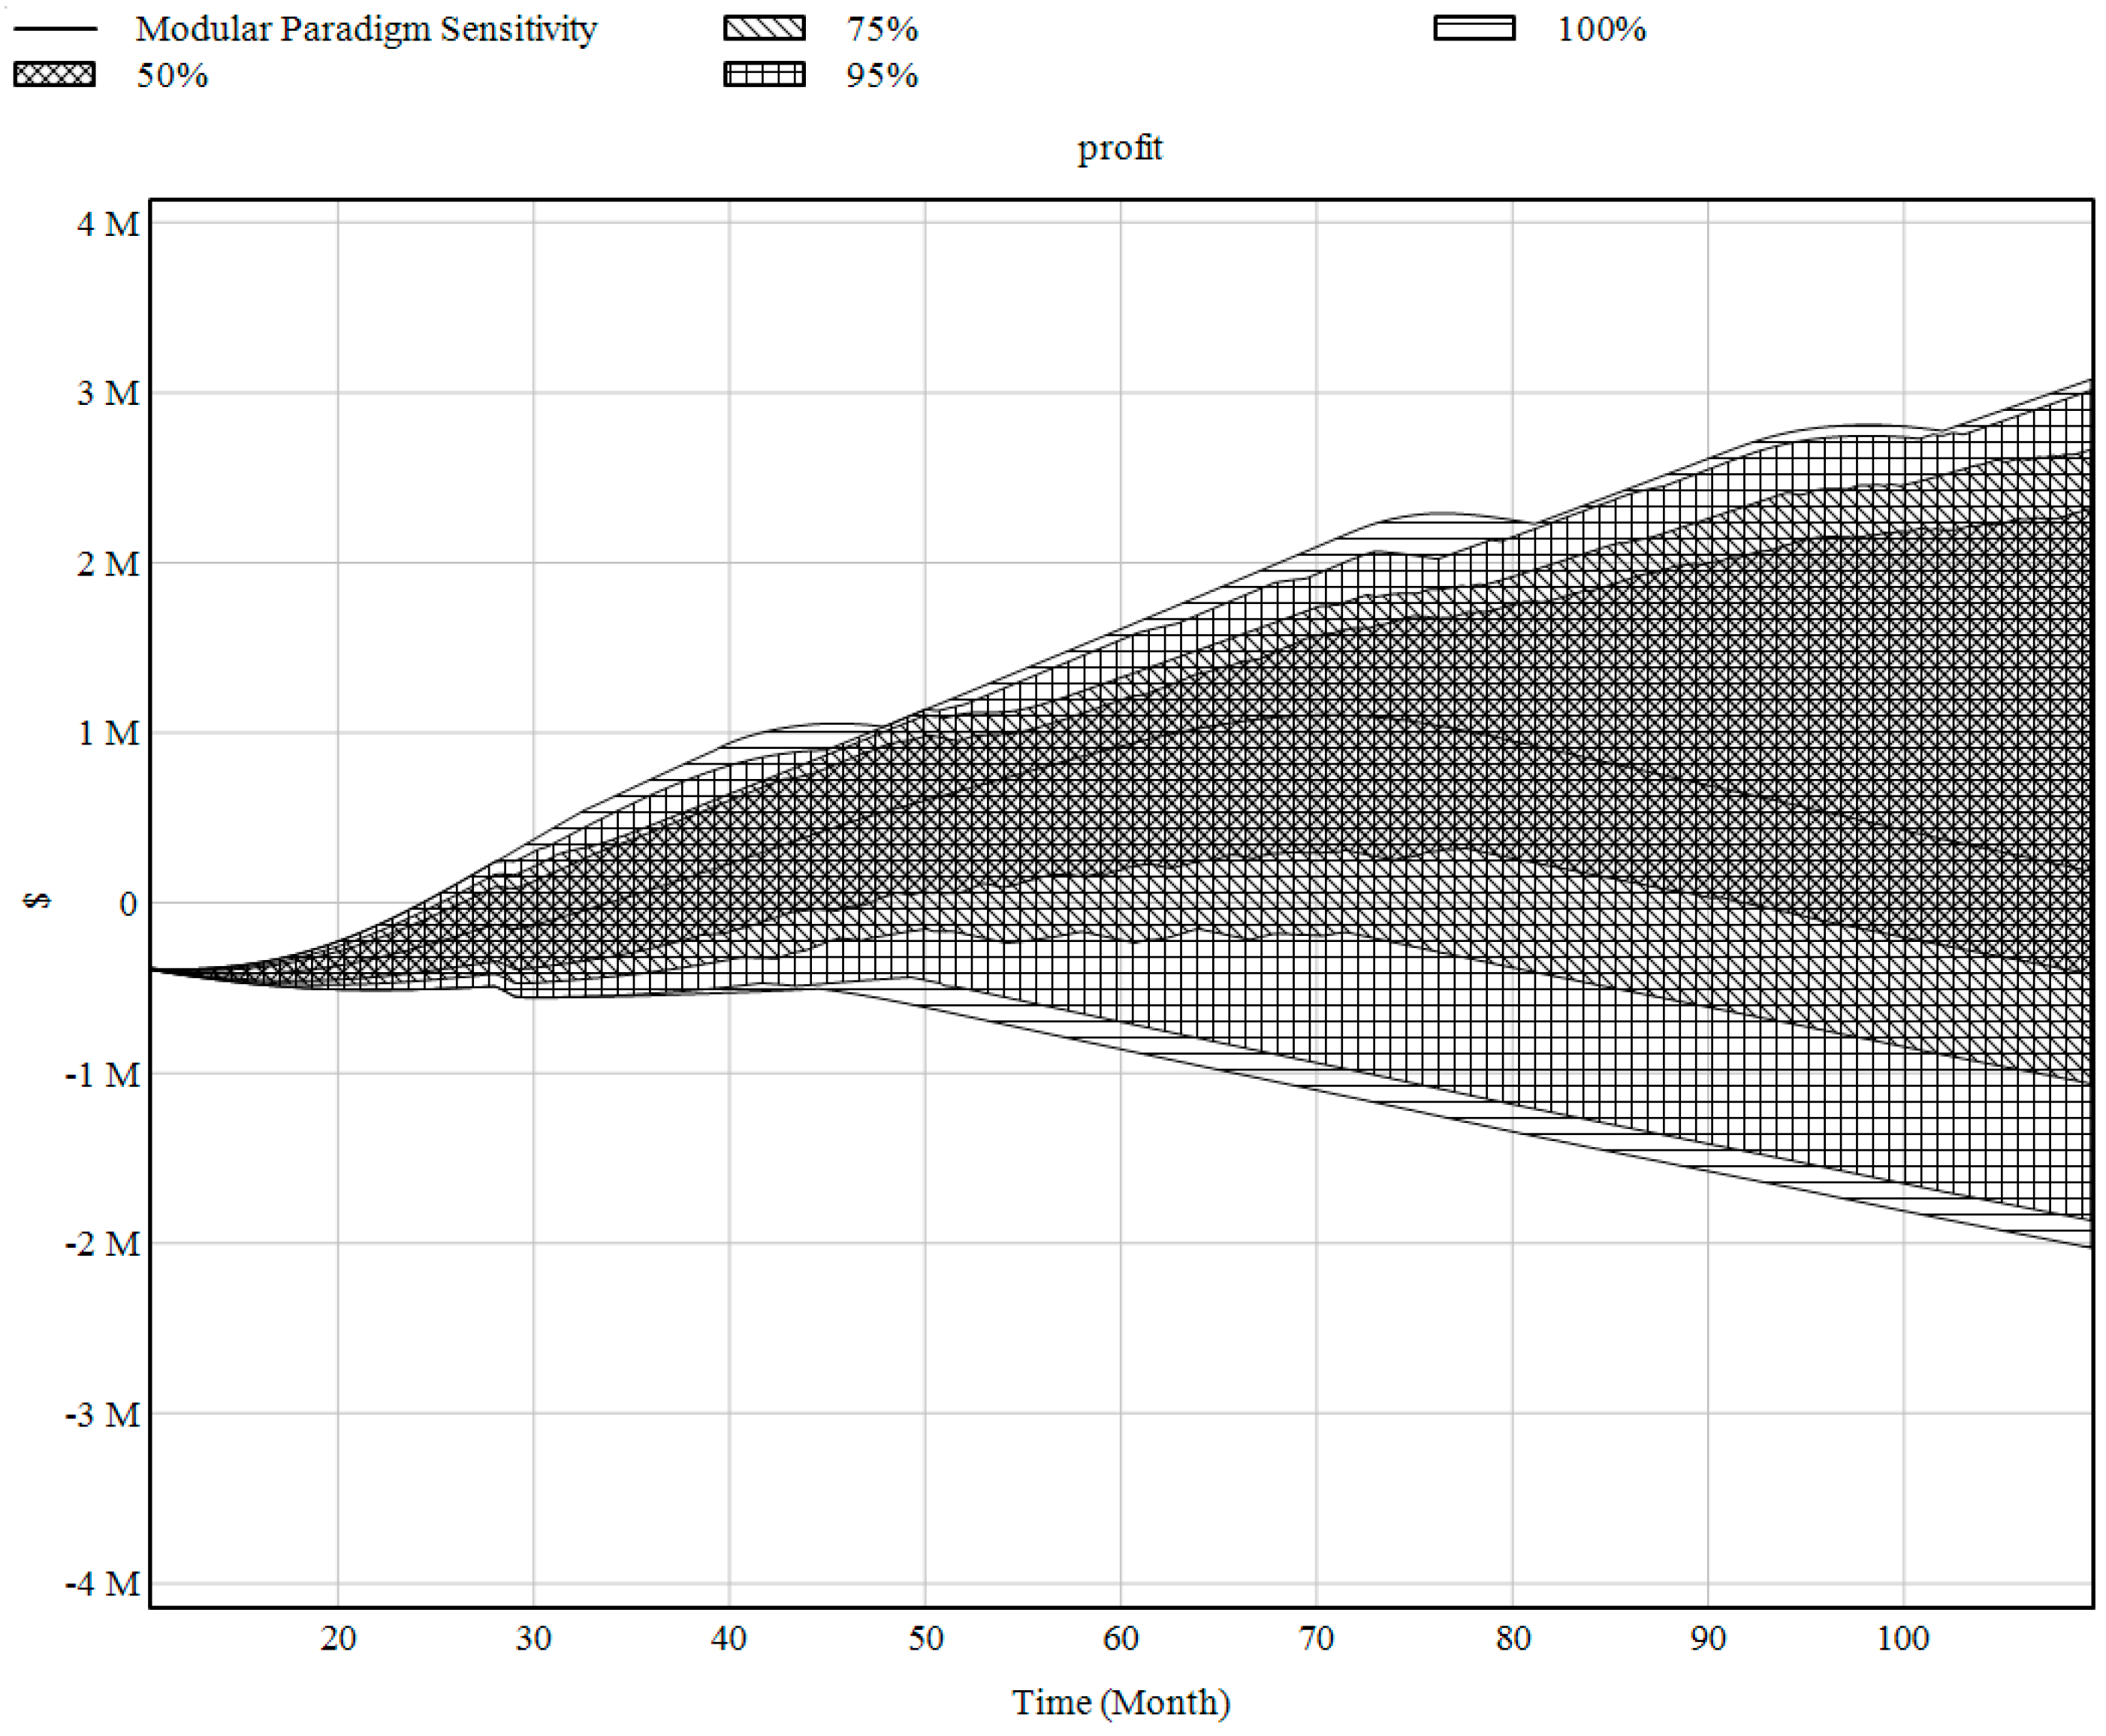
In the simulated results depicted in Figure 27, we present the total profit performance for 1 to 5 NPIs for the respective paradigm. In the diagram, we can see how the dedicated approach reaches breakeven faster than the modular approach no matter which simulation runs, e.g., compare lines 1–5 with 6–10 until Month 28. We also find that the profit follows quite a similar pattern for both of the two approaches during the 2nd NPI, comparing results across paradigms during Months 30 to 50. Considering three NPIs, compare lines 3 and 8; the modular approach now has an economic advantage, which is further reinforced in the scenarios for four NPIs (compare lines 4 and 9) and five NPIs (compare lines 5 and 10). We can even see that the long-term economic sustainability effects are worsened by the more NPIs there are within the dedicated paradigm. Such an effect might be expected; however, the conditions leading to these results are under a high degree of uncertainty. Therefore, we also need to assess the uncertainty of future customer demand for each paradigm. This leads us to the sensitivity simulation within the uncertainty ranges presented in Table 2, whose results are presented in Figure 28 and Figure 29. The explored uncertainty implies the customer demand is ranging from 50% to 150% of the nominal values used in Figure 27.
With the analysis from comparing the output results on profit from the dedicated and modular approaches, depicted in Figure 28 and Figure 29, respectively, we may find a higher risk of ending at a non-profitable solution using the dedicated approach. Even so, we may potentially find a more viable solution in the long term if applying the modular approach. As an illustrative case, it can be concluded that these experiments facilitate the exploration of the solution space of differentiating between the short- and long-term effects of dedicated and modular production system solutions. A summary of the above analysis is provided by the Table 3.

6. Discussion and Conclusions

In this paper, we have investigated the economic rationale for reconfigurable modularization and changeability in semi-automatic assembly systems. By utilizing an illustrative case that introduces three products over ten years, we present a conceptual system dynamics model, in which we differentiate between the implications of applying either a dedicated or modular approach when defining production system solutions. Our archetypical case is founded on empirical data from a multiple case study consisting of four cases. The case results indicate that a longer time horizon is required to economically motivate investments that consider increased levels of reconfigurability and modularization.
The proposed model considers the possibility of exploring any volume scenario for any selective number of new product introductions (NPIs). Using the simulation model, scenarios can be investigated considering multiple implications, such as production capability, the cost allocations of resources, and the identification of key performance indicators, such as cost per product and profit. Furthermore, various staffing scenarios and estimations of investments and modification costs can be explored as well as how resolving ramp-up issues, which is a form of production engineering rework that impact capacity and costs, can be studied.
Overall, the review of the conceptual model and the subsequent experiments, which introduce five product introductions, exemplifies how a system dynamics simulation can help investigate the economic rationale of modularization. The proposed systemic perspective to capture how reconfigurable modularization in semi-automatic assembly systems can be assessed is considered novel compared to the current state of the art and enables the scrutinization of assessing the economic sustainability.
Our goal is to promote economic sustainability by illustrating the supportive role of system dynamics modeling and simulations to investigate the economic rationale of a more changeable approach in production development. By considering resource inputs required from NPIs and their impact on costs and profits over the life cycle of production systems, this systemic approach may inspire moving beyond the myopic one-project-at-a-time thinking by emphasizing a cross-project approach instead. While our approach addresses previous research limitations, it can be further refined by considering improvements regarding boundary selection and including more feedback mechanisms to complete the systematic consideration of the problem under study. Previous research concentrates on greenfield development, neglecting the challenges of transitioning to more sustainable options, oftentimes balancing economic tradeoffs between short-term investments for (hopefully significant) long-term gains.
Consequently, this study exemplifies a holistic approach to motivate transitions of industrial systems and can inspire the following future research paths: (1) Ignite a journey towards an increasingly systematic approach to reason on the economic sustainability of modularization and changeability in production development. This is to bridge across potential organizational constraints that are created by the economic frames that project budgets define. (2) Start a discussion on the need for support using a system dynamics simulation to enhance sustainable decision-making in companies. (3) Support pedagogical development in university education of how these complex phenomena can be better addressed.

Supplementary Materials

The following supporting information can be downloaded at: https://www.mdpi.com/article/10.3390/systems12060218/s1.

Author Contributions

G.L. was the main author and led all parts of the work. S.B. contributed to the creation and validation of the model based on experiences and findings from the case companies during the study and provided input on the finalized manuscript. All authors have read and agreed to the published version of the manuscript.

Funding

This research was funded by the Swedish Knowledge and Competence Foundation grant number 20200051 during 2020 to 2023, and grant number 20200018 during 2023 to 2024.

Data Availability Statement

Data are contained within the article.

Acknowledgments

We gratefully acknowledge the Swedish Knowledge and Competence Foundation for research funding, our larger research team at Jönköping University, and the much-appreciated collaboration and co-production with our industrial partners. We also want to acknowledge the valuable contributions from the reviewers, which further enhanced our research contribution.

Conflicts of Interest

The authors declare no conflict of interest.

Appendix A

Variable nameExpressionUnit
AccCostsINTEG (costFlow, 0)$
AccNPIINTEG (newNPI, 0)NPI
accRevenuesDeliveredProducts*revenuePerProduct$
adjFactorTimeStep8Dmnl
adjForInv(desiredInventory-Inventory)/adjTimeInvPcs/Month
adjForWIP(desiredWIP-WorkInProcess)/adjTimeWIPPcs/Month
adjTimeInv4Month
adjTimeWIP0.5Month
avgCostPerProducedProductAccCosts/DeliveredProducts$/Pcs
avgSetUpLosses=
tblSetUpLoss
(MAX(ComplexityOfLine/factorModularLinePreparationTime, 1))Dmnl
BacklogINTEG (orderRate-satisfiedDemand, orderRate * targetDeliveryDelay)Pcs
cangeInExpOrderRate(customerVolumes-ExpectedOrderRate)/timeToAvgOrderRate(Pcs/Month)/Month
complexityFromNPI1Dmnl/NPI
ComplexityOfLineINTEG (rateComplexity, 0)Dmnl
costEngineeringengCostPerMonth*engHrsTot$/Month
costFlowdepreciationCost + costStaff + costEngineering$/Month
costPerPersonAndMonth4600$/Person/Month
costStaffindNPI*staffing*numberOfShift * costPerPersonAndMonth$/Month
customerVolumes=IF THEN ELSE(noNPI=1, tblVolumeP1(Time) * factorVolumeP1,
IF THEN ELSE( noNPI=2, tblVolumeP1(Time) * factorVolumeP1 + tblVolumeP2(Time) * factorVolumeP2,
IF THEN ELSE(noNPI=3, tblVolumeP1(Time) * factorVolumeP1 + tblVolumeP2(Time) * factorVolumeP2 + tblVolumeP3(Time),
IF THEN ELSE(noNPI=4, tblVolumeP1(Time) * factorVolumeP1 + tblVolumeP2(Time) * factorVolumeP2 + tblVolumeP3(Time) * factorVolumeP3 + factorVolumeP4 * tblVolumeP4(Time), tblVolumeP1(Time)* factorVolumeP1 + tblVolumeP2(Time)* factorVolumeP2 + tblVolumeP3(Time) * factorVolumeP3 + factorVolumeP4 * tblVolumeP4(Time) + factorVolumeP5 * tblVolumeP5(Time)))))
Pcs/Month
DeliveredProductsINTEG (satisfiedDemand, 1)Pcs
depreciationCostFixedAssets/depreciationTime$/Month
depreciationTime120Month
desiredInventorydesiredInventoryCoverage * ExpectedOrderRatePcs
desiredInventoryCoverageminOrderProcessingTime + safetyStockCoverageMonth
desiredProductionMAX(0, ExpectedOrderRate + adjForInv)Pcs/Month
desiredProductionStartRateMAX(0,desiredProduction + adjForWIP)Pcs/Month
desiredShipmentRateBacklog/targetDeliveryDelayPcs/Month
desiredWIP(desiredProduction + ExpectedOrderRate) * manufacturingCycleTimePcs
dtResolveRUI0.5Month
engCostPerMonth100$/WorkHrs
engHrsNPCStdEngHrsPerNPCproject * ComplexityOfLine * noNPCprojectsWorkHrs/Month
engHrsPostNPItimePerRUI*resolvedRampUpIssuesWorkHrs/Month
engHrsPreNPIfactorEngEffortNPIforDedOrMod * stdEngHrsPerNPIprojectWorkHrs/Month
engHrsTotengHrsPreNPI + engHrsNPC + engHrsPostNPIWorkHrs/Month
existingNPI1NPI
ExpectedOrderRateINTEG (cangeInExpOrderRate, customerVolumes)Pcs/Month
factorEngEffortNPIforDedOrModIF THEN ELSE(switchDedicatedOrModular = 0, IF THEN ELSE(AccNPI >= 1, 2, 1) * NPIprojects, IF THEN ELSE(AccNPI >= 1, 0.5, 2) * NPIprojects)NPI/Month
factorModularLinePreparationTime2Dmnl
factorNPIinvCostForDedOrModIF THEN ELSE(switchDedicatedOrModular = 0, 1, IF THEN ELSE(AccNPI>=1, 0.5, 1.5)) * NPIprojectsNPI/Month
factorVolumeP11Dmnl
factorVolumeP21Dmnl
factorVolumeP31Dmnl
factorVolumeP41Dmnl
factorVolumeP51Dmnl
FINAL TIME120Month
FixedAssetsINTEG (investments - depreciationCost, 0)$
grossCapacityindNPI*numberOfShift * grossTHperShiftPcs/Month
grossTHperShift12*40*4.1Pcs/Month/shift
indNPIMIN(AccNPI, existingNPI)/existingNPIDmnl
INITIAL TIME0Month
invCostPerNPC40000$/NPC
invCostPerNPI1e+06$/NPI
InventoryINTEG (productionRate-shipmentRate, desiredInventory)Pcs
investmentsinvNPC+invNPI$/Month
invNPCnoNPCprojects*invCostPerNPC$/Month
invNPIinvCostPerNPI * factorNPIinvCostForDedOrMod$/Month
lossFromRUI1Dmnl/RUI
manufacturingCycleTime2Month
maxShipmentRateMAX(0, Inventory/minOrderProcessingTime)Pcs/Month
minOrderProcessingTime0.5Month
netCapacitygrossCapacity*rampUpLosses* avgSetUpLossesPcs/Month
newNPINPIprojectsNPI/Month
noNPCchangesPerNPI4/12NPC/Month
noNPCprojects=(IF THEN ELSE(tblVolumeP1(Time)>1, noNPCchangesPerNPI, 0)+
IF THEN ELSE( tblVolumeP2(Time)>1, noNPCchangesPerNPI, 0)+
IF THEN ELSE(tblVolumeP3(Time)>1, noNPCchangesPerNPI, 0)+
IF THEN ELSE(tblVolumeP4(Time)>1, noNPCchangesPerNPI, 0)+
IF THEN ELSE(tblVolumeP5(Time)>1, noNPCchangesPerNPI, 0))/12
NPC/Month
noNPI2NPI
NPIprojectsIF THEN ELSE(noNPI=1, PULSE(6, TIME STEP*adjFactorTimeStep),
IF THEN ELSE(noNPI=2, PULSE(6, TIME STEP * adjFactorTimeStep) + PULSE((28), TIME STEP * adjFactorTimeStep),
IF THEN ELSE(noNPI=3, PULSE(6, TIME STEP * adjFactorTimeStep) + PULSE((28), TIME STEP * adjFactorTimeStep) + PULSE((28+22), TIME STEP * adjFactorTimeStep),
IF THEN ELSE(noNPI=4, PULSE(6, TIME STEP * adjFactorTimeStep) + PULSE((28), TIME STEP * adjFactorTimeStep) + PULSE((28+22), TIME STEP * adjFactorTimeStep) + PULSE((28+22+22), TIME STEP * adjFactorTimeStep),
IF THEN ELSE(noNPI=5, PULSE(6, TIME STEP * adjFactorTimeStep) + PULSE((28), TIME STEP * adjFactorTimeStep) + PULSE((28+22), TIME STEP * adjFactorTimeStep) + PULSE((28+22+22), TIME STEP * adjFactorTimeStep) + PULSE((28+22+22+22), TIME STEP * adjFactorTimeStep), 0)))))
NPI/Month
numberOfShift1shifts
orderRatecustomerVolumesPcs/Month
productionRateMAX(0, DELAY3(productionStartRate, manufacturingCycleTime))Pcs/Month [0,?]
productionStartRateMIN(netCapacity, desiredProductionStartRate)Pcs/Month
profitaccRevenues-AccCosts$
rampUpIssuesfactorEngEffortNPIforDedOrMod * workloadRUI + noNPCprojects/workloadRatioRUIperNPCRUI/Month
rampUpLosses1 - MIN(1, lossFromRUI*RUIbacklog)Dmnl
rateComplexityfactorEngEffortNPIforDedOrMod * complexityFromNPIDmnl/Month
ratioOrderFullfillmentIF THEN ELSE(maxShipmentRate/desiredShipmentRate > 1, 1, tblOrderFullfillment(maxShipmentRate/desiredShipmentRate))Dmnl
resolvedRampUpIssuesRUIbacklog/dtResolveRUIRUI/Month
revenuePerProduct40$/Pcs
RUIbacklogINTEG (rampUpIssues-resolvedRampUpIssues, 1)RUI
safetyStockCoverage0.5Month
satisfiedDemandshipmentRatePcs/Month
SAVEPERTIME STEPMonth [0,?]
shipmentRatedesiredShipmentRate * ratioOrderFullfillmentPcs/Month
staffing3persons/shift
StdEngHrsPerNPCproject172WorkHrs/NPC
stdEngHrsPerNPIproject6*172WorkHrs/NPI
switchDedicatedOrModular0Dmnl
targetDeliveryDelay1Month
tblOrderFullfillment([(0,0)-(20,1)],(0,0),(0.2,0.2),(0.4,0.4), (0.6,0.58), (0.8,0.73), (1,0.85), (1.2,0.93),(1.4,0.97), (1.6,0.99), (1.8,1), (10,1),(20,1))Dmnl
tblSetUpLoss([(0,0)-(10,2)],(0.5,1),(1,1),(1.5,0.93), (1.93,0.9), (2.5,0.88), (3.5,0.85), (6,0.8), (10,0.75))Dmnl
tblVolumeP1([(0,0)-(120,2000)],(0,1),(6,1),(9,200), (18,1050), (21,1313.53),(24,1500),(28,1580),(32,1518),(35,1399), (39,1062),(48,1),(120,1))Pcs/Month
tblVolumeP2([(0,0)-(120,2000)],(0,1),(28,0),(33,145), (39,640), (42,1062),(46,1392),(51,1531), (55,1531), (60,1419), (65,1108),(75,171),(80,1),(120,1))Pcs/Month
tblVolumeP3([(0,0)-(120,2000)], (0,1), (50,0), (54,105), (66,1082), (69,1366), (74,1504), (79,1518), (83,1425), (87,1188), (94,534), (102,1), (120,1))Pcs/Month
tblVolumeP4([(0,0)-(120,2000)],(0,1),(72,1),(78,132), (83,501), (88,1095),(94,1471),(98,1537), (102,1511), (108,1181), (115,534),(120,100))Pcs/Month
tblVolumeP5([(0,1)-(120,2000)],(0,1),(94,1),(100,165), (106,851), (111,1194),(115,1425),(120,1498))Pcs/Month
TIME STEP0.125Month [0,?]
timePerRUI40WorkHrs/RUI
timeToAvgOrderRate1Month
WorkInProcessINTEG (productionStartRate - productionRate, desiredWIP)Pcs
workloadRatioRUIperNPC50NPC/RUI
workloadRUI10RUI/NPI

References

  1. Fogliatto, F.S.; Da Silveira, G.J.C.; Borenstein, D. The mass customization decade: An updated review of the literature. Int. J. Prod. Econ. 2012, 138, 14–25. [Google Scholar] [CrossRef]
  2. Dombrowski, U.; Ebentreich, D.; Krenkel, P. Impact Analyses of Lean Production Systems. Procedia CIRP 2016, 57, 607–612. [Google Scholar] [CrossRef]
  3. Zikopoulos, C. On the effect of upgradable products design on circular economy. Int. J. Prod. Econ. 2022, 254, 108629. [Google Scholar] [CrossRef]
  4. Vielhaber, M.; Stoffels, P. Product development vs. Production development. Procedia CIRP 2014, 21, 252–257. [Google Scholar] [CrossRef]
  5. Dogea, R.; Stolt, R. Identifying Challenges Related to Industry 4.0 in Five Manufacturing Companies. Procedia Manuf. 2021, 55, 328–334. [Google Scholar] [CrossRef]
  6. Yang, J.; Son, Y.H.; Lee, D.; Do Noh, S. Digital Twin-Based Integrated Assessment of Flexible and Reconfigurable Automotive Part Production Lines. Machines 2022, 10, 75. [Google Scholar] [CrossRef]
  7. Barrera-Diaz, C.A.; Nourmohammadi, A.; Smedberg, H.; Aslam, T.; Ng, A.H.C. An Enhanced Simulation-Based Multi-Objective Optimization Approach with Knowledge Discovery for Reconfigurable Manufacturing Systems. Mathematics 2023, 11, 1527. [Google Scholar] [CrossRef]
  8. Goienetxea Uriarte, A.; Ng, A.H.C.; Urenda Moris, M. Bringing together Lean and simulation: A comprehensive review. Int. J. Prod. Res. 2020, 58, 87–117. [Google Scholar] [CrossRef]
  9. Anderson, E.G.; Lim, S.Y.; Joglekar, N. Are more frequent releases always better? Dynamics of pivoting, scaling, and the minimum viable product. In Proceedings of the Annual Hawaii International Conference on System Sciences, Waikoloa Village, HI, USA, 4–7 January 2017; pp. 5849–5858. [Google Scholar] [CrossRef]
  10. Landahl, J.; Jiao, R.J.; Madrid, J.; Söderberg, R.; Johannesson, H. Dynamic platform modeling for concurrent product-production reconfiguration. Concurr. Eng. Res. Appl. 2021, 29, 102–123. [Google Scholar] [CrossRef]
  11. ElMaraghy, H. Changeable and Reconfigurable Manufacturing Systems; Springer: London, UK, 2009. [Google Scholar]
  12. Skärin, F.; Rösiö, C.; Andersen, A.L. Towards Circular Production Systems: Outlining the Concept, Challenges and Future Research Directions. In Advances in System-Integrated Intelligence, Proceedings of the 6th International Conference on System-Integrated Intelligence (SysInt 2022), Genova, Italy, 7–9 September 2022; Lecture Notes in Networks and Systems; Springer Science and Business Media: Berlin/Heidelberg, Germany, 2023; Volume 546, pp. 616–625. [Google Scholar]
  13. Boldt, S.; Rösiö, C.; Linnéusson, G. Mapping Production Capabilities: Proposing Support Towards Changeable Production. In Production Processes and Product Evolution in the Age of Disruption, Proceedings of the 9th Changeable, Agile, Reconfigurable and Virtual Production Conference (CARV 2023) and the 11th World Mass Customization & Personalization Conference (MCPC 2023), Bologna, Italy, 20–23 June 2023; Galizia, F.G., Bortolini, M., Eds.; Lecture Notes in Mechanical Engineering; Springer: Cham, Switzerland, 2023. [Google Scholar] [CrossRef]
  14. Helbig, T.; Hoos, J.; Westkaämper, E. A Method for Estimating and Evaluating Life Cycle Costs of Decentralized Component-based Automation Solutions. Procedia CIRP 2014, 17, 332–337. [Google Scholar] [CrossRef]
  15. Andersen, A.L.; Brunoe, T.D.; Bockholt, M.T.; Napoleone, A.; Hemdrup Kristensen, J.; Colli, M.; Vejrum Wæhrens, B.; Nielsen, K. Changeable Closed-Loop Manufacturing Systems: Challenges in Product Take-Back and Evaluation of Reconfigurable Solutions. Int. J. Prod. Res. 2023, 61, 839–858. [Google Scholar] [CrossRef]
  16. Skärin, F.; Abdelmageed, M.E.; Linnéusson, G.; Rösiö, C. Supporting Manufacturing Investment Decisions in New Product Introductions through Line Balancing Techniques. In Advances in Transdisciplinary Engineering, Proceedings of the 10th Swedish Production Symposium (SPS 2022), Skövde, Sweden, 26–29 April 2022; IOS Press BV: Amsterdam, The Netherlands, 2022; Volume 21, pp. 89–100. [Google Scholar]
  17. Sterman, J.D. Business Dynamics: Systems Thinking and Modeling for a Complex World; Irwin McGraw-Hill: Boston, MA, USA, 2000. [Google Scholar]
  18. Warren, K. Improving strategic management with the fundamental principles of system dynamics. Syst. Dyn. Rev. 2005, 21, 329–350. [Google Scholar] [CrossRef]
  19. Linnéusson, G.; Ng, A.H.C.; Aslam, T. Towards strategic development of maintenance and its effects on production performance by using system dynamics in the automotive industry. Int. J. Prod. Econ. 2018, 200, 151–169. [Google Scholar] [CrossRef]
  20. Koufteros, X.; Lu, G.; Peters, R.C.; Lai, K.H.; Wong, C.W.Y.; Cheng, T.C.E. Product development practices, manufacturing practices, and performance: A mediational perspective. Int. J. Prod. Econ. 2014, 156, 83–97. [Google Scholar] [CrossRef]
  21. Zhang, L.L. A literature review on multitype platforming and framework for future research. Int. J. Prod. Econ. 2015, 168, 1–12. [Google Scholar] [CrossRef]
  22. Robertson, D.; Ulrich, K. Planning for Product Platforms. Sloan Manag. Rev. 1998, 39, 19–31. [Google Scholar]
  23. Meyer, M.H.; Lehnerd, A.P. The Power of Product Platforms: Building Value and Cost Leadership; The Free Press: New York, NY, USA, 1997. [Google Scholar]
  24. Sorensen, D.G.H.; ElMaraghy, H.A.; Brunoe, T.D.; Nielsen, K. Classification coding of production systems for identification of platform candidates. CIRP J. Manuf. Sci. Technol. 2020, 28, 144–156. [Google Scholar] [CrossRef]
  25. Michaelis, M.T.; Johannesson, H. From Dedicated to Platform-Based Co-Development of Products and Manufacturing Systems. In Proceedings of the 4th International Conference on Changeable, Agile, Reconfigurable and Virtual Production, Montreal, QC, Canada, 2–5 October 2011; pp. 197–202. [Google Scholar] [CrossRef]
  26. Boldt, C.S.; Linnéusson, G.; Rösiö, C. Exploring the concept of production platforms—A literature review. Procedia CIRP 2021, 104, 158–163. [Google Scholar] [CrossRef]
  27. ElMaraghy, H.A.; Abbas, M. Products-manufacturing systems Co-platforming. CIRP Ann. Manuf. Technol. 2015, 64, 407–410. [Google Scholar] [CrossRef]
  28. Sorensen, D.G.H.; Bossen, J.; Bejlegaard, M.; Brunoe, T.D.; Nielsen, K. Production Platform Development through the Four Loops of Concern. In Customization 4.0; Hankammer, S., Nielsen, K., Piller, F., Schuh, G., Wang, N., Eds.; Springer: Cham, Switzerland, 2018; pp. 479–493. [Google Scholar] [CrossRef]
  29. Brunoe, T.D.; Andersen, A.L.; Sorensen, D.G.H.; Nielsen, K.; Bejlegaard, M. Integrated product-process modeling for platform-based co-development. Int. J. Prod. Res. 2020, 58, 6185–6201. [Google Scholar] [CrossRef]
  30. Andersen, A.L.; Brunoe, T.D.; Nielsen, K.; Rösiö, C. Towards a generic design method for reconfigurable manufacturing systems: Analysis and synthesis of current design methods and evaluation of supportive tools. J. Manuf. Syst. 2017, 42, 179–195. [Google Scholar] [CrossRef]
  31. Andersen, A.L.; Rösiö, C. Investigating the Transition towards Changeability through Platform-based Co-development of Products and Manufacturing Systems. Procedia Manuf. 2019, 28, 114–120. [Google Scholar] [CrossRef]
  32. Dashchenko, A.I. Reconfigurable Manufacturing Systems and Transformable Factories; Springer: Berlin, Germany, 2006. [Google Scholar] [CrossRef]
  33. Singh, P.P.; Madan, J.; Singh, S. Economically Sustainable Configuration Selection in Reconfigurable Manufacturing System. In Sustainable Development through Engineering Innovations; Singh, H., Cheema, P.P.S., Garg, P., Eds.; Lecture Notes in Civil Engineering 113; Springer Nature: Singapore, 2021; pp. 457–466. [Google Scholar] [CrossRef]
  34. Amjad, M.S.; McCleeary, D.; Nagaraj, S.; Diaz-Elsayed, N. Integrating Carbon Credits with Life Cycle Costing for Economic Sustainability in SMEs. Procedia CIRP 2023, 116, 672–677. [Google Scholar] [CrossRef]
  35. Ellström, E. Knowledge Creation through Interactive Research: A Learning Perspective, Linköping. 2007. Available online: https://www.ltu.se/cms_fs/1.24923!/per-erik%20ellstr%C3%B6m.pdf (accessed on 20 September 2023).
  36. Ørngreen, E.L.; Levinsen, R.T. Workshops as a Research Methodology. Electron. J. e-Learn. 2017, 15, 70–81. [Google Scholar]
  37. Slack, N.; Brandon-Jones, A.; Johnston, R. Operations Management, 8th ed.; Pearson: Halow, UK, 2016. [Google Scholar]
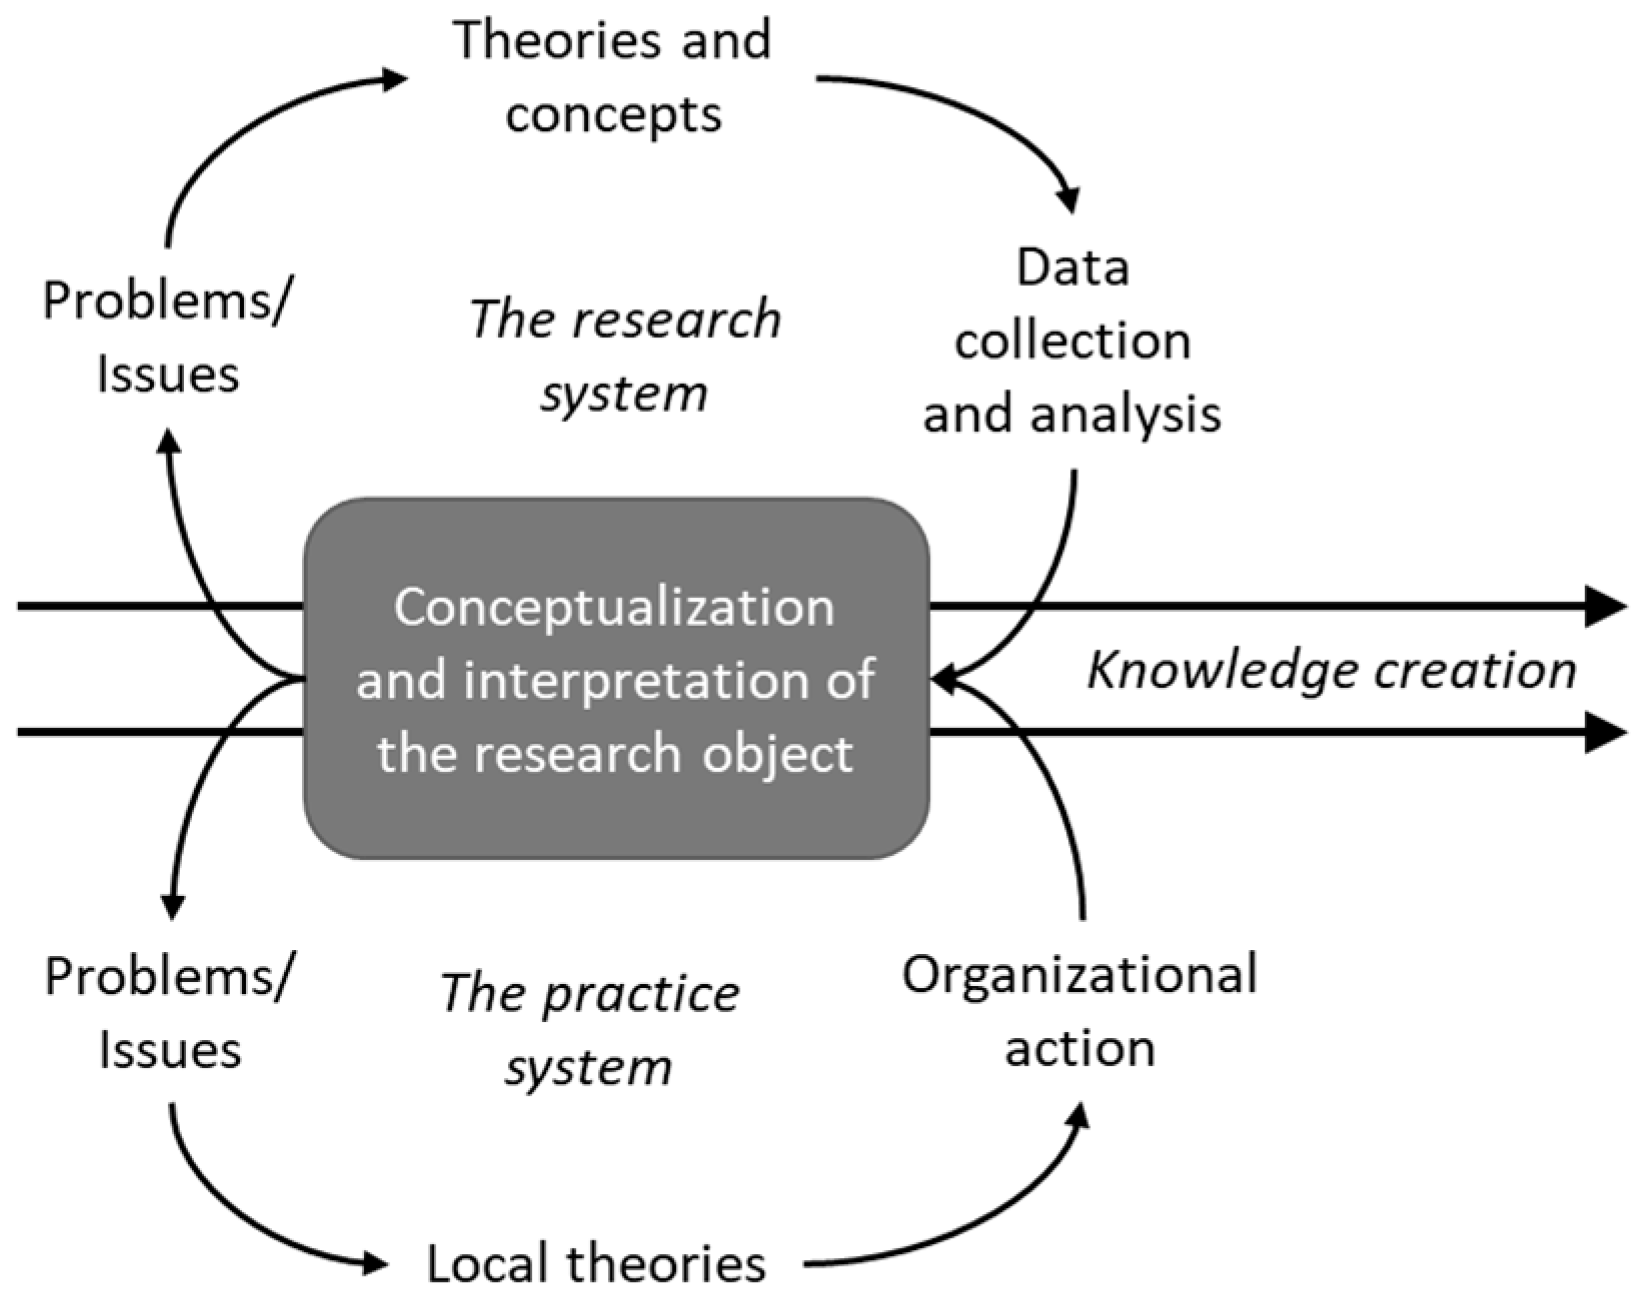
Figure 1. “The creation of knowledge” model using interactive research, adapted from [35].
Systems 12 00218 g001
Figure 2. Overview of aspects included in the model.
Systems 12 00218 g002
Figure 3. Detailed model overview.
Systems 12 00218 g003
Figure 4. Investment factor.
Systems 12 00218 g004
Figure 5. Stock of fixed assets.
Systems 12 00218 g005
Figure 6. The complexity of the line index.
Systems 12 00218 g006
Figure 7. Engineering hours for NPCs.
Systems 12 00218 g007
Figure 8. Engineering hours from RUIs.
Systems 12 00218 g008
Figure 9. Sum engineering costs.
Systems 12 00218 g009
Figure 10. Net capacity.
Systems 12 00218 g010
Figure 11. Ramp-up issues (RUIs).
Systems 12 00218 g011
Figure 12. Backlog of RUIs.
Systems 12 00218 g012
Figure 13. Ramp-up losses.
Systems 12 00218 g013
Figure 14. Table of set-up losses.
Systems 12 00218 g014
Figure 15. Average set-up losses.
Systems 12 00218 g015
Figure 16. Customer order volumes.
Systems 12 00218 g016
Figure 17. Sensitivity test of volumes.
Systems 12 00218 g017
Figure 18. Customer backlog.
Systems 12 00218 g018
Figure 19. Satisfied customer demand.
Systems 12 00218 g019
Figure 20. Profit.
Figure 20. Profit.
Systems 12 00218 g020
Figure 21. Average cost per product.
Systems 12 00218 g021
Figure 22. Standard volume for P1.
Systems 12 00218 g022
Figure 23. Standard volume for P2.
Systems 12 00218 g023
Figure 24. Standard volume for P3.
Systems 12 00218 g024
Figure 25. Standard volume for P4.
Systems 12 00218 g025
Figure 26. Standard volume for P5.
Systems 12 00218 g026
Figure 27. The simulated results for profit for 1 to 5 NPI for the respective paradigm.
Systems 12 00218 g027
Figure 28. The sensitivity simulation of the dedicated paradigm considering the output on profit.
Systems 12 00218 g028
Figure 29. The sensitivity simulation of the modular paradigm considering the output on profit.
Systems 12 00218 g029
Table 1. Engineering effort factors a priori depending on the production system paradigm.
ProjectDedicated ParadigmModular Paradigm
P1 NPI1 × n (hours)2 × n (hours)
P2 NPI2 × n (hours)0.5 × n (hours)
P3 NPI2 × n (hours)0.5 × n (hours)
Table 2. The plan of experiments for both the dedicated and modular paradigms.
SimulationInput VariablesNPI/NPCUncertainty Ranges
namenoNPItblVolumePηintroduced atmin/max
1 NPI1P1Month 60.5/1.5
2 NPI2P1+P2Month 280.5/1.5
3 NPI3P1+…+P3Month 500.5/1.5
4 NPI4P1+…+P4Month 720.5/1.5
5 NPI5P1+…+P5Month 940.5/1.5
Table 3. The summary of the output data from the experiments.
Simulation NameComparison of Simulated ResultsComparison of Uncertainty Risk
1 NPIThe dedicated paradigm reaches break even first. Low uncertainty during the 1st NPI as expected, even if the dedicated approach presents a bit wider range of uncertainty at Month 28.
2 NPIDuring the 2nd NPI, all scenarios follow a similar pattern. The uncertainty analysis depicts a similar potential for the 50% variance to the normal value, while the dedicated approach would be more beneficial if having higher production volumes. *
3 NPIAt the 3rd NPI, the modular paradigm indicates a small advantage. Both paradigms have similar risks, even if the dedicated seems safer at lower volumes. Looking at the 50% range the modular approach follows a higher performing behavior.
4 NPIAt the 4th NPI, the modular approach indicates nearly twice the profit. For the first time, the modular approach indicates higher profit potentials yet also a wider range for the 50%. *
5 NPIAt the 5th NPI, the modular approach indicates nearly three times the profit.The indicated potential of higher profit is attached to selecting the modular paradigm. *
* Note: The sensitivity analysis uses Latin Hypercube to search combinations of a modular approach with 1 to 5 NPIs and a dedicated approach with 1 to 5 NPIs. This implies the lower-range solutions at the end of the simulated period are greatly impacted by the 1 NPI output data.
Disclaimer/Publisher’s Note: The statements, opinions and data contained in all publications are solely those of the individual author(s) and contributor(s) and not of MDPI and/or the editor(s). MDPI and/or the editor(s) disclaim responsibility for any injury to people or property resulting from any ideas, methods, instructions or products referred to in the content.