Article

Evolutionary Game-Based New Energy Vehicle Supply Chain Strategies That Consider Carbon Reduction and Consumers’ Low-Carbon Preferences

1
Business School, Jiangxi University of Science and Technology, Nanchang 330013, China
2
School of Economics and Management, Jiangxi University of Science and Technology, Ganzhou 341000, China
3
Teaching Department of Basic Subjects, Jiangxi University of Science and Technology, Nanchang 330013, China
*
Author to whom correspondence should be addressed.
Systems 2024, 12(9), 328; https://doi.org/10.3390/systems12090328
Submission received: 15 July 2024 / Revised: 20 August 2024 / Accepted: 22 August 2024 / Published: 27 August 2024
(This article belongs to the Special Issue Management and Simulation of Digitalized Smart Manufacturing Systems)

Abstract

:
The rapid development of the new energy industry has intensified the competition among companies. Finding solutions to achieve technological innovation, carbon reduction, and to earn consumers’ confidence has become a pressing challenge. In this research, we aim to develop a four-party evolutionary game model involving government, manufacturers, dealers, and consumers to examine the strategic decisions made by these parties in order to accomplish carbon emission reduction goals. We will perform numerical simulations to analyze the strategic choices of each party and the relevant influencing factors. The results suggest the following: (1) The tax hike on traditional car production is less than the innovation expenses for new energy vehicles, leading manufacturers to lean towards manufacturing traditional vehicles. (2) The rise in taxes resulting from the manufacture of conventional vehicles will influence manufacturers’ strategic decisions, whereas the expenses related to technological advancements will have a more significant effect on manufacturers’ strategic choices. (3) Compared to dealers, manufacturers’ strategic choices are more significantly influenced by consumers’ awareness of low-carbon preferences. (4) In the early stages of technological innovation, the government typically offers incentive subsidies to manufacturers to boost technological innovation activities. Whereas, in the later stages of technological innovation, the government usually provides direct subsidies to consumers to encourage the market acceptance and widespread use of innovative products.

1. Introduction

With the rapid growth of the economy, the transportation sector has experienced substantial transformations, leading to a gradual expansion in the scale of the automobile manufacturing industry, unavoidably resulting in higher energy consumption [1]. Between 2014 and 2021, China’s automotive manufacturing industry saw its total energy consumption rise from 31.87 million tons of standard coal to 46.45 million tons of standard coal, showing an average annual growth rate of approximately 5% [2]. With the continuous rise in energy consumption, environmental pollution issues are escalating. The surge in conventional vehicle numbers has directly resulted in heightened carbon dioxide emissions, significantly impacting the environment. In the 2021 government report of the National People’s Congress, China explicitly outlined the goals of achieving “carbon peak” by 2030 and “carbon neutrality” by 2060. Consequently, China has initiated the development of a range of policies centered on promoting new energy vehicles as a strategic solution to these challenges [3]. However, the diffusion and transformation of new energy vehicles is a multidimensional and intricate process. Their successful adoption hinges not only on technological advancements and breakthroughs but also on elevating consumers’ environmental consciousness, shifting paradigms, and enhancing and modernizing infrastructure [4]. As the primary driver for advancing this sector, technological innovation not only serves as a constant catalyst for restructuring industrial frameworks but also emerges as a critical element in attaining high-caliber industrial progress. Through ongoing technological innovation, the new energy vehicle sector can consistently overcome technological barriers, enhance product quality and performance, lower production costs, and consequently secure a more advantageous competitive stance in the market. The government has allocated significant financial support towards the advancement of new energy vehicles, primarily through direct subsidies, tax incentives, and patent subsidies, all of which serve to facilitate and drive the growth of new energy vehicles [5,6,7]. With this political support, the Chinese market for new energy vehicles has experienced rapid growth in recent years, now standing as the world’s largest. In 2023, the production and sales of new energy vehicles reached 9.857 million and 9.495 million, respectively, both showing a consistent upward trend [8], as depicted in Figure 1.
According to the discussion above and Figure 1, it is evident that the diminishing marginal effect of governmental subsidies, coupled with the rapid evolution of new energy vehicles, signifies the ascendancy of market forces as the primary catalyst for the continued advancement of new energy vehicles [9]. At this stage, consumers’ demand for new energy vehicles will significantly impact the production decisions of car manufacturers. The consumers’ intent to purchase is affected by numerous factors, with the most critical being the comprehensive lifecycle value. Evaluating the comprehensive lifecycle value of new energy vehicles is an intricate process, primarily encompassing phases such as manufacturing, operation, maintenance, and end-of-life recycling; relevant researchers have examined the lifecycle sustainability of both new energy vehicles and traditional vehicles, evaluating them through environmental, economic, and social frameworks using various models. The findings indicated that new energy vehicles outperform traditional vehicles in these assessments [10].
It is worthwhile to investigate whether the government is considering a reasonable adjustment of the subsidy intensity, whether manufacturers are considering continuing technological innovation in the context of diminishing marginal subsidy effects, and whether dealers, consumers, and manufacturers themselves are willing to choose new energy vehicles. Reducing carbon emissions has been linked to the development of new energy vehicles, according to earlier research; yet, high carbon emissions can influence customers’ decision making, which, in turn, influences the decisions of dealers and manufacturers [11]. Consequently, to tackle the previously mentioned challenges, this study uses evolutionary game theory to examine the strategic decisions made by the government, automobile manufacturers, dealers, and consumers in order to meet carbon reduction targets. Also, it examines the influence of elements such as technological innovation capacity, consumers’ preferences for low-carbon options, and the coefficient for raising carbon taxes on the strategic decisions of various stakeholders, which identifies critical factors and offers insights for the sustainable advancement of the new energy vehicle supply chain, thereby facilitating the growth of the new energy vehicle sector. Everybody involved in the evolutionary process constantly refines their tactics in an effort to maximize self-interest.
The following are the novel aspects of this study:
(1) A new supply chain simulation for energy-efficient vehicles has been developed, focusing on carbon mitigation and consumers’ preferences for low-carbon options, whereby the dealer is appointed as the sole distributor for the manufacturer.
(2) This article elucidates the elements of technological innovation and the escalation of carbon tax coefficients, which favorably influence consumers’ low-carbon inclinations. Furthermore, it examines the effects of various determinants on the strategic decisions of new energy manufacturers, dealers, governmental bodies, and consumers.
The study is structured as follows: Section 2 contains a literature review discussing the factors influencing the development of new energy vehicles and the research methods used in the new energy vehicles field. Section 3 addresses the stability of the equilibrium strategy by formulating a four-party evolutionary model involving government, manufacturers, dealers, and consumers. Section 4 delves into the simulation analysis of the evolutionary game model and examines the influence of pertinent factors on the strategic choices of the evolutionary agent. Lastly, Section 5 concludes the findings and proposes recommendations.

2. Literature Review

2.1. Factors Affecting the Development of New Energy Vehicles

Government subsidies play a crucial role in shaping the progress of emerging energy vehicles, encompassing various aspects such as subsidy structures, target recipients, and overall impacts. These subsidies typically come in the form of direct funding, technology support, and purchase incentives, all of which serve to drive advancements in the new energy sector [12]. The subsidy benefits both producers and consumers and is categorized into supply-side subsidies and demand-side subsidies [13]. In order to assess the efficacy of governmental financial assistance, numerous researchers have undertaken thorough investigations utilizing various theoretical frameworks and empirical approaches. Liu et al. [14] employed a big data-driven approach to diagnose the effects of policies in uncertain environments and investigate the evolutionary trajectory of the effectiveness path of new energy policies. Huang et al. [15] and Wang et al. [16] analyzed Chinese-listed companies in the new energy vehicle sector as research subjects to investigate the influence of governmental subsidies on corporate innovation. The findings demonstrated that governmental subsidies can stimulate new energy vehicle firms to boost investment in innovation. The aforementioned literature highlights the significant impact of government subsidies on the advancement of new energy vehicles and illustrates the government’s robust capabilities through various subsidy mechanisms during the developmental phase of these vehicles. Likewise, consumers’ buying choices play a crucial role in shaping the growth of new energy vehicles. Zhang et al. [17] undertook comprehensive research on the purchasing intention of 306 new energy vehicle owners in four Chinese cities, with the objective of investigating the primary factors affecting their decision to choose new energy vehicles. They found that green energy vehicle firms can employ eco-friendly trust and sustainable consumption to motivate consumers’ behavior in acquiring new energy vehicles. As a demographic of new energy vehicle purchasers, numerous factors influence the decision-making process when selecting to invest in electric vehicles. Manufacturers and retailers must understand consumers’ pain points in consumption to effectively develop and market electric vehicles.
The enhancement of infrastructure can facilitate the spread and advancement of new energy vehicles. Li et al. [18] utilized a neural network to precisely forecast the sales quantity of new energy vehicles, the availability of charging infrastructure, and identify the charging station demand disparities. In conclusion, recommendations for the sustainable advancement of new energy vehicles were offered by the author based on the aforementioned study. Li and Xie [19] were dedicated to examining and pinpointing two crucial driving range thresholds, furnishing electric vehicle manufacturers with a new and practical analysis tool to assist in their strategic decisions for expanding their product’s driving range. In conclusion, when the infrastructure is adequately developed, consumers’ propensity to invest in new energy vehicles is markedly enhanced; as the range and performance of electric vehicles advance, their relative superiority over conventional vehicles becomes markedly pronounced. For manufacturers, enhancing the overall quality and technological advancements of new energy vehicles can facilitate the attainment of greater profitability in the production of these vehicles.
The comprehensive evaluation of the entire lifecycle value entails the aggregation and analysis of inputs, outputs, and possible environmental repercussions throughout the lifespan of a product system. Therefore, the fundamental concept of lifecycle assessment for vehicles is to evaluate their environmental impact throughout the entire lifecycle, encompassing the extraction of raw materials, production and assembly, usage, the potential for repurposing essential components, and ultimately, the disposal and recycling process [20]. Given the comparatively elevated costs of raw materials and the sophisticated technology utilized in the production of new energy vehicles, the total lifecycle expenditure for these vehicles surpasses that of conventional vehicles [21]. Nonetheless, in contrast to conventional vehicles, the carbon emissions associated with new energy vehicles across their entire lifecycle are markedly diminished [22,23]. Additionally, the batteries utilized in new energy vehicles are amenable to recycling and secondary processing, with the average recycling rate consistently on the rise [24]. In general, new energy vehicles exhibit a superior full lifecycle value compared to conventional vehicles.

2.2. Research Model of the New Energy Vehicle Supply Chain

In recent years, there has been a growing body of research on new energy vehicles, with research perspectives continuously evolving. Some researchers examined the impact of new energy vehicle energy transition and policy incentives using techniques such as the spatial Durbin model, Super-SBM model, and two-way fixed effects model [25,26]. Some researchers concentrated on fundamental technologies in the new energy vehicle sector, such as advancing and refining battery swapping technology [27] and the strategic evaluation of charging station network design and setup [28,29], using this as a foundation to examine viable pathways for the future advancement of new energy vehicles. Nonetheless, these approaches merely illustrate the influence of a mechanism on the advancement of new energy vehicles, and do not account for the competitive dynamics among the primary stakeholders in the development of new energy vehicles, nor the interplay between evolving behaviors.
Compared to these approaches, evolutionary game theory is a theoretical framework that can systematically and dynamically analyze the strategic adjustment process between various entities. It can simulate and analyze behavioral interactions and strategic choices under specific environmental conditions, demonstrating extensive application value across multiple disciplinary fields [30]. Hou et al. [31] employed prospect theory and evolutionary game models to assess the influence of governmental subsidies on businesses engaged in eco-friendly supply chains. Wang et al. [32] proposed a three-part evolution model for manufacturing enterprises, innovative supply enterprises, and potential demand enterprises. They analyzed how command-controlled and market-driven environmental regulations influence the spread of green technology innovation within manufacturing enterprises. The applications in the realm of new energy vehicles are outlined below. Wang et al. [33] utilized evolutionary game analysis to investigate the influence of the behavioral choices made by different entities on reducing carbon emissions during the entire lifecycle of new energy vehicles in China. Guan et al. [34] employed a stochastic evolutionary game model to examine the factors affecting consumers’ adoption of new energy vehicles, focusing on interactions between the government and consumers. Tang and colleagues [35] developed an evolutionary game model to examine how consumers’ purchase intent influences the growth of the new energy vehicle sector post-subsidy phase. Nie et al. [36] conducted an evolutionary game analysis to investigate the impact of carbon trading on supporting consumers’ adoption of new energy vehicles. Chen et al. [37], Wang et al. [38], and Yu et al. [39] all posited that green credit and government subsidies are catalysts for advancing the new energy vehicle industry. To conclude, researchers have offered comprehensive insights into how governmental financial support and consumers’ buying behaviors facilitate the advancement of the new energy vehicle sector. Nevertheless, in advancing the new energy vehicle sector that emphasizes carbon mitigation and aligns with consumers’ preferences for low-carbon solutions, it is insufficient to merely evaluate the effects of unilateral factors from the vantage points of government, consumers, and green credit entities. A comprehensive analysis must consider the intricate interconnections among government entities, automotive manufacturers, dealerships, and consumers. This research will investigate the government’s methodical distribution of subsidies and the impact of technological innovation on manufacturers’ propensity to produce new energy vehicles. It will also take into account consumers’ preferences for low-carbon options and the achievement of carbon reduction targets. The findings will yield recommendations for both policy formation and corporate strategic decisions. Furthermore, prior research has frequently examined the interactions among the government, manufacturers, and consumers. This article incorporates the dealer entity, which serves as the sole retailer for the manufacturer, and formulates a four-party evolutionary game model involving the government, automobile manufacturers, dealers, and consumers to evaluate the strategic evolution process among the four stakeholders.

3. Evolutionary Game Model of the New Energy Vehicle Supply Chain

3.1. Problem Description

The primary reasons for automobile manufacturers and dealers to select for producing and selling new energy vehicles include adjustments in policy implementation, shifts in consumers’ demand, and modifications in market structure. These factors can enhance the pace of the development of new energy vehicles [40]. The enhancement of consumers’ environmental awareness and purchasing demand, along with the shift in consumption patterns at the broader social awareness level, are pivotal pillars enabling the advancement of new energy vehicles. Afterwards, the key factors influencing consumers’ choice of new energy vehicles include perceived value, user experience, emission reduction costs, driving range, subsidy intensity, and other related aspects [41]. In this research, a game model will be developed to depict the evolution of the automotive supply chain involving the government, manufacturers, dealers, and consumers. The four entities exhibit specific logical interconnections.
This section could potentially be segmented with subheadings. It is intended to offer a brief and accurate explanation of the experimental findings, their analysis, and the conclusions that can be inferred from the experiments (Figure 2).
The government’s strategic decision lies in {providing subsidies, refraining from providing subsidies}. As the custodians of state-owned capital, the government has the option to provide subsidies to manufacturers, dealers, and customers engaged in technological progress, including tax incentives, direct funding, and a range of other subsidy types. The decision choices available to manufacturers are {produce new energy vehicles, produce traditional vehicles}; the decision options available to dealers include {selling new energy vehicles, selling traditional vehicles}. The decision options available to consumers include {purchasing new energy vehicles, purchasing traditional vehicles}; consumers opting for new energy vehicles can benefit from preferential policies that reduce vehicle purchase tax.

3.2. Symbols and Assumptions

To develop a gaming model for different stakeholders in the supply chain of new energy vehicles, this research focuses on the government, manufacturers, dealers, and consumers as research subjects and formulates the following assumptions:
Assumption 1.
The four stakeholders exhibit bounded rationality [42], consistently adapting their strategies in response to alterations in the game dynamics, thereby determining the evolutionarily stable strategy throughout the progression of the game [43].
Assumption 2.
The initial probability of the government choosing a subsidy strategy is x [ 0 , 1 ] , then the initial probability of choosing a non-subsidy strategy is 1 x . The initial probability for manufacturers to select a strategy for producing new energy vehicles is y [ 0 , 1 ] , and the initial probability for producing traditional vehicle strategies is 1 y . The initial probability for dealers to choose to sell new energy vehicles is z [ 0 , 1 ] , and the initial probability for dealers to choose to sell traditional vehicles is 1 z . The initial probability for consumers to purchase new energy vehicles is m [ 0 , 1 ] , and the initial probability for choosing to purchase traditional vehicle strategies is 1 m .
Assumption 3.
The government has the potential to enhance the comprehensive economic, social, and environmental advantages of the supply chain by implementing subsidies [44]. Therefore, this bolsters the government’s self-worth and yields advantages, including the enhancement of its public perception. When the government fails to offer subsidies, renewable energy companies may forgo investment in innovative research for new energy vehicles to prevent revenue declines resulting from higher expenses. Consequently, they tend to sustain a larger proportion of traditional vehicle production, which exacerbates environmental pollution. As a staunch advocate for environmental sustainability, it is imperative that the government takes measures to regulate environmental pollution while also shouldering the financial burden of remediation efforts.
Assumption 4.
The proportion of new energy vehicles produced by manufacturers is δ , while the proportion of traditional vehicles produced is 1 δ . Due to the necessity for new technologies to facilitate the manufacturing of new energy vehicles, as technology advances continuously, the level of technological maturity is progressively enhancing. This study establishes the coefficient of technological innovation level as a > 1 , which diminishes as time elapses. In the context of carbon reduction efforts, the production of conventional vehicles will elevate the environmental impact; in compliance with applicable regulations, the tax increment factor for conventional vehicles will be established at b 1 .
Assumption 5.
The adoption of clean energy in new energy vehicles can effectively mitigate harm to the atmospheric environment and ecosystem, improve consumers’ environmental well-being, address economic and environmental challenges, and provide added benefits such as brand value, loyalty, and market share to manufacturers.
Assumption 6.
Due to the steady technological advancement and lower marketing investment in traditional vehicles, the sales profit of electric vehicles is inferior to that of conventional vehicles. Manufacturers produce new energy vehicles in proportion, and dealers also maintain the same proportion for sales. To boost the sales of new energy vehicles, manufacturers allocate funds for dealership marketing efforts. These investments are geared towards increasing the revenue generated from new energy vehicles sales. Dealers are exclusively authorized by the manufacturers, and if they do not sell new energy vehicles, the manufacturers can reduce traditional cars with the same supply ratio. Moreover, as stipulated in the “Automobile Sales Management Measures”, dealers are required to fulfill the responsibility of providing after-sales service to customers.
Due to the necessity of model analysis, some mathematical symbols will be utilized in this investigation and their corresponding interpretations are presented in Table 1.
Based on the assumptions stated above, we have established the parameters mentioned in Table 1 to compute the overall revenue of the government, manufacturers, dealers, and consumers, aiming to streamline the model’s calculation process. Based on the parameters set in Table 1, we calculate the total benefits obtained by the four entities under different strategy choices and establish a benefit matrix (Table 2). In Table 2, we briefly denote new energy vehicles as NEV and denote traditional vehicles as TV.
Table 2 is divided into four parts, each with four rows, representing the total revenue of government, manufacturers, dealers, and consumers under different strategy combinations. In the first row of the first section of Table 2, for instance, R t C s C d C m denotes the aggregate government income generated from {government subsidies, new energy vehicle manufacturing, new energy vehicle sales by dealers, and new energy vehicle purchases by consumers}.The entire revenue of the manufacturers in this strategy combination is represented by the formula δ π 1 + R s + λ R p + C s a C T i L in the first column of the first section. The entire revenue of the dealers in this strategy combination is represented by the formula R 1 + L + R 3 + λ R p + C d C t in the first column of the first section; the formula R 4 + C m P s + θ in the first column of the first part represents the total revenue of the customers in this strategy combination; and so on.

3.3. Analysis of the Quadrilateral Evolutionary Game Model

3.3.1. The Expected Returns of the Four Parties Involved in the Game

Based on the benefit matrix of the government, manufacturers, dealers, and consumers illustrated in Table 2, we can derive the expected returns of the four parties as follows.
(1) Let the expected benefit of the government choosing subsidies be E x 1 and let not choosing subsidies be E x 2 . Let E x be the average benefit of the government. Next, we have access to
E x 1 = y z m ( R t C s C d C m ) + y z ( 1 m ) ( R t C s C d ) + y m ( 1 z ) ( R t + P 2 C s C m ) + y ( 1 z ) ( 1 m ) ( R t + P 2 C s ) + ( 1 y ) z m ( R t + P 1 C p C d C m ) + ( 1 y ) z ( 1 m ) ( R t + P 1 C p C d ) + ( 1 y ) ( 1 z ) m ( R t + P 1 + P 2 C p C m ) + ( 1 y ) ( 1 z ) ( 1 m ) ( R t + P 1 + P 2 C p ) ,
E x 2 = y z m C p y z ( 1 m ) C p + y ( 1 z ) ( P 2 C p ) + ( 1 y ) z ( P 1 C p ) + ( 1 y ) ( 1 z ) ( P 1 + P 2 C p ) ,
E x = x E x 1 + ( 1 x ) E x 2 .
(2) Let the manufacturers’ expected return on producing new energy vehicles be E y 1 , the expected return on producing traditional vehicles be E y 2 , and the manufacturers’ average return be E y . Then we can get
E y 1 = x z m ( δ π 1 + R s + C s + λ R p a C T i L ) + x z ( 1 m ) ( δ π 1 + R s + C s a C T i L ) + ( 1 x ) z m ( δ π 1 + R s + λ R p a C T i L ) + ( 1 x ) z ( 1 m ) ( δ π 1 + R s a C T i L ) + x ( 1 z ) m ( δ π 1 + R s + C s + λ R p a C T i ) + x ( 1 z ) ( 1 m ) ( δ π 1 + R s + C s a C T i ) + ( 1 x ) ( 1 z ) m ( δ π 1 + R s + λ R p a C T i ) + ( 1 x ) ( 1 z ) ( 1 m ) ( δ π 1 + R s a C T i ) ,
E y 2 = ( 1 δ ) π 2 C b T i P 1 ,
E y = y E y 1 + ( 1 y ) E y 2 .
(3) Assuming that the dealers’ anticipated profit from producing new energy vehicles is E z 1 , the anticipated profit for dealers opting to sell conventional vehicles is E z 2 , and the average return for dealers is E z . Then we can get
E z 1 = x y m ( R 1 + L + R 3 + λ R p + C d C t ) + x y ( 1 m ) ( R 1 + L + R 3 + C d C t ) + ( 1 x ) y m ( R 1 + L + R 3 + λ R p C t ) + ( 1 x ) ( 1 m ) y ( R 1 + L + R 3 C t ) + ( 1 y ) ( 1 m ) ( R 2 C t )
E z 2 = y ( ( 1 δ ) R 2 C t P 2 ) + ( 1 y ) ( 1 m ) ( R 2 C t P 2 ) ,
E z = z E z 1 + ( 1 z ) E z 2 .
(4) Assuming that the expected return for consumers choosing to purchase new energy vehicles is E m 1 , the expected return for purchasing traditional vehicles is E m 2 , and the average return for consumers is E m . We can proceed with
E m 1 = x y z ( R 4 + C m P s + θ ) + ( 1 x ) y z ( R 4 P s + θ ) ,
E m 2 = R 5 P t ,
E m = m E m 1 + ( 1 m ) E m 2 .

3.3.2. The Replication Dynamic Equation and Evolutionary Stability Strategy of the Four Parties

(1) Based on the expressions of E x 1 and E x 2 , the replication dynamic equation for the government’s choice of subsidy strategy can be derived as follows:
F x = d x d t = x ( E x 1 E x ) ,
That is,
F x = x x 1 m C m R t C P y P 1 z C P m y C P y z + C s y + C d z + C P z + P 1 y z + C P m y z ,
According to Equation (14), we can discuss the impact of changes in the probability ( y ) of manufacturers producing new energy vehicles on the government’s strategy choices.
Let y 0 = ( L + R 1 R 2 + R 3 + δ R 2 ) y + P 2 + C d x y ( 1 y ) ( P 2 x C d ) λ R p y .
If y = y 0 , we can conclude that F x 0 , at this point, x belongs to the range of [0, 1] and is an evolutionary stable point.
If y y 0 , and we let F x = 0 , we can obtain two evolutionary stable points, namely x = 0 and x = 1 .
Theorem 1.
(i) If 0 < y < y 0 , then the evolutionary stability strategy is x = 1 . (ii) If y 0 < y < 1 , then the evolutionary stability strategy is x = 0 .
Proof of Theorem 1.
According to the stability theorem of differential equations, it is known that when the probability ( x ) of the government choosing the “subsidy” strategy satisfies F x = 0 and d F x d x < 0 , then x is the evolutionary stable point of the government’s strategy selection.
The first-order partial derivative of F x with respect to x is
d F x d x = ( 2 x 1 ) ( m C m R t C P y P 1 z C P m y C P y z + C s y + C d z + C P z + P 1 y z + C P m y z ) ,
(i) If 0 < y < y 0 , according to F x x = 1 = 0 and d F x d x x = 1 < 0 , we can solve that x = 1 is an evolutionary stable point. It demonstrates that the government ultimately chooses the “provide subsidy” strategy when the probability of manufacturers selecting the “production of new energy vehicles” strategy is less than y 0 .
(ii) If y 0 < y < 1 , according to F x x = 0 = 0 and d F x d x x = 0 < 0 , we can solve that x = 0 is an evolutionary stable point. This suggests that the government finally decides to “not provide subsidy” when manufacturers select the “production of new energy vehicles” approach over y 0 .
(2) According to E y 1 and E y 2 , the replication dynamic equation for manufacturers to choose the production strategy of new energy vehicles can be obtained as follows:
F y = d y d t = y ( E y 1 E y ) = y 1 y C + P 1 + R s T i π 2 a C + b T i + x C s z L + δ π 1 + δ π 2 + m λ R p ,
Let z 0 = ( 1 a ) C + R s ( 1 b ) T i π 2 + x C s + δ ( π 1 + π 2 ) + P 1 + m λ R p L .
If z = z 0 , we can conclude that F y 0 , at this point, y belongs to the range of [ 0 , 1 ] and is an evolutionary stable point.
If z z 0 , let F y = 0 , we can obtain two evolutionary stable points, namely y = 0 and y = 1 . □
Theorem 2.
(i) If 0 < z < z 0 , then the evolutionary stability strategy is y = 0 . (ii) If z 0 < z < 1 , then the evolutionary stability strategy is y = 1 .
Proof of Theorem 2.
The first-order partial derivative of F y with respect to y is
d F y d y = ( 1 2 y ) C + P 1 + R s T i π 2 a C + b T i + x C s z L + δ π 1 + δ π 2 + m λ R p ,
(i) If 0 < z < z 0 , according to F y y = 0 = 0 and d F y d y y = 0 < 0 ,we can solve that y = 0 is an evolutionary stable point.
(ii) If z 0 < z < 1 , according to F y y = 1 = 0 and d F y d y y = 1 < 0 , it can be concluded that y = 1 is an evolutionary stable point. □
(3) According to E z 1 and E z 2 , the replication dynamic equation for dealers to choose sales strategies for new energy vehicles can be obtained as follows:
F z = d z d t = z ( E z 1 E z ) = z 1 z ( 1 m ) P 2 + ( L + R 1 R 2 + R 3 + δ R 2 ) y + C d m x + C d x y + m y P 2 C d m x y + λ R p m y ,
Let m 0 = ( L + R 1 R 2 + R 3 + δ R 2 ) y + P 2 + C d x y ( 1 y ) ( P 2 x C d ) λ R p y .
If m = m 0 , we can conclude that F z 0 , at this point, z belongs to the range of [ 0 , 1 ] and is an evolutionary stable point.
If m m 0 , let F z = 0 , we can obtain two evolutionary stable points, namely y = 0 and y = 1 .
Theorem 3.
(i) If 0 < m < m 0 , then the evolutionary stability strategy is z = 0 . (ii) If m 0 < m < 1 , then the evolutionary stability strategy is z = 1 .
Proof of Theorem 3.
The first-order partial derivative of F z with respect to is
d F z d z = ( 1 2 z ) ( 1 m ) P 2 + ( L + R 1 R 2 + R 3 + δ R 2 ) y + C d m x + C d x y + m y P 2 C d m x y + λ R p m y ,
(i) If 0 < m < m 0 , according to F z z = 0 = 0 and d F z d z z = 0 < 0 , it can be concluded that z = 0 is an evolutionary stable point.
(ii) If m 0 < m < 1 , then according to F z z = 1 = 0 and d F z d z z = 1 < 0 , it can be concluded that z = 1 is an evolutionary stable point. □
(4) According to E m 1 and E m 2 , the replication dynamic equation for consumers when choosing to purchase new energy vehicles is
F m = d m d t = m ( E m 1 E m ) = m 1 m P t R 5 + C m x y z + ( R 4 P s + θ ) y z ,
Let x 0 = R 5 P t ( R 4 P s + θ ) y z C m y z .
If x = x 0 ,we can conclude that F m 0 , at this point, m belongs to the range of [ 0 , 1 ] and is an evolutionary stable point.
If x x 0 , let F m = 0 , we can obtain two evolutionary stable points, namely m = 0 and m = 1 .
Theorem 4.
(i) If 0 < x < x 0 , then the evolutionary stability strategy is m = 0 . (ii) If x 0 < x < 1 , then the evolutionary stability strategy is m = 1
Proof of Theorem 4.
The first-order partial derivative of F m with respect to m is
d F m d m = ( 1 2 m ) P t R 5 + C m x y z + ( R 4 P s + θ ) y z ,
(i) If 0 < x < x 0 , then according to F m m = 0 = 0 and d F m d m m = 0 < 0 , it can be concluded that m = 0 is an evolutionary stable point.
(ii) If x 0 < x < 1 , then according to F m m = 1 = 0 and d F m d m m = 1 < 0 , it can be concluded that m = 1 is an evolutionary stable point. □

3.3.3. The Stability Analysis of Strategy Combinations

This study will go on to analyze the combination of evolutionary stability strategies under the combined action of the four parties, based on the previously discussed strategies and the impact of certain criteria on strategy selection. Next, we will create a four-party replication dynamic group with customers, dealers, manufacturers, and the government as members:
F x = x x 1 m C m R t C P y P 1 z C P m y C P y z + C s y + C d z + C P z + P 1 y z + C P m y z F y = y 1 y C + P 1 + R s T i π 2 a C + b T i + x C s z L + δ π 1 + δ π 2 + m λ R p F z = z 1 z ( 1 m ) P 2 + ( L + R 1 R 2 + R 3 + δ R 2 ) y + C d m x + C d x y + m y P 2 C d m x y + λ R p m y F m = m 1 m P t R 5 + C m x y z + ( R 4 P s + θ ) y z ,
Theorem 5.
The replication dynamic group consists of 16 balanced strategy groups.
Proof of Theorem 5.
Let F x = 0 ,   F y = 0 ,   F z = 0 ,   F m = 0 , then, based on the research of Ritzberger and Selten [45,46], we can conclude that in the presence of multi-agent evolutionary games, the stable solution of evolutionary games is strictly Nash equilibrium, also known as pure strategy. This can lead to the conclusion that in the replication dynamic group of government, manufacturers, dealers, and consumers, there are a total of 16 eligible equilibrium strategy combinations, which are as follows: ( 0 , 0 , 1 , 0 ) , ( 0 , 1 , 1 , 0 ) , ( 1 , 0 , 1 , 0 ) , ( 0 , 0 , 1 , 1 ) , ( 1 , 1 , 1 , 0 ) , ( 1 , 0 , 1 , 1 ) , ( 0 , 1 , 1 , 1 ) , ( 1 , 1 , 1 , 1 ) , ( 0 , 0 , 0 , 0 ) , ( 0 , 1 , 0 , 0 ) , ( 0 , 0 , 0 , 1 ) , ( 1 , 0 , 0 , 0 ) , ( 0 , 1 , 0 , 1 ) , ( 1 , 0 , 0 , 1 ) , ( 1 , 1 , 0 , 0 ) , and ( 1 , 1 , 0 , 1 ) . □
Remark 1.
The stability judgment of the strategy combination of the four-party game subject can be based on Lyapunov’s first rule [47,48]. To discuss the stability of 16 equilibrium strategy groups in the four-party game of government, manufacturers, distributors, and consumers, consider constructing the Jacobian matrix [49,50] of the four-party replication dynamic group:
J = F x x F x y F x z F x m F y x F y y F y z F y m F z x F z y F z z F z m F m x F m y F m z F m m .
Let A = m C m R t ( C P + C P m C s ) y ( P 1 C d C P ) z ( C P P 1 + C P m ) y z ,
B = ( 1 a ) C + P 1 + R s ( 1 b ) T i z L ( 1 δ ) π 2 + x C s + δ π 1 + m λ R p ,
and
C = ( 1 m ) P 2 + ( L + R 1 R 2 + R 3 + δ R 2 ) y + C d m x + ( 1 m ) C d x y + ( P 2 + λ R p ) m y .
The specific calculation results are shown in Table 3.
Based on the calculated Jacobian matrix, we can calculate the eigenvalues of the 16 equilibrium points individually, as illustrated in Table 4 and Table 5; specifically, dealers opting for the “sell new energy vehicles” strategy can observe the eigenvalues of each equilibrium point in Table 4. Dealers that choose the “sell traditional vehicles” approach can examine the eigenvalues associated with each equilibrium point listed in Table 5.
Theorem 6.
Let A 1 = R t + C p C m C d C s and A 2 = ( 1 a ) C ( 1 b ) T i L ( 1 δ ) π 2 + λ R p + P + R s + δ π 1 . In the case where dealers choose to sell new energy vehicles (Table 4), there are three possible evolutionary stable strategies in the four-party evolutionary game of the new energy vehicle system (ESS), which are as follows:
(i) Under the condition (E1): A 1 < 0  and A 2 > 0 , the evolutionary stability point is ( 0 , 1 , 1 , 1 ) .
(ii) Under the condition (E3): A 1 > 0  and A 2 < 0 , the evolutionary stability point is ( 1 , 0 , 1 , 1 ) .
(iii) Under the condition (E2): A 1 > 0  and A 2 > 0 , the evolutionary stability point is ( 1 , 1 , 1 , 1 ) .
Proof of Theorem 6.
The eigenvalues of the Jacobian matrix at the equilibrium point must be negative according to Lyapunov’s first criterion.
(i) Combined with Table 4 and the condition (E1), if A 1 < 0 , then we can conclude that the total amount of subsidies chosen by the government, which is the sum of the subsidies for manufacturers, dealers, and consumers, is less than the sum of the intangible benefits obtained by the government from subsidies and environmental pollution control costs; meanwhile, if A 2 > 0 , then we can obtain that manufacturers generate greater profits from producing new energy vehicles than producing traditional vehicles. Under these conditions, ( 0 , 1 , 1 , 1 ) is the evolutionary stable point, that is, {government does not offer subsidy, manufacturers produce new energy cars, dealers sell new energy vehicles, customers purchase new energy vehicles} is the evolutionary stability strategy employed in the four-party evolutionary game.
As long as condition (E1) exists, the government will decide to “not provide subsidy”, since the overall benefit of government subsidies is less than the expense. Due to the high subsidy costs for manufacturers, dealers, and consumers, as well as the favorable development situation of new energy vehicles, manufacturers generate greater profits from producing new energy vehicles than traditional vehicles. As a result, the government selects the “not provide subsidy” strategy, while manufacturers choose the “produce new energy vehicles” strategy. Dealers decide which new energy vehicles to sell when manufacturers decide to build them for profit; consumers ultimately decide to buy new energy vehicles because they are becoming more conscious of their low-carbon choices.
(ii) ESS ( 1 , 0 , 1 , 1 )  describes a scenario wherein the government offers subsidies, manufacturers opt to produce conventional vehicles, dealers market new energy vehicles, and consumers purchase new energy vehicles. As long as Table 4 is true, the criterion for  to be valid is condition (E2): A1 > 0 and A2 < 0. This observation suggests that the aggregate subsidies selected by the government, which encompass subsidies for producers, dealers, and consumers, are inferior to the cumulative intangible advantages the government acquires from subsidies and costs related to environmental pollution control; concurrently, the earnings of manufacturers engaged in the production of new energy vehicles are lower compared to those involved in traditional vehicle production. In this case, the manufacturers will choose the “produce traditional vehicles” strategy in this scenario, since the profit margin on new energy vehicle production is lower than the expenditure. When manufacturers’ technological innovations reach maturity, the capital invested in such innovations gradually decreases. As a result, the production costs of new energy vehicles also decrease, leading to profitability for manufacturers in the production of new energy vehicles; the ultimate evolutionary result will tend towards ( 1 , 1 , 1 , 1 ) .
(iii) ESS ( 1 , 1 , 1 , 1 ) embodies a strategic collaboration in which the government opts to offer subsidies, manufacturers opt to manufacture new energy vehicles, dealers opt to sell new energy vehicles, and consumers opt to purchase new energy vehicles. As long as Table 4 is true, the condition that ( 1 , 1 , 1 , 1 ) is satisfied is condition (E2): A 1 > 0 and A 2 > 0 . At this juncture, the government determines that the aggregate subsidy, encompassing support for manufacturers, dealers, and consumers, is to be less than the combined value of the intangible benefits derived from subsidies and the costs associated with environmental pollution control. Concurrently, manufacturers experience higher profits from the production of new energy vehicles as opposed to traditional vehicles. In this scenario, government subsidies yield greater benefits than expenses, and the advantages of manufacturers producing new energy vehicles surpass the costs of technological innovation investments. Dealers emulate manufacturers in promoting new energy vehicles; consumers buying new energy vehicles can provide enhanced utility value. At the moment, the whole supply chain system for new energy vehicles is exhibiting a stable and healthy development form, which is a quite good outcome.
According to the stability analysis of equilibrium points in Table 5, it can be concluded that there is no stable strategy for this evolutionary system when dealers choose to sell traditional vehicles. Next, we complete the proof of Theorem 6. □

4. Numerical Case Study

This section will analyze how strategy decisions made by the government, manufacturers, dealers, and consumers have changed over time using MATLAB 2021a tools for simulation analysis. According to the stability analysis of equilibrium points in the preceding section, the four-player game continuously adapts its behavioral strategy selections and eventually attains three sets of evolutionary stable strategies at ESS ( 0 , 1 , 1 , 1 ) , ( 1 , 0 , 1 , 1 ) , and ( 1 , 1 , 1 , 1 ) . Then, the ESS ( 1 , 1 , 1 , 1 ) , where the government selects subsidies, manufacturers opt to produce new energy vehicles, dealers decide to sell new energy vehicles, and consumers choose to purchase new energy vehicles, represents the optimal equilibrium in the four-party game within the new energy vehicle supply chain system. Therefore, the text that follows performs a simulation analysis on the evolutionary game process involving the government, manufacturers, and consumers when dealers opt to “promote new energy vehicles”. The simulation outcomes are depicted in Figure 3, validating the deductions made in the preceding text.
The parameter settings in this article mainly refer to the approach of Tan and Liao [51] and Wang et al. [52], while considering equation balance [53]. Table 6 displays the values of the primary parameters, mainly including government subsidies, technological innovation level, consumers’ low-carbon preferences, amount of purchase tax reduction and exemption, and other factors. In the table, except for the five elements, including δ , λ , a , b , and θ , the units of value of the other elements are 10,000.
In order to assess the accuracy of the analysis findings and the logic of the model developed in this article, the impact of various parameter modifications on strategy selection will be examined in the text that follows.

4.1. The Impact of Benefits R t on the Government’s Strategy Choices

Due to the government’s financial backing, manufacturers can more confidently engage in the research and invention of new energy technologies when the government adopts the “provide subsidy” plan, which encourages further advancements in the technology of new energy vehicles. The profit margin that dealers receive from the sale of new energy vehicles has increased dramatically. Meanwhile, consumers who choose to purchase new energy vehicles over traditional cars can take advantage of more favorable legislative subsidies. The government’s incentive scheme has been crucial in boosting the popularity of new energy cars, enhancing the government’s standing, and subtly advancing the general welfare of the populace and economy. As a result, the main objective will be to examine how the government’s strategy decisions are affected by modifications in benefit value R t . Under condition (E3), and keeping other parameters unchanged, take values for R t separately. Figure 4 illustrates how the government’s strategy selection has changed over time for different R t values.
From Figure 4, it can be seen that as the efficiency benefit value of the government subsidy strategy increases from 5 to 13, the time for the government to implement the “subsidy” stable strategy gradually shortens, and the speed of selecting stable strategies continues to accelerate. The primary driving force behind it is the quantity of subsidies, and the size of these funds is a critical motivator for encouraging the ongoing development and growth of the new energy vehicle market. Simultaneously, the implementation of government subsidy programs has not only accelerated the market’s development for new energy vehicles but also encouraged the modernization and transformation of associated industry chains while also reaping important economic and social rewards including reduced emissions and environmental protection, improved energy structure, etc. As a result, the government is more likely to use subsidies as a key tool to encourage the growth of the new energy vehicle sector.

4.2. The Impact of a on the Strategic Choices of Manufacturers and Governments

Manufacturers who choose the “production of new energy vehicles” plan must devote both financial and human resources to the new energy vehicles’ research and development. In order to track how the development of new energy vehicles affects technological innovation at level a  and influences the strategic decisions made by governments and manufacturers, presuming that condition (E3) is met, The analysis focuses on the evolution of government and manufacturer strategy choices under varying a  values over time, while maintaining other parameters as constant, as depicted in Figure 5 and Figure 6.
As seen in Figure 5, where the technological innovation coefficient is decreasing due to the ongoing maturity of the technological innovation level, the rate at which manufacturers evolve to the strategy of “producing new energy vehicles” is progressively accelerating. Manufacturers gradually cut down on their technological innovation investments as new energy vehicle production reaches a proficient level, resulting in a gradual fall in production costs. Investment in technological innovation is evidently a significant factor influencing manufacturers’ plans for creating new energy vehicles. According to Figure 6, over time, the government will eventually move toward a “no subsidy” approach. The argument is that government subsidies can encourage manufacturers to innovate in new energy vehicles, even though early-stage technical innovation is expensive for producers. As time goes by, the cost of technological innovation in the manufacturing sector typically declines, and the government’s subsidy effect is not obvious, while the government tends to not subsidize.

4.3. The Impact of Consumers’ Low-Carbon Preferences on the Strategic Choices

With the steady improvement of the quality of life, people’s expectations for the quality of their living environments are rising, leading them to adopt a more eco-friendly and low-carbon lifestyle. In light of China’s overarching strategic objectives of attaining carbon peak and carbon neutrality, there is a growing public emphasis on the principle of green development, with a strong commitment to steering society towards an environmentally friendly, healthy, and sustainable growth trajectory. Consumers’ preferences for low-carbon options are expected to influence government subsidy allocations, manufacturers’ production strategies for new energy vehicles, and dealers’ strategic decisions regarding the marketing of new energy vehicles. To observe the impact of the consumers’ low-carbon preference coefficient λ and low-carbon preference extra advantages R p  on the strategic choices of the government, dealers, and manufacturers, while keeping other parameters unchanged under condition (E3), different values of λ  and R p  were assigned for analysis. Figure 7, Figure 8 and Figure 9 depict the evolution of the techniques used by the government, dealers, and manufacturers throughout time.
Based on Figure 7, it is evident that the lines depicted exhibit a pattern of initial growth followed by a subsequent decline, suggesting that fluctuations in the consumers’ preference for low-carbon parameters substantially influence government responses. When the consumers’ low-carbon preference parameter is at its peak, the effectiveness of government subsidy initiatives is most pronounced in the initial phase, whereas the impact of non-subsidy strategies becomes more evident in the subsequent phase. This suggests that during the initial phases of new energy vehicle development, heightened consumer preferences for low-carbon options will more strongly influence government strategies, leading to an inclination towards subsidies. This approach will entail the provision of corresponding incentives for consumers to acquire new energy vehicles, thus fostering sales and supporting the overall growth of the sector. As time progresses, the government opts to systematically diminish subsidies and transition the responsibility for the development of new energy vehicles to the market.
From Figure 8, it can be seen that the impact of consumers’ low-carbon preferences on dealers’ strategy choices gradually increases over time, showing a trend of slow growth followed by rapid growth. Furthermore, the trend of dealers gravitating toward the “sales of new energy vehicles” strategy gets more pronounced when the coefficient of consumers’ low-carbon preferences and the extra benefits of low-carbon preferences rise. It can be seen that the level of consumers’ preference for low-carbon products can encourage dealers to lean towards the strategy of “selling new energy vehicles”. Figure 9 illustrates how manufacturing strategy decisions are increasingly significantly impacted by the rising customers’ low-carbon preference coefficient and the additional benefits of low-carbon preference, and show a continuous upward trend over time.

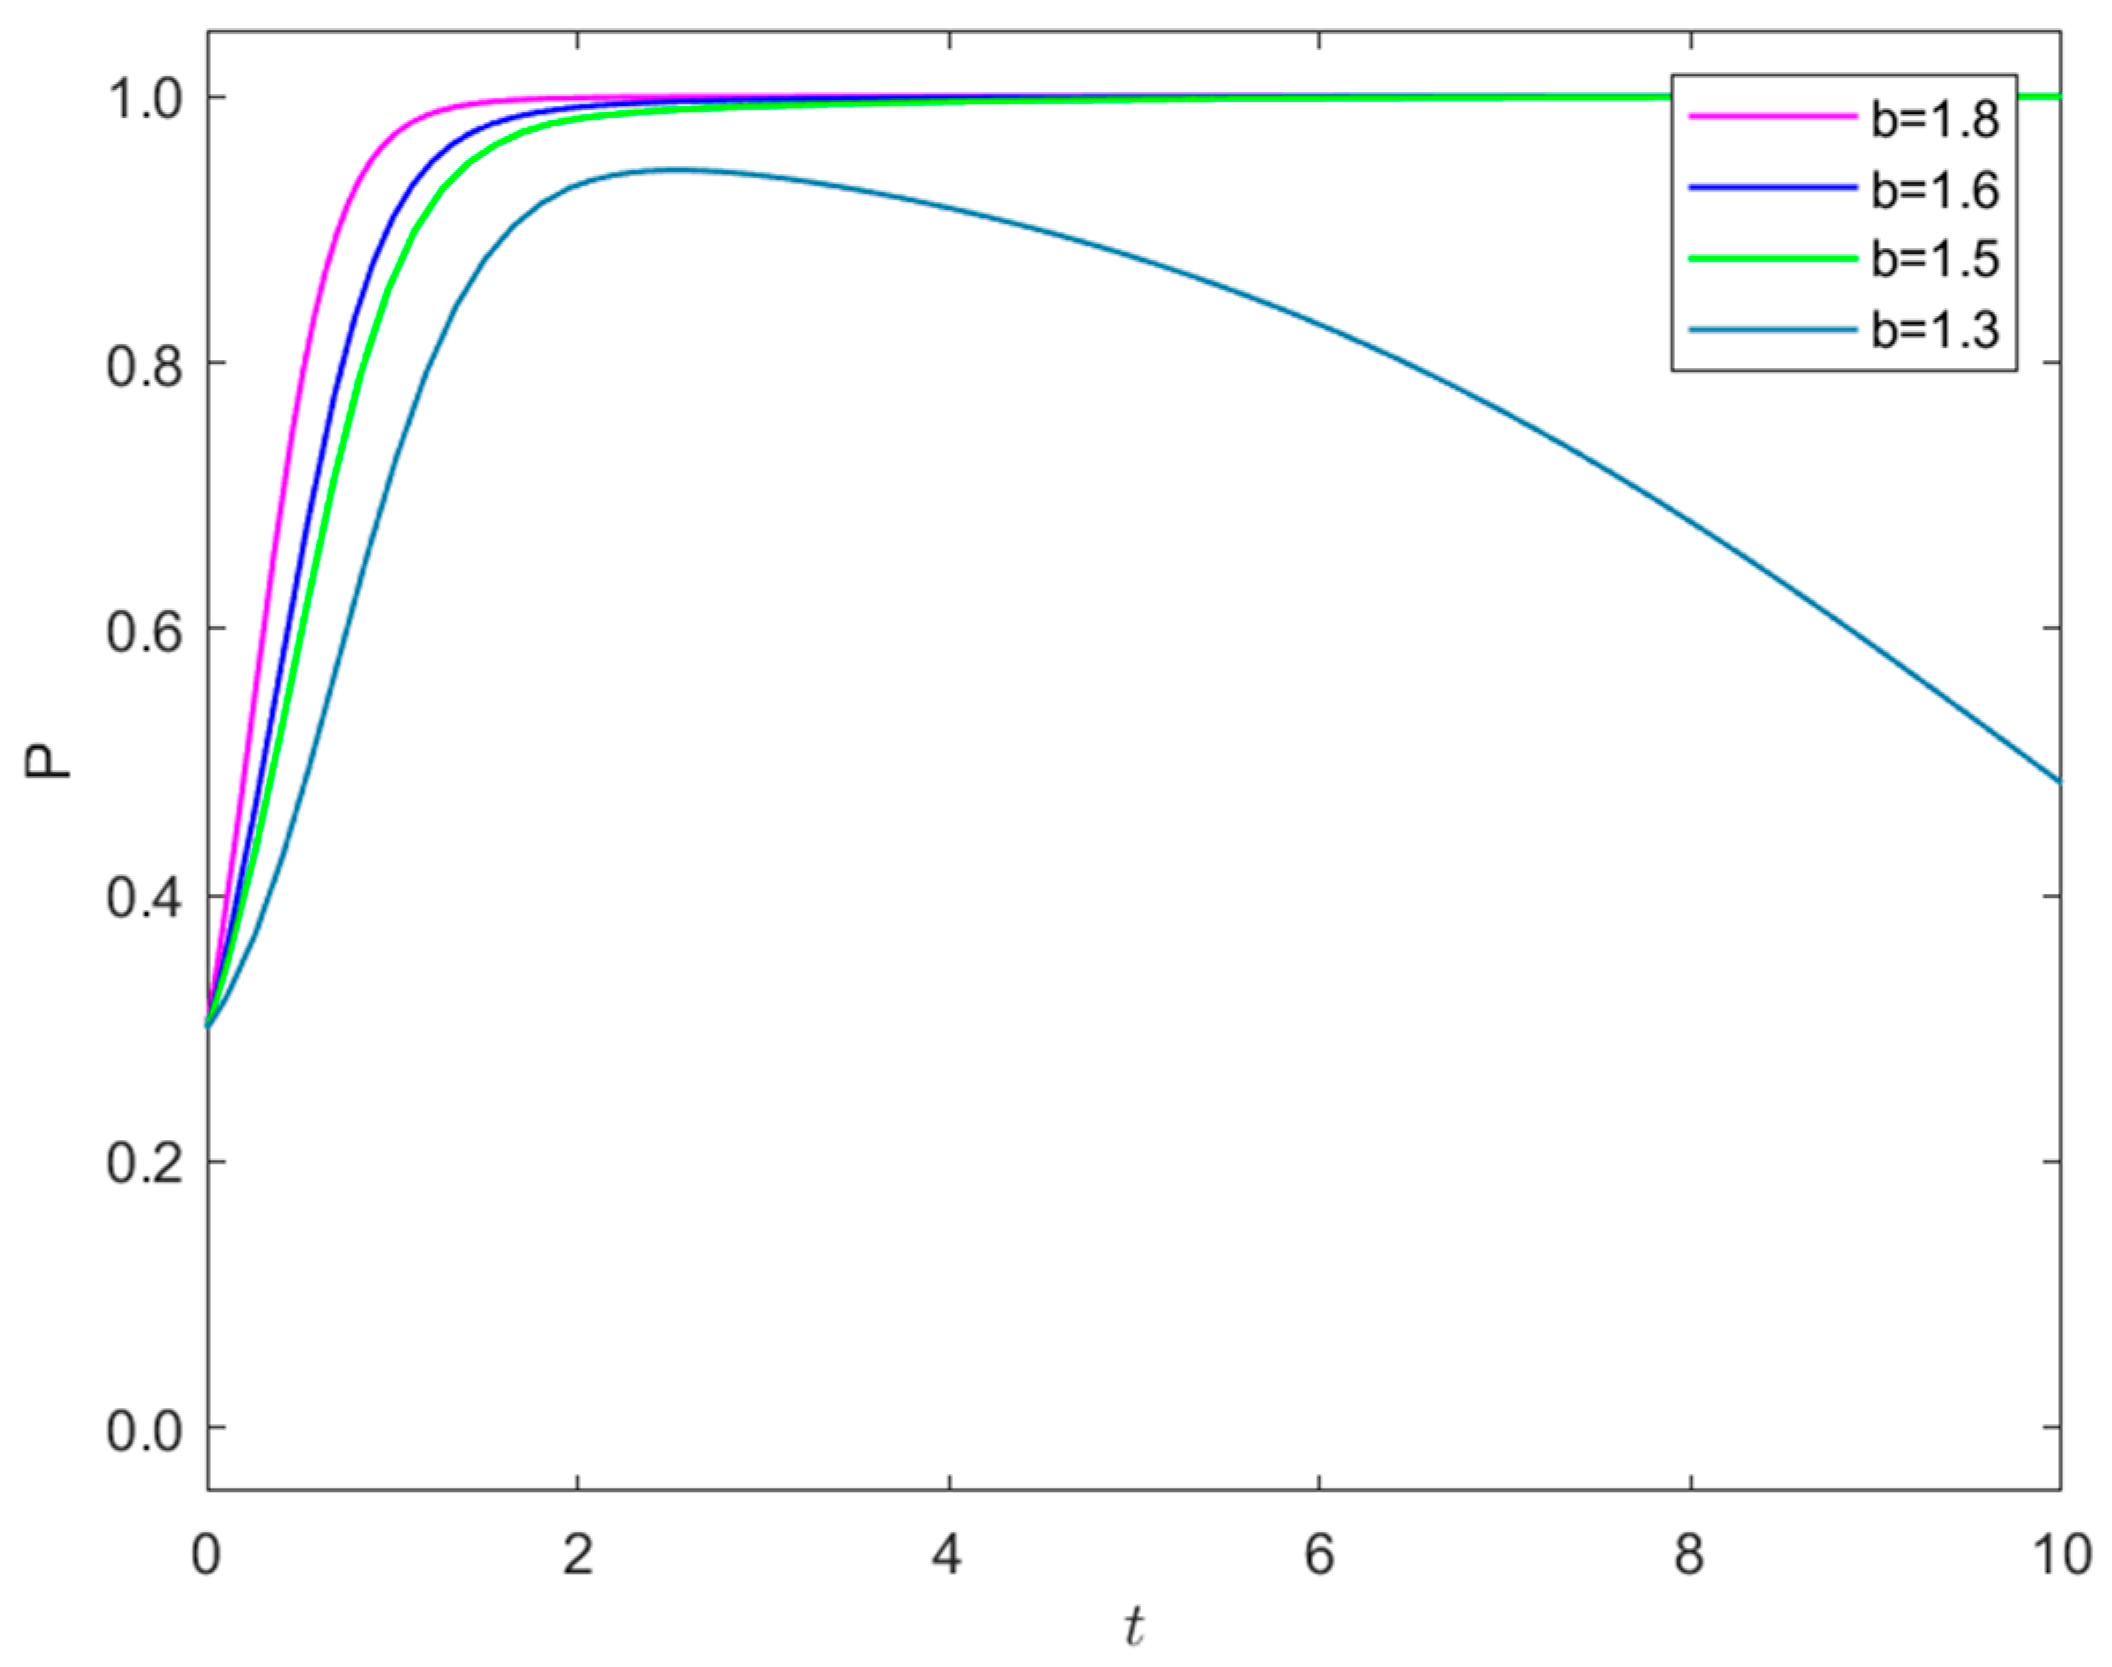
4.4. The Impact of Tax Increase Coefficient on Manufacturers’ Strategy Choices

While the manufacture of traditional automobiles may result in carbon emissions surpassing environmentally acceptable levels, the production of new energy vehicles will minimize carbon emissions. This is because traditional vehicle production is dependent on fossil fuels. To observe the impact of the tax increase coefficient b on the manufacturers’ strategy selection, under condition (E3), without altering other parameters, take values for b separately. The strategy evolution process of manufacturers under different values of b is shown in Figure 10.
From Figure 10, it is evident that the manufacturers’ strategy option switches from creating new energy vehicles to making traditional vehicles when b = 1.3 , that is, when the tax rise coefficient is minimal. As the coefficient of tax increase gradually increases, manufacturers tend to increase their strategic decisions for producing new energy vehicles. The main cause is that the expense of technological advancement in the manufacture of new energy cars is greater than the tax rise incurred in the production of conventional vehicles when the coefficient of tax increase is low. Due to pressure from running expenses, manufacturers decide to stick with producing traditional automobiles; it is evident that the tax rise coefficient significantly influences the manufacturers’ strategic decisions when it comes to creating new energy vehicles.

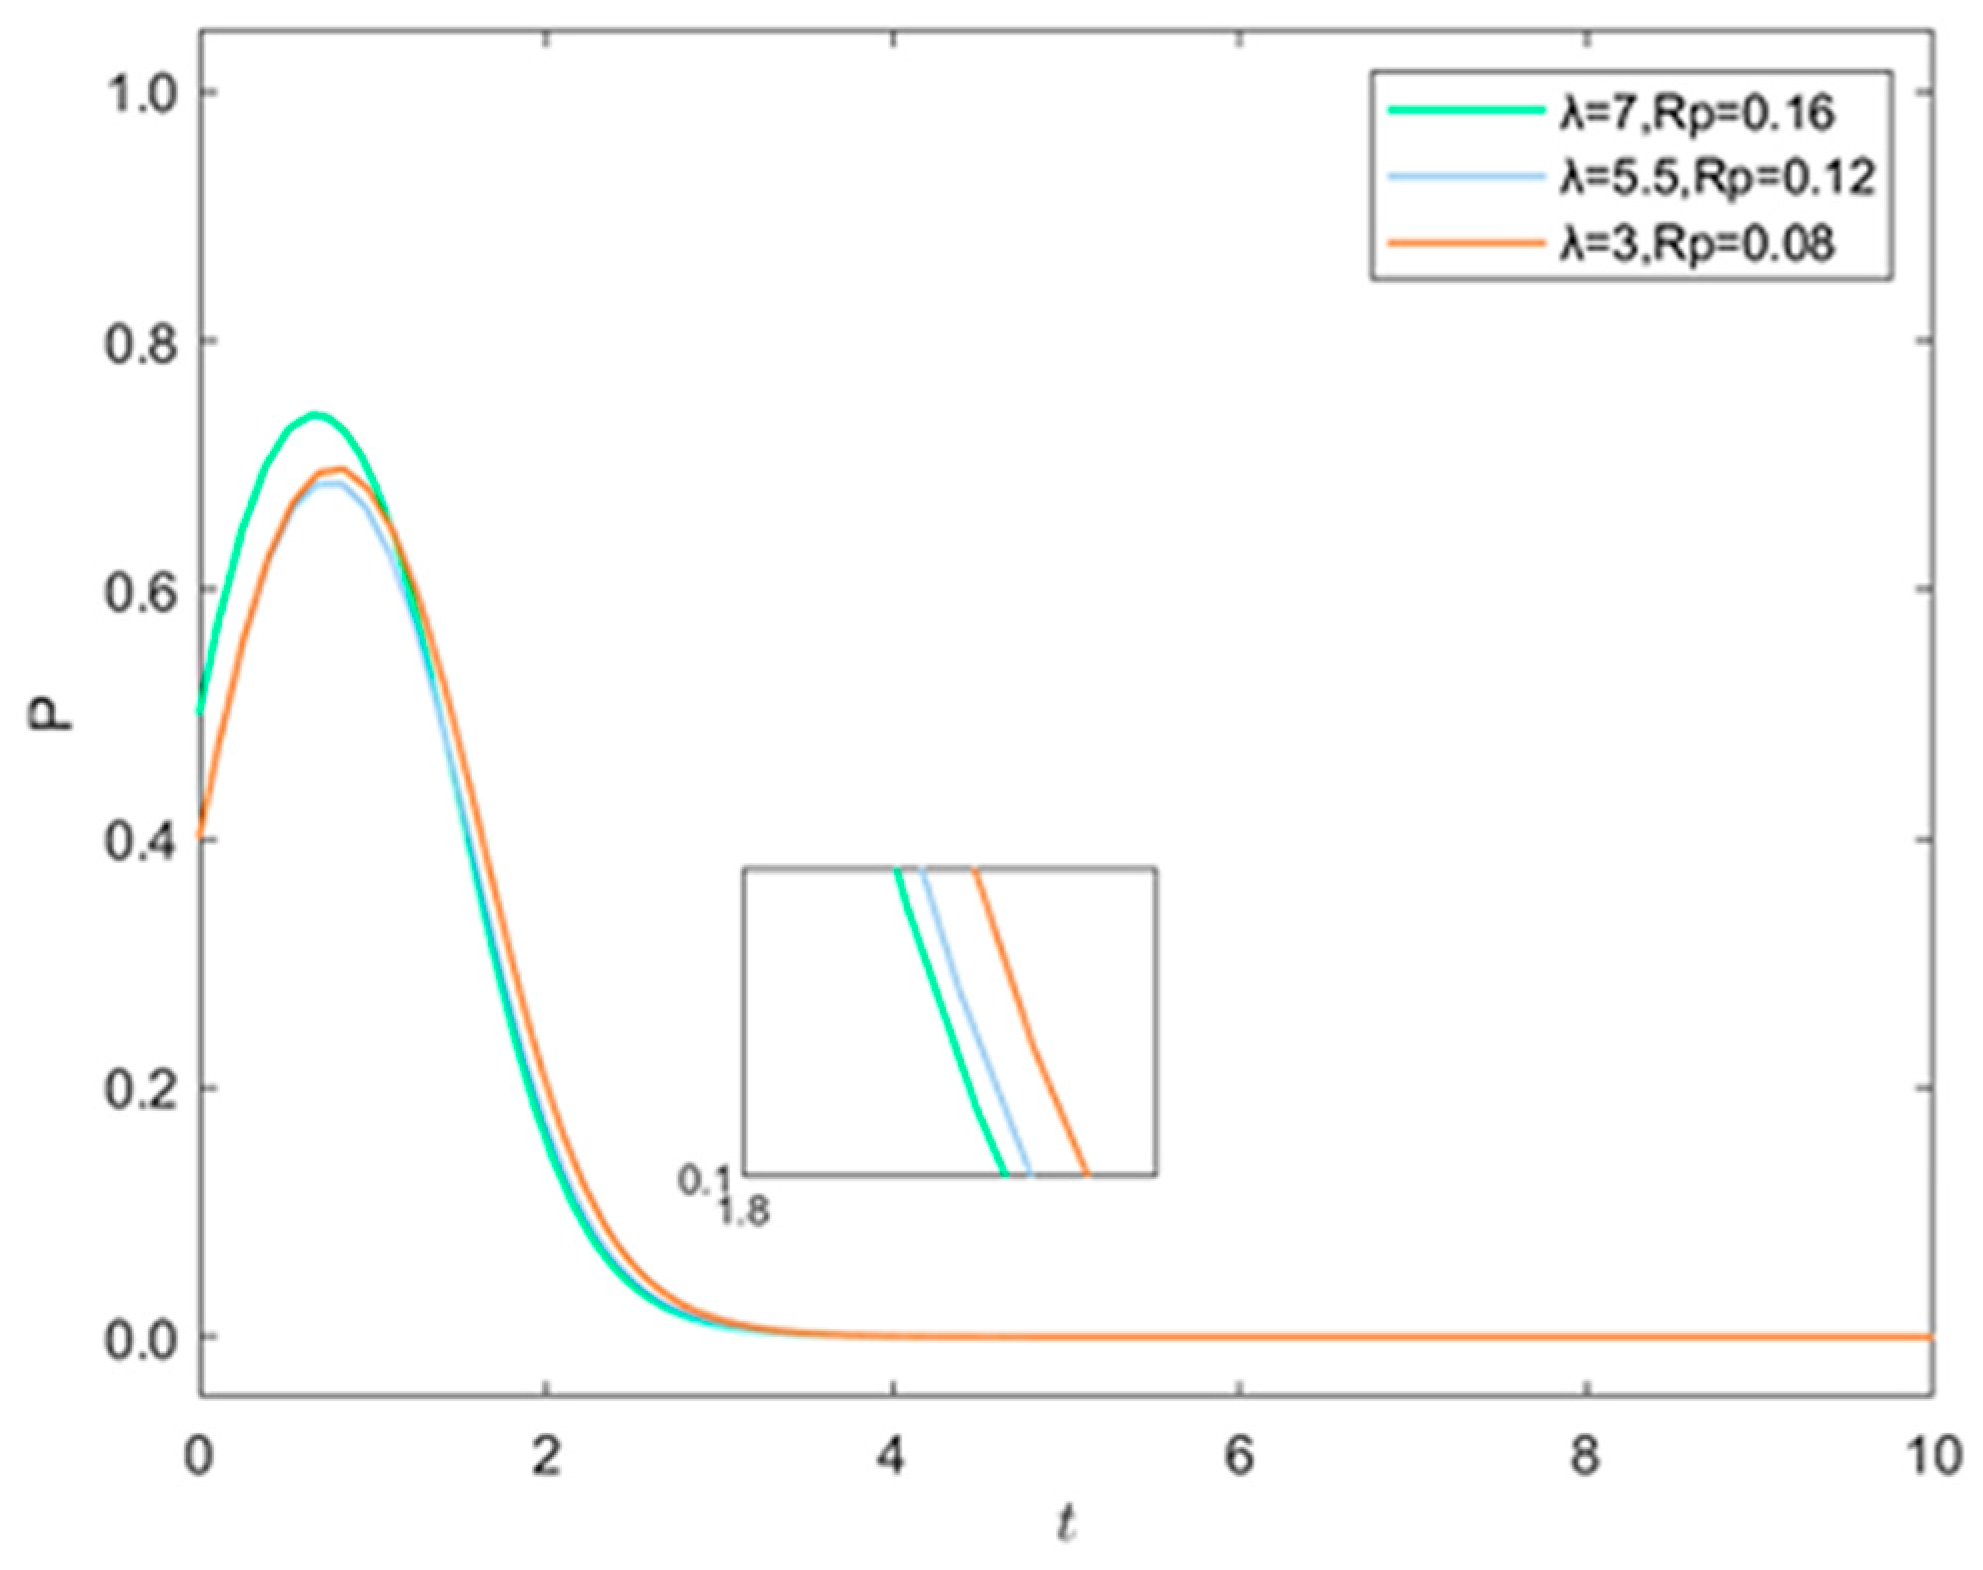
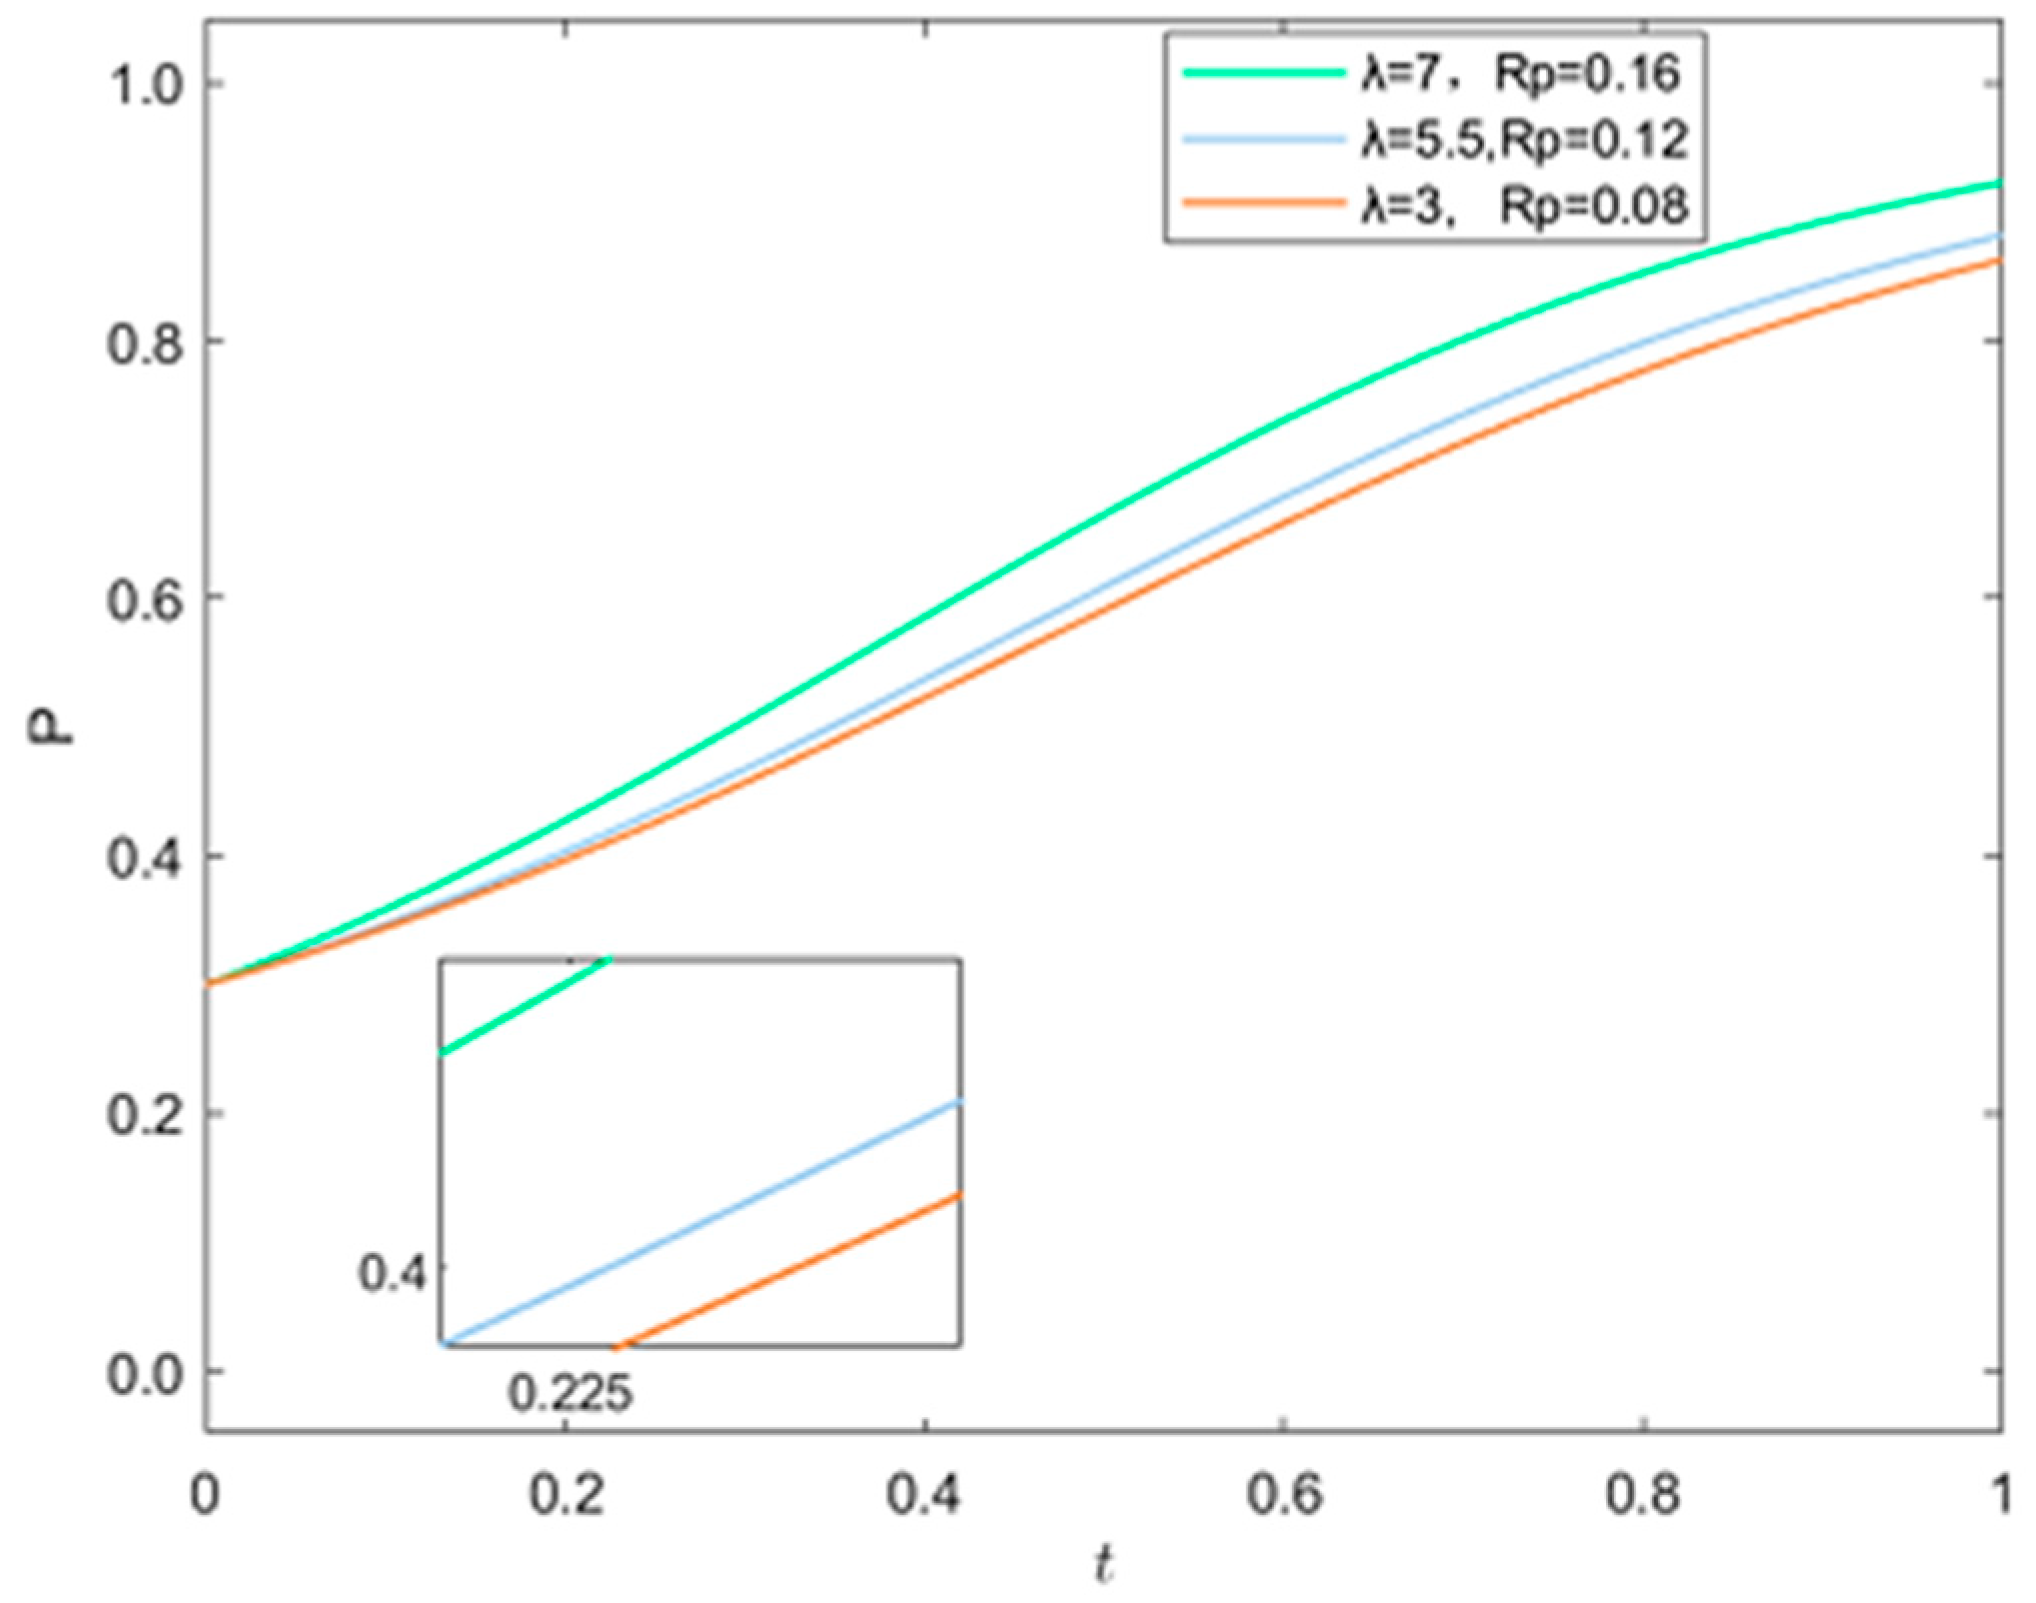
4.5. The Impact of Reducing Purchase Tax Amount on Consumers’ Strategy Choices

In the context of actively advocating and supporting consumer involvement in low-carbon consumption within the policy environment, corresponding economic subsidies or incentive mechanisms should be implemented for consumers’ low-carbon behavior to encourage them to further adopt low-carbon consumption models. When consumers choose the “purchase of new energy vehicles” strategy, according to relevant policies, consumers who purchase new energy vehicles that meet the standards are exempt from purchase tax, and according to policy regulations, the tax exemption for each new energy vehicle does not exceed 30,000 yuan.
To observe the impact of the amount of purchase tax reduction θ on consumers’ strategy choices, The values of θ are taken separately on the premise that condition (E3) is satisfied and other parameters remain unchanged. Figure 11 illustrates the evolution of consumers’ strategies over time under different values of θ .
Figure 11 illustrates that as the amount of purchase tax reduction θ is diminished, consumers’ strategic choices gradually shift towards the purchase of traditional cars over time. As the level of reduction in purchase tax gradually increases, consumers tend to purchase new energy vehicles. Furthermore, the higher the level of reduction, the faster the rate of adoption of new energy vehicles. These findings suggest that the reduction in purchase tax has a notable influence on consumers’ decision-making processes. Furthermore, there is a discernible correlation between the extent of tax reduction and vehicle prices, indicating that the current market prices of new energy vehicles are comparatively elevated.
Based on the above analyses, in order to build the sustainable development of the new energy vehicle supply chain, this article puts forward the following countermeasures:
First and foremost, as the policymaker of the new energy vehicle supply chain, the government undertakes regulatory and promotional responsibilities in advancing the new energy vehicle industry. Although subsidies should be gradually decreased as technological innovation matures, financial support policies should also be extended to manufacturers to sustain technological advancement. This includes promoting funding subsidies for the research and development of new energy vehicles, strengthening the environmental oversight of conventional vehicles, advancing the transition of the traditional automotive sector to new energy vehicles through environmental regulations, and attaining eco-friendly and sustainable growth. Facing consumers, we will persist in carrying out the policy of waiving purchase taxes on new energy vehicles, offering cost savings for consumers, and incentivizing more consumers to opt for new energy vehicles.
Secondly, as manufacturers in the new energy vehicle industry, it is essential to proactively allocate resources and personnel towards continuous technological innovation and research and development. This commitment ensures that companies can sustain a steady and enduring growth trajectory within a highly competitive market landscape. New energy vehicle manufacturers should proactively enhance communication and collaboration with other enterprises, acquire more industry information and knowledge, and facilitate information sharing and industry experience accumulation, thus driving technological research and the innovative development of enterprises. New energy vehicle manufacturers should engage in the proactive exploration of opportunities for interdisciplinary collaboration, broaden brand influence, and enhance brand awareness through collaborative marketing initiatives with partners across various sectors. This approach will facilitate brand communication and contribute to establishing a more extensive and profound brand recognition in the market.
Thirdly, dealers need to enhance the post-purchase service for new energy vehicles, which includes aspects such as the battery warranty, installation and upkeep of charging stations, vehicle maintenance, and repair services, to ensure convenience, safety, and reliability for consumers utilizing new energy vehicles, as well as to boost their satisfaction and brand loyalty.
Fourthly, the advancement of electric vehicles is closely linked to the enhancement of infrastructure. Specifically, the holistic development of fundamental charging stations will greatly enhance the charging convenience for new energy vehicles, consequently boosting consumers’ satisfaction and the adoption of new energy vehicles. Looking forward to the future, to enlarge the market scope for new energy vehicles it is imperative to actively advocate for the development and enhancement of infrastructure, guaranteeing the sustainable and robust expansion of the new energy vehicle market.

5. Conclusions

5.1. Main Conclusions

This article considered the situation of carbon reduction and consumers’ low-carbon preferences and analyzed the evolutionary game behavior characteristics of each participating entity. Then, it constructed a new energy vehicle supply chain four-party game involving the government, automobile manufacturers, dealers, and consumers. It went on to calculate and replicate dynamic equations, solve the evolutionary equilibrium point, analyze the stability of the equilibrium point, and find the evolutionary stability strategy. Based on this foundation, a numerical simulation analysis was performed using Matlab, leading to the following conclusions:
Firstly, the optimal stable strategy combination for the four-party game is ( 1 , 1 , 1 , 1 ) , depicted as {government subsidies, manufacturers producing new energy vehicles, dealers selling new energy vehicles, and consumers purchasing new energy vehicles}.
Secondly, the level of technological innovation impacts the strategic decisions made by manufacturers and governments. When technological innovation matures, manufacturers are inclined to produce new energy vehicles, while the government tends to reduce subsidies for manufacturers. The preferences of consumers for low-carbon options exert the most significant influence on governmental strategy decisions, followed by the considerations of manufacturers and dealers.
Thirdly, government departments should proactively engage in the coordinated advancement of the new energy supply chain, effectively utilize state-owned capital, and tailor subsidy strategies accordingly.

5.2. The Prospects for Upcoming Research

Although this article has examined how government subsidies influence the strategic decisions of car makers, dealers, and buyers, future developments in this area are expected to be more market-driven. Subsequent research may focus more on financial institutions engaging in the new energy supply chain. Secondly, this article has incorporated the concepts of carbon reduction and consumers’ preferences for low-carbon products into the study. Moving forward, our focus will shift towards analyzing the implications of carbon policies on the new energy sector. Finally, this study has employed an evolutionary game model to investigate the issue at hand, and in future investigations, differential game methods can be employed for analysis, which allow the representation of multiple participants involved in continuous-time games and provide a more accurate depiction of strategic dynamics.

Author Contributions

Conceptualization, Y.X. and H.R.; methodology, Y.X. and X.L.; software, L.H.; writing—original draft preparation, Y.X., L.H. and W.Z.; writing—review and editing, Y.X., H.R. and L.H.; funding acquisition, W.Z. All authors have read and agreed to the published version of the manuscript.

Funding

This research was funded by Jiangxi Provincial Key Research Base Project of Philosophy and Social Sciences, grant number 22SKJD17.

Institutional Review Board Statement

Not applicable.

Informed Consent Statement

Not applicable.

Data Availability Statement

No new data were created or analyzed in this study. Data sharing is not applicable to this article.

Conflicts of Interest

The authors declare no conflicts of interest.

References

  1. Liu, C.F.; Liu, Z.X.; Li, W.F.; Xu, M.Z. A time-delayed evolutionary game analysis of new energy vehicles development considering subsidy and carbon tax. Heliyon 2024, 10, e25667. [Google Scholar] [CrossRef]
  2. National Bureau of Statistics (NBS). Available online: https://data.stats.gov.cn/easyquery.htm (accessed on 23 June 2024).
  3. Hu, F.; Wei, S.B.; Qiu, L.P.; Hu, H.; Zhou, H.Y. Innovative association network of new energy vehicle charging stations in China: Structural evolution and policy implications. Heliyon 2024, 10, e24764. [Google Scholar] [CrossRef]
  4. Ma, J.H.; Bao, B.S.; Liu, L.X.; Wang, X.Y. Dynamic game evolution complexity of new energy and fuel vehicle manufacturers under carbon cap-and-trade policy. Manag. Decis. Econ. 2024, 45, 2566–2590. [Google Scholar] [CrossRef]
  5. Tang, J.H.; Wu, Q.; Chen, Y.M.; Jin, Y.R.; Wang, K. Evolutionary game analysis of the production decisions of automakers in the Chinese automobile industry: A tripartite model of government, automakers, and consumers. J. Syst. Sci. Syst. Eng. 2023, 32, 708–728. [Google Scholar] [CrossRef]
  6. Zhao, W.H.; Liu, Y.M.; Hou, J.S.; Liu, L.F. Impact of carbon trading mechanism considering blockchain technology on the evolution of new energy vehicle industry in the post-subsidy era. Sustainability 2023, 15, 13190. [Google Scholar] [CrossRef]
  7. Guo, W.Q.; Chen, S.Q.; Lei, M. Evolutionary game and strategy analysis of carbon emission reduction in supply chain based on system dynamic model. Sustainability 2023, 15, 8933. [Google Scholar] [CrossRef]
  8. Mao, Y.F.; Li, P.S.; Li, Y. Exploring the promotion of green technology innovation in the new energy vehicle industry: An evolutionary game analysis. Environ. Sci. Pollut. Res. 2023, 30, 81038–81054. [Google Scholar] [CrossRef]
  9. Rong, L.Q.; Zhao, M.Y.; Xu, M.Z. How do self-transcendent values and institutional forces influence consumer intentions to purchase new energy vehicles under subsidy withdrawal? Evidence from China. Environ. Dev. Sustain. 2023, 1–28. [Google Scholar] [CrossRef]
  10. Zhou, M.; Zhen, W.T. Life cycle sustainability evaluation of new energy vehicles and traditional vehicles. Enterp. Econ. 2018, 1, 129–134. [Google Scholar]
  11. Xing, Q.S.; Zhong, W.Q.; Peng, X.; Deng, F.M. Evolutionary game analysis of lightweight commercial vehicle supply chains under external effects of carbon emission reduction and overloading prohibition. Ind. Eng. 2023, 26, 18–28. [Google Scholar]
  12. Zhang, H.L.; Chun, W.D.; Yuan, X.M.; Liu, W.; Chou, M.C. The governance of irresponsible new energy vehicle members considering differentiated subsidies. Sustain. Cities Soc. 2024, 104, 105289. [Google Scholar] [CrossRef]
  13. Sun, Y.F.; Zhang, Y.J.; Su, B. Impact of government subsidy on the optimal R&D and advertising investment in the cooperative supply chain of new energy vehicles. Energ. Policy 2022, 164, 112885. [Google Scholar]
  14. Liu, Q.; Wen, X.N.; Cao, Q.W. Multi-objective development path evolution of new energy vehicle policy driven by big data: From the perspective of economic-ecological-social. Appl. Energy 2023, 341, 121065. [Google Scholar] [CrossRef]
  15. Huang, S.; Nahm, A.Y.; Song, Z.J. Government subsidies of new energy vehicle industry and enterprise innovation: Moderating role of chief executive officers’ technical background. Manag. Decis. Econ. 2023, 44, 2137–2147. [Google Scholar] [CrossRef]
  16. Wang, Z.C.; Li, X.Y.; Xue, X.H.; Liu, Y.H. More government subsidies, more green innovation? The evidence from Chinese new energy vehicle enterprises. Renew. Energy 2022, 197, 11–21. [Google Scholar] [CrossRef]
  17. Zhang, J.W.; Islam, M.S.; Jambulingam, M.; Lim, W.M.; Kumar, S. Leveraging environmental corporate social responsibility to promote green purchases: The case of new energy vehicles in the era of sustainable development. J. Clean. Prod. 2024, 434, 139988. [Google Scholar] [CrossRef]
  18. Li, B.Z.; Lv, X.T.; Chen, J.X. Demand and supply gap analysis of Chinese new energy vehicle charging infrastructure: Based on CNN-LSTM prediction model. Renew. Energ. 2024, 220, 119618. [Google Scholar] [CrossRef]
  19. Li, J.P.; Xie, C. Identifying and minimizing critical driving range thresholds for electric vehicles in intercity networks. Socio-Econ. Plan. Sci. 2024, 93, 101901. [Google Scholar] [CrossRef]
  20. Chen, Y.S.; Lan, L.B.; Hao, Z.; Xing, Y.X.; Cai, X.; Luo, G.; Chen, H. Review and future prospects of life cycle assessment of new energy vehicles towards carbon neutrality. Chin. J. Automot. Eng. 2022, 12, 360–374. [Google Scholar]
  21. Hong, C. Research on life cycle cost of lithium battery new energy vehicle. Chin. High. Sci. Technol. 2023, 90–92. [Google Scholar] [CrossRef]
  22. Fu, P.; Lan, L.B.; Chen, Y.; Hao, Z.; Xing, Y.X.; Cai, X.; Zhang, C.M.; Chen, Y.S. Life cycle prediction assessment of energy saving and new energy vehicles for 2035. Environ. Sci. 2023, 44, 2365–2374. [Google Scholar]
  23. Das, P.K.; Bhat, M.Y.; Sajith, S. Life cycle assessment of electric vehicles: A systematic review of literature. Environ. Sci. Pollut. Res. 2024, 31, 73–89. [Google Scholar] [CrossRef]
  24. China Industrial Energy Conservation and Clean Production Association, New Energy Battery Recycling and Utilization Professional Committee. Report on the Development of China’s New Energy Battery Recycling Industry in 2023; China Machine Press: Beijing, China, 2024. [Google Scholar]
  25. Ren, M.H.; Zhou, T.; Wang, C.X. New energy vehicle innovation network, innovation resources agglomeration externalities and energy efficiency: Navigating industry chain innovation. Technol. Forecast. Soc. 2024, 200, 123114. [Google Scholar] [CrossRef]
  26. Li, P.; Zhang, Z.X. The effects of new energy vehicle subsidies on air quality: Evidence from China. Energ. Econ. 2023, 120, 106624. [Google Scholar] [CrossRef]
  27. Ma, Y.Q.; Ma, G.S. Application analysis of PPP mode in new energy vehicle battery exchange mode from the perspective of evolutionary game. Adv. Appl. Math. 2021, 10, 1887–1903. [Google Scholar] [CrossRef]
  28. Muhammad, A.; Parvez, M.; Abbas, Z.K.; Sui, Y.K. Three-stage energy trading framework for retailers, charging stations, and electric vehicles: A game-theoretic approach. Energy 2024, 301, 131697. [Google Scholar]
  29. Huang, X.J.; Yun, L.; Lim, M.K.; Zhou, F.L.; Ding, R.; Zhang, Z.S. Evolutionary dynamics of promoting electric vehicle-charging infrastructure based on public–private partnership cooperation. Energy 2022, 239, 122281. [Google Scholar] [CrossRef]
  30. Jin, T.; Jiang, Y.L.; Liu, X.W. Evolutionary game analysis of the impact of dynamic dual credit policy on new energy vehicles after subsidy cancellation. Appl. Math. Comput. 2023, 440, 127677. [Google Scholar] [CrossRef]
  31. Hou, L.; Zhang, Y.M.; Wu, C.L.; Song, J.B. Improving the greenness of enterprise supply chains by designing government subsidy mechanisms: Based on prospect theory and evolutionary games. Front. Psychol. 2023, 14, 1283794. [Google Scholar] [CrossRef]
  32. Wang, M.M.; Lian, S.; Yin, S.; Dong, H.M. A three-player game model for promoting the diffusion of green technology in manufacturing enterprises from the perspective of supply and demand. Mathematics 2020, 8, 1585. [Google Scholar] [CrossRef]
  33. Wang, J.; He, Y.Q.; Wang, H.G.; Wu, R.F. Low-carbon promotion of new energy vehicles: A quadrilateral evolutionary game. Renew. Sustain. Energy Rev. 2023, 188, 113795. [Google Scholar] [CrossRef]
  34. Guan, X.; Zhang, G.X.; Liu, D.Y.; Tan, X.; Wu, D. The behavior of consumer buying new energy vehicles based on stochastic evolutionary game. Filomat 2016, 30, 3987–3997. [Google Scholar] [CrossRef]
  35. Tang, X.; Feng, J.W.; Feng, B.; Mao, X.Y.; Wei, X.Z. Policy analysis on the promotion of new energy vehicles in China considering consumers’ car purchasing choices in the “post-subsidy era”: Based on the study of a three-party evolutionary game. Environ. Dev. Sustain. 2024, 1–32. [Google Scholar] [CrossRef]
  36. Nie, Q.Y.; Zhang, L.H.; Tong, Z.H.; Hubacek, K. Strategies for applying carbon trading to the new energy vehicle market in China: An improved evolutionary game analysis for the bus industry. Energy 2022, 259, 124904. [Google Scholar] [CrossRef]
  37. Chen, Y.; Zhan, M.L.; Liu, Y. Promoting the development of China’s new-energy vehicle industry in the post-subsidy era: A study based on the evolutionary game theory method. Energies 2023, 16, 5760. [Google Scholar] [CrossRef]
  38. Wang, J.L.; Liu, X.B. Research on the development strategy selection of the new energy vehicle industry from the perspective of green credit-based on the foursquare evolutionary game analysis. PLoS ONE 2024, 19, e0297813. [Google Scholar] [CrossRef] [PubMed]
  39. Yu, L.K.; Jiang, X.H.; He, Y.J.; Jiao, Y.Y. Promoting the diffusion of new energy vehicles under dual credit policy: Asymmetric competition and cooperation in complex network. Energies 2022, 15, 5361. [Google Scholar] [CrossRef]
  40. Xing, Z.Y.; Fang, D.B.; Huang, J.; Zhao, Y.L.; Wang, L.; Wang, J.; Zhang, R. Switching gears: Evaluating grid-to-vehicle (G2V) and battery swap (BS) behaviors in new energy vehicles (NEVs) within a flexible institutional landscape. Travel. Behav. Soc. 2024, 35, 100739. [Google Scholar] [CrossRef]
  41. Fan, R.G.; Bao, X.G.; Du, K.; Wang, Y.Y.; Wang, Y.T. The effect of government policies and consumer green preferences on the R&D diffusion of new energy vehicles: A perspective of complex network games. Energy 2022, 254, 124316. [Google Scholar]
  42. Wang, X.J.; Quan, J.; Liu, W.B. Study on evolutionary games and cooperation mechanism within the framework of bounded rationality. Syst. Eng. Theory Pract. 2011, 31, 82–93. [Google Scholar]
  43. Shi, Z.Y.; Cheng, J.W. How do government subsidies and consumers’ low-carbon preference promote new energy vehicle diffusion? a tripartite evolutionary game based on energy vehicle manufacturers, the government and consumers. Heliyon 2023, 9, e14327. [Google Scholar] [CrossRef] [PubMed]
  44. Zhou, F.L.; Chen, T.F.; Lim, M.K. Strategic low-carbon technology supervision in the closed-loop supply chain: An evolutionary game approach. J. Clean. Prod. 2024, 450, 141609. [Google Scholar] [CrossRef]
  45. Ritzberger, K.; Weibull, J.W. Evolutionary selection in normal-from game. Econometrica 1995, 63, 1371–1399. [Google Scholar] [CrossRef]
  46. Selten, R. A note on evolutionarily stable strategies in asymmetric animal conflicts. J. Theor. Biol. 1980, 84, 93–101. [Google Scholar] [CrossRef]
  47. Ellison, G.; Fudenberg, D.; Imhof, L.A. Fast convergence in evolutionary models: A Lyapunov approach. J. Econ. Theory 2016, 161, 1–36. [Google Scholar] [CrossRef]
  48. Pukdeboon, C. A review of fundamentals of Lyapunov theory. J. Appl. Sci. 2011, 10, 55–61. [Google Scholar]
  49. Dragicevic, A.Z. Conditional rehabilitation of cooperation under strategic uncertainty. J. Math. Biol. 2019, 79, 1973–2003. [Google Scholar] [CrossRef]
  50. Friedman, D. On economic applications of evolutionary game theory. J. Evol. Econ. 1998, 8, 15–43. [Google Scholar] [CrossRef]
  51. Liao, D.S.; Tan, B.B. An evolutionary game analysis of new energy vehicles promotion considering carbon tax in post-subsidy era. Energy 2022, 264, 126156. [Google Scholar] [CrossRef]
  52. Wang, Y.Y.; Fan, R.G.; Lin, J.C.; Chen, F.Z.; Qian, R.R. The effective subsidy policies for new energy vehicles considering both supply and demand sides and their influence mechanisms: An analytical perspective from the network-based evolutionary game. J. Environ. Manag. 2023, 325, 116483. [Google Scholar] [CrossRef]
  53. Wang, X.H.; Ren, X.X. Research on dynamic evolutionary game of platform e-commerce credit supervision from the perspective of government governance. Syst. Eng. Theory Pract. 2020, 40, 2617–2630. [Google Scholar]
  54. Song, R.; Shi, W.; Qin, W.Y.; Xue, X.J. Exploring the interplay of new energy vehicle enterprises, consumers, and government in the context of the “dual carbon” target: An evolutionary game and simulation analysis. PLoS ONE 2023, 18, e0291175. [Google Scholar] [CrossRef] [PubMed]
  55. Zheng, P.; Pei, W.J.; Pan, W.B. Impact of different carbon tax conditions on the behavioral strategies of new energy vehicle manufacturers and governmentsA dynamic analysis and simulation based on prospect theory. J. Clean. Prod. 2023, 407, 137132. [Google Scholar] [CrossRef]
Figure 1. Production and sales of new energy vehicles from 2018 to 2023.
Systems 12 00328 g001
Figure 2. New energy vehicle supply chain relationship diagram.
Systems 12 00328 g002
Figure 3. Evolutionary process of the four-party strategy under condition E3.
Systems 12 00328 g003
Figure 4. The impact of benefit R t obtained from government subsidies on its strategic choice.
Systems 12 00328 g004
Figure 5. The impact of a on manufacturers’ strategy selection.
Systems 12 00328 g005
Figure 6. The impact of a on the government’s strategy choices.
Systems 12 00328 g006
Figure 7. The impact of λ and R p on the government’s strategy choices.
Systems 12 00328 g007
Figure 8. The impact of λ and R p on dealers’ strategy choices.
Systems 12 00328 g008
Figure 9. The impact of λ and R p on manufacturers’ strategy choices.
Systems 12 00328 g009
Figure 10. The impact of b on manufacturer strategy selection.
Systems 12 00328 g010
Figure 11. The impact of θ on consumers’ strategy choices.
Systems 12 00328 g011
Table 1. Symbols and meanings of parameters.
SymbolsMeaning
C s Subsidies awarded to manufacturers for producing new energy vehicles
C d Subsidies provided to dealers for the sale of new energy vehicles
C m Subsidies provided to consumers for the acquisition of new energy vehicles
R t Benefits obtained from government subsidies
C p The cost of government environmental governance
π 1 ( π 2 ) Revenue from manufacturers producing new energy (traditional vehicles)
C The cost of producing traditional cars
T i Taxation of new energy vehicles
P 1 ( P 2 ) Punishments for manufacturers (dealers) environmental pollution
R 1 ( R 2 ) Profit earned by dealers from selling new energy (traditional) vehicles
L Marketing subsidies provided by manufacturers to distributors
R 3 The additional benefits brought by marketing new energy vehicles to dealers
C t The cost of dealer after-sales service
P s ( P t ) The price at which consumers purchase new energy (traditional) vehicles
R 4 ( R 5 ) The lifecycle value of new energy (traditional) vehicles
λ The coefficient of consumers’ preference for low-carbon options
R p Additional advantages brought by consumers’ low-carbon preferences
R s Additional benefits for manufacturers
Table 2. Benefit matrix of quadrilateral evolutionary game.
ManufacturersDealersGovernment
Provide Subsidy (x)Not Provide Subsidy (1 − x)
Consumers
Purchase NEV
m
Purchase TV
1 m
Purchase NEV
m
Purchase TV
1 m
Produce NTV
( y )
Sell NEV ( z ) R t C s C d C m R t C s C d C p C p
δ π 1 + R s + λ R p + C s a C T i L δ π 1 + R s + C s a C T i L δ π 1 + R s + λ R p a C T i L δ π 1 + R s a C T i L
R 1 + L + R 3 + λ R p + C d C t R 1 + L + R 3 + C d C t R 1 + L + R 3 + λ R p C t R 1 + L + R 3 C t
R 4 + C m P s + θ R 5 P t R 4 P s + θ R 5 P t
Sell TV (1 − z) R t + P 2 C s C m R t + P 2 C s P 2 C p P 2 C p
δ π 1 + R s + C s + λ R p a C T i δ π 1 + R s + C s a C T i δ π 1 + R s + λ R p a C T i δ π 1 + R s a C T i
( 1 δ ) R 2 + C d C t P 2 ( 1 δ ) R 2 + C d C t P 2 ( 1 δ ) R 2 C t P 2 ( 1 δ ) R 2 C t P 2
0 R 5 P t 0 R 5 P t
Produce
TV
(1 − y)
Sell NEV (z) R t + P 1 C d C m R t + P 1 C d P 1 C p P 1 C p
( 1 δ ) π 2 C b T i P 1 ( 1 δ ) π 2 C b T i P 1 ( 1 δ ) π 2 C b T i P 1 ( 1 δ ) π 2 C b T i P 1
0 R 2 C t 0 R 2 C t
0 R 5 P t 0 R 5 P t
Sell TV (1 − z) R t + P 1 + P 2 C m R t + P 1 + P 2 P 1 + P 2 C p P 1 + P 2 C p
( 1 δ ) π 2 C b T i P 1 ( 1 δ ) π 2 C b T i P 1 ( 1 δ ) π 2 C b T i P 1 ( 1 δ ) π 2 C b T i P 1
0 R 2 C t P 2 0 R 2 C t P 2
0 R 5 P t 0 R 5 P t
Table 3. The results of solving the Jacobian Matrix.
F ς
F x F y F z F m
F ς x ( 2 x 1 ) A x ( x 1 ) ( P 1 z + C s C p ( z + m m z ) C p ) x ( x 1 ) ( C d + C p + P 1 y + C p m y P 1 C p y ) x ( x 1 ) ( C m C p y + C p y z )
F ς y y ( 1 y ) C s ( 1 2 y ) B y ( y 1 ) L λ y ( 1 y ) R p
F ς z z ( 1 z ) ( C d ( m + y m y ) ) z ( 1 z ) ( L + R 1 R 2 + R 3 + δ R 2 + x C d + m P 2 C d m x + λ m R p ) ( 1 2 z ) C z ( 1 z ) ( ( 1 y ) ( C d x P 2 ) + λ R p y )
F ς m m ( 1 m ) y z C m m z ( 1 m ) ( x C m + R 4 P s + θ ) m y ( 1 m ) ( x C m + R 4 P s + θ ) ( 1 2 m ) ( P t + C m x y z R 5 + ( R 4 P s + θ ) y z )
Table 4. The asymptotic stability analysis of equilibrium points in the dynamic group system of new energy vehicles sold by dealers.
Equilibrium PointsEigenvaluesPositive and Negative JudgmentStabilityCondition
( 0 , 0 , 1 , 0 ) R t + P 1 C d C p , ( 1 a ) C ( 1 b ) T i ( 1 δ ) π 2 L + P 1 + R s + δ π 1 , P 2 , P t R 5 ( + , + , , + ) non
( 0 , 1 , 1 , 0 ) R t + C p C d C s , ( ( 1 a ) C ( 1 b ) T i ( 1 δ ) π 2 L + P 1 + R s + δ π 1 ) , ( L + R 1 R 2 + R 3 + δ R 2 + P 2 ) , P t R 5 P s + θ + R 4 ( × , × , , + ) non
( 1 , 0 , 1 , 0 ) C d + C p P 1 R t , ( 1 a ) C ( 1 b ) T i ( 1 δ ) π 2 L + C s + P 1 + R s + δ π 1 , P 2 , P t R 5 ( × , × , , + ) non
( 0 , 0 , 1 , 1 ) R t P 1 C p C m C d , ( 1 a ) C ( 1 b ) T i ( 1 δ ) π 2 L + λ R p + P 1 + R s + δ π 1 , 0 , R 5 P t ( × , × , 0 , ) non
( 1 , 1 , 1 , 0 ) C d + C s R t C p , ( ( 1 a ) C ( 1 b ) T i ( 1 d ) π 2 L + C s + P 1 + R s + δ π 1 ) , ( L + R 1 R 2 + R 3 + δ R 2 + P 2 + C d ) , P t R 5 + C m P s + R 4 + θ ( × , × , , + ) non
( 1 , 0 , 1 , 1 ) C m R t P 1 + C p + C d , ( 1 a ) C ( 1 b ) T i ( 1 δ ) π 2 L + λ R p + C s + P 1 + R s + δ π 1 , C d , R 5 P t ( × , × , , ) ESS(E2)
( 0 , 1 , 1 , 1 ) R t + C p C m C d C s , ( ( 1 a ) C ( 1 b ) T i L ( 1 δ ) π 2 + λ R p + P 1 + R s + δ π 1 ) , λ R p L R 1 + R 2 R 3 δ R 2 P 2 , R 5 P t R 4 + P s θ ( × , × , , ) ESS(E1)
( 1 , 1 , 1 , 1 ) C m + C s R t C p + C d , ( ( 1 a ) C ( 1 b ) T i L ( 1 δ ) π 2 + λ R p + C s + P 1 + R s + δ π 1 ) , ( L + R 1 R 2 + R 3 + δ R 2 + λ R p + C d + P 2 ) , ( P t R 5 + C m P s + θ + R 4 ) ( × , × , , ) ESS(E3)
The inability to ascertain whether this eigenvalue is positive or negative is shown by × . The expression for evolutionary stability strategies is ESS.
Table 5. The asymptotic stability analysis of equilibrium points in the dynamic group system of traditional vehicles sold by dealers.
Equilibrium PointsEigenvaluesPositive and Negative JudgmentStability
( 0 , 0 , 0 , 0 ) R t , ( 1 a ) C ( 1 b ) T i ( 1 δ ) π 2 + P 1 + R s + δ π 1 , P 2 , P t R 5 ( + , × , + , + ) non
( 0 , 1 , 0 , 0 ) C p + R t C s , ( ( 1 a ) C ( 1 b ) T i ( 1 δ ) π 2 + P 1 + R s + δ π 1 ) , L + R 1 R 2 + R 3 + δ R 2 + P 2 , P t R 5 ( × , × , + , + ) non
( 0 , 0 , 0 , 1 ) R t C m , ( 1 a ) C ( 1 b ) T i ( 1 δ ) π 2 + P 1 + R s + δ π 1 + λ R p , 0 , R 5 P t ( × , × , 0 , ) non
( 1 , 0 , 0 , 0 ) R t , ( 1 a ) C ( 1 b ) T i ( 1 δ ) π 2 + C s + P 1 + R s + δ π 1 , P 2 , P t R 5 ( , × , + , + ) non
( 0 , 1 , 0 , 1 ) R t + 2 C p C m C s , ( ( 1 a ) C ( 1 b ) T i ( 1 δ ) π 2 + P 1 + R s + δ π 1 + λ R p ) , L + R 1 ( 1 δ ) R 2 + R 3 + P 2 + λ R p , R 5 P t ( × , × , + , ) non
( 1 , 0 , 0 , 1 ) C m R t , ( 1 a ) C ( 1 b ) T i ( 1 δ ) π 2 + λ R p + C s + P 1 + R s + δ π 1 , C t , R 5 P t ( × , × , + , ) non
( 1 , 1 , 0 , 0 ) C s R t C p , ( ( 1 a ) C ( 1 b ) T i ( 1 δ ) π 2 + C s + P 1 + R s + δ π 1 ) , L + R 1 R 2 + R 3 + δ R 2 + P 2 + C d , P t R 5 ( + , × , + , + ) non
( 1 , 1 , 0 , 1 ) C m + C s R t 2 C p , ( ( 1 a ) C ( 1 b ) T i ( 1 δ ) π 2 + λ R p + C s + P 1 + R s + δ π 1 ) , L + R 1 R 2 + R 3 + δ R 2 + λ R p + P 2 + C d , R 5 P t ( × , × , + , ) non
The inability to determine the positive or negative value of this eigenvalue is represented by ×.
Table 6. Parameter values.
ParameterValueReferenceParameterValueReference
C s 3.5Song et al. [54] T i 5
C d 2.5 R s 1
C m 2.1 R 1 1
R t 10 R 2 0.9
C p 0.07Song et al. [54] L 0.1
P 1 0.2Song et al. [54] R 3 0.105
P 2 0.2 C t 0.2
δ 0.5 θ 2
λ λ > 1 P s 21Song et al. [54]
a a > 1 P t 15Song et al. [54]
b 1.5Zheng et al. [55] R 4 20
π 1 21.1 R 5 14
π 2 15 R p 0.08
C 10.5
Disclaimer/Publisher’s Note: The statements, opinions and data contained in all publications are solely those of the individual author(s) and contributor(s) and not of MDPI and/or the editor(s). MDPI and/or the editor(s) disclaim responsibility for any injury to people or property resulting from any ideas, methods, instructions or products referred to in the content.

