Article

Analysis of the Influence of Online Public Opinion on Corporate Brand Value: An Efficient Way to Avoid Unexpected Shocks from the Internet

School of Management, Shanghai University, 99 Shangda Road, Shanghai 200444, China
*
Author to whom correspondence should be addressed.
Systems 2024, 12(9), 337; https://doi.org/10.3390/systems12090337 (registering DOI)
Submission received: 19 July 2024 / Revised: 12 August 2024 / Accepted: 28 August 2024 / Published: 1 September 2024

Abstract

:
Nowadays, online public opinions (OPOs) significantly impact corporate brand value (CBV). To prevent corporate brand crises caused mainly by OPOs, it is essential to detect anomalies in OPOs related to corporate reputation in a timely manner. This study explores how dramatic changes in OPOs affect market capital value (MCV), the primary indicator of CBV, and aims to construct a CBV early warning evaluation model. First, a set of OPO indicators dedicated to CBV are selected based on correlation analysis between various popular OPO and CBV indicators collected through a literature review. The method of Criteria Importance Through Intercriteria Correlation (CRITIC) is then employed to determine the indicator weights using data collected from popular social media platforms. Finally, the vector auto-regression (VAR) model is applied to validate the effectiveness of the proposed evaluation model. A case study involving several Chinese enterprises shows that abnormal changes in their MCVs consistently follow abnormal fluctuations observed in their OPOs, with a significant delay. This finding enables managers to promptly detect potential crises from the internet and take actions to avoid unexpected shocks.

1. Introduction

Traditionally, analyses of corporate brand value (CBV) are based on data obtained from consumer questionnaires [1]. However, the results derived from such methods are often neither comprehensive nor objective and tend to be delayed. This limitation hampers the ability of corporations to promptly anticipate and respond to fluctuations in CBV.
Nowadays, social media plays an increasingly important role in daily life. With more people expressing their opinions on internet platforms, this becomes crucial for corporate brand management [2]. Some researchers have observed that negative consumer comments on social platforms can harm CBV [3], and audience engagement and comment reading significantly impact the CBV of online news media [4]. The results of some studies show that online public opinions (OPOs) shape consumer decision-making and influence fluctuations in CBV [5]. Thus, gaining a thorough understanding of the impact mechanisms of OPOs on CBV, and subsequently developing an early warning evaluation model (EWEM) for CBV fluctuations, is crucial for enhancing the ability of contemporary corporate managers to detect sudden events that could significantly alter CBV in a timely manner.
To analyze the impact of OPOs on CBV and construct a dynamic EWEM for CBV, this study focuses on the following issues:
  • Analyzing the impact of OPOs on fluctuations in CBV to determine the feasibility of constructing a dynamic EWEM.
  • Constructing a dynamic EWEM for CBV by developing a CBV monitoring index system based on OPOs.
  • Validating the effectiveness of the proposed evaluation model using the vector auto-regressive (VAR) model.
The rest of this study is organized as follows: Section 2 presents a state-of-the-art review of related work. Section 3 describes the methodology for constructing the CBV EWEM. Section 4 conducts an empirical analysis to validate the effectiveness of the proposed approach. Section 5 presents the discussions, and Section 6 provides the conclusions of the study.

2. Literature Review

2.1. Corporate Brand Value Evaluation Indicators

CBV encompasses both monetary value and non-monetary value. The monetary value is derived from fundamental goods and services during the brand formation, while the non-monetary value includes spiritual and emotional aspects, forming the comprehensive image of the brand in the minds of consumers [6].
To the best of our knowledge, no standard approach has been developed for evaluating a company’s CBV. Some researchers evaluate a company’s CBV based on internal corporate factors, such as its market and financial assets [7,8,9]. Others highlight the importance of consumer attitudes, leading to a preference for valuing CBV through external corporate factors. For example, Cuesta et al. [10] evaluate CBV using green performance indicators such as green brand loyalty, green perceived quality, green brand associations, green brand awareness, and green brand sentiment. Wang and Wu [11] constructed a rural tourism CBV management model with data derived from both corporate websites and customer surveys. Sankaran and Chakraborty [12] observed that consumer satisfaction and trust can positively impact CBV regarding mobile payments.
It has been observed in many existing studies that the reputation of a corporation’s brand can convey a corporation’s operational status in the product market to the capital market, and this is reflected in the stock market [13,14]. For example, Farhang et al. [15] found a positive correlation between CBV and stock returns during short-term crises at different periods of the market. Laghi et al. [16] argued that the monetary value of a corporate brand constitutes a portion of the total stock value of the corresponding enterprise. Bhaskaran et al. [17] concluded that the fundamental determinants of stock prices are investors’ perceptions of the current and future earning potential of tangible and intangible assets, and CBV, being a typical example of intangible assets, can be reflected in a company’s market value through stock price changes. Consequently, this study used the stock price of a company to represent its CBV when constructing the EWEM for CBV.
Since the market capital value (MCV) of a corporation changes in real time based on the company’s status, it is crucial to use the MCV as the most important indicator for monitoring the status of a company’s CBV.

2.2. Online Public Opinion Analysis Indicators

OPO, as user-generated content, is complex and dynamic. According to the literature, OPO-based early warning indicators generally involve the following aspects: the subjects and objects of OPO, the content and characteristics of OPO, the media and forms of OPO expression, the process of OPO dissemination, and the societal response [18].
For example, Peng et al. [19] considered the development characteristics and dissemination features of OPO to construct an early warning indicator system based on attention, engagement, diffusion, and status. Meng et al. [20] constructed an OPO crisis evaluation model based on information personnel, information environment, and information. Wang et al. [18] evaluated urgent OPO events from the perspectives of OPO heat, quantity, intensity, attention degree, and change rate. Chen et al. [21] assessed OPOs on public events with data regarding netizen roles, online media roles, public event dissemination, and netizen attitudes and perceptions. Shen et al. [22] established a corporate OPO risk assessment model by considering OPO voice, OPO heat, and netizen emotions.
It is worth mentioning that most of the existing research on CBV predominantly relies on financial data publicly disclosed by corporations and consumer behavior or psychological data obtained through surveys. Such CBV measurements are characterized by subjectivity and static nature, involve high labor costs, and suffer from lag, making it difficult to monitor fluctuations in CBV in real-time.
Analyses with OPO data can help corporations reveal their brand’s real-time status. Therefore, refining a set of OPO analysis indicators that are significantly correlated with MCV, i.e., brand stock prices, can serve as a basis for constructing a CBV EWEM. This model can then be made available for real-time monitoring of CBV fluctuations.

3. Method

3.1. Research Framework

As shown in Figure 1, this study is conducted as follows:
First, a set of OPO indicators relevant to CBV is determined by collecting both OPO indicators and relevant browsing behavior (BB) indicators from existing studies based on a thorough literature review.
Next, a correlation analysis is conducted between OPO indicators and MCV to identify those significantly correlated with the company’s MCV.
Then, the weight of each selected OPO indicator is determined using the Intercriteria Correlation (CRITIC) method, and the CBV EWEM is constructed.
Finally, the vector auto-regression (VAR) model is applied to validate the effectiveness of the proposed CBV EWEM.

3.2. Define OPO Indicators

The steps for defining the set of OPO indicators significantly correlated with the company’s MCV are as follows:
Step 1: Collect all OPO indicators by reviewing papers relevant to CBV and published since the year 2021 in the Web of Science.
Step 2: Rank the OPO indicators obtained in Step 1 in descending order based on their frequency of occurrence in the references.
Step 3: Select the OPO indicators observed in more than 50% of the references and accept these for constructing the CBV EWEM, as shown in Table 1.
Step 4: Define BB indicators for each OPO indicator obtained in step 3 to evaluate relevant OPO sentiments, as shown in Table 2.
Step 5: Value the indicators defined in Step 4.
Among the BB indicators presented in Table 2, all can be evaluated using simple statistical methods on the collected data, except for the sentiment and trust tendency indicators.
The value of the sentiment tendency indicator is determined as follows:
First, construct the sentiment dictionary, degree adverb dictionary, and negation dictionary using information from the Hownet Sentiment Dictionary, National Taiwan University Semantic Dictionary (NTUSD) and HIT IR-Lab Tongyici Cilin (Extended), following the method proposed by Ren and Wu [38]. After collecting the set of posts relevant to the targeted corporate brand ( Ω ) from the most popular forums and websites during a predefined observation period, the sentiment value of the comments in the post k ( k Ω ) can be calculated using Equation (1).
e k = s Ω k ( 1 ) m × S I k × S V s
where e k represents the sentiment value of post k, Ω k denotes the set of words observed in post k, m represents the number of negation words, and S I k indicates the emotional intensity of post k. In this study, all words are categorized into five groups based on their sentimental value, as evaluated using the Hownet Sentiment Dictionary, and the sentimental intensities for those groups are set as 2.0, 1.5, 1.25, 0.5, and 0.25, respectively.Each post is assigned a sentimental intensity degree according to its category. S V s represents the standardized sentiment value of word s ( s Ω ). The value of S V s is set to 1 if the sentimental value of word s is positive, and 1 if it is negative. The sentiment value of post k ( k Ω ) is further standardized using Equation (2).
sgn e k = 1 , if e k > 0 0 , if e k = 0 1 , if e k < 0
Next, the sentiment tendency relevant to the targeted corporate brand at time t is evaluated using a method developed from the approaches proposed by Shapiro et al. [39] and Xu et al. [40], as shown in Equations (3)–(5).
E t = ln 1 + E t pos 1 + E t neg
E t pos = sgn e k > 0 sgn e k
E t n e g = sgn e k < 0 sgn e k
where E t represents the sentiment tendency at time t, E t pos denotes the total number of positive blog posts (i.e., the posts with positive sentiment value) collected up to time t, and E t neg represents the total number of negative blog posts (i.e., the posts with negative sentiment value) collected up to time t. If E t is positive, it indicates that the reputation of the targeted corporate brand is strong; otherwise, it suggests that the brand’s reputation is encountering some issues.
Then, the positive incremental series indicator is defined as the difference between the positive and negative indicators.
The value of the trust tendency indicator is evaluated using the method proposed by Kafeza et al. [24]; considering the different language environments, this paper uses the sentiment dictionary in the Chinese language to replace the English dictionary in the original method, and details are as follows:
First, the DLUT-emotion ontology [41], which includes definitions for “trust” and “doubt”, is employed as the emotion dictionary to assess the trust tendency of each post related to the targeted corporate brand. Next, the number of posts containing “trust” and “doubt” is counted. Finally, the trust tendency of the targeted corporate brand is determined as the difference between the number of posts with a “trust” tendency and those with a “doubt” tendency.

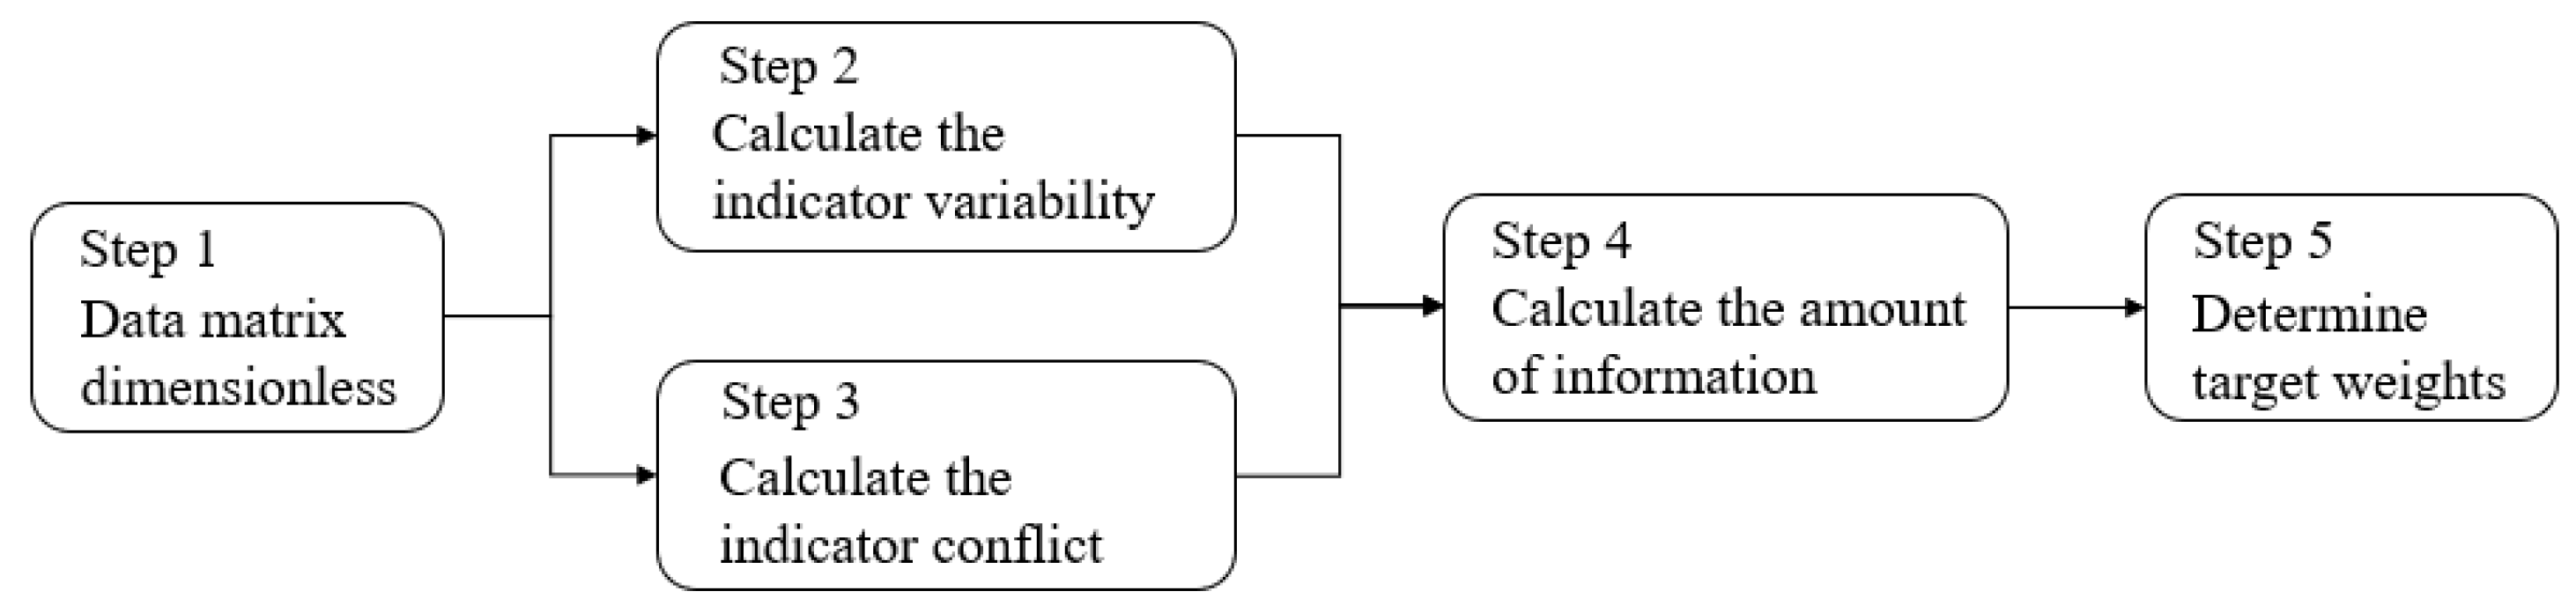
3.3. Determine Weights of Selected OPO Indicators

Given the advantages of the CRITIC approach as illustrated in [19], this method is applied in this study to determine the weights of OPO indicators defined in Section 3.2. As outlined in Figure 2, the steps for determining these weights are as follows:
Step 1: Construct the original indicator data matrix.
Without loss of generality, assume there are n posts and p evaluation indicators. The original indicator data matrix can be constructed as shown in Equation (6).
A = a 11 a 1 p a n 1 a n p
where a i j represents the value of the jth evaluation indicator for the ith post.
To ensure comparability across different measurement units, the indicators must be scaled to a range between 0 and 1. For indicators where a higher value is better, the positive normalization process shown in Equation (7) is applied. Conversely, for indicators where a lower value is better, the negative normalization process shown in Equation (8) is used.
a i j = a j a min a max a min
a i j = a max a j a max a min
Step 2: Evaluate the indicator variability.
Calculate both the mean and standard deviation of each indicator, as shown in Equation (9). Since a higher standard deviation indicates greater variability in an indicator, it can be concluded that the more important an indicator is, the higher weight it should be assigned.
a j ¯ = 1 n i = 1 n a i j σ j = i = 1 n a i j a j ¯ 2 n 1
Step 3: Detect the conflict between different indicators.
If an indicator has a strong correlation with other indicators, it suggests low conflict and may reflect similar information. This correlation reduces the independent evaluation value of the indicator, so its weight should be decreased accordingly.
While the Pearson correlation coefficient is commonly used in existing studies, this study employs the distance correlation coefficient (DCC) for conflict detection, as also applied in Krishnan et al. [42], because the DCC overcomes the limitation of the Pearson correlation coefficient in detecting linear relationships and addressing nonlinear correlations.
The DCC measures the independency between a pair of variables by evaluating the average distance between points in multidimensional space, and the calculation of the distance correlation coefficients between two indicators, c i and c i , is shown in Equations (10)–(13).
dcorr c i , c i = d cov c i , c i d cov c i , c i d cov c i , c i
where d cov 2 c i , c i = S ^ 1 + S ^ 2 2 S ^ 3 and S ^ 1 , S ^ 2 , S ^ 3 are defined using Formulas (11)–(13), respectively.
S ^ 1 = 1 n 2 u = 1 n v = 1 n c i u c i v d c i c i u c i v d c i
S ^ 2 = 1 n 2 u = 1 n v = 1 n c i u c i v d c i 1 n 2 u = 1 n v = 1 n c i u c i v d c i
S ^ 3 = 1 n 3 u = 1 n v = 1 n l = 1 n c i u c i l d c i c i u c i l d c i
Similarly, d cov c i , c i and d cov c i , c i can also be calculated, and the conflict value can be determined using Equation (14).
f j = i = 1 p 1 dcorr c i , c i
Step 4: Evaluate the overall importance of OPO indicators
Evaluate the overall importance of OPO indicators by considering both variability and conflict performances, using Formula (15). The larger the I j is, the more important the jth evaluation indicator becomes.
I j = σ j × f j
Step 5: Assign a weight to each OPO indicator.
Determine the weight of each OPO indicator using Equation (16).
ω j = I j j = 1 p I j

4. Case Studies

To validate the proposed approach, a detailed case study and a comparison with key performance indicators across different cases are shown in this section.

4.1. Detailed Case Study: Yuyue Medical

Yuyue Medical (SZ: 002223), a leading household medical device company in China, faced public controversy over price increases of its oximeters during the COVID-19 outbreak from late 2022 to early 2023. This controversy resulted in a sharp decline in its stock price, starting on 27 January 2023. In this case study, we aim to verify whether the proposed approach can provide significant early warning signals to Yuyue Medical’s management, enabling them to take timely action to mitigate this crisis.
Posts were collected from Weibo, one of the largest social media platforms in China, during a three-month observation period spanning from 1 December 2022 to 28 February 2023, with a daily time unit. A Python-based web crawler was used for data collection, which included the following:
(1)
Posts relevant to “Yueyue Medical” were collected from Weibo, including the corresponding number of likes, comments, and retweets. A total of 3998 posts were retrieved, and after removing duplicate content and irrelevant data, 3540 posts were deemed usable for feeding into the CBV EWEM model.
(2)
Posts from the official Weibo account of “Yuyue Medical”, along with their corresponding number of likes, comments, and retweets, were collected. A total 23 official posts were gathered during the observation period.
(3)
The daily brand Baidu index was collected from the Baidu platform.
(4)
Yuyue Medical’s stock price was collected from Eastmoney, a financial and securities portal in China.

4.2. Construction of the OPO Indicators System

4.2.1. Definition of OPO Indicators

Based on the correlation analyses between the initial set of OPO BB indicators, as mentioned in Section 3, and the stock price of Yuyue Medical, the significantly correlated OPO indicators were selected.
As shown in Table 3, the number of positive blog posts, likes, retweets, and comments is significantly and positively correlated with the stock price. This suggests that user actions such as posting positive views, liking, commenting, and sharing favorable content reflect potential customers’ goodwill and spontaneous promotion of the brand.
No significant correlation is observed between the stock price and the number of negative blog posts, likes, retweets, and comments. This may indicate that investors are cautious about the short-term authenticity of negative OPOs, allowing management time to act before the investors make the final decision.
Positive increments in blog posts, likes, retweets, and comments are positively correlated with stock price. The net effect of user behavior outweighs the impact of negative opinions, reflecting users’ overall perception of the brand’s value.
Trust tendency and sentiment tendency are positively correlated with stock price fluctuations. This suggests that user attitudes, such as expressing trust in the brand and demonstrating positive sentiment tendencies, will enhance the public’s perception and reputation of the corporate brand.
The number of likes and comments on official Weibo posts are positively correlated with stock price, while the number of retweets is not. More likes and comments on official posts suggest that the brand’s content resonates well with its target audience, increasing user engagement and helping to spread brand information. The lack of correlation for retweets may be due to the different user behavior thresholds on social media. Liking is a simpler action within the original post’s “territory”, while retweeting involves sharing content with one’s own network, requiring a higher level of agreement with the content and the brand. As a result, retweets are less frequent and have a smaller impact on CBV.
The total search volume for brand keywords is significantly positively correlated with stock price. This suggests that a higher search index indicates more users seeking information about the brand on social platforms, boosting brand visibility. Brands with greater visibility are more likely to be remembered and recognized by consumers, which positively impacts CBV.

4.2.2. Determination of Indicator Weights

After removing irrelevant items from Table 3, the indicator weights were determined using the CRITIC approach presented in Section 3. The results are shown in Table 4. Subsequently, a time-series value for the CBV-OPO monitoring index was calculated. A higher index indicates more favorable overall OPO for the targeted brand, while a lower index suggests less favorable OPO.

4.3. Validation of the Constructed CBV EWEM

4.3.1. VAR Model for Early Warning Capability Evaluation

This study employs a vector auto-regression (VAR) model, as applied in [43], to further analyze the dynamic relationship between OPO and CBV, thereby validating the early warning capability of the proposed CBV EWEM. The basic form of the VAR model is shown in Equation (17).
y t = Φ 1 y t 1 + + Φ N y t N + B x t + ε t
where y t represents the column vector of endogenous variables at time t, x t represents the column vector of exogenous variables at time t, Φ and B are the coefficient matrices, and ε t is the random error term.
The selection of the lag order (i.e., the relationship between the current observations and those from several previous time periods) is crucial for the establishment and analysis of a VAR model. Given the uncertainty of the environment, the lag order should be carefully determined based on the specific data and targets. In this study, the lag order is determined with the rules applied in [44], and four information criteria, shown in Table 5, were utilized. The smaller the value of the information criterion, the better the model balances goodness of fit and complexity.
In this study, the VAR model is constructed by taking the above calculated CBV-OPO monitoring index (hereinafter represented by BVPOI) and CBV (represented by corporate stock price STOCK) as variables, and impulse response analysis is used to study the dynamic relationship between OPO and CBV.
To avoid spurious regression and ensure the reliability of the regression results, an ADF unit root test was applied to conduct stationarity tests on the BVPOI and STOCK time-series data.
According to the results shown in Table 6, the original sequences of STOCK and BVPOI are unstable. However, the time series of the difference of first order for these variables are stable. Therefore, both variables are integrated from order one and can proceed to the model construction stage.

4.3.2. Selection and Estimation of Lag Order in VAR Model

As shown in Table 7, among the five evaluation criteria—AIC, SC, HQ, and FPE—three criteria indicate that a VAR(2) model should be established. Therefore, it is reasonable to determine a lag order of 2 for the VAR model, leading to the establishment of a VAR(2) model.
After determining the lag order, the VAR model is estimated. The specific expressions of the model are presented in Equations (18) and (19).
STOCK = 0.82 × STOCK ( 1 ) 0.0 × STOCK ( 2 ) + 0.198 × BVPOI ( 1 ) + 1.498 × BVPOI ( 2 ) + 5.175
BVPOI = 0.007 × STOCK ( 1 ) + 0.002 × STOCK ( 2 ) + 0.085 × BVPOI ( 1 ) + 0.206 × BVPOI ( 2 ) 0.089

4.3.3. Johansen Cointegration Test

As shown in Table 8, the trace values exceed the 5% critical values, indicating the presence of cointegration among the variables. This suggests a long-term equilibrium relationship, justifying the estimation of the VAR model. Consequently, the established VAR model holds economic significance.

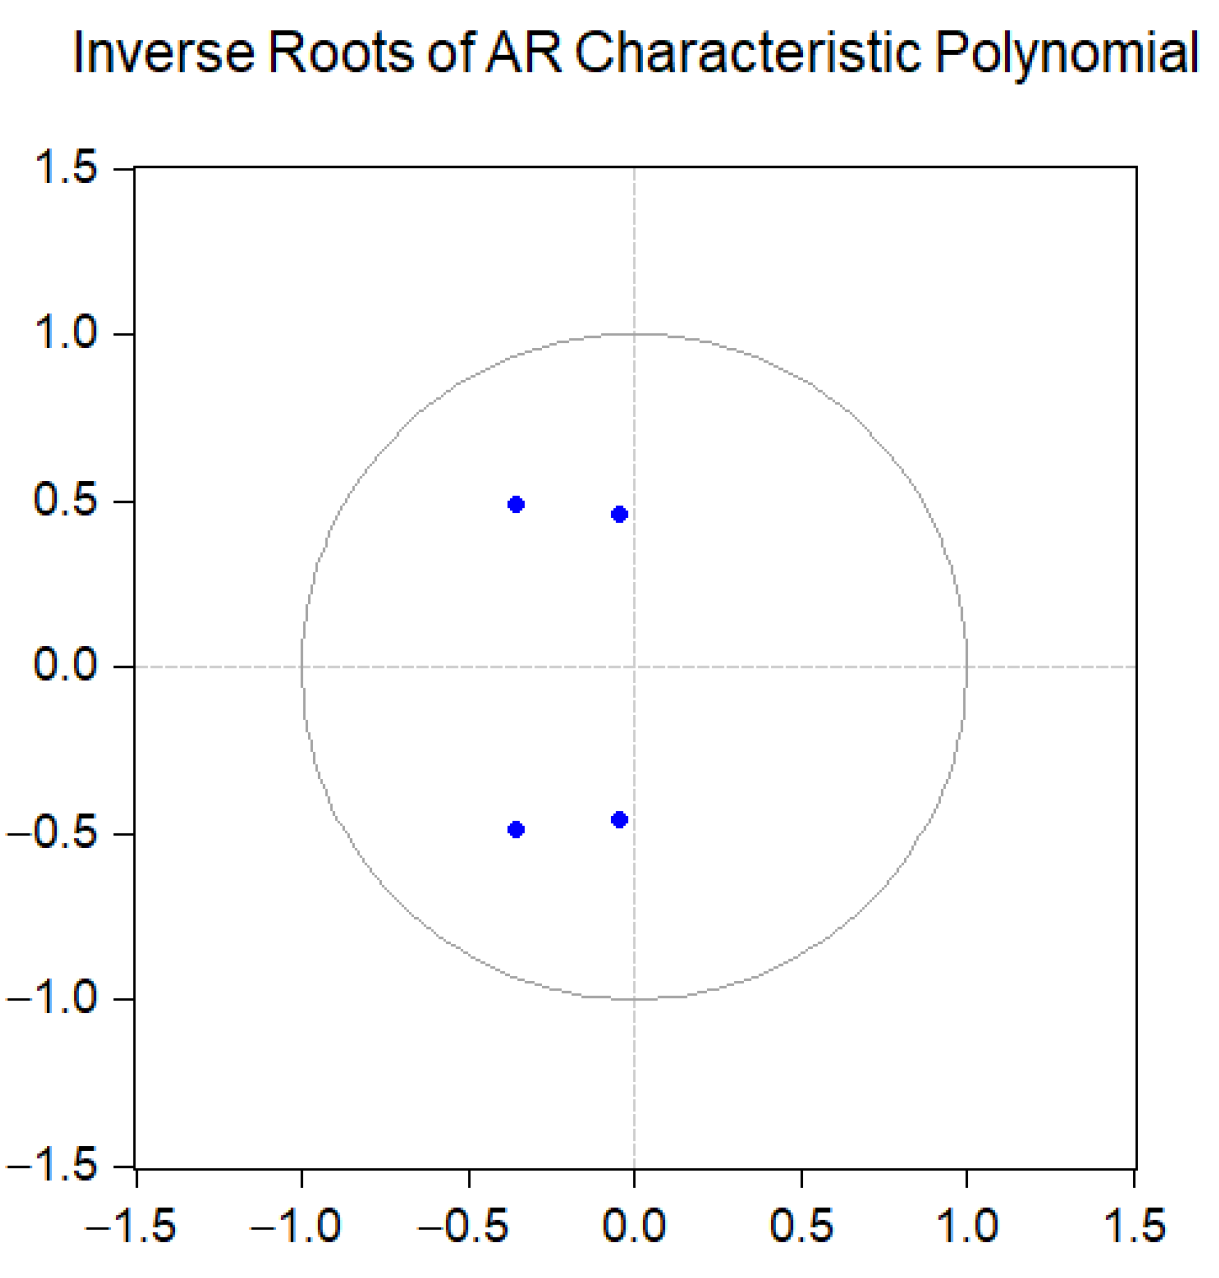
4.3.4. Stability Test of the VAR Model

As illustrated in Figure 3, all roots of the VAR model lie within the unit circle, indicating that the VAR model represents a stable system. This satisfies the stability requirements for the impulse response function.

4.3.5. Impulse Response Analysis

To validate the effectiveness of utilizing OPO analysis for monitoring fluctuations in CBV, impulse response analysis is employed to explain the intrinsic dynamic interaction mechanism between OPO and CBV. From the perspective of brand management, a decrease in CBV has a more significant impact on a corporation. Therefore, in the impulse response analysis, a negative shock is applied to observe the dynamic relationship between OPO and CBV. Figure 4a, Figure 4b, and Figure 4c respectively represent the impulse response of STOCK to half a standard deviation, one standard deviation, and two standard deviations of fluctuations in BVPOI.
As shown in Figure 4, CBV declines slowly during the first two impulse periods. The rate of decline increases in the 3rd period, reaching its peak close to the 4th period. It then continues to decrease until the 6th period before beginning to recover slowly, eventually approaching zero after nearly 20 impulse periods. Figure 4a–c illustrate that the greater the negative shock to BVPOI, the more significant the fluctuation in STOCK. The impulse response analysis results indicate that OPO exerts a direct impact on CBV: negative sentiment in social media leads to a decline in CBV. The more adverse the sentiment, the greater the impact on CBV. Conversely, positive sentiment in social media leads to an increase in CBV. In terms of shock magnitude and duration, the impact on CBV is minimal initially when OPO first emerges. However, the impact becomes significantly more pronounced after 2–3 days, peaking around the sixth day before beginning to wane. Despite this, the impact has a long-tail effect, indicating that the influence on CBV persists for an extended period before stabilizing. Therefore, when negative OPO against a brand emerges on media platforms, enterprises should intervene early to quickly identify and respond to the negative OPO, for example, by doing crisis public relations in the first two days of the OPO, soothing netizens’ emotions in time, reducing the scope of OPO, and protecting the brand’s image. Similarly, when positive brand OPO emerges in social media, enterprises should seize the prime publicity time of 2–3 days to increase exposure, deepen netizens’ positive impression of the brand, and attract more potential consumers.

4.4. Comparisons across Different Brands

To examine the generalizability of the method, this section presents a comparison across different brands facing similar phenomena, taking Li-Ning, a well-known Chinese clothing brand, as another example. At the end of September 2022, the design of new clothing and hats released by the Li-Ning brand sparked controversy, leading to a significant public outcry on social media platforms. Similarly, data were collected from Weibo during the observation period from 1 September 2022 to 30 November 2022, i.e., one month before and after the incident. The lag order was determined using the VAR method presented in Section 4.3.1, Section 4.3.2 and Section 4.3.3. The lag order determination and impulse response results for this case are shown in Table 9 and Figure 5.
Table 10 presents the comparative results of numerical experiments between the Yuyue Medical and Li-Ning brands. The combined results from different brands indicate that the BVPOI constructed using the proposed method exhibits a significant correlation with stock price fluctuations. Moreover, based on the evaluation method of lag order and impulse response, it can be observed that there is a noticeable lag between the OPO monitoring system set up in this study and the actual stock price changes. This demonstrates that the proposed method can be effectively used as a predictive indicator.

5. Discussion

According to the results shown in Section 4, it is observed that the indicators, except for the number of negative blog posts, likes, retweets, comments, and the number of retweets on official blog posts, are significantly associated with CBV. These findings support previous studies, such as those by [24,25], which examine the feasibility of using user-generated data on social media to assess customer brand loyalty. The significant results from the correlation analysis suggest that most indicators proposed in this study have a positive impact on CBV, particularly in shaping the brand’s online reputation. This conclusion is consistent with Sohaib and Han [45], who found that social media marketing positively influences CBV. When potential consumers see or engage with brand-related OPOs, it likely strengthens their value co-creation behavior with the brand. This behavior positively affects users’ attitudes toward CBV co-creation and their perception of brand trust, which in turn enhances purchase intentions [46,47].
It is worth noting that our results indicate that user behaviors related to negative posts do not have a significant negative impact on CBV, contradicting the common perception that “negative OPOs will reduce CBV”. One explanation for this result is that, in the stock market, investors place more importance on long-term effects rather than short-term impacts, hence the minimal influence of short-term negative OPO on MCV. Additionally, as noted by Labrecque et al. [3], while those posting negative brand information may intend to diminish CBV, this behavior can backfire. Negative OPOs may elicit positive responses from loyal consumers to brand posts, inadvertently strengthening potential consumers’ support for the brand.
In addition to social media platform users, some of the indicators in this study pertain to the brand enterprises themselves. The correlation analysis results between the outcomes of the brand’s social media activities on online platforms and CBV align broadly with the findings of Lim et al. [48]. However, this study differs in that the number of retweets on official blog posts is not significantly correlated with CBV. Apart from the behavioral threshold differences mentioned in Section 4.2.1, Another possible reason is that the study by Lim et al. [48] primarily focuses on platforms such as Twitter and Facebook, whereas this paper concentrates on the Chinese “Weibo” platform. User behaviors differ across platforms; for instance, indicators like “Twitter Feeds” and “Facebook Talking” are not present on the “Weibo” platform, while “the number of retweets of official blog posts” is not mentioned in their study. Therefore, the findings of this paper also serve as a supplement, indicating that the impact of different social media activity outcomes on CBV is not entirely uniform across platforms.
Furthermore, impulse analysis results indicate that the comprehensive BVPOI constructed through the EWEM positively influences MCV. The study results reveal that the lag period for the impact of changes in OPO on CBV is two days, consistent with the findings of Xu et al. [49], which identified a two-day lag period for the crisis spillover effect between OPO and abnormal returns. As seen in Figure 4, after a change in OPO, CBV exhibits significant fluctuations on the second to third day, with a long-tail effect. This indicates a dynamic impact between OPO and CBV, and it validates the proposed EWEM’s effectiveness in reflecting abnormal fluctuations in CBV.
The real-time EWEM based on OPO presented in this paper is more dynamic than existing studies that assess CBV using survey data or corporate annual reports. Real-time analysis of CBV changes allows brand managers to proactively monitor and respond to unexpected internet shocks affecting CBV. However, this study primarily focuses on local brands influenced by local OPOs. Whether local OPOs impact the value of foreign brands requires further research. The current approach relies heavily on publicly available OPO data. While this paper considers the dynamic impact of OPO on CBV, other factors, such as the brand’s inherent reputation, also influence CBV changes. Brands with different reputations are affected by OPO to varying degrees. Future research could explore how OPO affects various types of brand differently. Additionally, this study focuses only on publicly traded companies, and the method used does not consider the impact of OPO on the CBV of privately held companies. Therefore, new methods are needed to analyze the impact of OPO on the CBV of non-publicly traded companies.

6. Conclusions

This study identifies a set of OPO indicators related to CBV by analyzing their correlation with MCV. It then develops a CBV EWEM, creating a monitoring system to detect CBV fluctuations. A case study’s numerical analysis shows that the proposed model effectively provides early warnings of CBV anomalies, offering valuable decision-support information for corporate brand crisis management. The main conclusions of this study are as follows:
a.
Integrating existing big data-based research on brands and OPO early warning indicators, this study employs principles of dynamism, accessibility, quantifiability, and scientific rigor to preliminarily screen indicators and constructs a set of OPO indicators related to CBV. Correlation analysis is used to assess the impact of each indicator on CBV. The improved CRITIC method is then applied to calculate the weights of these indicators, leading to the development of a CBV EWEM. The study finds that, except for the number of negative blog posts, likes, retweets, comments, and retweets on official blog posts, all other indicators are positively correlated with CBV. The number of likes on official blog posts carries the highest weight among all indicators.
b.
Combining the VAR model and impulse response analysis, this study investigates the dynamic impact of OPO on CBV. Impulse response analysis reveals that OPO affects CBV in the same direction, with the greatest impact on CBV in the early stage of OPO development. Subsequently, the impact shows a long-term, gradual, and stable decline. These results highlight the influence of OPO on fluctuations in CBV, demonstrating the effectiveness of the proposed evaluation model.
The indicators in this study only include OPO data from public media platforms and do not consider private corporate data, such as the number of followers. Future research could expand the indicator set by collaborating with companies. Additionally, using real-time dynamic data from OPO, it is possible to predict trends in CBV fluctuations. Advanced technologies like big data analysis, artificial intelligence, and machine learning can provide companies with immediate feedback and early warnings, helping them quickly identify issues and opportunities and make timely adjustments to their brand strategy.

Author Contributions

Conceptualization, H.F.; methodology, H.F. and J.Z.; software, J.Z.; validation, H.F. and J.Z.; formal analysis, H.F. and J.Z.; investigation, J.Z.; resources, H.F.; data curation, J.Z.; writing—original draft preparation, J.Z.; writing—review and editing, H.F. All authors have read and agreed to the published version of the manuscript.

Funding

This research received no external funding.

Data Availability Statement

The dataset is available on request from the authors: The raw data supporting the conclusions of this article will be made available by the authors on request.

Conflicts of Interest

The authors declare no conflicts of interest.

References

  1. Rust, R.T.; Rand, W.; Huang, M.H.; Stephen, A.T.; Brooks, G.; Chabuk, T. Real-time brand reputation tracking using social media. J. Mark. 2021, 85, 21–43. [Google Scholar] [CrossRef]
  2. Fossen, B.L.; Schweidel, D.A. Measuring the impact of product placement with brand-related social media conversations and website traffic. Mark. Sci. 2019, 38, 481–499. [Google Scholar] [CrossRef]
  3. Labrecque, L.I.; Markos, E.; Yuksel, M.; Khan, T.A. Value creation (vs. value destruction) as an unintended consequence of negative comments on [innocuous] brand social media posts. J. Interact. Mark. 2022, 57, 115–140. [Google Scholar] [CrossRef]
  4. Bakirtas, H.; Gulpinar Demirci, V. Can Google Trends data provide information on consumer’s perception regarding hotel brands? Inf. Technol. Tour. 2022, 24, 57–83. [Google Scholar] [CrossRef]
  5. Parris, D.L.; Guzman, F. Evolving brand boundaries and expectations: Looking back on brand equity, brand loyalty, and brand image research to move forward. J. Prod. Brand Manag. 2023, 32, 191–234. [Google Scholar] [CrossRef]
  6. Oliveira, M.O.R.d.; Heldt, R.; Silveira, C.S.; Luce, F.B. Brand equity chain and brand equity measurement approaches. Mark. Intell. Plan. 2023, 41, 442–456. [Google Scholar] [CrossRef]
  7. Melović, B.; Vukčević, M.; Dabić, M. The Midas touch of branding: Banks’ brand value, intellectual capital and the optimization of the Interbrand methodology. J. Intellect. Cap. 2021, 22, 92–120. [Google Scholar] [CrossRef]
  8. Bharadwaj, N.; Hanssens, D.M.; Rao, R.K. Corporate brand value and cash holdings. J. Brand Manag. 2020, 27, 408–420. [Google Scholar] [CrossRef]
  9. He, J.; Calder, B.J. The experimental evaluation of brand strength and brand value. J. Bus. Res. 2020, 115, 194–202. [Google Scholar] [CrossRef]
  10. Cuesta-Valino, P.; Gutierrez-Rodriguez, P.; Sierra-Fernandez, M.P.; Aguirre Garcia, M.B. Measuring a multidimensional green brand equity: A tool for entrepreneurship development. Br. Food J. 2021, 123, 3326–3343. [Google Scholar] [CrossRef]
  11. Wang, W.; Wu, D. Construction of rural tourism brand value management model from the perspective of big data. Comput. Intell. Neurosci. 2022, 2022, 5623782. [Google Scholar] [CrossRef] [PubMed]
  12. Sankaran, R.; Chakraborty, S. Measuring consumer perception of overall brand equity drivers for m-payments. Int. J. Bank Mark. 2023, 41, 130–157. [Google Scholar] [CrossRef]
  13. Huang, Y.; Yang, S.; Zhu, Q. Brand equity and the COVID-19 stock market crash: Evidence from US listed firms. Financ. Res. Lett. 2021, 43, 101941. [Google Scholar] [CrossRef]
  14. Swaminathan, V.; Gupta, S.; Keller, K.L.; Lehmann, D. Brand actions and financial consequences: A review of key findings and directions for future research. J. Acad. Mark. Sci. 2022, 50, 639–664. [Google Scholar] [CrossRef]
  15. Farhang, M.; Kamran-Disfani, O.; H. Zadeh, A. Brand equity and stock performance in time of crisis: Evidence from the COVID-19 pandemic. J. Prod. Brand Manag. 2023, 32, 420–435. [Google Scholar] [CrossRef]
  16. Laghi, E.; Di Marcantonio, M.; Cillo, V.; Paoloni, N. The relational side of intellectual capital: An empirical study on brand value evaluation and financial performance. J. Intellect. Cap. 2022, 23, 479–515. [Google Scholar] [CrossRef]
  17. Bhaskaran, R.K.; Sujit, K.S.; Waheed, K.A. Linkage Between Brand Value and Firm Performance: An Empirical Examination Using Fuzzy Set Qualitative Comparative Analysis. SAGE Open 2023, 13. [Google Scholar] [CrossRef]
  18. Wang, H.; Luo, L.; Liu, T. Applying the DEMATEL- ANP Fuzzy Comprehensive Model to Evaluate Public Opinion Events. Appl. Sci. 2023, 13, 5737. [Google Scholar] [CrossRef]
  19. Peng, L.J.; Shao, X.G.; Huang, W.M. Research on the early-warning model of network public opinion of major emergencies. IEEE Access 2021, 9, 44162–44172. [Google Scholar] [CrossRef]
  20. Meng, F.; Xiao, X.; Wang, J. Rating the crisis of online public opinion using a multi-level index system. arXiv 2022, arXiv:2207.14740. [Google Scholar] [CrossRef]
  21. Chen, M.; An, L.; Li, G.; Yu, C. Severity assessment and the early warning mechanism of public events based on the comparison of microblogging characteristics. Inf. Technol. People 2023, 36, 2543–2562. [Google Scholar] [CrossRef]
  22. Shen, Y.; Bian, S.; Song, X.; Geng, X. Research on Risk Assessment of Enterprise Public Opinion in Cross Social Media Context and Sustainable Development Strategies. Sustainability 2024, 16, 1700. [Google Scholar] [CrossRef]
  23. Chung, S.; Shin, D.; Park, J. Predicting firm market performance using the social media promoter score. Mark. Lett. 2022, 33, 545–561. [Google Scholar] [CrossRef]
  24. Kafeza, E.; Rompolas, G.; Kyriazidis, S.; Makris, C. Time-Series Clustering for Determining Behavioral-Based Brand Loyalty of Users Across Social Media. IEEE Trans. Comput. Soc. Syst. 2022, 10, 1951–1965. [Google Scholar] [CrossRef]
  25. Urolagin, S.; Patel, S. User-specific loyalty measure and prediction using deep neural network from Twitter Data. IEEE Trans. Comput. Soc. Syst. 2024, 11, 1046–1061. [Google Scholar] [CrossRef]
  26. Song, J.; Zhu, X. Research on public opinion guidance of converging media based on AHP and transmission dynamics. Math Biosci Eng 2021, 18, 6857–6886. [Google Scholar] [CrossRef]
  27. Ouyang, Z.s.; Lai, Y. Systemic financial risk early warning of financial market in China using Attention-LSTM model. N. Am. J. Econ. Financ. 2021, 56, 101383. [Google Scholar] [CrossRef]
  28. Zhang, M.; Xu, H.; Ma, N.; Pan, X. Intelligent vehicle sales prediction based on online public opinion and online search index. Sustainability 2022, 14, 10344. [Google Scholar] [CrossRef]
  29. Han, W.; Xiao, L.; Wu, X.; He, D.; Wang, Z.; Li, S. Construction of the social network information dissemination index system based on CNNs. Front. Phys. 2022, 10, 807099. [Google Scholar] [CrossRef]
  30. Yang, S. Analysis of Network Public Opinion in New Media Based on BP Neural Network Algorithm. Mob. Inf. Syst. 2022, 2022, 3202099. [Google Scholar] [CrossRef]
  31. Krebs, I.; Lischka, J.A. Is audience engagement worth the buzz? The value of audience engagement, comment reading, and content for online news brands. Journalism 2019, 20, 714–732. [Google Scholar] [CrossRef]
  32. Zhu, R.; Ding, Q.; Yu, M.; Wang, J.; Ma, M. Early warning scheme of COVID-19 related internet public opinion based on RVM-L model. Sustain. Cities Soc. 2021, 74, 103141. [Google Scholar] [CrossRef]
  33. Kontokosta, C.E.; Freeman, L.; Lai, Y. Up-and-Coming or Down-and-Out? Social Media Popularity as an Indicator of Neighborhood Change. J. Plan. Educ. Res. 2024, 44, 662–673. [Google Scholar] [CrossRef]
  34. Zhang, Z.; Xiao, Y.; Fu, Z.; Zhong, K.; Niu, H. A study on early warnings of financial crisis of Chinese listed companies based on DEA–SVM model. Mathematics 2022, 10, 2142. [Google Scholar] [CrossRef]
  35. Li, J.; Ma, Y.; Xu, X.; Pei, J.; He, Y. A study on epidemic information screening, prevention and control of public opinion based on health and medical big data: A case study of COVID-19. Int. J. Environ. Res. Public Health 2022, 19, 9819. [Google Scholar] [CrossRef]
  36. Ma, Y.; Wu, P.; Ling, C.; Ding, S. Research on public opinion effecting on stock price during crises based on model checking. Expert Syst. Appl. 2024, 249, 123442. [Google Scholar] [CrossRef]
  37. Yang, Z.; Jiang, H.; Huang, L.; Liu, Y. Multi Feature Extraction and Trend Prediction for Weibo Topic Dissemination Network. J. Signal Process. Syst. 2024, 96, 1–17. [Google Scholar] [CrossRef]
  38. Ren, R.; Wu, D. An innovative sentiment analysis to measure herd behavior. IEEE Trans. Syst. Man Cybern. Syst. 2018, 50, 3841–3851. [Google Scholar] [CrossRef]
  39. Shapiro, A.H.; Sudhof, M.; Wilson, D.J. Measuring news sentiment. J. Econom. 2022, 228, 221–243. [Google Scholar] [CrossRef]
  40. Xu, Y.; Wang, J.; Chen, Z.; Liang, C. Sentiment indices and stock returns: Evidence from China. Int. J. Financ. Econ. 2023, 28, 1063–1080. [Google Scholar] [CrossRef]
  41. Xu, L.; Lin, H.; Pan, Y.; Ren, H.; Chen, J. Constructing the affective lexicon ontology. J. China Soc. Sci. Tech. Inf. 2008, 27, 180–185. [Google Scholar]
  42. Krishnan, A.R.; Kasim, M.M.; Hamid, R.; Ghazali, M.F. A modified CRITIC method to estimate the objective weights of decision criteria. Symmetry 2021, 13, 973. [Google Scholar] [CrossRef]
  43. Jiang, C.; Wang, J.; Tang, Q.; Lyu, X. Investigating the effects of dimension-specific sentiments on product sales: The perspective of sentiment preferences. J. Assoc. Inf. Syst. 2021, 22, 459. [Google Scholar] [CrossRef]
  44. Ahmed, S.F.; Mohsin, A.; Islam, K.Z.; Hossain, S.F.A. Relationship between greenfield investment and economic growth: Evidence from Bangladesh. Heliyon 2023, 9, e17547. [Google Scholar] [CrossRef] [PubMed]
  45. Sohaib, M.; Han, H. Building value co-creation with social media marketing, brand trust, and brand loyalty. J. Retail. Consum. Serv. 2023, 74, 103442. [Google Scholar] [CrossRef]
  46. Seifert, C.; Kwon, W.S. SNS eWOM sentiment: Impacts on brand value co-creation and trust. Mark. Intell. Plan. 2020, 38, 89–102. [Google Scholar] [CrossRef]
  47. Wang, X.; Wang, Y.; Lin, X.; Abdullat, A. The dual concept of consumer value in social media brand community: A trust transfer perspective. Int. J. Inf. Manag. 2021, 59, 102319. [Google Scholar] [CrossRef]
  48. Lim, J.S.; Pham, P.; Heinrichs, J.H. Impact of social media activity outcomes on brand equity. J. Prod. Brand Manag. 2020, 29, 927–937. [Google Scholar] [CrossRef]
  49. Xu, J.; Guo, D.; Liu, S. How social media expedites the crisis spillover effect: A case study of Tesla’s recall event. Public Relations Rev. 2024, 50, 102432. [Google Scholar] [CrossRef]
Figure 1. General procedure of this study.
Systems 12 00337 g001
Figure 2. CRITIC method analysis procedure.
Systems 12 00337 g002
Figure 3. Stability test chart.
Systems 12 00337 g003
Figure 4. Impulse response results of STOCK to the negative shock in BVPOI.
Systems 12 00337 g004
Figure 5. Impulse response results of STOCK to the negative shock in BVPOI (LI-NING).
Systems 12 00337 g005
Table 1. OPO indicators relevant to CBV.
OPO IndicatorsOccurrence FrequencyLiteratures on CBVLiteratures on OPO
posts0.6875[23,24,25][18,19,20,21,22,26,27,28,29,30]
comments0.6875[3,31][18,19,20,21,22,26,27,29,30,32]
retweets0.625[23,25][18,19,20,21,22,26,29,30,32]
positive posts0.625[25][18,20,21,22,28,29,30,33,34]
negative posts0.625[23][18,20,21,22,28,29,30,33,34]
sentiment0.5625[23,24,25][21,22,29,30,34,35,36,37]
likes0.5625[23,25][18,19,20,21,26,29,30,32]
search0.5[4][18,19,20,22,28,36,37]
Table 2. BB indicators for evaluating relevant OPO sentiments.
OPO IndicatorsBB Indicators
postsnumber of positive blog posts
number of negative blog posts
positive increment in blog posts
commentsnumber of positive blog comments
number of negative blog comments
positive increment in blog comments
comments on official blog posts
retweetsnumber of positive blog retweets
number of negative blog retweets
positive increment in blog retweets
number of retweets on official blog posts
sentimentsentiment tendency
trust tendency
likesnumber of positive blog likes
number of negative blog likes
positive increment in blog likes
number of likes on official blog posts
searchtotal search volume of brand keywords
Table 3. Results of correlation analysis.
Independent VariableCorrelation Coefficient (Significance)
number of positive blog posts0.304 (0.001 ***)
number of positive blog likes0.264 (0.005 ***)
number of positive blog retweets0.198 (0.043 **)
number of positive blog comments0.322 (0.001 ***)
number of negative blog posts0.077 (0.433)
number of negative blog likes0.035 (0.726)
number of negative blog retweets0.056 (0.585)
number of negative blog comments0.068 (0.497)
positive increment in blog posts0.209 (0.027 **)
positive increment in blog likes0.192 (0.037 **)
positive increment in blog retweets0.164 (0.088 *)
positive increment in blog comments0.262 (0.005 ***)
sentiment tendency0.213 (0.023 **)
trust tendency0.271 (0.004 ***)
number of likes on official blog posts0.229 (0.025 **)
number of retweets on official blog posts0.061 (0.561)
number of comments on official blog posts0.217 (0.034 **)
total search volume of brand keywords0.246 (0.006 ***)
Note: ***, **, * represent 1%, 5% and 10% level of significance, respectively.
Table 4. Results of weights.
IndicatorsVariabilityConflictAmount of
Information
Weights
number of positive blog posts0.1820.4170.0760.074
number of positive blog likes0.1320.4540.0600.059
number of positive blog retweets0.1620.4240.0690.067
number of positive blog comments0.1440.4160.0600.059
positive increment in blog posts0.1310.4350.0570.056
positive increment in blog likes0.1200.3820.0460.045
positive increment in blog retweets0.1170.3760.0430.043
positive increment in blog comments0.1420.4070.0580.057
sentiment tendency0.2060.5950.1230.120
trust tendency0.1500.5770.0860.085
number of likes on official blog posts0.1910.7370.1410.138
number of comments on official blog posts0.1690.6850.1160.114
total search volume of brand keywords0.1930.4410.0850.083
Table 5. Information criteria for determining lag order in VAR model.
Information CriteriaFormula
AICAIC = 2 log ( L ) + 2 k
BICBIC = 2 log ( L ) + k log ( N )
HQHQ = 2 log ( L ) + 2 k log ( log ( N ) )
FPEFPE = N + k N k × t = 1 N e t 2 N
Note: log ( L ) is the maximum likelihood estimate of the model. k is the number of parameters in the model. N is the sample size. t = 1 N e t 2 represents the sum of squares of residuals.
Table 6. Unit root test for a variable.
VariableADF Statistic1% Level5% Level10% LevelConclusion
STOCK−2.074−3.551−2.914−2.595unstable
D(STOCK)−3.024 ***−3.568−2.921−2.599stable
BVPOI−2.383−3.555−2.916−2.596unstable
D(BVPOI)−4.268 ***−3.585−2.928−2.602stable
Note: *** represent the 1% level of significance, respectively. D represents the first-order difference of the sequence.
Table 7. Determination of lag order in VAR model.
Lag OrderAICSCHQFPE
0−4.32−4.249−4.2920.013
1−5.867−5.651 *−5.7830.003
2−5.986 *−5.625−5.846 *0.003 *
3−5.94−5.429−5.7430.003
4−5.798−5.135−5.5420.003
5−5.648−4.83−5.3330.004
Note: * indicates lag order selected by the criterion.
Table 8. Results of the Johansen test.
Null HypothesisEigenvalueTrace10% Level5% Level1% Level
None0.1816.10513.42915.49419.935
At most 10.095.1952.7053.8416.635
Table 9. Determination of lag order in VAR model (LI-NING).
Lag OrderAICSCHQFPE
0−1.059−0.991−1.0330.347
1−3.369−3.163 *−3.2880.034
2−3.425−3.079−3.289 *0.033
3−3.446 *−2.957−3.2540.032 *
4−3.283−2.649−3.0360.038
5−3.151−2.369−2.8460.043
Note: * indicates lag order selected by the criterion.
Table 10. Comparative numerical experiments between Yuyue Medical and Li-Ning.
Brand NameCorrelation Coefficient
(BVPOI and Stock)
Lag OrderTime Lag between BVPOI and Stock
(Impulse Response Analysis)
Yuyue Medical0.359 ***2Reaches its peak in the 3rd period
LI-NING0.567 ***3Reaches its peak in the 6th period
Note: *** represent 1% level of significance, respectively. D represents the first-order difference of the sequence.
Disclaimer/Publisher’s Note: The statements, opinions and data contained in all publications are solely those of the individual author(s) and contributor(s) and not of MDPI and/or the editor(s). MDPI and/or the editor(s) disclaim responsibility for any injury to people or property resulting from any ideas, methods, instructions or products referred to in the content.

