Article

Integrating Order Splitting and Acceptance with Batch Delivery in Parallel Machine Scheduling

School of Economics and Management, Beijing Jiaotong University, Beijing 100082, China
*
Author to whom correspondence should be addressed.
Systems 2024, 12(9), 354; https://doi.org/10.3390/systems12090354
Submission received: 3 August 2024 / Revised: 4 September 2024 / Accepted: 6 September 2024 / Published: 8 September 2024

Abstract

:
Multiple production lines can work together to efficiently manufacture certain products. Thus, when capacity is insufficient, it is necessary to decide whether to develop new production lines to ensure the timely completion of all orders. For example, running a new production line for a small number of orders is not cost-effective. Therefore, decision-making involves choosing between paying tardiness costs for a few orders, abandoning some orders, or developing new production lines to maximize efficiency. Additionally, the timely transportation of completed orders is crucial and depends on vehicle usage efficiency. From a transportation perspective, fully loading vehicles is the most efficient, but this may impact the timeliness of orders, leading to potential tardiness costs. By comprehensively considering these aspects, a multi-machine production model is constructed that incorporates transportation batch sequences and uses heuristic algorithms to solve the problem. Finally, designed case examples validate the effectiveness of the model and algorithm.

1. Introduction

Enterprises actively address the parallel machine scheduling problem due to its direct impact on supply capacity and cost control. Recent research in this area has focused on expanding the problem by incorporating additional considerations into parallel machine production, studying it in conjunction with other issues, and developing models to solve real-world cases. Additionally, there has been significant progress in applying, optimizing, and enhancing various algorithms to improve solutions to this problem.
The ultimate goal of production is to meet customer demand, making the timely delivery of goods according to customer requirements a crucial area of study. This involves not only the production of goods but also the means of their transportation. Therefore, in our parallel production process, we consider the issue of batch delivery. By transporting goods in batches, we aim to meet customer needs while controlling transportation costs. Although consolidating as many orders as possible into a single batch for transportation can reduce shipping costs, this can delay the delivery of some orders, which incurs corresponding tardiness costs. Balancing these issues is also a key focus of this paper.
Various researchers have explored different facets of the parallel machine scheduling problem. For example, Li et al. [1] combined parallel machine scheduling with location problems. Bitar et al. [2] studied non-identical parallel machines considering auxiliary resources, machine startup times, and independent queues, while Agárdi et al. [3] aimed to maximize revenue by considering machine setup times, production batch issues, and backlog issues. De and Laguna [4] incorporated inventory problems into the parallel machine problem, and Lee and Jang [5] examined the parallel machine problem with machines of differing efficiencies. Fang et al. [6] considered the working and rest times of employees in the parallel machine problem. Page and Solis-Oba [7] improved overall efficiency by dividing tasks into different groups, while Arık and Toksarı [8] addressed issues in fuzzy states, including uncertainties caused by learning and deterioration. Guo et al. [9] looked at job synchronization in the logistics of hub terminals. Pei et al. [10] studied a parallel batch scheduling problem considering processing costs and benefits, viewing processing time as a step function of the starting time and due date. Many other scholars have also examined energy consumption and sustainability. Yepes-borrero et al. [11] tackled a bi-objective parallel machine scheduling problem with sequence-dependent setup times and limited resources using an iterated greedy algorithm, which outperformed previous methods. Using an augmented ε -constraint method and NSGA-II, Wang et al. [12] tackled a parallel machine scheduling problem to minimize energy consumption and makespan. To address a parallel machine scheduling problem with sequence-dependent setups and shared resources, Akyol and Sarac [13] used mixed-integer programming and a genetic algorithm. In their study on the unrelated parallel machine scheduling problem with a scarce resource, Villa et al. [14] proposed heuristics that outperformed existing methods, particularly for large instances. Safarzadeh and Niaki [15] addressed a green scheduling problem in parallel machines, aiming to minimize both the green cost and makespan using an improved heuristic and the ε -constraint method. Della and Scatamacchia [16] conducted further research and expansion of the scheduling problem based on the Longest Processing Time rule.
Many researchers have also addressed practical production problems by focusing on various research objects. Rudek [17] developed a new, general optimization framework to address scheduling issues that involve machine deterioration and maintenance tasks. Srinath [18] addressed a scheduling problem involving sequence-dependent setups and preferences. Kim [19] studied the factory production of 3D-printed parts, examining the issue from the perspective of parallel machine production boundaries. Agárdi et al. [3] focused on yogurt production planning and product distribution, Li et al. [20] researched the lace-dyeing process, and De and Laguna [4] investigated the pipe-insulation industry. Kusoncum et al. [21] constructed a mathematical model for the loading and unloading system of sugarcane.
Various researchers have attempted to solve the model by employing different algorithms to address challenges. Li [22] proposed a data-driven hybrid learning methodology to solve the parallel machine scheduling problem. Yepes-borrero et al. [11] utilized a variety of algorithms, including the Truncated Task Iterated Pareto Greedy algorithm. Kusoncum et al. [21] used the Variable Neighborhood Strategy Adaptive Search to tackle large-scale mathematical problems. To solve the multi-objective multi-machine production problem, Lei et al. [23,24] applied an improved Artificial Bee Colony algorithm. Wu and Ch [25] employed a Memetic Differential Evolution algorithm for the multi-machine problem, while Yunusoglu et al. [26] and Wu et al. [27] used the branch-and-bound algorithm, and Kowalczyk and Leus [28] tackled the problem using zero-suppressed binary decision diagrams with weights. Ewees et al. [29] applied a modified Salp Swarm algorithm based on the Firefly algorithm. Laha and Gupta [30], Majumder et al. [31], and Cao et al. [32] each utilized different improved Cuckoo Search algorithms to address multi-machine production problems. Soares et al. [33] employed a hybrid evolutionary algorithm, and Bulhoes et al. [34] used a branch-cut-and-price algorithm. Ouazene and Yalaoui [35] proposed a Lexicographic search algorithm to address the deterioration effect over time. Gedik et al. [36] employed a novel constraint programming approach, and Li et al. [20] used a hybrid Differential Evolution algorithm. Xiong et al. [37] applied the branch-and-price algorithm. Exposito-Izquierdo C et al. [38] first used a Metaheuristic algorithm to find high-quality solutions and then verified them using a multi-agent simulation approach. Ezugwu et al. [39] proposed a method using the Symbiotic Organisms Search. Vallada et al. [40] introduced a Scatter Search algorithm combined with an enriched iterated greedy approach. Finally, Yepes-Borrero et al. [41] solved the problem using the Greedy Randomized Adaptive Search Procedure.
Production primarily aims to meet market demand, which is often reflected by orders. Therefore, closely aligning production with order management is crucial. Sometimes, when enterprise production capacity is insufficient, adding a new production line to complete an order can backfire. For example, starting a new production line for a small order may be uneconomical if the fixed startup cost of the machine exceeds the order’s revenue. However, reallocating some of the original orders to the new machine may reduce the tardiness cost for some orders and potentially increase revenue by lowering the total cost.
In real-world factory production, multiple machines may operate simultaneously, forming several production lines. To complete complex orders more quickly, splitting an order across multiple machines can expedite production and delivery, thereby reducing tardiness costs. When orders are produced on parallel machines simultaneously, the decision-making process regarding order selection, splitting, production sequence, and transportation batches becomes more complex. This paper addresses parallel machine scheduling decisions in such an environment.

2. Problem Description

An order from the same company may contain several sub-orders, which can be split and produced at different times and on different machines. Additionally, due to varying production times and vehicle capacity limitations, orders from the same customer might not be transportable by the same vehicle, leading to batch delivery issues. Production facilities often serve more than one customer. Having too few production lines operational can result in order backlogs and corresponding tardiness costs. When the tardiness cost becomes too large, the factory might have to reject some orders. However, if the factory has multiple production lines, the order volume is substantial, and the new income from starting a new production line exceeds the fixed startup cost, starting a new production line can be considered. After multiple machines are operational, the situation evolves into a parallel machine problem. Once orders are produced, delivering them to customers becomes the next crucial step. By integrating transportation and production considerations, we can achieve effective solutions and enhance overall efficiency. In such a scenario, the following issues need to be addressed:
  • Optimal Machine Utilization: Determine the number of machines to put into production to maximize the benefit.
  • Order Acceptance: Decide which orders to accept and which to reject. Some orders will be rejected if their revenue does not exceed the tardiness cost.
  • Production Assignment and Scheduling: Determine which production line (or machine) will handle the accepted orders and when; in other words, establish the production sequence of orders on each machine.
  • Order Transportation: Plan the transportation of completed orders. Specifically, for direct transportation, classify which orders will be transported in the same batch (vehicle), and decide whether to use the company’s own vehicles or third-party logistics (3PL).
By addressing these issues, the factory can optimize its production and order fulfillment processes, reducing costs and improving efficiency. Table 1 lists the main notations used in this paper for the convenience of readers’ understanding.

3. Model

We can derive a mathematical model from the previous analysis and use it to determine the production sequence and delivery batch for each order. After establishing the production sequence for each order, the duration of machine occupation for different tasks can also be calculated, given that the production time for each order is known. The decision variables include the following:
g l = 1 , if machine l is started 0 , otherwise
y j = 1 , if order j is accepted 0 , otherwise
x j p l = 1 , if order j is placed in position p in sequence of l 0 , otherwise
u v k = 1 , if vehicle v serves customer k 0 , otherwise
A i v = 1 , if order i is allocated to batch v ( or vehicle v ) 0 , otherwise
C i = the completion time (shipping ready time) of order i;
T i = the tardiness time of order i.
The aim of the model is to maximize the Total Net Profit (TNP), as outlined below:
max T N P = i N Q i y i l L g l f l m + i N w i ω i + v V s k K f k s u v k + v V h k K f k h u v k + v V h k K i N k δ k S i A i v
S.T.
g l x i p l , i N , p P l , l L
l L p P l x i p l = y i , i N
i N x i p l 1 , p P l , l L
t i c + M ( 1 x i p l ) p = 1 p T i x i p l , i N , p P l , l L
k K u v k 1 , v V
v V A i v = y i , i N
A i v u v k , i N k , k K
i N S i A i v C v , v V
t v t i c A i v , i N
t i a + M ( 1 A i v ) t v A i v + τ k , k K , i N k
ω i + M ( 1 A i v ) ( t i a D i ) + , i N , v V
t i c , ω i , t i a 0 , i N
x i p l , g l , u i v , A i v { 0 , 1 } , i N , l L , p P l , v V
Expression (1) represents the maximization of the Total Net Profit (TNP), which is obtained by subtracting the fixed startup expenses for the machine, the cost of delays (tardiness cost), and transportation expenses from the total revenue.
Constraint (2) represents the machine startup constraint: machine l must be active when it is used to produce an order.
Constraints (3) and (4) are order acceptance and production constraints. Constraint (3) indicates that if an order is accepted, it must be produced on a machine. Constraint (4) ensures that each order is produced only once.
Constraint (5) addresses production time constraints. It specifies that the completion time of order i is the sum of the production times of all orders in the queue before it is on the production line plus the production time required for order i. All machines are assumed to have a default start time of 0.
Constraints (6)–(9) are transportation constraints. Constraint (6) indicates that each vehicle can serve only one customer at a time. Once a vehicle departs from the factory, it goes directly to the customer to complete the transportation task. Constraint (7) indicates that once an order is accepted, it must be assigned to a vehicle for transportation. Constraint (8) states that an order for customer k can only be transported by vehicle v if vehicle v is serving customer k. Constraint (9) states that the load of a single vehicle cannot exceed its capacity.
Constraints (10)–(12) are tardiness constraints. Constraint (10) indicates that the departure time of a vehicle from the factory is the completion time of the last order it has loaded. Constraint (11) specifies that the arrival time of the vehicle at the customer’s location is the departure time plus the travel time to the customer. Constraint (12) states that the tardiness time is the difference between the arrival time and the desired time and that this difference must be a non-negative number.

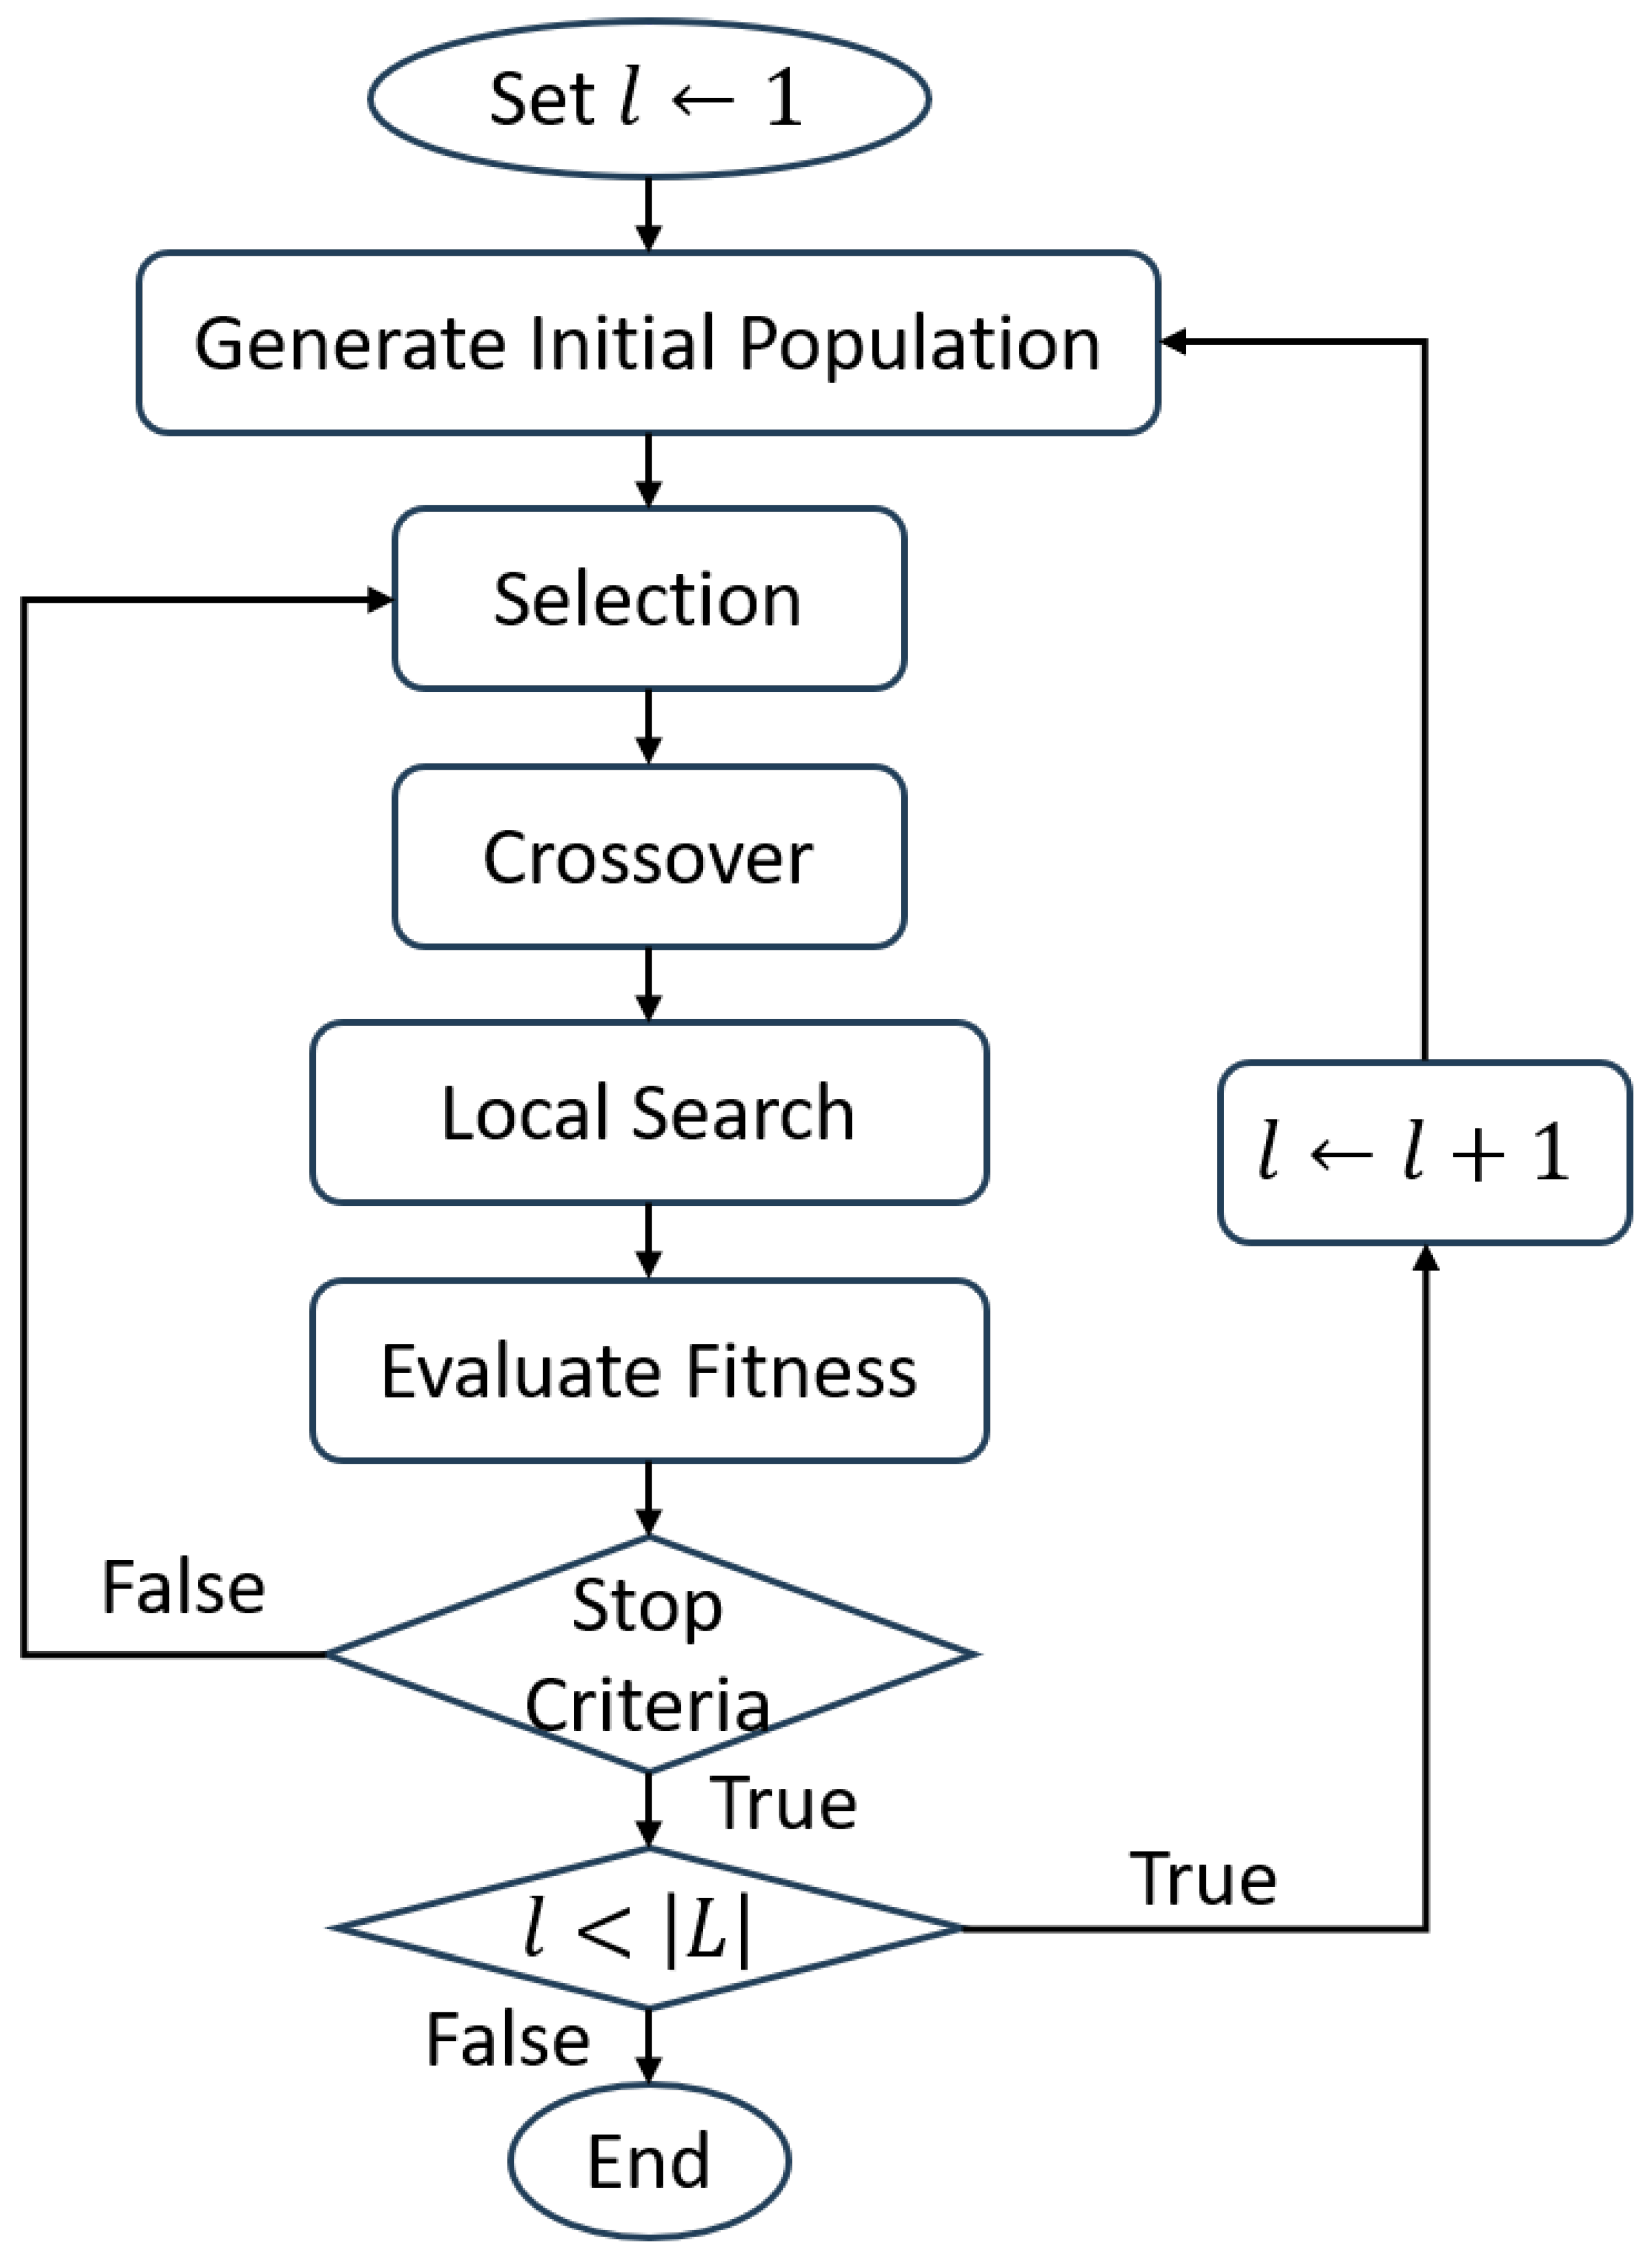
4. Genetic Algorithm

In typical genetic algorithm calculations, the population size can be set as needed, and the size of an individual gene usually remains constant throughout the computation. However, in the problem discussed in this paper, the number of machines to be started is variable. Therefore, during the calculation process, the algorithm needs to continuously adjust to find the most suitable gene length, which corresponds to the optimal number of machines to start. The algorithm’s process is detailed in Figure 1.
We present three propositions to enhance our understanding of the impact of order and machine allocation in production scheduling. These propositions address the effects of removing orders from a batch, changing the sequence of orders within the same batch, and ensuring the integrity of orders within a batch. By examining these scenarios, we aim to highlight key factors that influence production efficiency and the overall optimization of the scheduling process.
Proposition 1.
When an order is removed from a batch, the ready time of all remaining orders in the batch is advanced.
Proof. 
Once the production order is determined for each machine, removing an order from a batch shortens the final completion time of the batch, which, in turn, advances the completion time of each remaining order in the batch. □
Proposition 2.
Changing the sequence of orders within the same batch on the same machine does not affect the calculation results. However, altering the allocation of orders between different machines within the same batch impacts the calculation results.
Proof. 
A batch consists of several orders. When these orders are produced on two machines, the production time on each machine differs, and the ready time of the batch is determined by the completion time of the last order in the batch. Changing the allocation of orders between machines modifies the batch’s final order completion time. □
Proposition 3.
Orders in the same batch on the same machine are not separated. Proof. Orders in the same batch are processed together to ensure continuous production and minimize setup times and tardiness. Separating orders within the same batch would disrupt the production flow and lead to increased tardiness and costs [42].

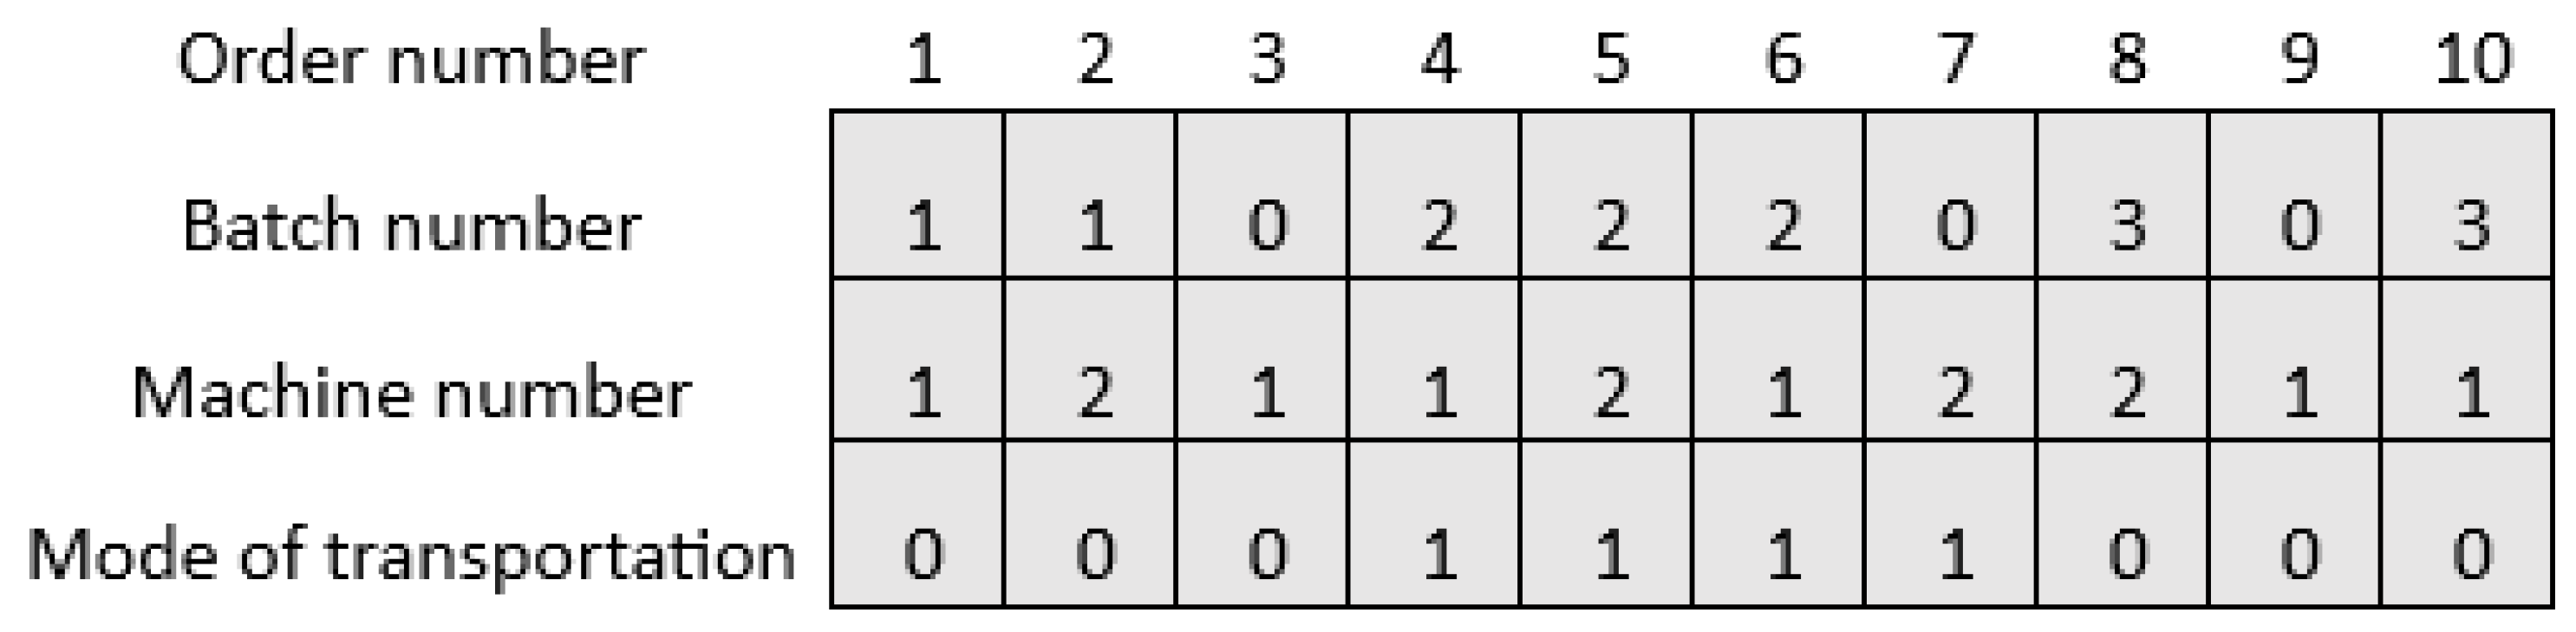
4.1. Encoding Scheme

In the proposed genetic algorithm (GA), each gene contains three pieces of information: the batch to which each order belongs, the machine used to produce each order, and the adopted mode of transportation for each batch. The three pieces of information associated with each order, as exemplified in Figure 2, are defined as follows:
  • Batch Number (or Vehicle Number): The batch to which the order belongs. Batch 0 indicates a virtual batch, and the orders in this batch are unaccepted.
  • Machine Number: The machine used to produce the order.
  • Mode of Transportation: A value of 0 means that the company’s own vehicle is used for transportation, and 1 indicates the use of third-party logistics.
Figure 2. A chromosome of the proposed GA.
Systems 12 00354 g002
When these three factors are established for all orders, the specific production scheme is determined, as illustrated in Figure 3.

4.2. Initial Population

We follow the principle of the Shortest Processing Time (SPT) [43] to construct the initial population. Orders from customer k are placed into Batch 1 in sequence. If the number of orders in Batch (Vehicle) 1 exceeds its capacity, a new batch, Batch 2, is created. Once all customers’ orders are assigned to batches, the batches are arranged in non-increasing order based on the sum of processing times for all orders in each batch. This forms a preliminary production sequence. When only one machine is started, this sequence serves as the initial solution for the actual production order, as illustrated by the “single machine” in Figure 4. When multiple machines are involved, three simple heuristics are applied:
Heuristic H1: Orders in the same batch are produced on only one machine. As shown in Figure 4, parallel machines are used for separate production.
Heuristic H2: Orders in each batch are produced simultaneously on all machines. If the number of orders (j) in batch b is less than the number of starting machines (l), the orders in this batch are jointly produced by J machines. As illustrated in Figure 4, this is referred to as parallel machines, joint production.
Heuristic H3: When l machines are started, the process involves two steps:
Step 1.
The first l batches are produced separately by each machine.
Step 2.
One by one, orders in the next l batches are added to the machine with the Shortest Processing Time. If the processing times of all machines are equal, orders are assigned starting from the first machine in sequence.
Figure 4. Initial population.
Systems 12 00354 g004
Steps 1 and 2 are repeated until all orders are assigned to specific production machines. This approach is depicted in Figure 4 as parallel machines, mixed joint production.
If the tardiness cost of an order exceeds the revenue generated by the order, specifically if Q i w i T i < 0 , the order is removed from the initial population and assigned a batch number of 0. According to Proposition 1, removing an order from a batch shortens the completion time of the entire batch. Consequently, orders originally yielding negative returns in the batch may now yield positive returns. Therefore, orders are removed one by one until no orders with negative returns remain. Finally, vehicles are allocated in batch order: the first V batches are assigned to company-owned vehicles, while the remaining batches are allocated to 3PL. This process results in three initial populations: H1, H2, and H3.

4.3. Selection Mechanism

The selection mechanism directly influences the diversity and convergence of the algorithm. While rapid convergence can quickly yield results, it may lead to a loss of population diversity, whereas excessive diversity can result in redundant calculations. Therefore, an effective selection mechanism is crucial for maintaining both population diversity and efficient computation. The selection mechanism in the proposed method is based on the One-Fifth Success Rule (OFSR) [43], as designed by Alavidoost et al. [44].
The probability of selecting each chromosome is determined by dividing its fitness by the sum of all fitness values (Equation (15)). Below, S P is the selective pressure, F v is the fitness of the v-th chromosome, p v is the probability of selecting the v-th chromosome, and N is the population size:
p v = e S P × F v v = 1 N e S P × F v
The goal of adjusting the selective pressure ( S P )—which is the ratio of the probability of selecting the best member of the population to the average of probabilities of selecting the other members—is to ensure that the total probability of the bottom half of the population (the Weaker-Half Probability, WHP) equals one-fifth. When the Weaker-Half Probability ( W H P ) is equal to 1/5, it is considered optimal. Therefore, different strategies must be employed depending on whether the WHP is equal to or different from 1/5. Additionally, applying the One-Fifth Success Rule (OFSR) aids in fine-tuning the S P .
W H P = v = N 2 N p v = 1 5
If the WHP is small, then,
S P ( t + 1 ) = 1 + ( W H P 1 5 ) × D o F s m a l l + α ( Δ S P t )
If the WHP is big, then,
S P ( t + 1 ) = 1 + ( W H P 1 5 ) × D o F b i g + α ( Δ S P t )
If the WHP is good, then
S P ( t + 1 ) = 1 + ( W H P 1 5 ) × D o F g o o d + α ( Δ S P t )
The parameter α in Formulas (17)–(19) represents momentum. In these formulas, the variation in S P and its direction in iterations Δ S P t influence the SP in the next iteration, S P ( t + 1 ) , aiming to accelerate convergence. The defined fuzzy rules impact the SP iteratively while ensuring that the WHP satisfies the fuzzy term defined as “good”, meaning that the WHP is approximately equal to 1 5 .
We introduce membership functions (MFs) to characterize fuzzy sets defining the WHP as small, big, and good. The membership functions used are a Gaussian MF, a sigmoid MF, and a reverse sigmoid MF, as illustrated in Figure 5.

4.4. Genetic Operators
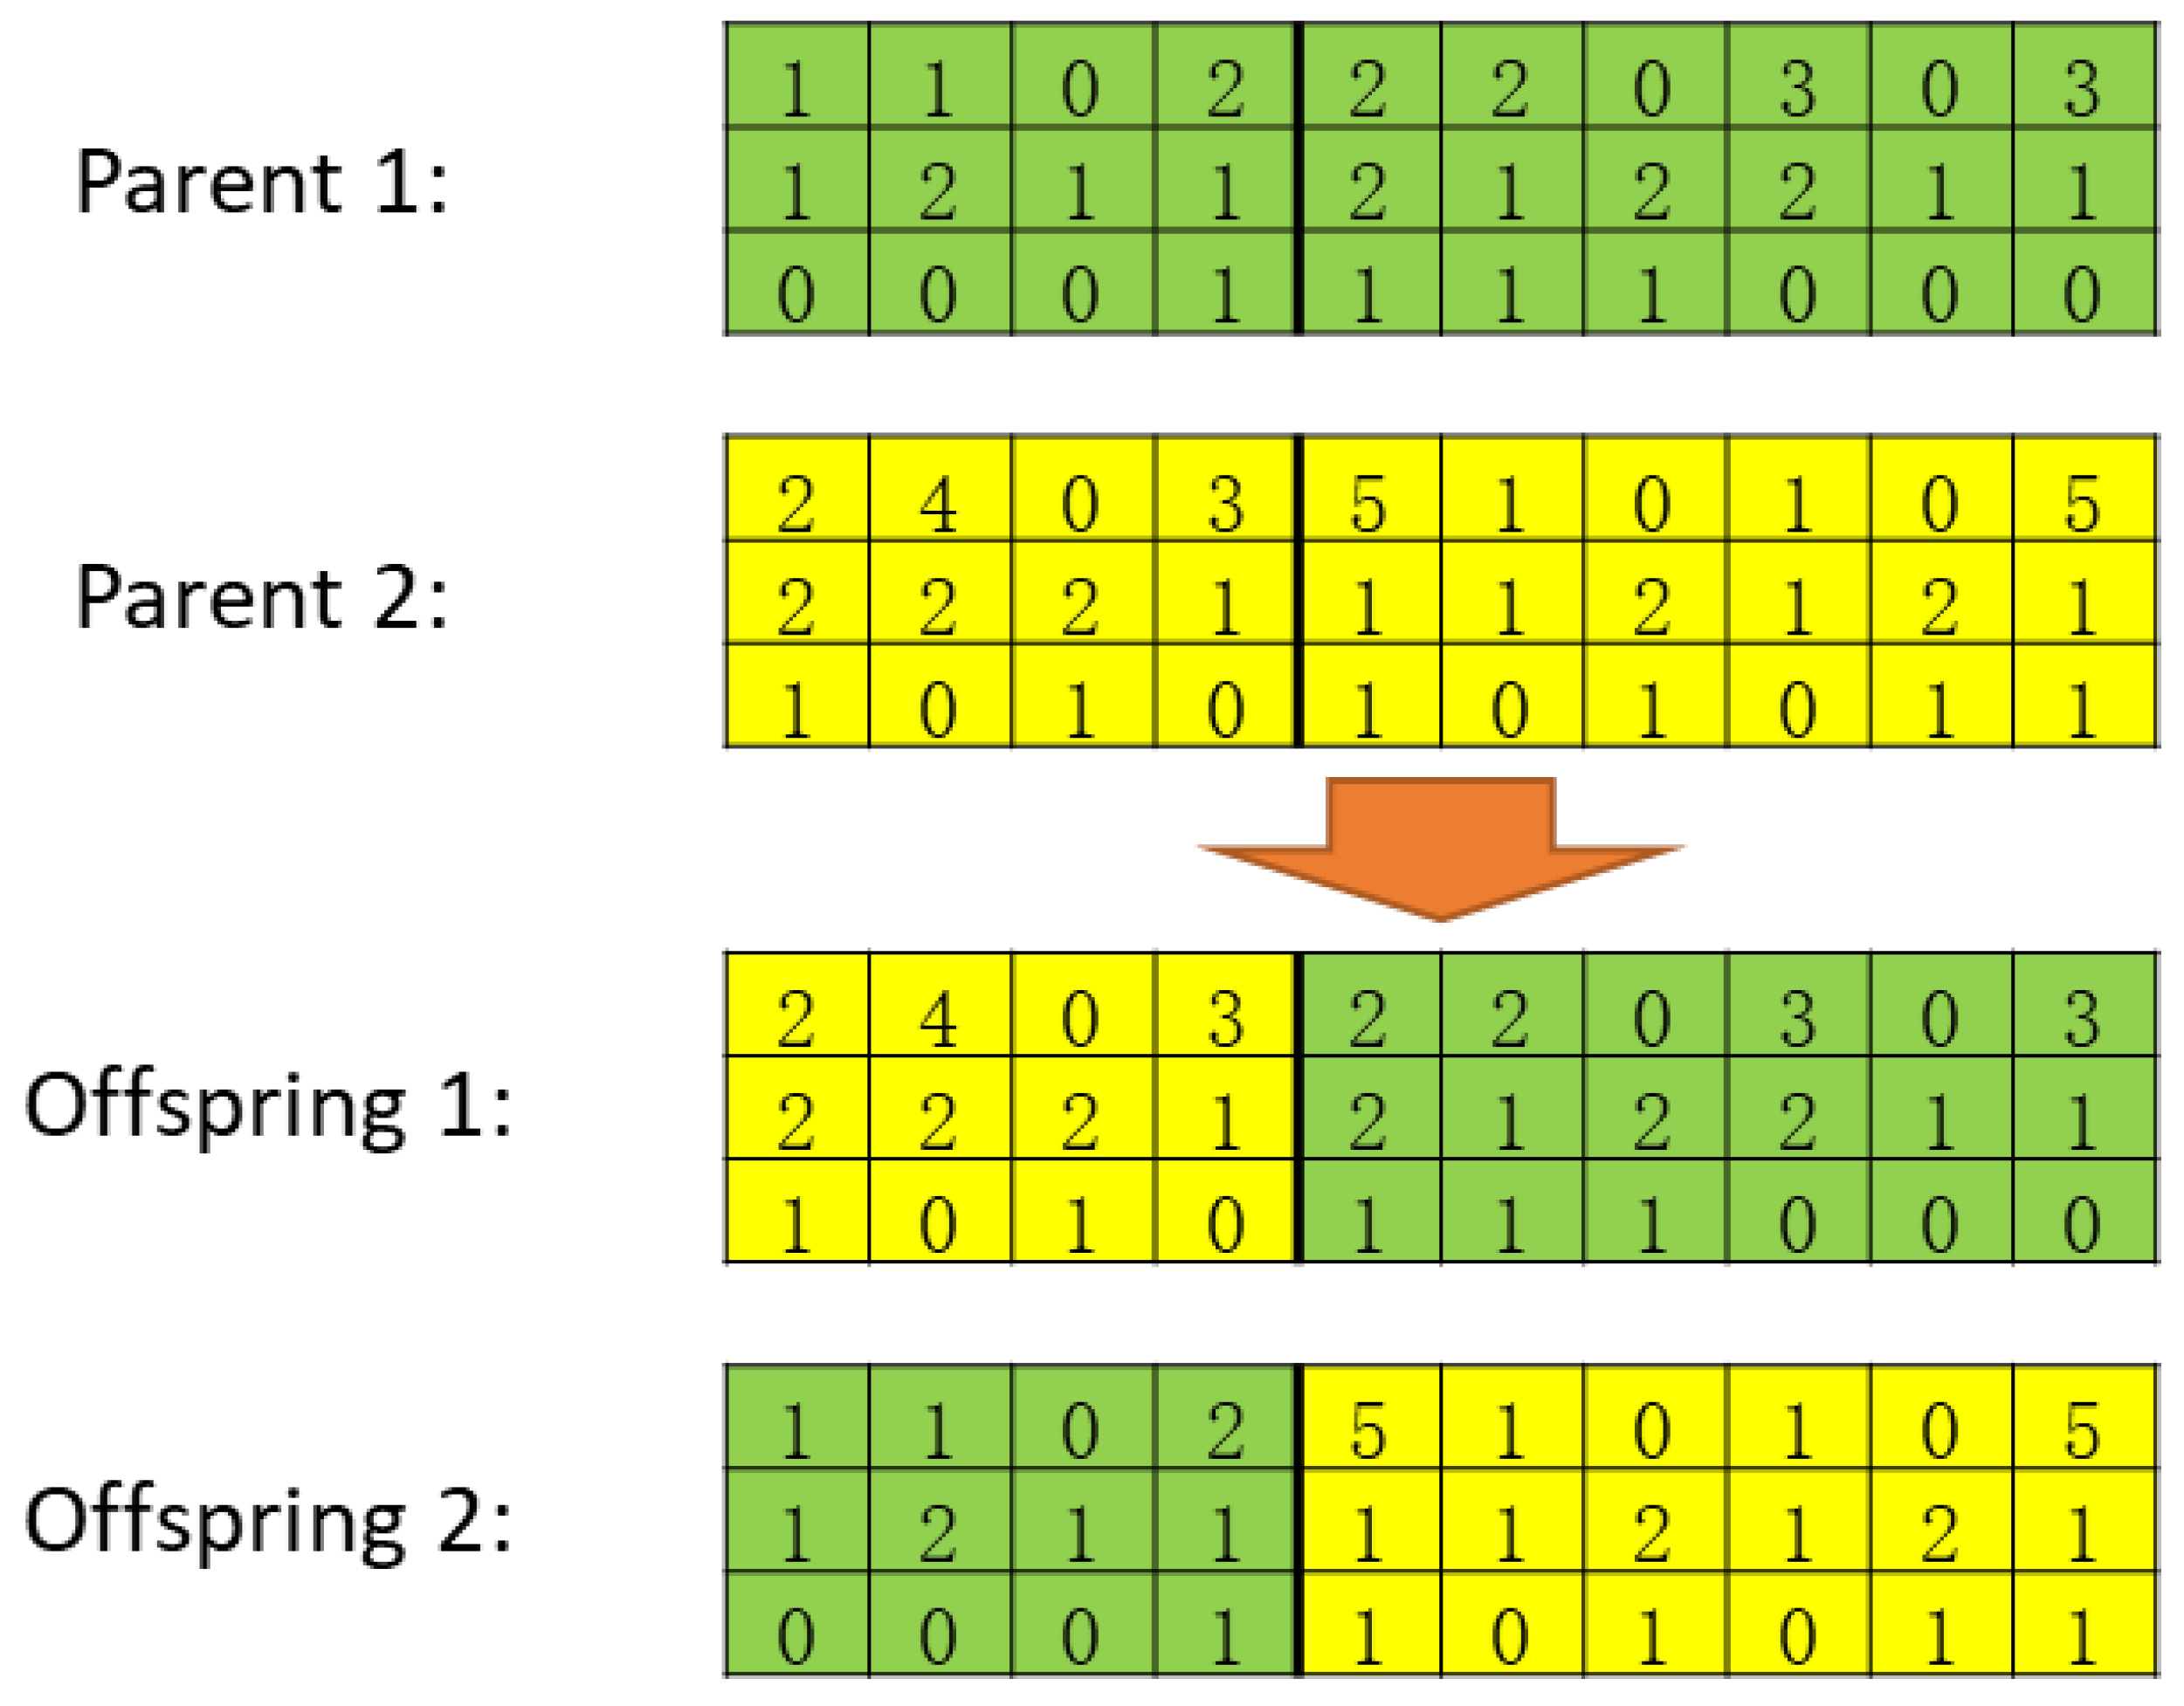
Crossover

We discuss four effective crossover methods in this paper—single-point crossover, two-point crossover, uniform crossover, and uniform two-point crossover—as outlined below.
A single-point crossover, also known as a simple crossover, involves selecting a random crossover point in the individual coding string and then exchanging the chromosome segments between parental individuals at that point. Figure 6 illustrates the schematic of the single-point crossover operation.
A two-point crossover involves setting two random crossover points in the individual coding strings and exchanging the segments between the parents at these points. The specific procedure for the two-point crossover is as follows:
  • Select two random crossover points in each of the paired individual coding strings;
  • Exchange the chromosome segments between the two individuals at these crossover points.
Figure 7 illustrates a schematic diagram of the two-point crossover operation.
A uniform crossover involves exchanging genes at each locus between two paired individuals with a certain crossover probability to produce two new offspring. Figure 8 illustrates this process. The specific operation is as follows:
  • Generate a random binary vector { β i } with the same length as the individual genes.
  • For each locus i, apply the following rules:
    • If β i = 0 , offspring 1 inherits the gene value from parent 1 at locus i, and offspring 2 inherits the gene value from parent 2 at the same locus.
    • If β i = 1 , offspring 1 inherits the gene value from parent 2 at locus i, and offspring 2 inherits the gene value from parent 1 at the same locus.
Figure 8. Generating two offspring from two parents using uniform crossover.
Systems 12 00354 g008
A uniform two-point crossover involves randomly generating two crossover points in two parental individuals, A and B, and then performing gene exchanges based on random integers (0, 1, or 2) to create two new individuals. The process is as follows:
  • When the random number is 0, the crossover occurs in the front part of the individual.
  • When the random number is 1, the crossover happens in the middle part.
  • When the random number is 2, the crossover takes place in the back part of the individual.
In each iteration, a random number p c o between 0 and 1 is generated, and the following rules apply:
  • If p c o p O P , a one-point crossover is applied.
  • If p O P < p c o p T P , a two-point crossover is applied.
  • If p T P < p c o , a uniform crossover is applied.

4.5. Mutation

Allowing genes to mutate with a certain probability during the inheritance process helps prevent the computation from being confined to local optima in genetic algorithms. The mutation probability is a value that needs to be carefully determined. Our mutation rate ( γ ) control is based on the One-Fifth Success Rule (OFSR). The four rules for controlling γ are as follows [44]:
  • Rule 1: If p s = 1 5 , then γ t + 1 = γ t .
  • Rule 2: If p s > 1 5 , then γ t + 1 = C × γ t .
  • Rule 3: If p s < 1 5 and γ t C < 1 , then γ t + 1 = γ t C .
  • Rule 4: If p s < 1 5 and γ t C > 1 , then γ t + 1 = 1 .
Here, p s represents the mutation success probability over the past k generations, and t is the iteration number. Note that γ and C are values less than 1. To increase γ , it is multiplied by C (Rule 2). Additionally, γ cannot exceed 1, so if γ t C is greater than 1, γ should be set to 1 (Rule 4).
A random number, p mu , between 0 and 1 is generated for each offspring gene. If p mu > γ , the gene remains unchanged. If p mu γ , the gene is mutated according to one of the following methods: interchange mutation, inversion mutation, or insertion mutation.
Interchange mutation: Two randomly chosen genes within the chromosome are swapped (Figure 9).
Inversion mutation: The genes between two randomly chosen cut-points are reversed (Figure 10).
Insertion mutation: A gene is chosen randomly and inserted into another position within the chromosome (Figure 11).
For each gene about to be mutated, the following rules apply:
  • If p μ γ p int , then apply interchange mutation.
  • If p int < p μ γ p inv , then apply inversion mutation.
  • If p inv < p μ γ , then apply insertion mutation.

4.6. Local Search

A local search identifies better individuals near the optimal individuals in each generation’s population. Based on Proposition 2, the proposed local search achieves overall optimization by exchanging orders within the same batch between different machines.
In Figure 12, the total processing time of Machine 1 is greater than that of Machine 2. Additionally, the processing time of batch ‘a’ on Machine 1 is greater than that of batch ‘a’ on Machine 2. To optimize production, the contents of batch ‘a’ on the two machines are exchanged, resulting in a new gene. The Total Net Profit (TNP) before and after the swap is compared, and the better one is retained. When a batch is produced on multiple machines simultaneously (machine number l 3 ), the two machines with the largest difference in total processing time are prioritized for exchange.
Three constraints may be violated in the proposed chromosome. Therefore, we use a modification mechanism that effectively addresses these issues [42].
  • Constraints That May Be Violated:
    • Directing Delivery Constraint: A batch cannot contain orders from two or more customers.
    • Vehicle Capacity Constraint: The total occupied space of all orders in a batch should not exceed the maximum capacity of a vehicle.
    • Company Vehicle Number Constraint: At most, V batches can be transported by the company.
  • Modification Mechanism:
    Step 1.
    For all batches that violate the Directing Delivery Constraint, retain the orders belonging to the family of the first order and remove all other orders.
    Step 2.
    For all batches that violate the Vehicle Capacity Constraint, keep orders as long as the total occupied space does not exceed the vehicle capacity.
    Step 3.
    Place all removed orders in their respective family batches as long as the vehicle capacity is not exceeded; otherwise, form new batches using these orders.
    Step 4.
    For all formed batches, retain the first V batches to be transported by the company and transport the remaining batches using the third-party logistics (3PL) provider.

5. Computational Experiment

5.1. Parameter Settings

We tested the fitness of the initial population with three different customer numbers: 15, 10, and 5. The order number for each customer was randomly generated within the ranges [0, 15], [0, 10], and [0, 5]. Therefore, the problem can be divided into six different-sized problems: 15 × 10, 15 × 5, 10 × 10, 10 × 5, 5 × 10, and 5 × 5. In this notation, the first number represents the number of customers, the second number represents the number of orders per customer, and their product indicates the total order number.
We randomly generated parameters for the test cases within reasonable ranges based on the parameter settings used in previous similar studies. The ranges for these parameters are as follows:
  • Fixed cost of starting a machine: 30;
  • Machine number: 3 to 6;
  • Unit revenue for each order: 30 to 60;
  • Processing time: 10 to 16;
  • Size of an order: 1 to 7;
  • Transportation time: 1 to 4;
  • Tardiness cost: 3 to 9;
  • Cost of transportation by the company: 20;
  • Fixed cost of transportation by the 3PL provider: 8;
  • Variable cost of transportation by the 3PL provider: 4;
  • Transporter capacity: 20;
  • Due date: generated randomly within a certain range for each order.
The population size was set to 70, with a total of 1000 iterations.

5.2. Computation Results

Each example varies even if the number of customers remains constant since the order number is generated randomly for each customer. We compared the advantages and disadvantages of the primary populations generated by H1, H2, and H3 under different conditions by generating 50 examples for each scale.
The initial population generated using H3 consistently outperforms those from H1 and H2 from Table 2. To evaluate the algorithm’s convergence, we conducted 1000 iterations on a problem size of 15 × 10 (see Figure 13).
The algorithm achieves nearly optimal results within approximately 150–200 generations, as shown in Figure 13. As described in Section 4.6, the results obtained directly through the genetic algorithm before any corrections may violate some constraints. Therefore, the results need to be corrected using the correction method detailed in Section 4.6. The need to correct the results may cause the convergence of the calculations to fluctuate within a small range. We also compared the convergence performance of different initial solutions, as shown in Figure 14 and Table 3.
In Figure 14, we observe that the algorithm consistently achieves nearly optimal results within 150–200 generations. H1, H2, and H3 represent three distinct initial solutions, each of which produces unique feasible outcomes. H2 shows a clear advantage in solution quality after sufficient generations, while H3 converges rapidly. As indicated in Table 2, although H3 quickly narrows down to a range close to the optimal solution, H1 and H2 continue to improve and provide better solutions with additional iterations. This suggests that the initial population generated by H3 might exclude some high-quality genes.
By artificially limiting the number of machines and comparing the benefits of starting different numbers of machines, we observe that, with a sufficient number of orders, e.g., 15 × 10, increasing the number of machines significantly boosts the benefit, as shown in Figure 15. However, after reaching a certain number, the benefit no longer increases. If the number of machines continues to rise, the revenue may slightly decrease, indicating that the current number of machines is sufficient to meet production needs. Further increasing the number of machines will only raise the fixed startup costs without a substantial additional benefit.
The optimal number of machines to start varies with different problem scales, as shown in Table 4. As the problem scale increases, starting more machines yields a greater benefit.

6. Conclusions

In this paper, we addressed the problem of order splitting in factory production by considering the number of machines to start, how to split the orders, and how to optimize production, constructing a corresponding mathematical model. Based on this model, we designed a genetic algorithm incorporating the One-Fifth Success Rule (OFSR) to dynamically adjust the mutation rate and optimize the calculation process. The effectiveness of the model and algorithm was validated through a design example, demonstrating that the algorithm achieves good convergence and obtains nearly optimal results within 150–200 generations.
We also designed and tested three different initial populations based on the problem studied. The results indicate that H3 generally provides a better initial population and converges quickly to a favorable fitness range across various problem scales. In contrast, H2 outperforms H1 and H3 in terms of population quality after more than 500 iterations. This suggests that, although constructing a high-quality initial population can accelerate convergence, it may reduce genetic diversity and risk losing valuable genes.
Finally, we calculated the optimal number of machines to start for different problem scales, considering factors such as unit production costs, fixed startup costs, order tardiness costs, and third-party logistics transportation costs. This analysis provides valuable insights to support production and operational decisions for enterprises.

Author Contributions

Conceptualization, H.C.; methodology, H.C.; formal analysis, H.C.; writing—original draft preparation, H.C.; writing—review and editing, Q.Z., H.W., Y.G. and J.G. All authors have read and agreed to the published version of the manuscript.

Funding

This research received no external funding.

Data Availability Statement

The original contributions presented in the study are included in the article. Further inquiries can be directed to the corresponding author.

Conflicts of Interest

The authors declare no conflicts of interest.

Abbreviations

The following abbreviations are used in this manuscript:
3PLThird-party logistics
TNPTotal Net Profit
GAGenetic algorithm

References

  1. Li, Y.; Côté, J.F.; Callegari-Coelho, L.; Wu, P. Novel Formulations and Logic-Based Benders Decomposition for the Integrated Parallel Machine Scheduling and Location Problem. INFORMS J. Comput. 2022, 34, 1048–1069. [Google Scholar] [CrossRef]
  2. Bitar, A.; Dauzère-Pérès, S.; Yugma, C. Unrelated parallel machine scheduling with new criteria: Complexity and models. Comput. Operat. Res. 2021, 132, 105291. [Google Scholar] [CrossRef]
  3. Agárdi, A.; Nehéz, K. Parallel machine scheduling with Monte Carlo Tree Search. Acta Polytech. 2021, 61, 307–312. [Google Scholar] [CrossRef]
  4. De Armas, J.; Laguna, M. Parallel machine, capacitated lot-sizing and scheduling for the pipe-insulation industry. Int. J. Prod. Res. 2020, 58, 800–817. [Google Scholar] [CrossRef]
  5. Lee, J.H.; Jang, H. Uniform parallel machine scheduling with dedicated machines, job splitting and setup resources. Sustainability 2019, 11, 7137. [Google Scholar] [CrossRef]
  6. Fang, K.; Wang, S.; Pinedo, M.L.; Chen, L.; Chu, F. A combinatorial Benders decomposition algorithm for parallel machine scheduling with working-time restrictions. Eur. J. Oper. Res. 2021, 291, 128–146. [Google Scholar] [CrossRef]
  7. Page, D.R.; Solis-Oba, R. Makespan minimization on unrelated parallel machines with a few bags. Theor. Comput. Sci. 2020, 821, 34–44. [Google Scholar] [CrossRef]
  8. Arık, O.A.; Toksarı, M.D. Fuzzy parallel machine scheduling problem under fuzzy job deterioration and learning effects with fuzzy processing times. In Advanced Fuzzy Logic Approaches in Engineering Science; IGI Global: Hershey, PA, USA, 2019; pp. 49–67. [Google Scholar]
  9. Guo, P.; Weidinger, F.; Boysen, N. Parallel machine scheduling with job synchronization to enable efficient material flows in hub terminals. Omega 2019, 89, 110–121. [Google Scholar] [CrossRef]
  10. Pei, J.; Wang, X.; Fan, W.; Pardalos, P.M.; Liu, X. Scheduling step-deteriorating jobs on bounded parallel-batching machines to maximise the total net revenue. J. Oper. Res. Soc. 2019, 70, 1830–1847. [Google Scholar] [CrossRef]
  11. Yepes-Borrero, J.C.; Perea, F.; Ruiz, R.; Villa, F. Bi-objective parallel machine scheduling with additional resources during setups. Eur. J. Oper. Res. 2021, 292, 443–455. [Google Scholar] [CrossRef]
  12. Wang, S.; Wang, X.; Yu, J.; Ma, S.; Liu, M. Bi-objective identical parallel machine scheduling to minimize total energy consumption and makespan. J. Clean. Prod. 2018, 193, 424–440. [Google Scholar] [CrossRef]
  13. Akyol Ozer, E.; Sarac, T. MIP models and a matheuristic algorithm for an identical parallel machine scheduling problem under multiple copies of shared resources constraints. TOP 2019, 27, 94–124. [Google Scholar] [CrossRef]
  14. Villa, F.; Vallada, E.; Fanjul-Peyro, L. Heuristic algorithms for the unrelated parallel machine scheduling problem with one scarce additional resource. Expert Syst. Appl. 2018, 93, 28–38. [Google Scholar] [CrossRef]
  15. Safarzadeh, H.; Niaki, S.T.A. Bi-objective green scheduling in uniform parallel machine environments. J. Clean. Prod. 2019, 217, 559–572. [Google Scholar] [CrossRef]
  16. Della Croce, F.; Scatamacchia, R. The Longest Processing Time rule for identical parallel machines revisited. J. Sched. 2020, 23, 163–176. [Google Scholar] [CrossRef]
  17. Rudek, R. A generic optimization framework for scheduling problems under machine deterioration and maintenance activities. Comput. Ind. Eng. 2022, 174, 108800. [Google Scholar] [CrossRef]
  18. Srinath, N.; Yilmazlar, I.O.; Kurz, M.E.; Taaffe, K. Hybrid multi-objective evolutionary meta-heuristics for a parallel machine scheduling problem with setup times and preferences. Comput. Ind. Eng. 2023, 185, 109675. [Google Scholar] [CrossRef]
  19. Kim, H.J. Bounds for parallel machine scheduling with predefined parts of jobs and setup time. Ann. Oper. Res. 2018, 261, 401–412. [Google Scholar] [CrossRef]
  20. Li, D.; Wang, J.; Qiang, R.; Chiong, R. A hybrid differential evolution algorithm for parallel machine scheduling of lace dyeing considering colour families, sequence-dependent setup and machine eligibility. Int. J. Prod. Res. 2021, 59, 2722–2738. [Google Scholar] [CrossRef]
  21. Kusoncum, C.; Sethanan, K.; Pitakaso, R.; Hartl, R.F. Heuristics with novel approaches for cyclical multiple parallel machine scheduling in sugarcane unloading systems. Int. J. Prod. Res. 2021, 59, 2479–2497. [Google Scholar] [CrossRef]
  22. Li, Y.; Liu, J.; Wang, L.; Liu, J.; Tang, H.; Guo, J.; Xu, W. A K-means-Teaching Learning based optimization algorithm for parallel machine scheduling problem. Appl. Soft Comput. 2024, 161, 111746. [Google Scholar] [CrossRef]
  23. Lei, D.; Yuan, Y.; Cai, J. An improved artificial bee colony for multi-objective distributed unrelated parallel machine scheduling. Int. J. Prod. Res. 2021, 59, 5259–5271. [Google Scholar] [CrossRef]
  24. Lei, D.; Liu, M. An artificial bee colony with division for distributed unrelated parallel machine scheduling with preventive maintenance. Comput. Ind. Eng. 2020, 141, 106320. [Google Scholar] [CrossRef]
  25. Wu, X.; Che, A. A memetic differential evolution algorithm for energy-efficient parallel machine scheduling. Omega 2019, 82, 155–165. [Google Scholar] [CrossRef]
  26. Yunusoglu, P.; Topaloglu Yildiz, S. Constraint programming approach for multi-resource-constrained unrelated parallel machine scheduling problem with sequence-dependent setup times. Int. J. Prod. Res. 2022, 60, 2212–2229. [Google Scholar] [CrossRef]
  27. Wu, L.; Wang, S. Exact and heuristic methods to solve the parallel machine scheduling problem with multi-processor tasks. Int. J. Prod. Econ. 2018, 201, 26–40. [Google Scholar] [CrossRef]
  28. Kowalczyk, D.; Leus, R. A Branch-and-Price Algorithm for Parallel Machine Scheduling Using ZDDs and Generic Branching. INFORMS J. Comput. 2018, 30, 768–782. [Google Scholar] [CrossRef]
  29. Ewees, A.A.; Al-qaness, M.A.; Abd Elaziz, M. Enhanced salp swarm algorithm based on firefly algorithm for unrelated parallel machine scheduling with setup times. Appl. Math. Model. 2021, 94, 285–305. [Google Scholar] [CrossRef]
  30. Laha, D.; Gupta, J.N. An improved cuckoo search algorithm for scheduling jobs on identical parallel machines. Comput. Ind. Eng. 2018, 126, 348–360. [Google Scholar] [CrossRef]
  31. Majumder, A.; Laha, D.; Suganthan, P.N. A hybrid cuckoo search algorithm in parallel batch processing machines with unequal job ready times. Comput. Ind. Eng. 2018, 124, 65–76. [Google Scholar] [CrossRef]
  32. Cao, Z.; Lin, C.; Zhou, M. A knowledge-based cuckoo search algorithm to schedule a flexible job shop with sequencing flexibility. IEEE Trans. Autom. Sci. Eng. 2019, 18, 56–69. [Google Scholar] [CrossRef]
  33. Soares, L.C.; Carvalho, M.A. Application of a hybrid evolutionary algorithm to resource-constrained parallel machine scheduling with setup times. Comput. Oper. Res. 2022, 139, 105637. [Google Scholar] [CrossRef]
  34. Bulhões, T.; Sadykov, R.; Subramanian, A.; Uchoa, E. On the exact solution of a large class of parallel machine scheduling problems. J. Sched. 2020, 23, 411–429. [Google Scholar] [CrossRef]
  35. Ouazene, Y.; Yalaoui, F. Identical parallel machine scheduling with time-dependent processing times. Theor. Comput. Sci. 2018, 721, 70–77. [Google Scholar] [CrossRef]
  36. Gedik, R.; Kalathia, D.; Egilmez, G.; Kirac, E. A constraint programming approach for solving unrelated parallel machine scheduling problem. Comput. Ind. Eng. 2018, 121, 139–149. [Google Scholar] [CrossRef]
  37. Xiong, X.; Zhou, P.; Yin, Y.; Cheng, T.C.E.; Li, D. An exact branch-and-price algorithm for multitasking scheduling on unrelated parallel machines. Naval Res. Logist. (NRL) 2019, 66, 502–516. [Google Scholar] [CrossRef]
  38. Exposito-Izquierdo, C.; Angel-Bello, F.; Melián-Batista, B.; Alvarez, A.; Báez, S. A metaheuristic algorithm and simulation to study the effect of learning or tiredness on sequence-dependent setup times in a parallel machine scheduling problem. Expert Syst. Appl. 2019, 117, 62–74. [Google Scholar] [CrossRef]
  39. Ezugwu, A.E.; Adeleke, O.J.; Viriri, S. Symbiotic organisms search algorithm for the unrelated parallel machines scheduling with sequence-dependent setup times. PLoS ONE 2018, 13, e0200030. [Google Scholar] [CrossRef]
  40. Vallada, E.; Villa, F.; Fanjul-Peyro, L. Enriched metaheuristics for the resource constrained unrelated parallel machine scheduling problem. Comput. Oper. Res. 2019, 111, 415–424. [Google Scholar] [CrossRef]
  41. Yepes-Borrero, J.C.; Villa, F.; Perea, F.; Caballero-Villalobos, J.P. GRASP algorithm for the unrelated parallel machine scheduling problem with setup times and additional resources. Expert Syst. Appl. 2020, 141, 112959. [Google Scholar] [CrossRef]
  42. Noroozi, A.; Mazdeh, M.M.; Heydari, M.; Rasti-Barzoki, M. Coordinating order acceptance and integrated production-distribution scheduling with batch delivery considering Third Party Logistics distribution. J. Manuf. Syst. 2018, 46, 29–45. [Google Scholar] [CrossRef]
  43. Ingo, R. Evolutionsstrategie: Optimierung Technischer Systeme Nach Prinzipien der Biologischen Evolution; Frommann-Holzboog: Stuttgart, Germany, 1973. [Google Scholar]
  44. Alavidoost, M.H.; Tarimoradi, M.; Zarandi, M.F. Fuzzy adaptive genetic algorithm for multi-objective assembly line balancing problems. Appl. Soft Comput. 2015, 34, 655–677. [Google Scholar] [CrossRef]
Figure 1. Genetic algorithm flow chart.
Systems 12 00354 g001
Figure 3. Production sequence.
Systems 12 00354 g003
Figure 5. Fuzzy term MFs: reverse sigmoid MF, sigmoid MF, and Gaussian MF.
Systems 12 00354 g005
Figure 6. Generating two offspring from two parents using single-point crossover.
Systems 12 00354 g006
Figure 7. Generating two offspring from two parents using two-point crossover.
Systems 12 00354 g007
Figure 9. Interchange mutation.
Systems 12 00354 g009
Figure 10. Inversion mutation.
Systems 12 00354 g010
Figure 11. Insertion mutation.
Systems 12 00354 g011
Figure 12. Schematic diagram of local search.
Systems 12 00354 g012
Figure 13. The convergence of the algorithm with 15 customers (1000 generations).
Systems 12 00354 g013
Figure 14. Convergence of three initial solutions (1000 generations).
Systems 12 00354 g014
Figure 15. The relationship between the number of machines used and revenue with 15 customers.
Systems 12 00354 g015
Table 1. Notations.
Table 1. Notations.
NotationDescription
Sets:
NThe set of all orders
LThe set of machines, indexed by l
KThe set of customers, indexed by k
N k The set of orders of customer k
VThe set of all vehicles, V = V s V h
V s The set of owned vehicles
V h The set of 3PL vehicles
P l The set of positions in the production queue of machine l, indexed by p
Parameters:
Q i The revenue of order i
f l m The fixed startup cost of machine m
f k s The fixed usage cost for using owned vehicles to transport goods to customer k
f k h The fixed usage cost for using 3PL vehicles to transport goods to customer k
w i The unit time tardiness cost of order i
δ k The unit freight cost for 3PL service to customer k
T i The processing time required to complete order i
S i The size of order i
C v The loading capacity of vehicle v
τ k The travel time to customer k
D i The desired time for order i
Variables:
y i Equals 1 if order i is accepted and 0 otherwise
g l Equals 1 if machine l is started and 0 otherwise
ω i The total tardiness time of order i
u v k Equals 1 if vehicle v serves customer k and 0 otherwise
t i c The completion time or loading time of order i
t i a The arrival time of order i at the customer’s location
A i v Equals 1 if order i is assigned to vehicle v and 0 otherwise
t v The departure time of vehicle v
Table 2. The initial solutions (primary populations) obtained after generating 50 examples for each scale.
Problem Size15 × 1015 × 510 × 1010 × 55 × 105 × 5
H1 Optimal Proportion21%23%19%24%28%32%
H2 Optimal Proportion15%14%17%18%25%29%
H3 Optimal Proportion65%63%64%58%47%39%
Table 3. Computational results for every 50 iterations.
H1759, 867, 906, 1074, 1101, 1083, 1074, 1065, 1055, 1059, 1065, 960, 1049, 1009, 1035, 987, 1057, 991, 1054, 1002
H2487, 729, 894, 966, 1017, 1022, 1021, 973, 981, 988, 965, 1085, 1130, 1188, 1216, 1162, 1215, 1213, 1217, 1212
H3583, 854, 1029, 1089, 1041, 1001, 1109, 1042, 1115, 1083, 1104, 1099, 1095, 1083, 1107, 1086, 1159, 1131, 1011, 1137
Table 4. Optimal number of machines to start for different problem scales.
Problem Size15 × 1015 × 510 × 1010 × 55 × 105 × 5
Optimal number of starting machines (sets)433221
Disclaimer/Publisher’s Note: The statements, opinions and data contained in all publications are solely those of the individual author(s) and contributor(s) and not of MDPI and/or the editor(s). MDPI and/or the editor(s) disclaim responsibility for any injury to people or property resulting from any ideas, methods, instructions or products referred to in the content.

