
The Dynamic Evolution of Agricultural Trade Network Structures and Its Influencing Factors: Evidence from Global Soybean Trade


Abstract
:1. Introduction
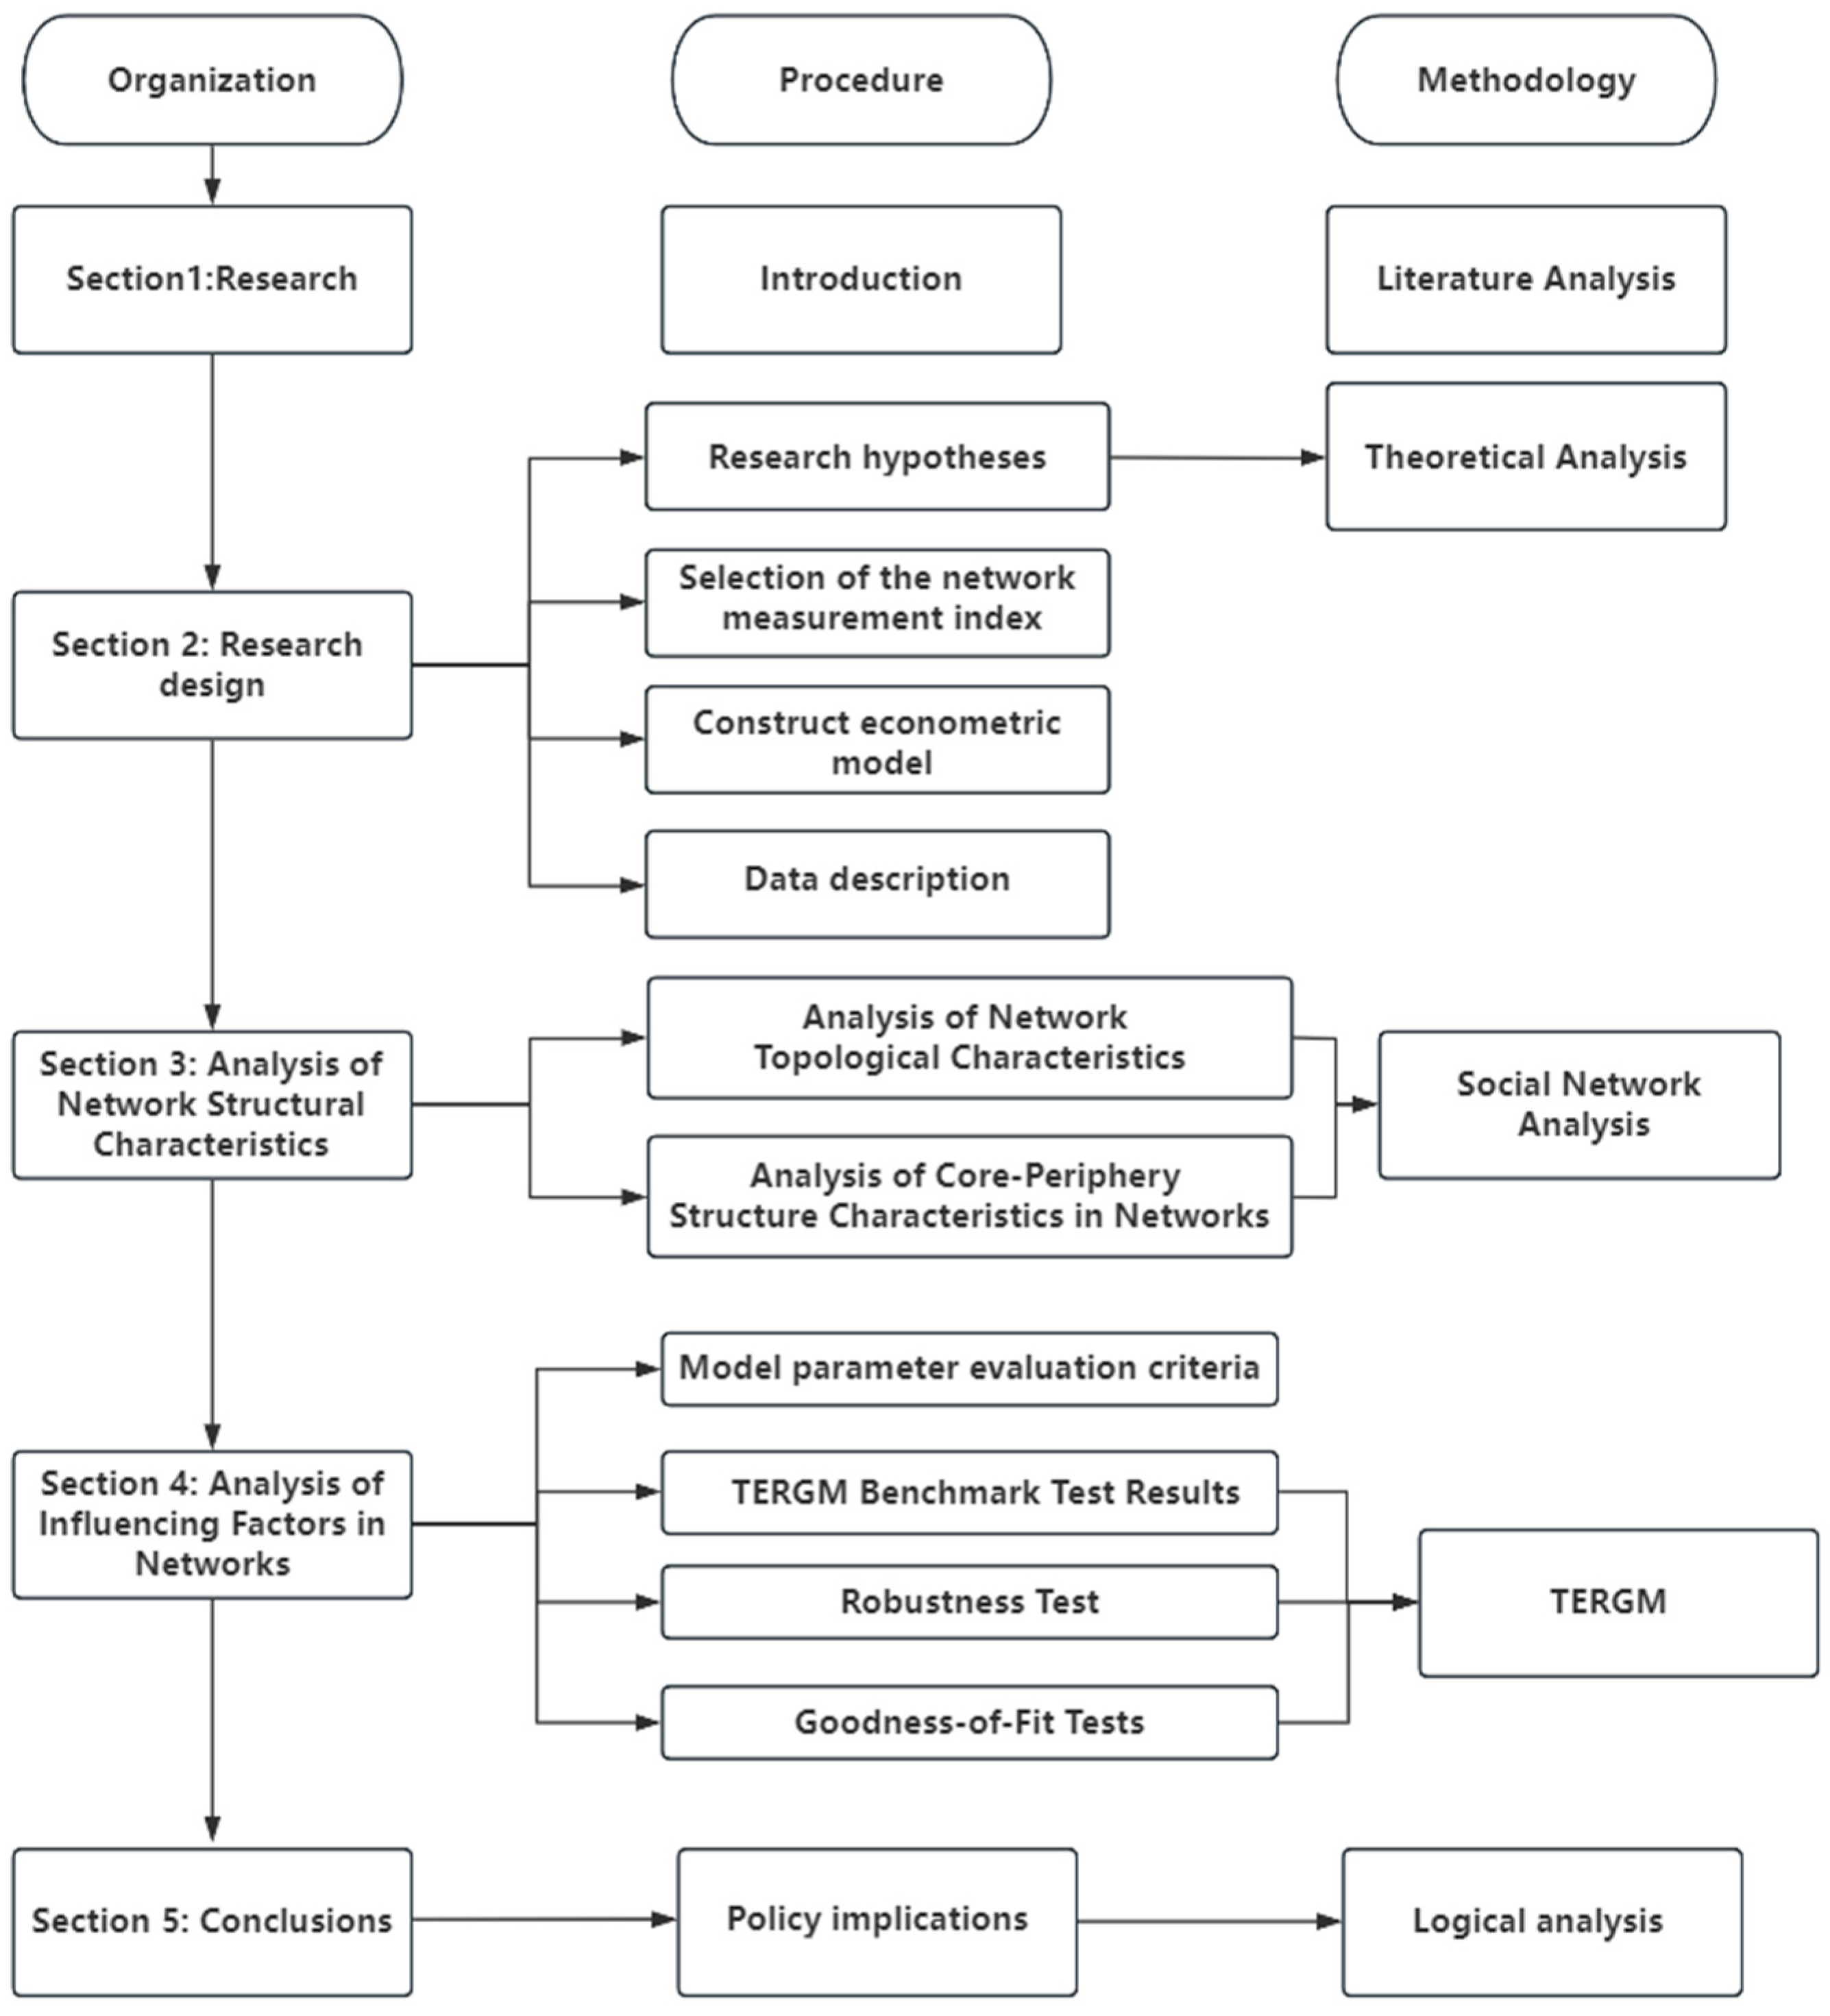
2. Research Design
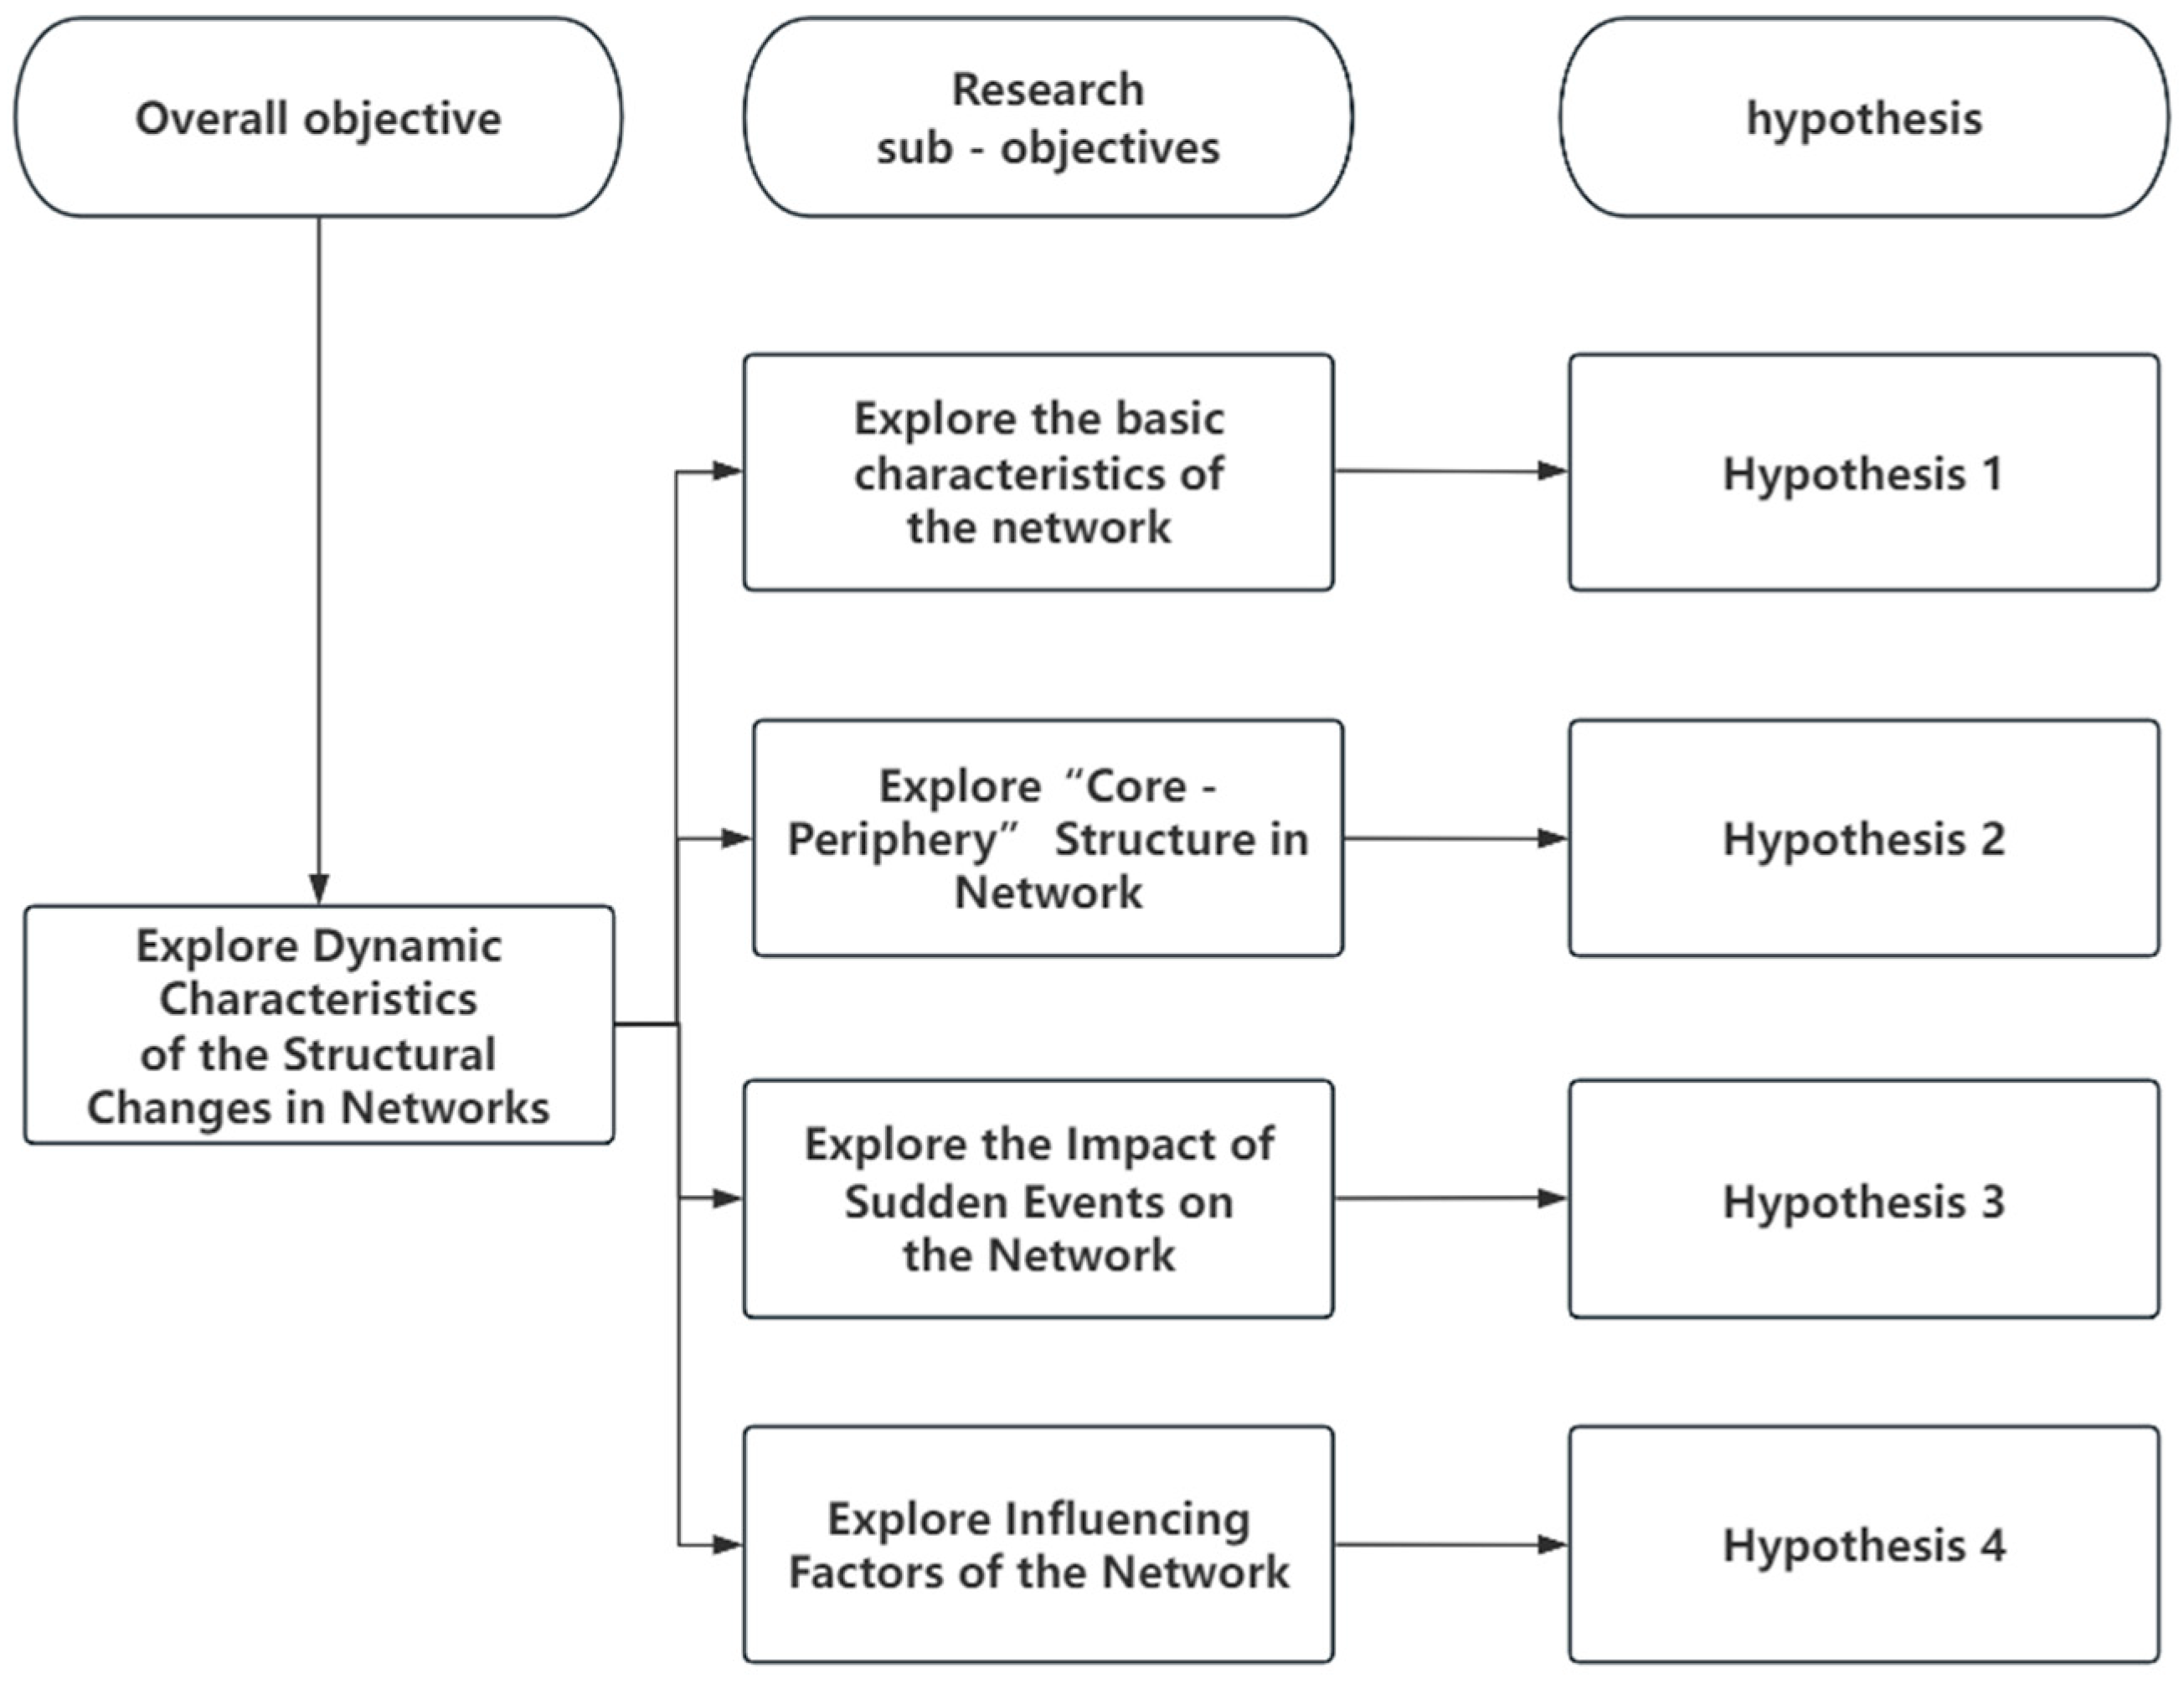
2.1. Theoretical Hypotheses
2.2. Construction of Social Network Model
2.2.1. Construction of the Soybean Trade Network
2.2.2. Measurement Indicators for the Soybean Trade Network
2.3. Temporal Exponential Random Graph Model Construction
2.4. Data Sources and Explanation
3. Analysis of the Evolutionary Characteristics of the Soybean Trade Network Structure
3.1. Analysis of Network Topological Structure Characteristics
3.2. Analysis of the Core–Periphery Structure Characteristics of the Network
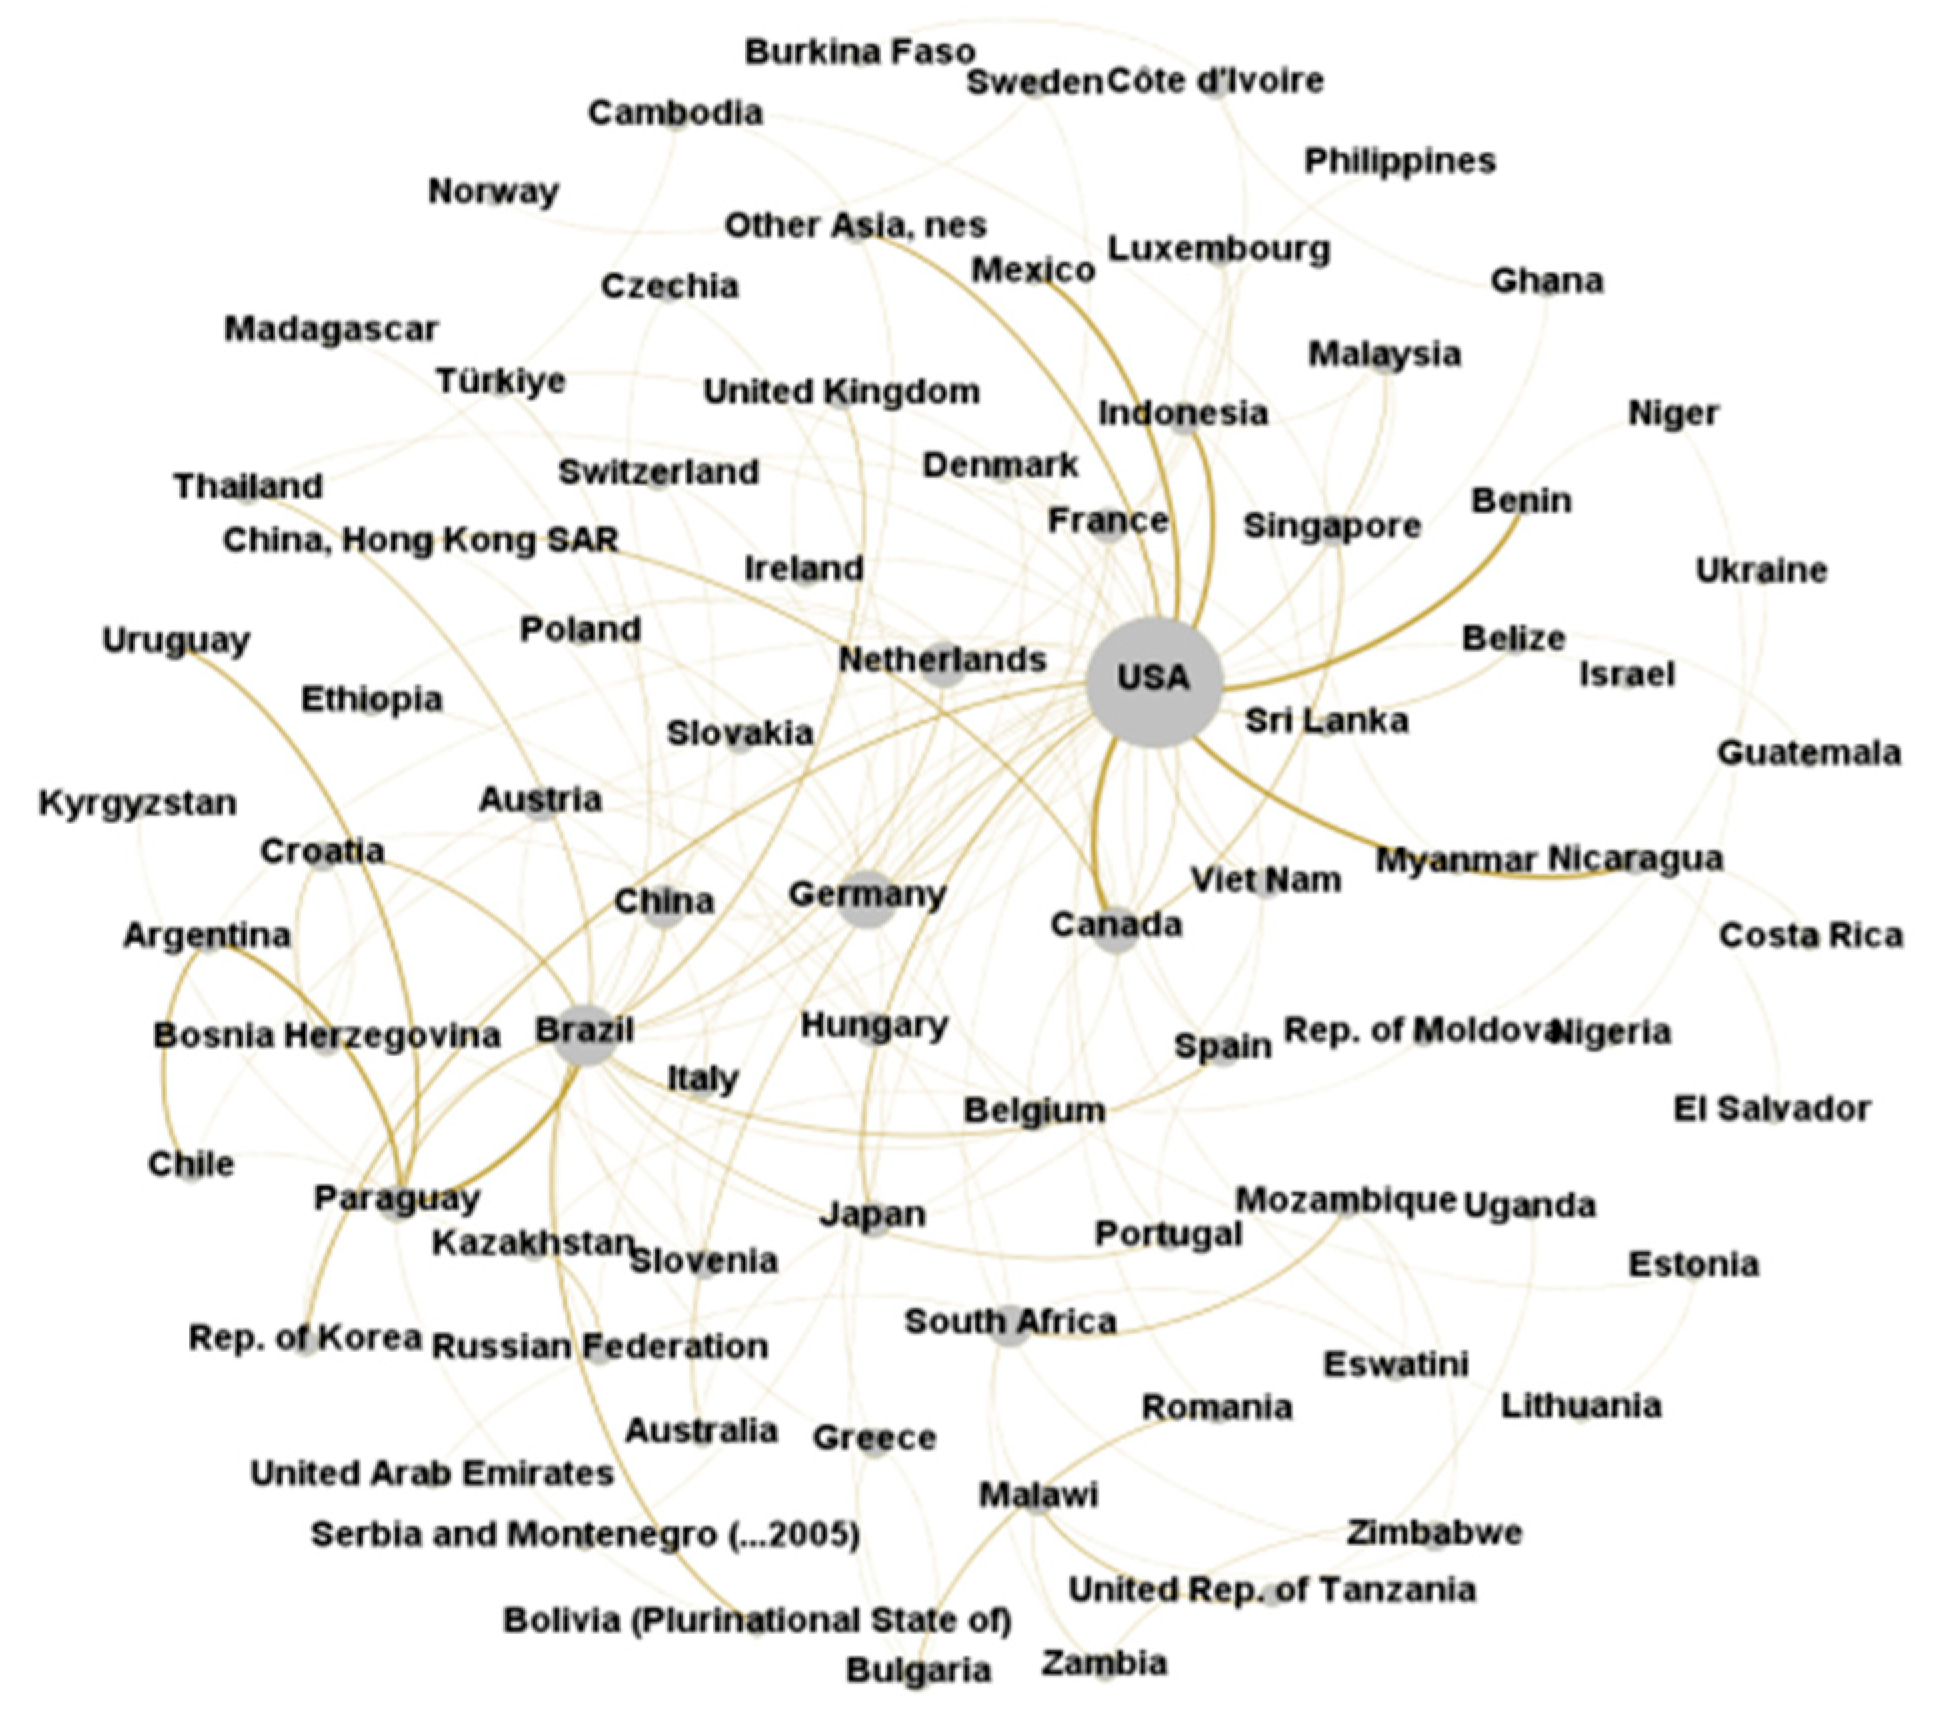
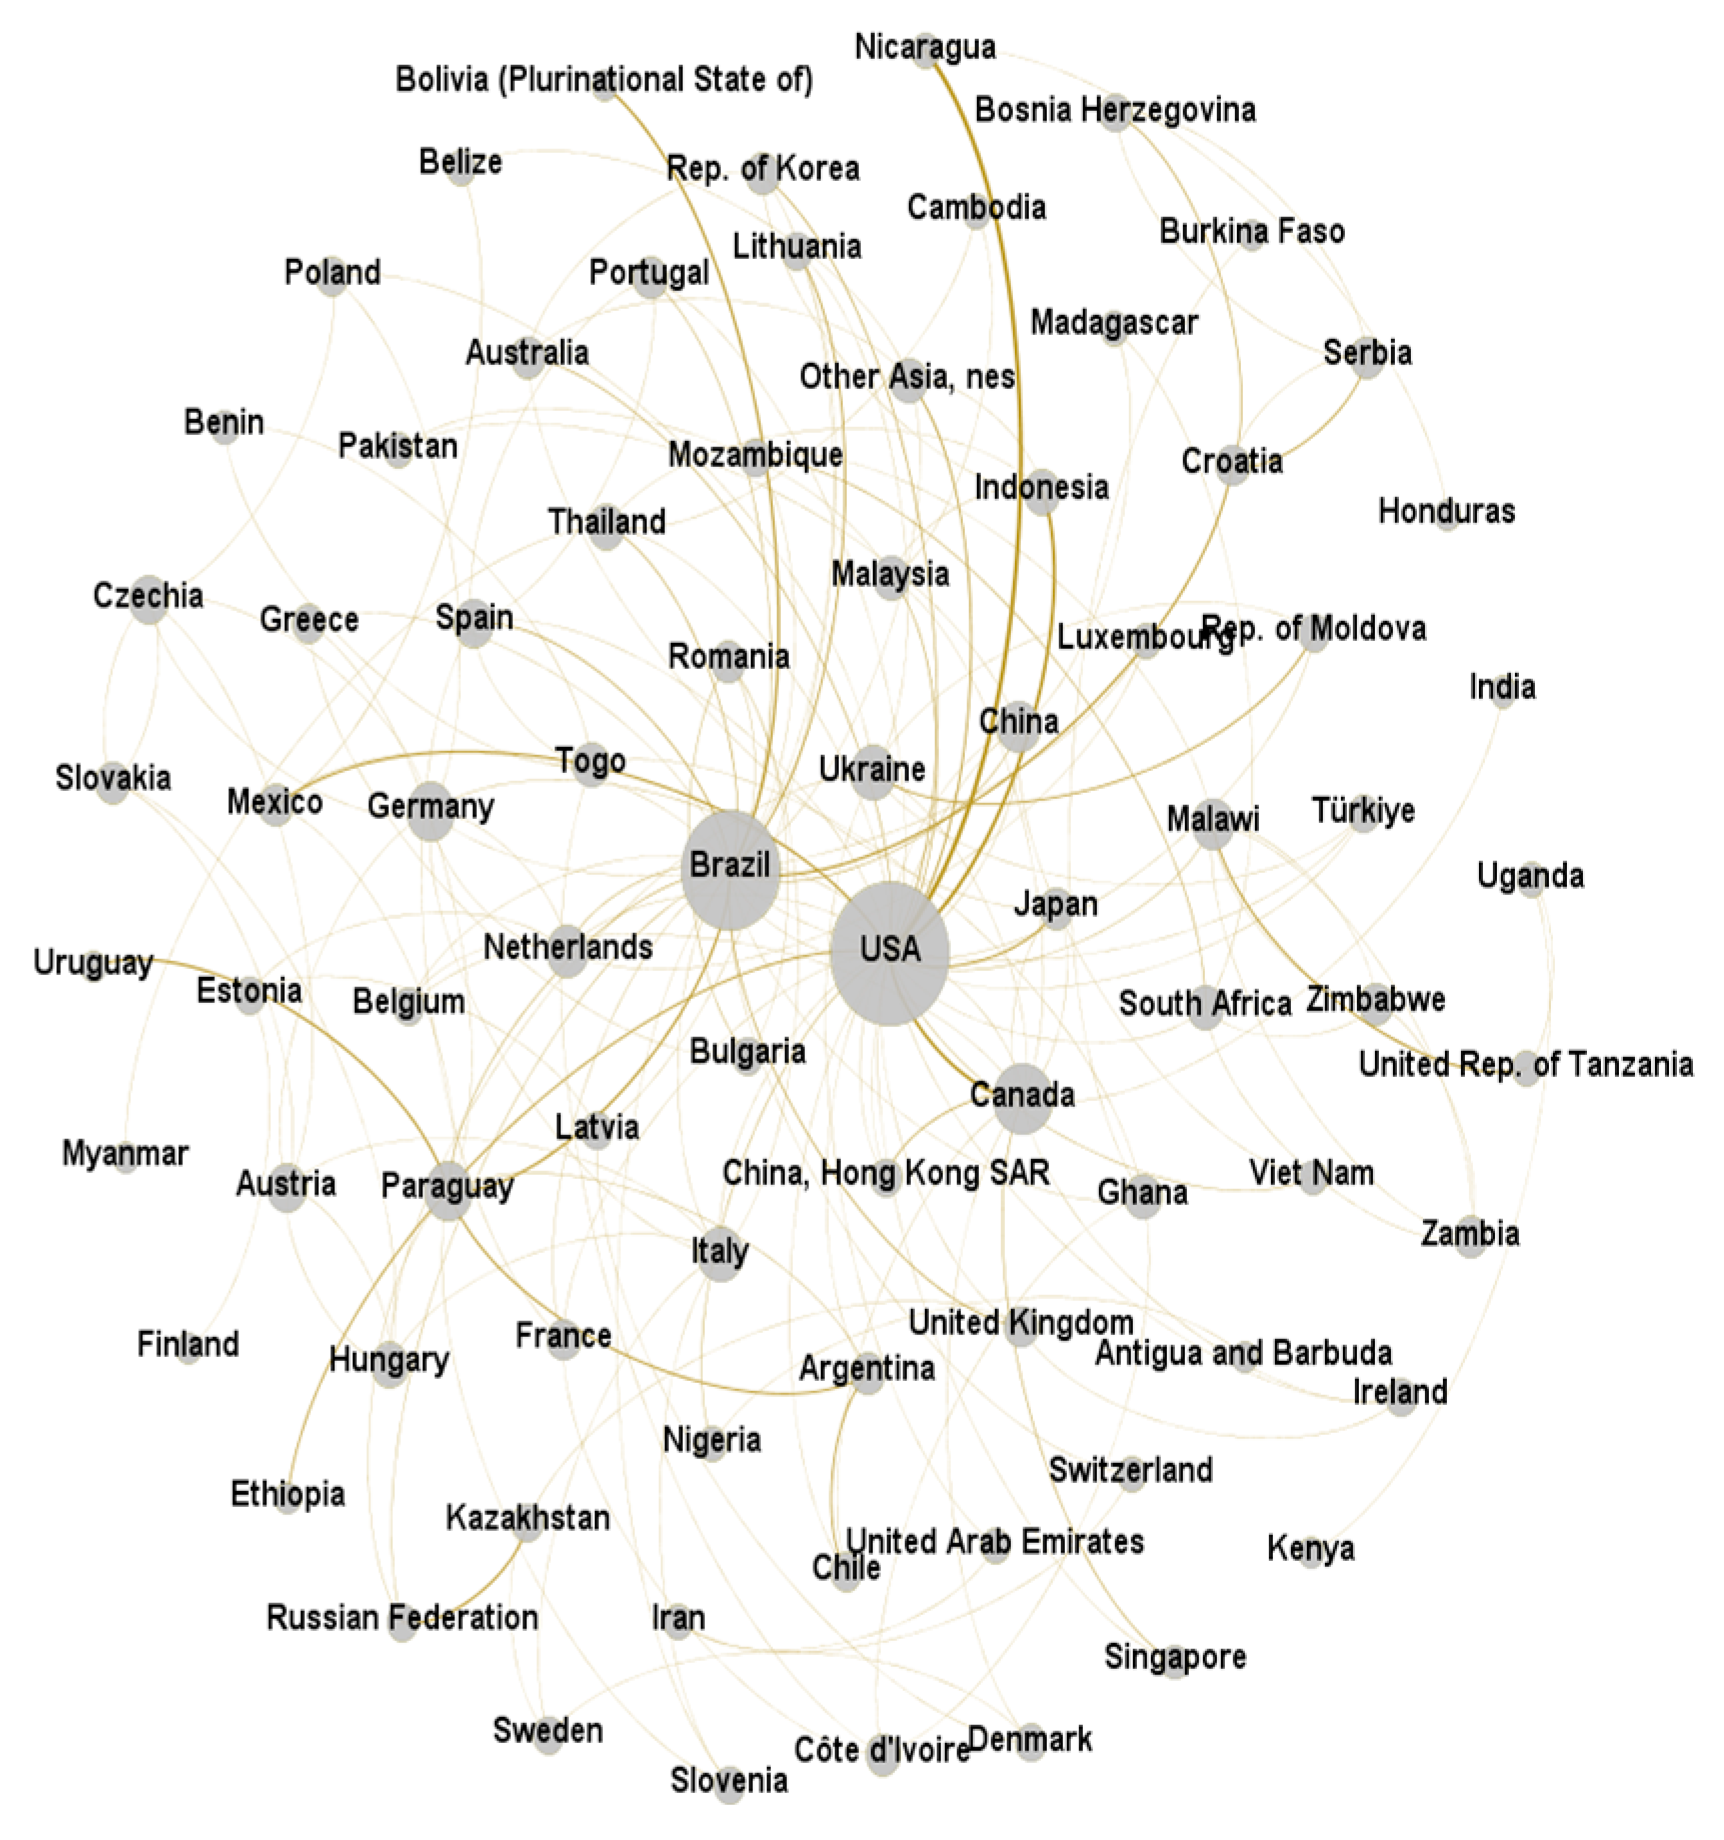
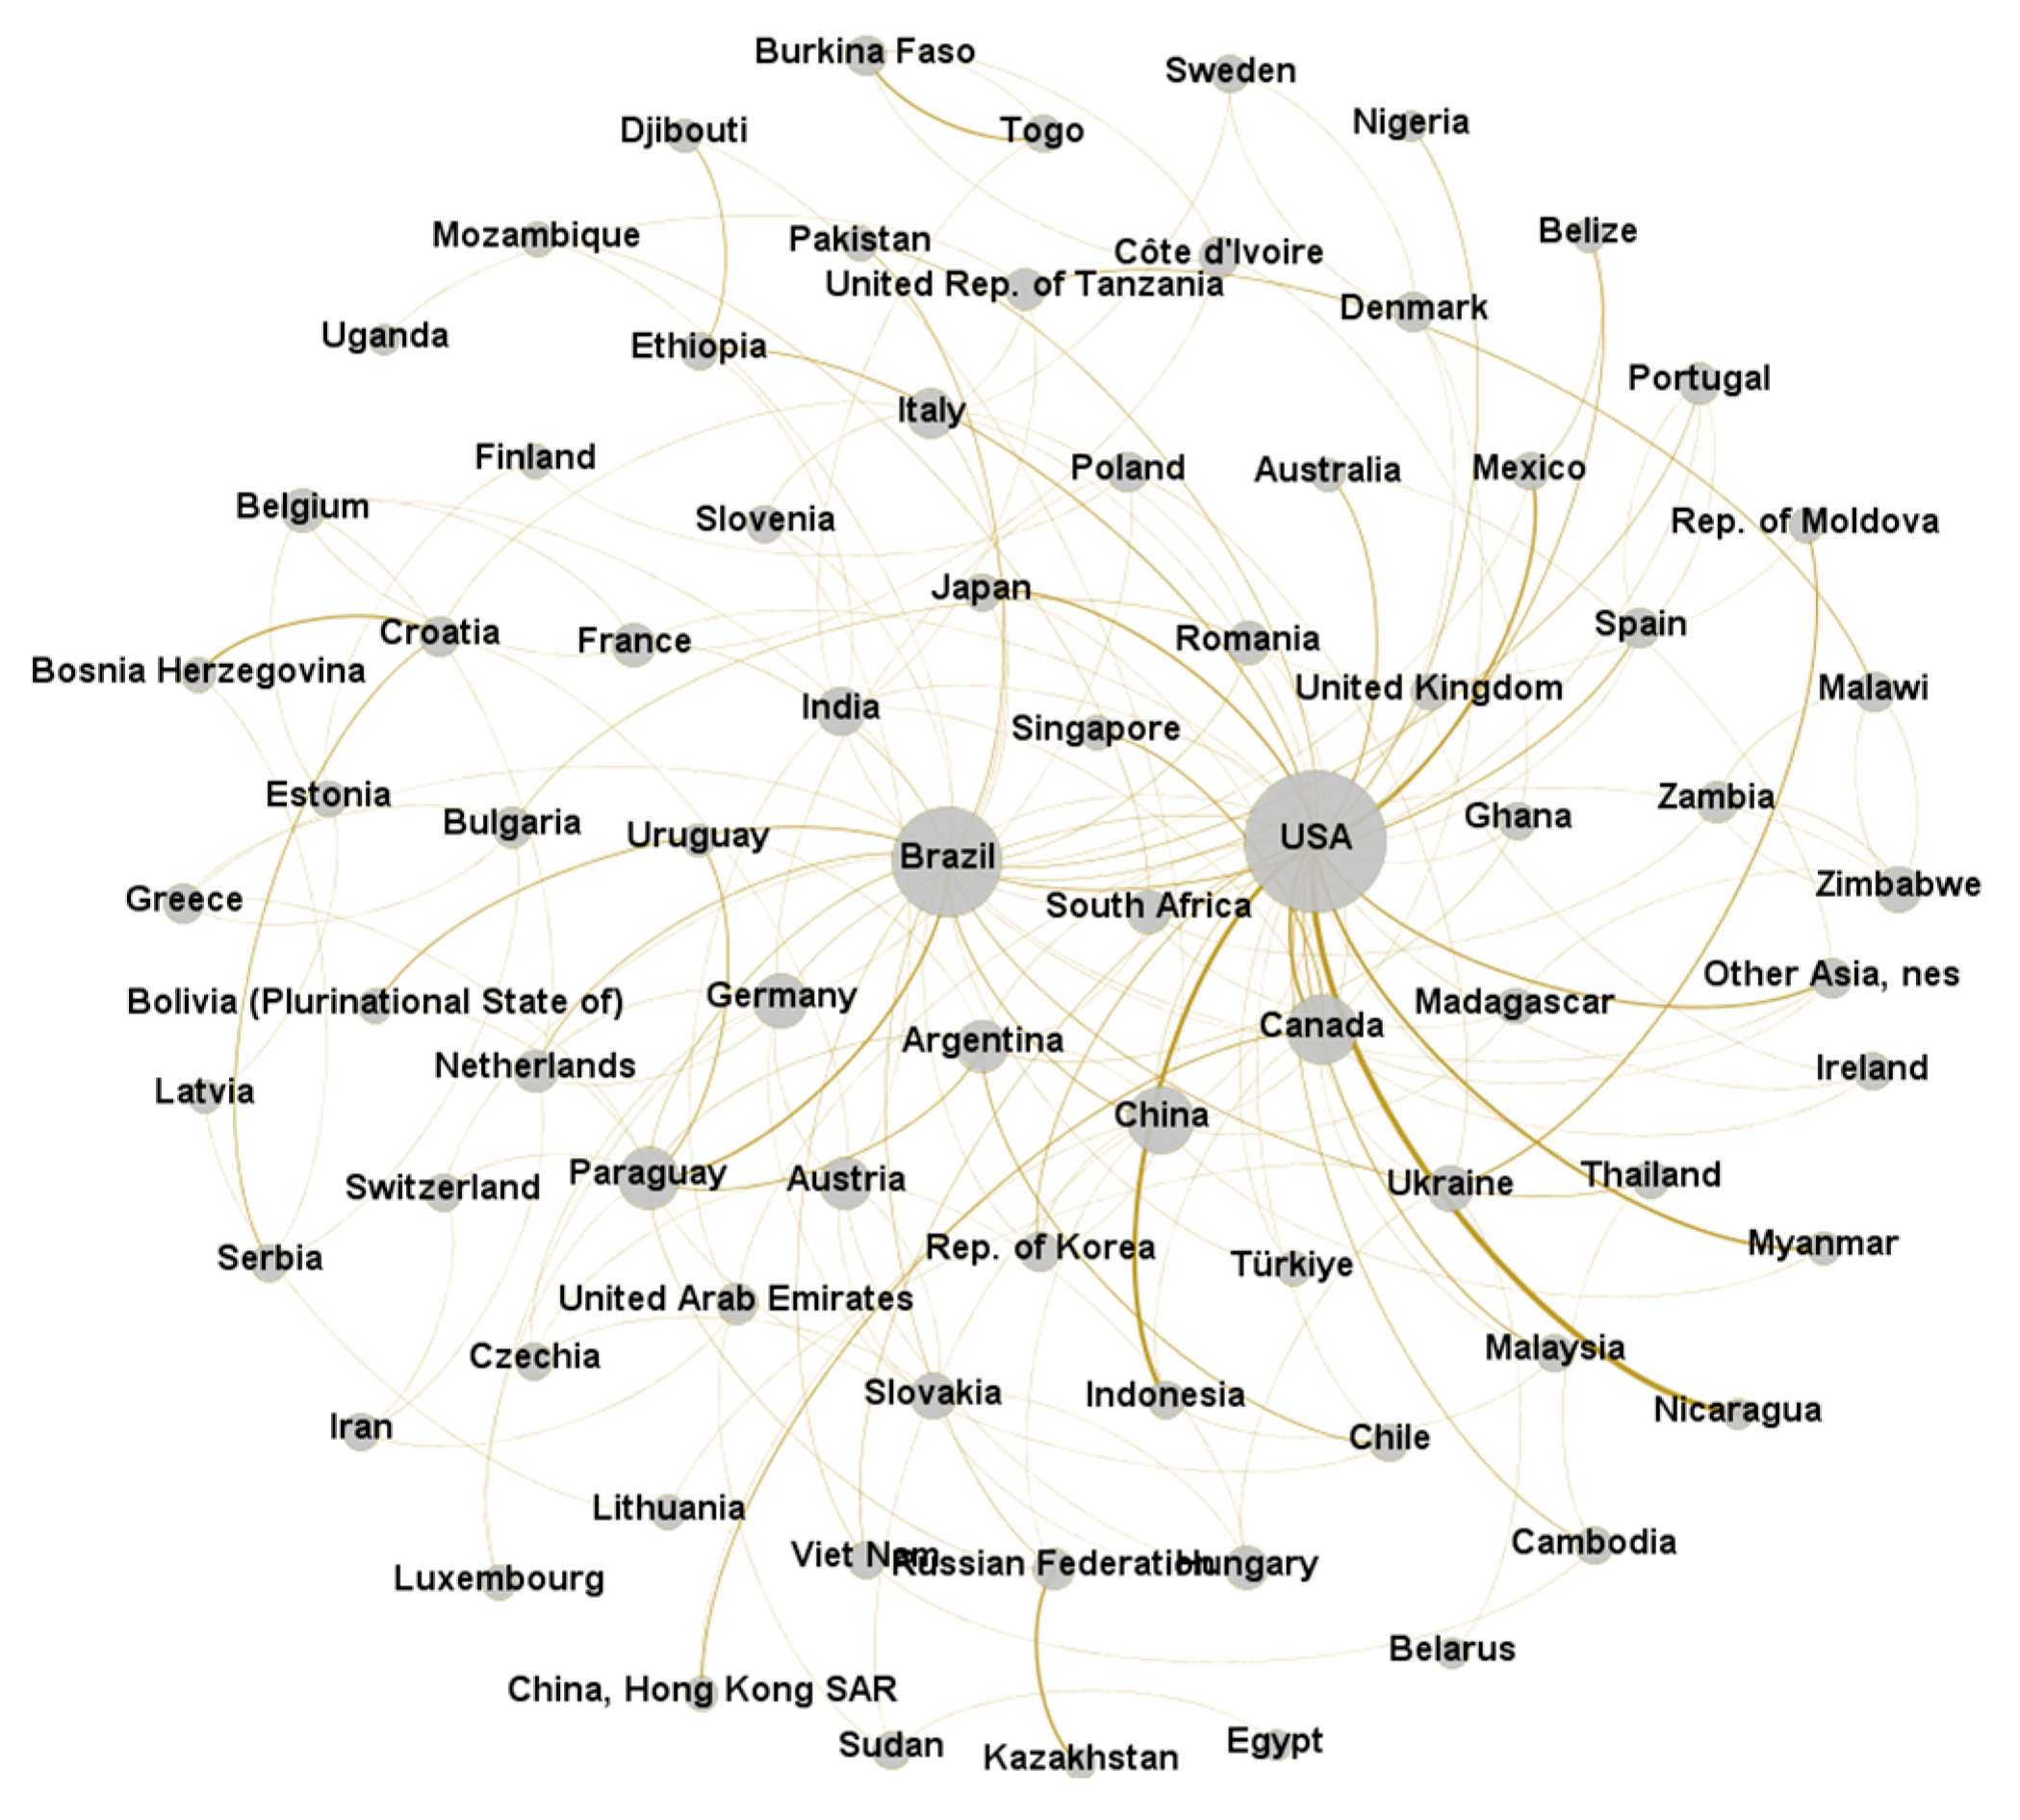
3.2.1. Visualisation Analysis
3.2.2. Analysis of the Evolution of the Core–Periphery Structure
- T1: The Big Four Grain Traders Short Sell Chinese Soybeans
- T2: The 2008 Global Financial Crisis
- T3: The China–US Trade War
- T4: The COVID-19 Pandemic
4. Analysis of Influencing Factors of the Soybean Trade Network
4.1. Theoretical Analysis
- (1)
- Endogenous Mechanism Variables
- (2)
- Exogenous Mechanism Variables
4.2. Results of TERGM Benchmark Test
4.3. Robustness Test
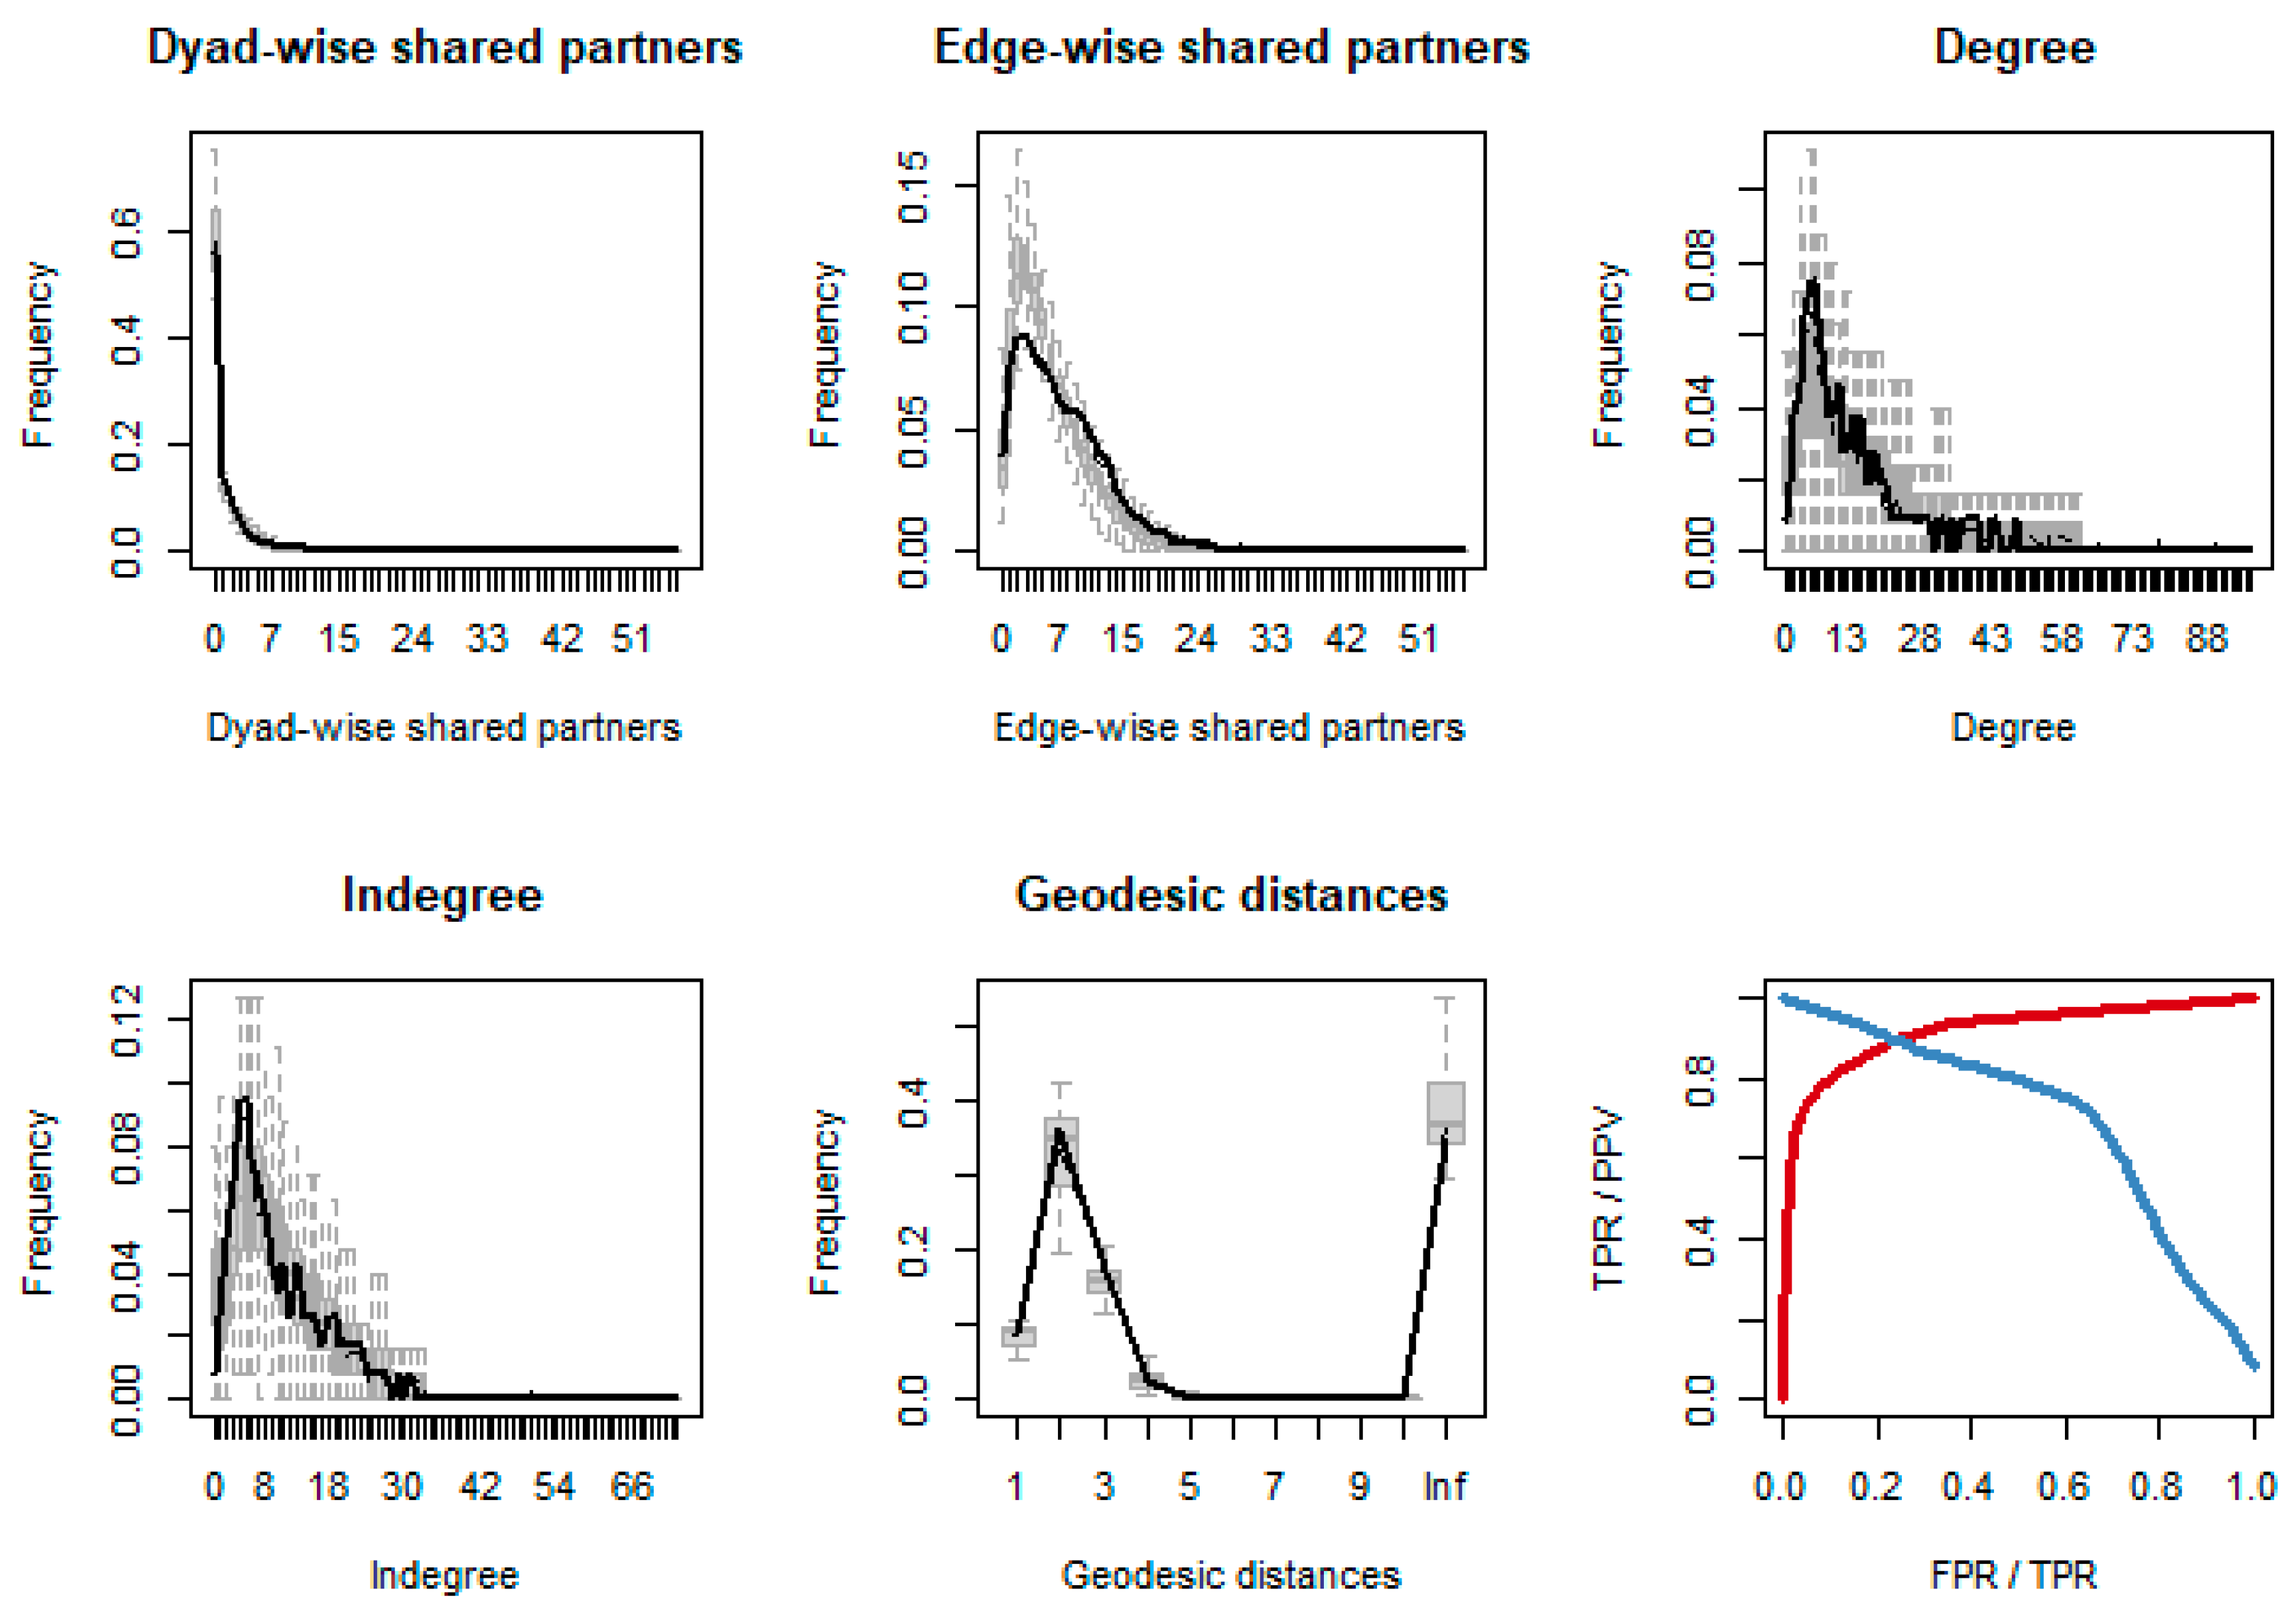
4.4. Goodness-of-Fit Test
5. Conclusions
Author Contributions
Funding
Data Availability Statement
Conflicts of Interest
References
- Hu, Q.G.; Guo, M.Q.; Wang, F.; Shao, L.Q.; Wei, X.Y. External supply risk of agricultural products trade along the Belt and Road under the background of COVID-19. Front. Public Health 2023, 11, 1122081. [Google Scholar] [CrossRef] [PubMed]
- Wei, C.Z.; Xiao, Y.Q.; Li, L.Y.; Huang, G.Z.; Liu, Z.; Xue, D.S. After pandemic: Resilience of grain trade network from a port perspective on developed and developing countries. Resources, Conserv. Recycl. 2025, 215, 108119. [Google Scholar] [CrossRef]
- Abudukeremu, A.; Youliwasi, A.; Abula, B.; Yiming, A.; Wang, D. Study on the Evolution of SCO Agricultural Trade Network Pattern and Its Influencing Mechanism. Sustainability 2024, 16, 7930. [Google Scholar] [CrossRef]
- Laber, M.; Klimek, P.; Bruckner, M.; Yang, L.; Thurner, S. Shock propagation from the Russia-Ukraine conflict on international multilayer food production network determines global food availability. Nat. Food 2023, 4, 508–517. [Google Scholar] [CrossRef]
- Dong, J.X.; Li, S.W.; Huang, L.N.; He, J.; Jiang, W.P.; Ren, F.; Wang, Y.J.; Sun, J.; Zhang, H. Identification of international trade patterns of agricultural products: The evolution of communities and their core countries. Geo-Spat. Inf. Sci. 2022, 27, 49–63. [Google Scholar] [CrossRef]
- Xu, H.; Niu, N.; Li, D.; Wang, C. A Dynamic Evolutionary Analysis of the Vulnerability of Global Food Trade Networks. Sustainability 2024, 16, 3998. [Google Scholar] [CrossRef]
- Yu, A.; She, H.; Cao, J. Evolution of the Spatial Patterns of Global Egg Trading Networks in the 21 Century. Sustainability 2023, 15, 11895. [Google Scholar] [CrossRef]
- Bai, Z.; Liu, C.; Wang, H.; Li, C. Evolution Characteristics and Influencing Factors of Global Dairy Trade. Sustainability 2023, 15, 931. [Google Scholar] [CrossRef]
- Pan, Z.C.; Ma, L.Y.; Tian, P.P.; Zhu, Y.C. Structural Characteristics and Influencing Factors of Agricultural Trade Spatial Network: Evidence from RCEP 15 Countries. Cienc. Rural. 2024, 54, e20230184. [Google Scholar] [CrossRef]
- Duan, J.; Nie, C.; Wang, Y.; Yan, D.; Xiong, W. Research on Global Grain Trade Network Pattern and Its Driving Factors. Sustainability 2022, 14, 245. [Google Scholar] [CrossRef]
- Zhou, L.Z.; Tong, G.J. Structural Evolution and Sustainability of Agricultural Trade between China and Countries along the “Belt and Road”. Sustainability 2022, 14, 9512. [Google Scholar] [CrossRef]
- Hu, W.; Xie, D.L.; Le, Y.L.; Fu, N.N.; Zhang, J.Z.; Yin, S.G.; Deng, Y. Evolution of Food Trade Networks from a Comparative Perspective: An Examination of China, the United States, Russia, the European Union, and African Countries. Foods 2024, 13, 2897. [Google Scholar] [CrossRef] [PubMed]
- Ma, J.; Zhao, P.; Li, M.; Niu, J. The evolution of global soybean trade network pattern based on complex network. Appl. Econ. 2023, 56, 3133–3149. [Google Scholar]
- Wang, M.; Liu, D.; Wang, Z.; Li, Y. Structural Evolution of Global Soybean Trade Network and the Implications to China. Foods 2023, 12, 1550. [Google Scholar] [CrossRef]
- Ji, G.; Zhong, H.; Feukam Nzudie, H.L.; Wang, P.; Tian, P. The Structure, Dynamics, and Vulnerability of the Global Food Trade Network. J. Clean. Prod. 2024, 434, 140439. [Google Scholar] [CrossRef]
- Deng, G.; Di, K. A Study on the Characteristics and Influencing Factors of the Global Grain Virtual Water Trade Network. Water 2025, 17, 288. [Google Scholar] [CrossRef]
- Qiang, W.; Niu, S.; Wang, X.; Zhang, C.; Liu, A.; Cheng, S. Evolution of the Global Agricultural Trade Network and Policy Implications for China. Sustainability 2020, 12, 192. [Google Scholar] [CrossRef]
- Tu, Y.; Shu, Z.; Wu, W.; He, Z.; Li, J. Spatiotemporal Analysis of Global Grain Trade Multilayer Networks Considering Topological Clustering. Trans. GIS 2024, 28, 509–534. [Google Scholar] [CrossRef]
- Zhang, T.; Yang, J. Factors Influencing the Global Agricultural Trade: A Network Analysis. Agric. Econ. 2023, 69, 343–357. [Google Scholar]
- Zhou, L.; Tong, G. Research on the Competitiveness and Influencing Factors of Agricultural Products Trade between China and the Countries along the “Belt and Road”. Alex. Eng. J. 2022, 61, 8919–8931. [Google Scholar] [CrossRef]
- Cheng, M.Y.; Wu, J.L.; Li, C.H.; Jia, Y.X.; Xia, X.H. Tele-connection of global agricultural land network: Incorporating complex network approach with multi-regional input-output analysis. Land Use Policy 2023, 125, 106464. [Google Scholar] [CrossRef]
- Hussein, H.; Knol, M. The Ukraine War, Food Trade and the Network of Global Crises. Int. Spect. 2023, 58, 74–95. [Google Scholar] [CrossRef]
- Heslin, A.; Puma, M.J.; Marchand, P.; Carr, J.A. Simulating the Cascading Effects of an Extreme Agricultural Production Shock: Global Implications of a Contemporary US Dust Bowl Event. Front. Sustain. Food Syst. 2020, 4, 26. [Google Scholar] [CrossRef]
- Liu, L.; Shen, M.; Sun, D.; Yan, X.; Hu, S. Preferential Attachment, R&D Expenditure and the Evolution of International Trade Networks from the Perspective of Complex Networks. Phys. A Stat. Mech. Its Appl. 2022, 603, 127579. [Google Scholar]
- De Benedictis, L.; Nenci, S.; Santoni, G.; Tajoli, L.; Vicarelli, C. Network Analysis of World Trade Using the BACI-CEPII Datase. Glob. Econ. J. 2014, 14, 287–343. [Google Scholar] [CrossRef]
- Hidalgo, C.A.; Klinger, B.; Barabasi, A.L.; Hausmann, R. The Product Space Conditions the Development of Nations. Science 2007, 317, 482–487. [Google Scholar] [CrossRef]
- Desmarais, B.A.; Cranmer, S.J. Statistical Mechanics of Networks: Estimation and Uncertainty. Phys. A Stat. Mech. Its Appl. 2012, 391, 1865–1876. [Google Scholar] [CrossRef]
- Weber, H.; Schwenzer, M.; Hillmert, S. Homophily in the formation and development of learning networks among university students. Netw. Sci. 2020, 8, 469–491. [Google Scholar] [CrossRef]
- Van Wijk, B.C.M.; Stam, C.J.; Daffertshofer, A. Comparing Brain Networks of Different Size and Connectivity Density Using Graph Theory. PLoS ONE 2010, 5, e13701. [Google Scholar] [CrossRef]
- Pan, A.; Xiao, T.; Dai, L. The structural change and influencing factors of carbon transfer network in global value chains. J. Environ. Manag. 2022, 318, 115558. [Google Scholar] [CrossRef]
- Chang, C.; Lin, H.W. A topological based feature extraction method for the stock market. Data Sci. Financ. Econ. 2023, 3, 208–229. [Google Scholar] [CrossRef]
- Li, Z.; Lai, Q.; He, J. Does digital technology enhance the global value chain position? Borsa Istanb. Rev. 2024, 24, 856–868. [Google Scholar]
- Leifeld, P.; Cranmer, S.J.; Desmarais, B.A. Temporal Exponential Random Graph Models with Btergm: Estimation and Bootstrap Confidence Intervals. J. Stat. Softw. 2018, 83, 1–36. [Google Scholar] [CrossRef]
- Xu, H.; Feng, L.; Wu, G.; Zhang, Q. Evolution of Structural Properties and Its Determinants of Global Waste Paper Trade Network Based on Temporal Exponential Random Graph Models. Renew. Sustain. Energy Rev. 2021, 149, 111402. [Google Scholar]
- Cai, H.; Wang, Z.; Zhu, Y. Understanding the Structure and Determinants of Intercity Carbon Emissions Association Network in China. J. Clean. Prod. 2022, 352, 131535. [Google Scholar] [CrossRef]
- Block, P.; Koskinen, J.; Hollway, J.; Steglich, C.; Stadtfeld, C. Change We Can Believe in: Comparing Longitudinal Network Models on Consistency, Interpretability and Predictive Power. Soc. Netw. 2018, 52, 180–191. [Google Scholar]
- Li, Z.; Guo, F.; Du, Z. Learning from Peers: How Peer Effects Reshape the Digital Value Chain in China. J. Theor. Appl. Electron. Commer. Res. 2025, 20, 41. [Google Scholar] [CrossRef]
- Yu, G.; Xiong, C.; Xiao, J.; He, D.; Peng, G. Evolutionary Analysis of the Global Rare Earth Trade Networks. Appl. Math. Comput. 2022, 430, 127249. [Google Scholar] [CrossRef]
- Fritz, C.; Lebacher, M.; Kauermann, G. Tempus Volat, Hora Fugit: A Survey of Tie-oriented Dynamic Network Models in Discrete and Continuous Time. Stat. Neerl. 2019, 74, 275–299. [Google Scholar] [CrossRef]
- Li, M.; Li, Y. Research on crude oil price forecasting based on computational intelligence. Data Sci. Financ. Econ. 2023, 3, 251–266. [Google Scholar] [CrossRef]
- Matous, P.; Wang, P.; Lau, L. Who Benefits from Network Intervention Programs? TERGM Analysis across Ten Philippine Low-Income Communities. Soc. Netw. 2021, 65, 110–123. [Google Scholar]
- Dwarika, N. Asset pricing models in South Africa: A comparative of regression analysis and the Bayesian approach. Data Sci. Financ. Econ. 2023, 3, 55–75. [Google Scholar]
- Jang, Y.; Yang, J.S. Environmental policy and the evolution of nuclear trade network: Insights from the European Union. Struct. Change Econ. Dyn. 2024, 68, 425–432. [Google Scholar]
- Wang, X.Y.; Chen, B.; Hou, N.; Chi, Z.P. Evolution of structural properties of the global strategic emerging industries’ trade network and its determinants: An TERGM analysis. Ind. Mark. Manag. 2024, 118, 78–92. [Google Scholar]
- Li, Z.; Chen, B.; Lu, S.; Liao, G. The impact of financial institutions’ cross-shareholdings on risk-taking. Int. Rev. Econ. Financ. 2024, 92, 1526–1544. [Google Scholar] [CrossRef]
- Wu, G.; Feng, L.; Peres, M.; Dan, J. Do Self-Organization and Relational Embeddedness Influence Free Trade Agreements Network Formation? Evidence from an Exponential Random Graph Model. J. Int. Trade Econ. Dev. 2020, 29, 995–1017. [Google Scholar]
- Lake, J.; Yildiz, H.M. On the Different Geographic Characteristics of Free Trade Agreements and Customs Unions. J. Int. Econ. 2016, 103, 213–233. [Google Scholar] [CrossRef]
- Miao, C.; Wan, Y.; Kang, M.; Xiang, F. Topological Analysis, Endogenous Mechanisms, and Supply Risk Propagation in the Polycrystalline Silicon Trade Dependency Network. J. Clean. Prod. 2024, 439, 140657. [Google Scholar]
- Li, Z.; Xu, Y.; Du, Z. Valuing financial data: The case of analyst forecasts. Financ. Res. Lett. 2025, 75, 106847. [Google Scholar] [CrossRef]
- Li, T.; Shu, X.; Liao, G. Does Corporate Greenwashing Affect Investors’ Decisions? Financ. Res. Lett. 2024, 67, 105877. [Google Scholar]
- Li, T.; Li, X.; Liao, G. Business cycles and energy intensity. Evidence from emerging economies. Borsa Istanb. Rev. 2022, 22, 560–570. [Google Scholar]


| Year | Clustering Coefficient | Average Path Length | Density | Number of Edges | Mean Trade Dependency | In-Degree Centralisation | Out-Degree Centralisation |
|---|---|---|---|---|---|---|---|
| 2000 | 0.167 | 2.950 | 0.023 | 935 | 0.1721 | 0.0144 | 0.0410 |
| 2002 | 0.145 | 2.898 | 0.027 | 1016 | 0.1779 | 0.0182 | 0.0473 |
| 2004 | 0.212 | 2.816 | 0.027 | 1013 | 0.1807 | 0.0170 | 0.0231 |
| 2006 | 0.185 | 2.953 | 0.024 | 1113 | 0.1881 | 0.0199 | 0.0218 |
| 2008 | 0.203 | 2.796 | 0.025 | 1263 | 0.1912 | 0.0177 | 0.0270 |
| 2010 | 0.201 | 2.651 | 0.027 | 1329 | 0.1693 | 0.0163 | 0.0136 |
| 2012 | 0.191 | 2.644 | 0.026 | 1360 | 0.1441 | 0.0163 | 0.0129 |
| 2014 | 0.233 | 2.586 | 0.028 | 1506 | 0.1579 | 0.0115 | 0.0168 |
| 2016 | 0.232 | 2.488 | 0.028 | 1458 | 0.1683 | 0.0179 | 0.0126 |
| 2018 | 0.282 | 2.537 | 0.028 | 1463 | 0.1607 | 0.0198 | 0.0096 |
| 2020 | 0.210 | 2.496 | 0.028 | 1580 | 0.1611 | 0.0201 | 0.0107 |
| 2022 | 0.290 | 2.505 | 0.030 | 1657 | 0.1588 | 0.0230 | 0.0116 |
| T1 | T2 | |||||||
|---|---|---|---|---|---|---|---|---|
| Type | 2002 | 2003 | 2007 | 2009 | ||||
| Core Country | USA | 0.789 | USA | 0.803 | USA | 0.657 | USA | 0.743 |
| BRA | 0.224 | BRA | 0.224 | BRA | 0.375 | BRA | 0.288 | |
| Semi-peripheral Country | FRA | 0.200 | CAN | 0.123 | NLD | 0.170 | CAN | 0.153 |
| CAN | 0.191 | NLD | 0.119 | JPN | 0.161 | ITA | 0.146 | |
| NLD | 0.110 | ITA | 0.115 | CAN | 0.158 | CHN | 0.139 | |
| CHN | 0.108 | ARG | 0.113 | ITA | 0.145 | NLD | 0.133 | |
| JPN | 0.108 | JPN | 0.113 | ESP | 0.143 | SVN | 0.122 | |
| ARG | 0.106 | FRA | 0.111 | CHN | 0.136 | AUS | 0.120 | |
| DEU | 0.100 | THA | 0.111 | KOR | 0.134 | GBR | 0.119 | |
| KOR | 0.097 | CHN | 0.107 | FRA | 0.130 | FRA | 0.116 | |
| T3 | T4 | |||||||
| Type | 2017 | 2018 | 2019 | 2022 | ||||
| Core Country | USA | 0.714 | USA | 0.743 | USA | 0.777 | USA | 0.743 |
| BRA | 0.340 | BRA | 0.307 | BRA | 0.302 | BRA | 0.324 | |
| Semi-peripheral Country | CHN | 0.237 | CAN | 0.215 | CHN | 0.215 | CHN | 0.199 |
| CAN | 0.219 | CHN | 0.214 | CAN | 0.161 | CAN | 0.178 | |
| KOR | 0.113 | KOR | 0.119 | ARG | 0.097 | NLD | 0.126 | |
| ARG | 0.103 | IND | 0.108 | MEX | 0.096 | ARG | 0.121 | |
| VNM | 0.103 | ARG | 0.104 | PRT | 0.096 | ESP | 0.110 | |
| FRA | 0.102 | JPN | 0.102 | GBR | 0.096 | DEU | 0.106 | |
| DEU | 0.102 | PRT | 0.100 | ITA | 0.095 | ITA | 0.105 | |
| PRT | 0.102 | ESP | 0.100 | THA | 0.095 | VNM | 0.102 | |
| Variable Name | Meaning | Die Body | Hypothesis Test | |
|---|---|---|---|---|
| endogenous structure | Edges | Side number |  | Constant terms are generally not explained. |
| mutual | Reciprocity |  | Whether there tend to be mutually beneficial soybean trade relations between economies | |
| gwodegree | Expansiveness |  | Whether there are a small number of “soybean trade star” economies | |
| dgwdsp | Multiple2_paths |  | Whether to pass on the soybean trade relationship through multiple paths | |
| dgwesp | Triadic_closure |  | Whether the soybean trade relationship between economies tends to be of agglomeration and transmission | |
| Stability | Stability |  | Whether the soybean trade relationship tends to be consistent between t+1 stage and t stag | |
| loss | variability |  | As time goes on, whether there is a tendency to disappear in the soybean trade relations | |
| exogenous mechanism | Nodeofactor (“ln_GDP”) | sender Economic level |  | Whether an economy with a certain production attribute is more likely to export soybeans |
| Nodeifactor (“ln_GDP”) | Receiver Economic level |  | Whether economies with a certain production attribute are more likely to import soybeans | |
| Nodeofactor (“ln_pop”) | Sender market scale |  | Whether an economy with a certain production attribute is more likely to export soybeans | |
| Nodeifactor (“ln_pop”) | Receiver market scale |  | Whether economies with a certain production attribute are more likely to import soybeans | |
| Nodematch (“ln_gdp”) | Assortativity economic level |  | Whether economies with one of the same attributes are more inclined to trade | |
| Nodematch (“ln_pop”) | Assortativity market scale |  | Whether economies with one of the same attributes are more inclined to trade | |
| Colony Contig distcap | Distance network Proximity network Colonial network |  | Whether economies with relationships in other networks prefer soybean trade |
| Model 1 | Model 2 | Model 3 | Model 4 | |
|---|---|---|---|---|
| edges | −27.07767 *** (0.20125) | −27.32832 *** (0.21494) | −14.08031 *** (0.22414) | −9.41716 *** (0.24931) |
| nodeicov.ln_gdp | 1.08865 *** (0.01657) | 1.07584 *** (0.01735) | 0.42967 *** (0.01641) | 0.93783 *** (0.02009) |
| nodeicov.ln_pop | −0.52736 *** (0.01781) | −0.52476 *** (0.01872) | −0.38485 *** (0.01581) | −0.29520 *** (0.02181) |
| nodeocov.ln_gdp | 1.121101 *** (0.01642) | 1.22884 *** (0.01720) | 0.46690 *** (0.01495) | 0.22360 *** (0.01837) |
| nodeocov.ln_pop | 0.36922 *** (0.01792) | 0.48125 *** (0.01886) | 0.42533 *** (0.01473) | 0.30501 *** (0.02069) |
| colony | 0.46980 *** (0.05097) | 0.51227 *** (0.05042) | 0.34991 *** (0.06197) | |
| contig | 2.13160 *** (0.04313) | 1.95234 *** (0.04044) | 1.17630 *** (0.05391) | |
| distcap | −0.00012 *** (0.00000) | −0.00005 *** (0.00000) | −0.00005 *** (0.00000) | |
| mutual | 0.96381 *** (0.03617) | 0.63575 *** (0.04151) | ||
| gwodegree | −1.09512 *** (0.10964) | −1.84010 *** (0.12466) | ||
| dgwdsp | −0.06351 *** (0.00195) | −0.04973 *** (0.00193) | ||
| dgwesp | 1.21727 *** (0.02608) | 1.05722 *** (0.02775) | ||
| Stability | 1.52725 *** (0.01239) | |||
| loss | −0.02239 *** (0.00320) |
| Model 5 | Model 6 | Model 7 | |
|---|---|---|---|
| edges | −8.95457 *** | −8.68033 *** | −12.75974 * |
| (−0.46803) | (−0.47709) | [−13.60265; −12.10730] | |
| nodeicov.ln_gdp | 0.35368 *** | 0.35878 *** | 0.60186 * |
| (−0.03737) | (−0.0367) | [0.53394; 0.69151] | |
| nodeicov.ln_pop | −0.24479 *** | −0.21820 *** | −0.34711 * |
| (−0.04177) | (−0.04038) | [−0.44474; −0.27274] | |
| nodeocov.ln_gdp | 0.19936 *** | 0.17597 *** | 0.42443 * |
| (−0.0338) | (−0.03374) | [0.36398; 0.48986] | |
| nodeocov.ln_pop | 0.35016 *** | 0.29641 *** | 0.28269 * |
| (−0.03924) | (−0.03821) | [0.21398; 0.34542] | |
| colony | 0.38307 ** | 0.50797 *** | 0.37477 * |
| (−0.1315) | (−0.1223) | [0.28146; 0.46397] | |
| contig | 1.29630 *** | 1.29089 *** | 1.12567 * |
| (−0.10602) | (−0.10285) | [1.01282; 1.26745] | |
| distcap | −0.00005 *** | −0.00005 *** | −0.00006 * |
| (−0.00004) | (−0.00001) | [−0.00007; −0.00005] | |
| mutual | 0.71290 *** | 0.54929 *** | 0.67012 * |
| (−0.09101) | (−0.087) | [0.59583; 0.73729] | |
| gwodegree | −1.75009 *** | −1.97298 *** | −2.74005 * |
| (−0.22) | (−0.22571) | [−3.19400; −2.39058] | |
| dgwdsp | −0.05673 *** | −0.06422 *** | −0.04562 * |
| (−0.00423) | (−0.00411) | [−0.05156; −0.03854] | |
| dgwesp | 1.58793 *** | 0.96529 *** | 0.73895 * |
| (−0.04971) | (−0.04945) | [0.68589; 0.79498] | |
| Stability | 1.61264 *** | 1.52177 *** | 1.48738 * |
| (0.02647) | (−0.02475) | [1.45852; 1.51794] | |
| loss | −0.10031 *** | −0.03244 * | −0.03509 * |
| (−0.02329) | (−0.02291) | [−0.05487; −0.01544] |
Disclaimer/Publisher’s Note: The statements, opinions and data contained in all publications are solely those of the individual author(s) and contributor(s) and not of MDPI and/or the editor(s). MDPI and/or the editor(s) disclaim responsibility for any injury to people or property resulting from any ideas, methods, instructions or products referred to in the content. |
© 2025 by the authors. Licensee MDPI, Basel, Switzerland. This article is an open access article distributed under the terms and conditions of the Creative Commons Attribution (CC BY) license (https://creativecommons.org/licenses/by/4.0/).
Share and Cite
Liu, Y.; Zhang, L.; Failler, P.; Wang, Z. The Dynamic Evolution of Agricultural Trade Network Structures and Its Influencing Factors: Evidence from Global Soybean Trade. Systems 2025, 13, 279. https://doi.org/10.3390/systems13040279
Liu Y, Zhang L, Failler P, Wang Z. The Dynamic Evolution of Agricultural Trade Network Structures and Its Influencing Factors: Evidence from Global Soybean Trade. Systems. 2025; 13(4):279. https://doi.org/10.3390/systems13040279
Chicago/Turabian StyleLiu, Yue, Lichang Zhang, Pierre Failler, and Zirui Wang. 2025. "The Dynamic Evolution of Agricultural Trade Network Structures and Its Influencing Factors: Evidence from Global Soybean Trade" Systems 13, no. 4: 279. https://doi.org/10.3390/systems13040279
APA StyleLiu, Y., Zhang, L., Failler, P., & Wang, Z. (2025). The Dynamic Evolution of Agricultural Trade Network Structures and Its Influencing Factors: Evidence from Global Soybean Trade. Systems, 13(4), 279. https://doi.org/10.3390/systems13040279