Abstract
In the realm of autonomous vehicle technology, the multimodal vehicle detection network (MVDNet) represents a significant leap forward, particularly in the challenging context of weather conditions. This paper focuses on the enhancement of MVDNet through the integration of a multi-head attention layer, aimed at refining its performance. The integrated multi-head attention layer in the MVDNet model is a pivotal modification, advancing the network’s ability to process and fuse multimodal sensor information more efficiently. The paper validates the improved performance of MVDNet with multi-head attention through comprehensive testing, which includes a training dataset derived from the Oxford Radar RobotCar. The results clearly demonstrate that the multi-head MVDNet outperforms the other related conventional models, particularly in the average precision (AP) of estimation, under challenging environmental conditions. The proposed multi-head MVDNet not only contributes significantly to the field of autonomous vehicle detection but also underscores the potential of sophisticated sensor fusion techniques in overcoming environmental limitations.
1. Introduction
The emergence of autonomous vehicles represents a significant milestone in transportation’s evolution, merging artificial intelligence, sensor technologies, and machine learning to redefine mobility. Initially focused on providing basic driver assistance, this field has rapidly progressed to develop vehicles capable of navigating complex settings autonomously. Achievements in this arena include the integration of sophisticated perception systems, dynamic decision-making capabilities, and extensive testing under varied surrounding conditions, pushing the envelope of technological possibilities. As advancements continue, the fusion of these technologies not only aims to improve road safety and efficiency but also to transform the travel experience.
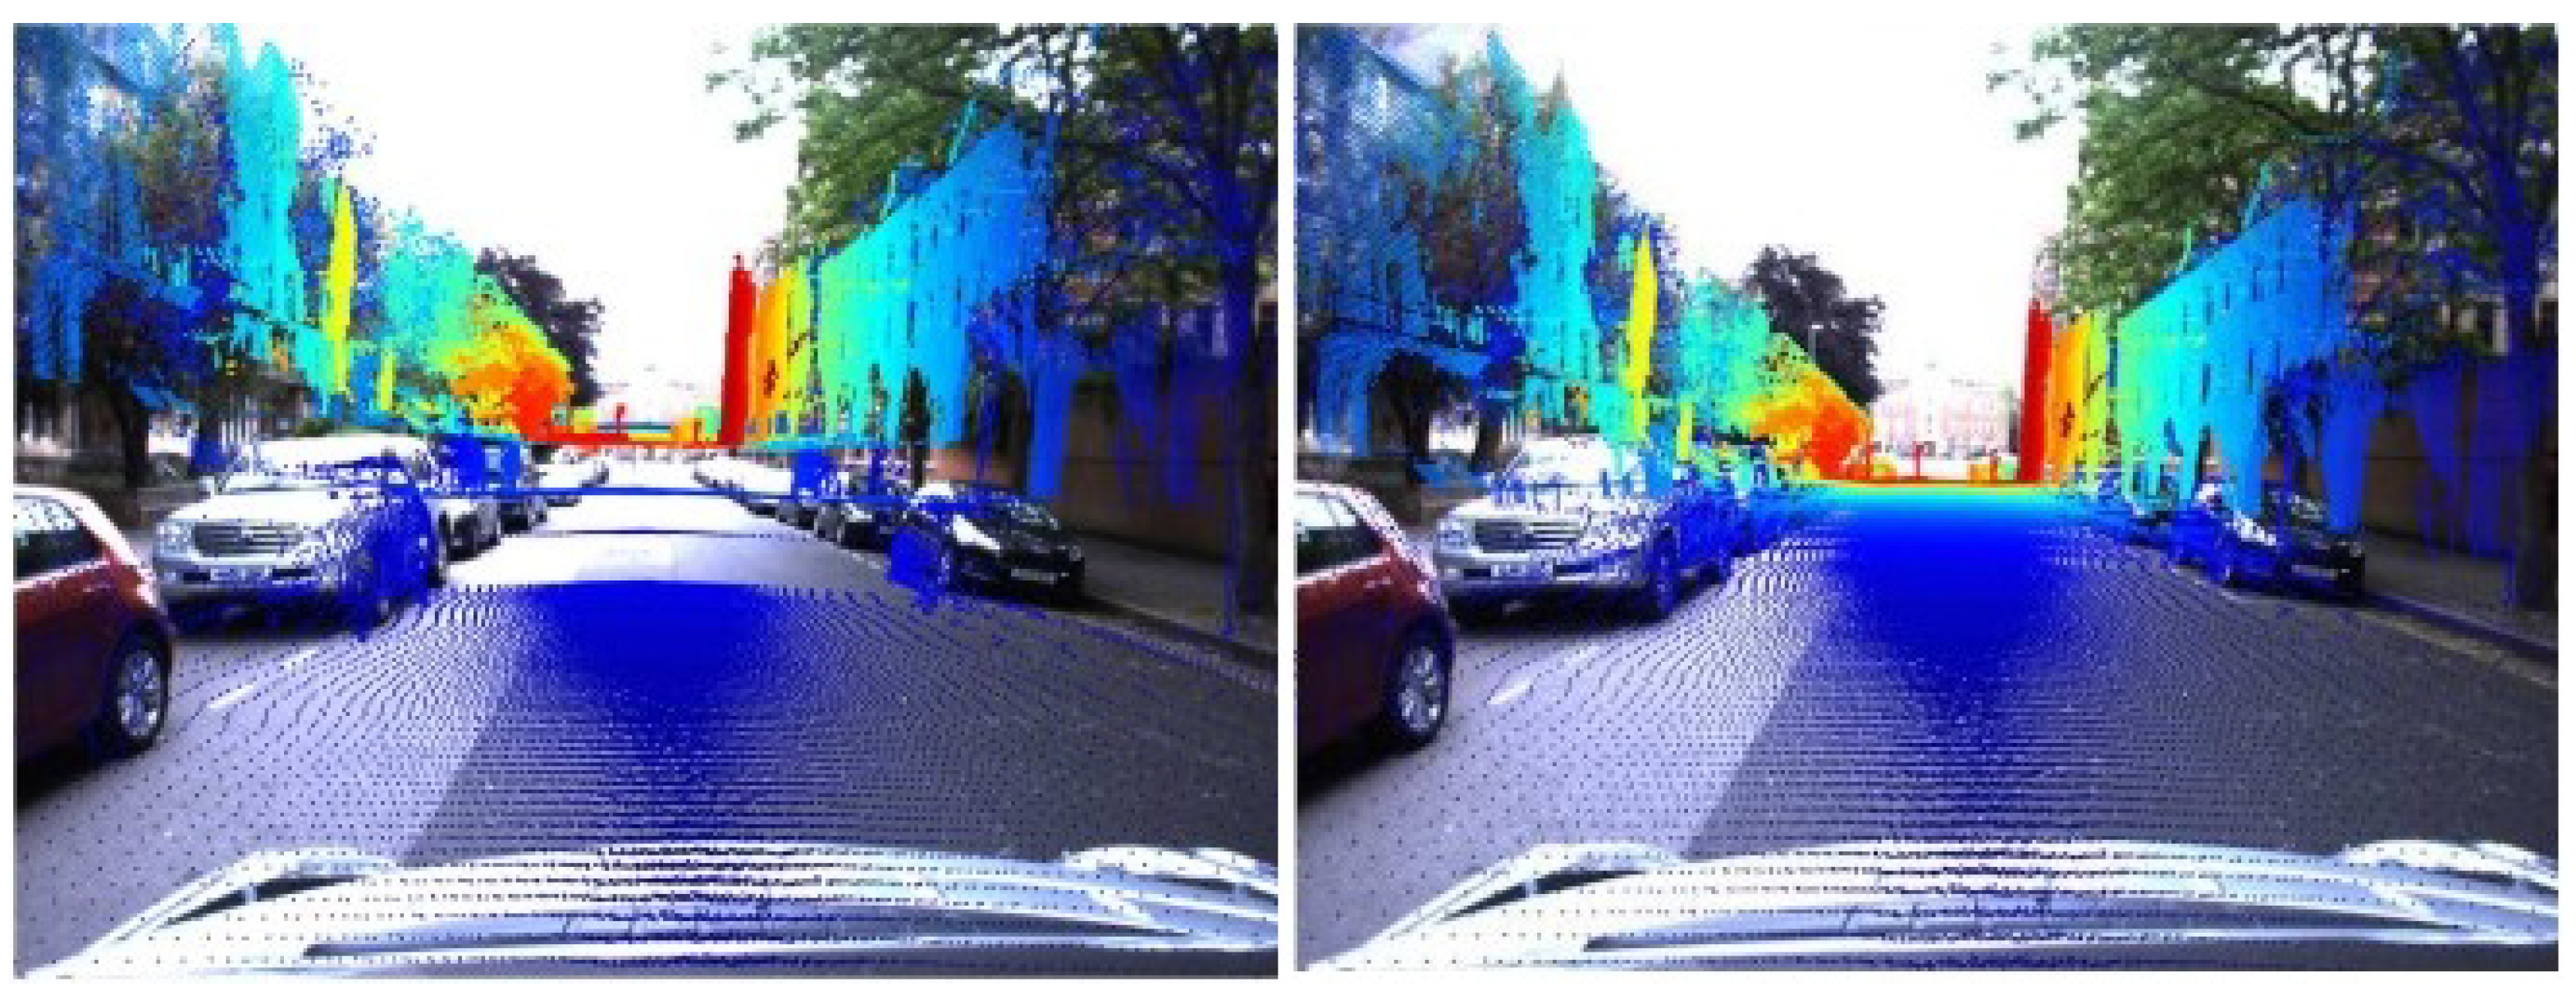
In the advanced landscape of autonomous vehicle technology, the core goal is achieving fully automated driving (Level Five). Central to this ambition is the requirement for object detection systems [1], which are pivotal for ensuring the accurate identification and localization of objects around the vehicle, even under challenging weather conditions such as fog, rain, or snow. Modern autonomous vehicles typically incorporate a variety of sophisticated sensor modalities [2,3,4], for example, radar, LiDAR (light detection and ranging), and cameras. These sensors, by fusing their complementary functionalities, collectively enhance object detection capabilities. This fusion of diverse sensory inputs is especially crucial in mitigating the inherent limitations. While the fusion of multimodal sensors is a promising advancement, most of the object-detection methodologies, which predominantly combine LiDAR and camera data [5,6,7], as shown in Figure 1, exhibit a notable dependency on visibility. Such reliance is fraught with challenges, particularly in inclement weather conditions like fog [8], where visual sensors’ effectiveness is significantly impaired [9]. The attenuation of visual cues in foggy environments raises concerns about the reliability and consistency [10] of these perception systems in autonomous vehicles.

Figure 1.
Lidar pointcloud projected into an image [11].
Radar technology is emerging as a key component in the sensor suite of autonomous vehicles [12], particularly for its effectiveness in navigating through foggy conditions [2,3], a setting in which many sensors like LiDAR and cameras often fail to provide the expected performance. The superiority of radar in such scenarios stems from its use of millimeter-wave signals. Unlike the fine particles that form fog, rain, and snow, these wavelengths are significantly larger [13], allowing radar signals to perforate or circumvent these obstacles with greater ease. Despite this advantage, the integration and exploration of radar data in current autonomous driving datasets have been limited. This limitation is primarily due to the scattered nature of radar data. Recently, the Oxford Radar RobotCar (ORR) dataset [11] introduced a more refined approach with the implementation of a rotating horn antenna radar system. This design helps to achieve a 360° view of the surroundings and a fine azimuth resolution of 0.9°.
MVDNet, a multimodal deep fusion model, has been developed to address the challenge of vehicle detection in foggy weather conditions, a critical aspect of the advancement of autonomous driving technologies. The architecture of MVDNet is structured into two pivotal stages [10], enhancing the accuracy and reliability of vehicle detection. The first stage of the model is dedicated to generating initial proposals separately from LiDAR and radar data. This independent processing ensures that the unique characteristics of each sensor modality are fully leveraged. In the second and more advanced stage of MVDNet, a a fusion mechanism is strategically implemented. This mechanism is designed to integrate the features extracted from both LiDAR and radar sensors, utilizing temporal analysis through 3D convolutional processes. The later fusion approach in the model is designed to concentrate processing on key areas, known as regions of interest (RoI), improving both the efficiency of proposal generation and the precision of sensor data integration.
The multi-head attention mechanism, incorporated to enhance MVDNet, functions by dividing the attention process into multiple segments, or ’heads’, each focusing on distinct aspects of the input data. This approach allows for the parallel analysis of different features or dimensions [14], such as spatial relationships or signal intensities, enabling the MVDNet to extract a broader spectrum of information or features from the input data than it would with single attention mechanisms, which focus on one aspect of the data at a time. In this paper, with the calculation and comparison of the attention scores for different data segments, the mechanism dynamically determines the focus areas, ensuring a comprehensive and detailed analysis and thereby improving the performance of the MVDNet model.
2. Literature Review and Related Works
2.1. Sensors for Automotive Vehicles
The automotive sector has undergone significant transformation with the incorporation of sophisticated sensing technologies, including cameras, radar, and LiDAR, which are fundamental to the advancement of autonomous and assisted driving systems. Cameras play an essential role by providing crucial visual information for tasks such as traffic surveillance and lane recognition, though their performance may be compromised in suboptimal lighting or adverse meteorological conditions. Conversely, radar sensors demonstrate superior performance in these difficult conditions by employing radio waves to ascertain the distance and velocity of objects, thereby proving to be essential for functions like collision prevention and adaptive cruise control. Complementarily, LiDAR sensors utilize laser technology to generate intricate three-dimensional representations of the vehicle’s surroundings, a key element for accurate navigation within autonomous driving frameworks, notwithstanding the challenges posed by elevated costs and susceptibility to specific climatic conditions [15]. The collaborative integration of these sensors significantly elevates vehicular safety and operational capabilities, representing a noteworthy advancement in automotive technologies toward the realization of more advanced and dependable transportation systems.
2.2. LiDAR
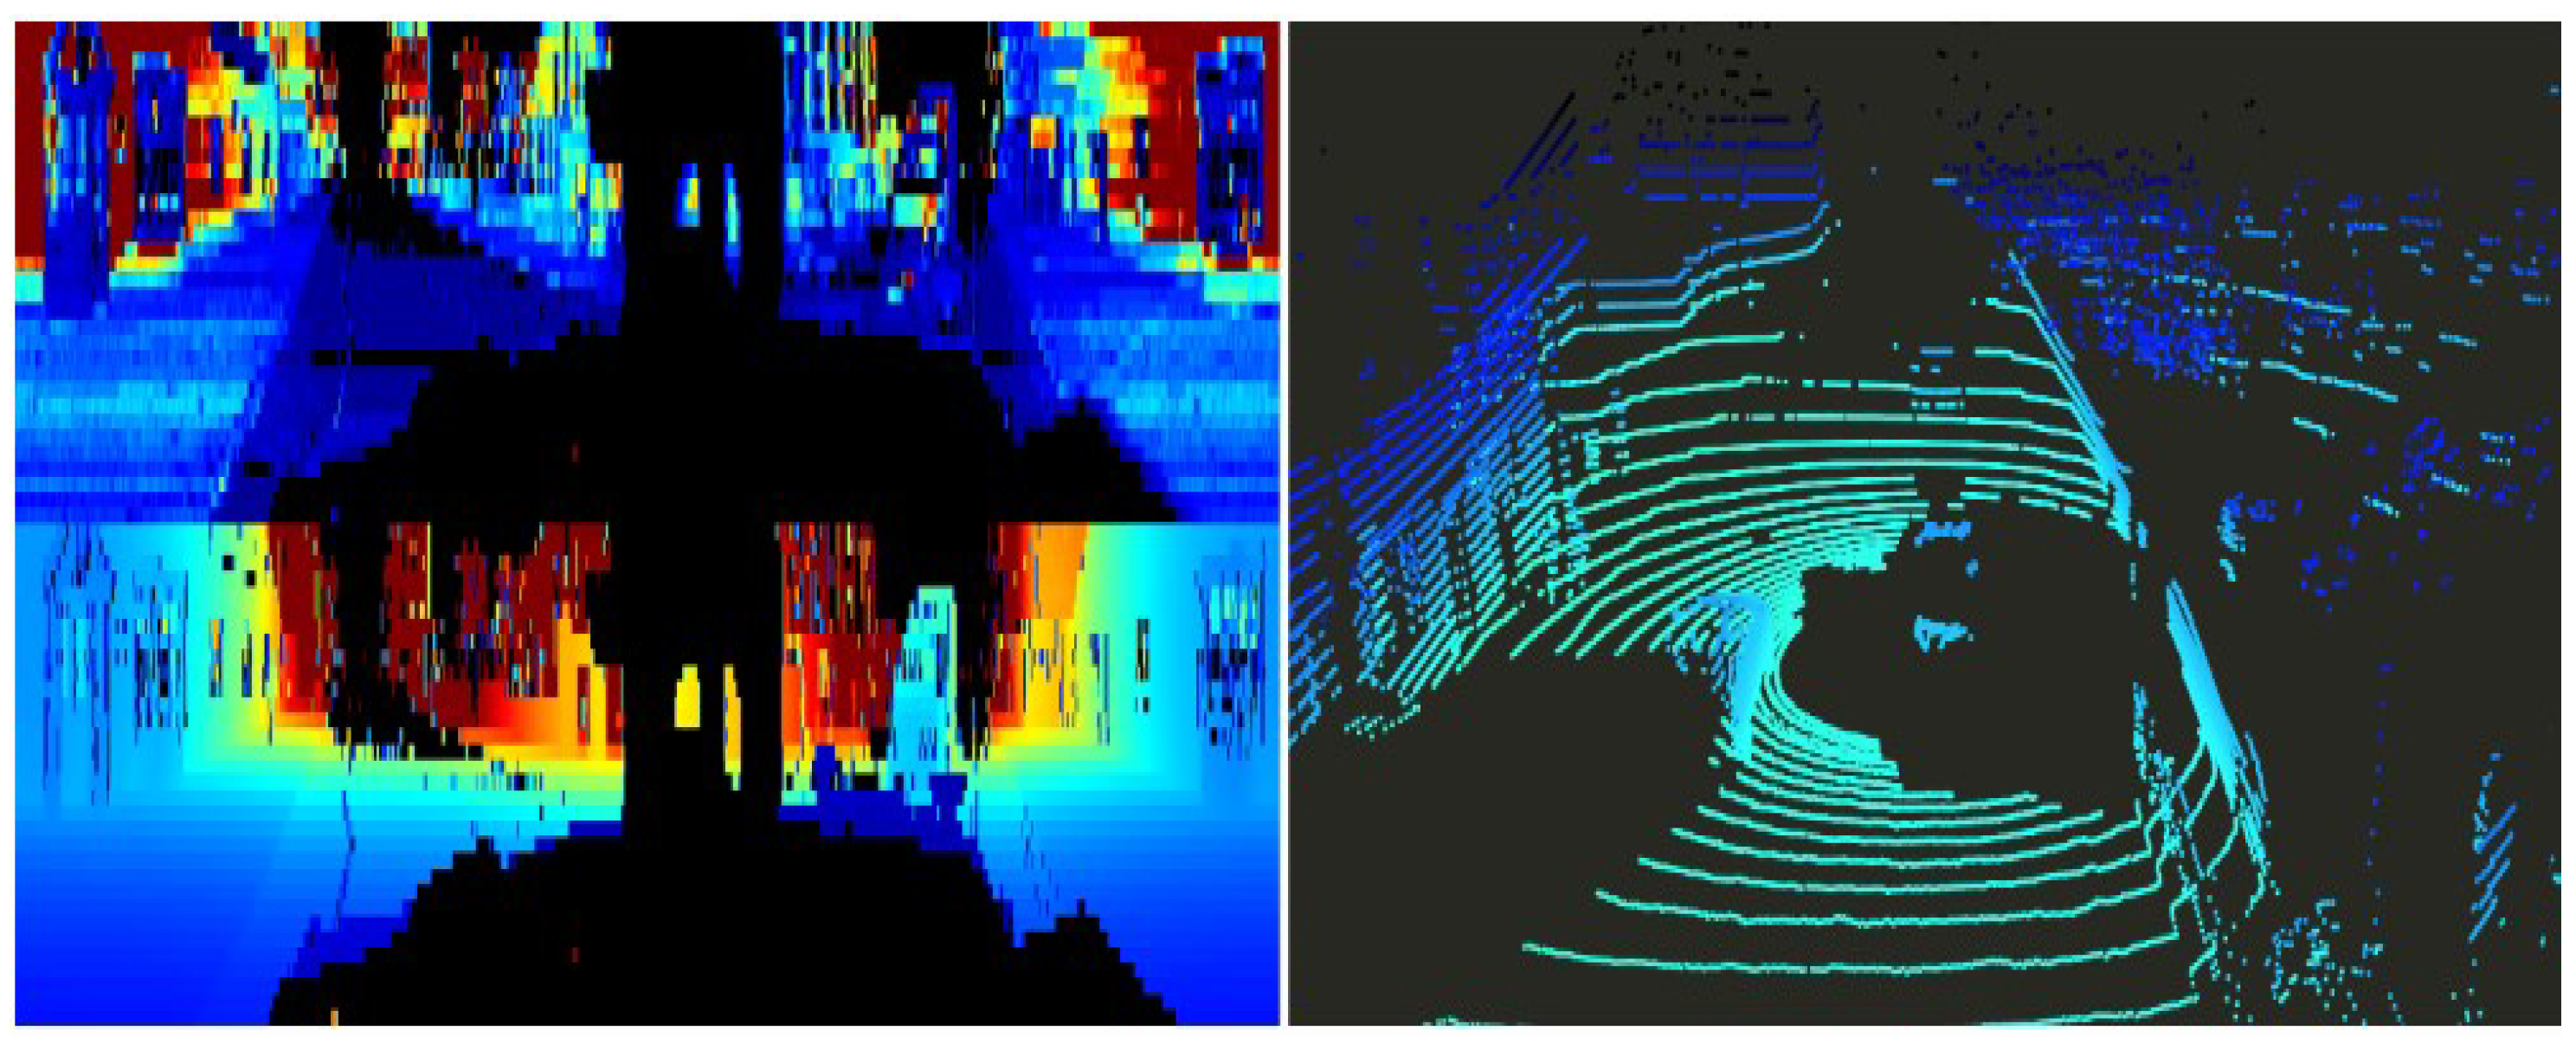
LiDAR technology functions by dispatching laser beams and determining the duration required for these beams to return after reflecting from a target. While the foundational concept appears straightforward, the execution is complex, necessitating high precision in timing measurements and a low signal-to-noise ratio. LiDAR systems are technologically varied and serve multiple industries, including automotive, military, robotics, surveillance, and topographical mapping, employing airborne laser scanners. Each field requires specific features from LiDAR systems; for example, the automotive sector seeks scanners that are cost-effective, swift, and capable of high resolutions. Prominent manufacturers in this arena, such as Velodyne, Ibeo, and Valeo, mainly employ mechanical beam steering, optical laser diodes for emitting pulses, and avalanche photodiodes for detection [9]. In Figure 2, the Velodyne LiDAR scan from the ORR dataset is showcased, which has been widely utilized for vehicle detection tasks. Nonetheless, recent advancements lean towards solid-state technologies, offering promises of better durability and lower maintenance requirements for these devices.

Figure 2.
Velodyne LiDAR scan in Polar form (left side) and Velodyne LiDAR scan in Pointcloud form (right side) [11].
LiDAR technology is recognized for its superior resolution compared to radar technologies and its ability to perform better than cameras in adverse weather conditions. This makes it exceptionally effective in creating accurate environmental models for vehicles [16]. However, LiDAR systems come with their own set of challenges, including the need for significant computational resources and complex data analysis capabilities. Additionally, their performance can be affected by various environmental factors. The intricate blend of advanced functionality and technical demands underscores LiDAR’s pivotal role in advancing vehicle technology and enhancing the precision of environmental sensing.
2.3. Radar
The adoption of radar sensors is witnessing significant growth, especially in systems aimed at supporting autonomous driving, such as adaptive driver-assistance systems (ADAS). These systems often utilize radar for functionalities such as automatic braking and adaptive cruise control. Radar sensors are increasingly valued for their role in augmenting camera-based systems, enhancing features like collision avoidance and the detection of pedestrians and cyclists. Among the spectrum of radar technologies used within the automotive sector, frequency-modulated continuous wave (FMCW) radar stands out for its widespread application. Its popularity is attributed to several benefits, including the affordability of its components and its lower computational demands for signal analysis.
In Figure 3, an FMCW radar scan from the ORR dataset is showcased, which has been widely utilized for vehicle detection tasks. The core mechanism of radar technology is based on the emission and reception of radio waves, functioning in a manner akin to acoustic echoes. Similar to the way sounds reverberate in a cavern, radar systems emit frequency waves that bounce off objects in their vicinity. The reflected signal is then captured by the radar system and processed to ascertain the distance and direction of the objects. This principle of echo detection allows the radar to precisely evaluate the location and movement of proximate objects, playing a crucial role in the enhancement of contemporary vehicle safety and navigational systems.
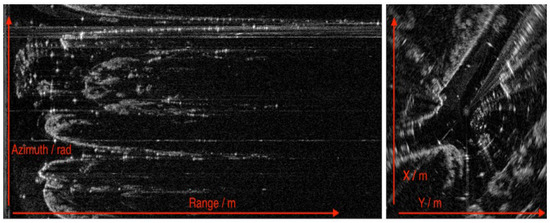
Figure 3.
Radar scan in Polar form (left side) and after conversion in Cartesian form (right side) [11].
2.4. Multimodal Fusion
In the dynamic realm of automotive technologies, the advent of multimodal sensor fusion marks a significant breakthrough. This innovative approach synthesizes data from a variety of sensors, including cameras, LiDAR, radar, and ultrasonic, to augment the vehicle’s cognitive and decision-making frameworks. The essence of multimodal sensor fusion lies in amalgamating and analyzing data from disparate sources to forge a cohesive and precise depiction of the vehicle’s external environment. Cameras contribute rich visual cues, LiDAR provides accurate distance metrics, and radar ensures reliability under unfavorable weather conditions. The integration of these diverse data streams equips vehicles with an all-encompassing perception of their surroundings [17].
The principal benefit of sensor fusion technology is its contribution to a more dependable and robust system, as shown in Figure 4. It addresses the inherent shortcomings of standalone sensors, guaranteeing uninterrupted operation even when a specific sensor type is impaired. This attribute is especially critical in applications such as autonomous driving, where the stakes of safety and precision are high. Within the scope of advanced driver-assistance systems (ADAS), sensor fusion is indispensable. It bolsters functionalities like adaptive cruise control, collision prevention, and lane maintenance assistance, thereby elevating driving safety and efficiency. The amalgamated data facilitates enhanced predictive accuracy and adaptability to evolving road scenarios [18].
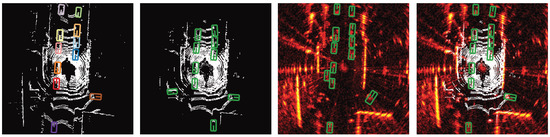
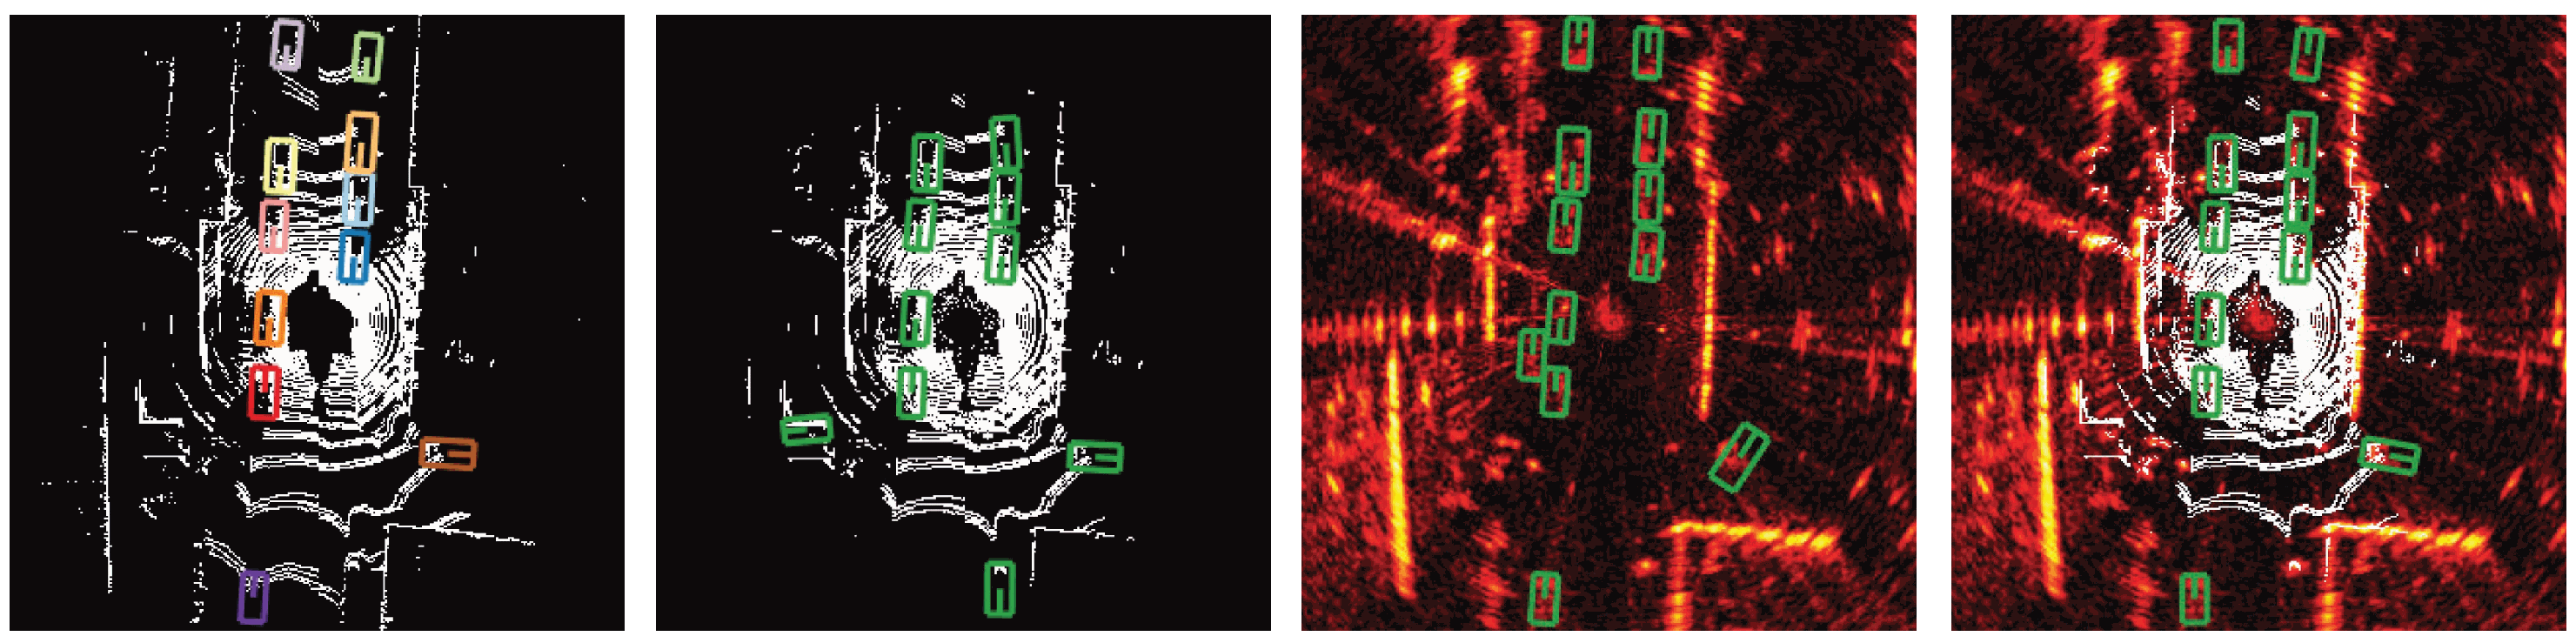
Figure 4.
Performance Comparison for Vehicle Detection: this figure presents a side-by-side comparison of vehicle detection methods, showcasing (progression from left to right) the ground truth, LiDAR-only, radar-only, and the fusion of LiDAR and radar data using bounding boxes [10].
However, the implementation of sensor fusion is not without its challenges. It demands substantial computational power to process varied data inputs in a real-time context. Achieving synchronization and calibration across different sensor modalities is imperative to preserve the integrity of data accuracy. Moreover, the intricacies involved in integrating such systems can influence the overall design and economic aspects of the vehicle.
2.5. Evaluation Metrics
Within the domain of object detection, the assessment of models primarily relies on four critical metrics: precision, recall, average precision (AP), and intersection over Union (IoU).
Precision: Precision serves as a measure of the accuracy with which a model identifies positive instances, calculating the fraction of positive detections that are accurate. A superior precision score suggests that the model’s positive forecasts are predominantly trustworthy. This metric is especially vital in contexts where the impact of incorrect positive predictions is considerable. Precision is determined by dividing the total number of correct positive predictions by the aggregate of correct positives and incorrect positives [19].
Recall: Recall evaluates the ability of a model to correctly identify all genuine positive instances, reflecting the proportion of actual positives that the model successfully detects. A model exhibiting a high recall score is effective in recognizing positive instances, thereby reducing the incidence of false negatives. This metric is critical in domains where overlooking a positive instance could lead to significant repercussions. The calculation of recall involves the ratio of true positive identifications to the sum of true positives and false negatives [19].
Average Precision: Average precision (AP) emerges as a crucial metric within the realm of object detection, providing an in-depth evaluation of a model’s performance across various recall thresholds. It overcomes the constraints of individual metrics such as precision or recall by offering a broader gauge of model effectiveness. Average precision (AP) is calculated as the area under the curve in a precision-recall graph. This curve is created by plotting precision against recall at different threshold settings. Here, precision represents the ratio of accurately identified positive instances to the total number of positive predictions made, while recall denotes the ratio of accurately identified positive instances to the overall actual positive instances.
Adjustments in the threshold level for what constitutes a positive prediction affect both precision and recall metrics, thereby influencing the shape of the precision-recall curve. The computation of AP involves calculating the area beneath this curve, with a larger area indicating enhanced performance of the object detection model.
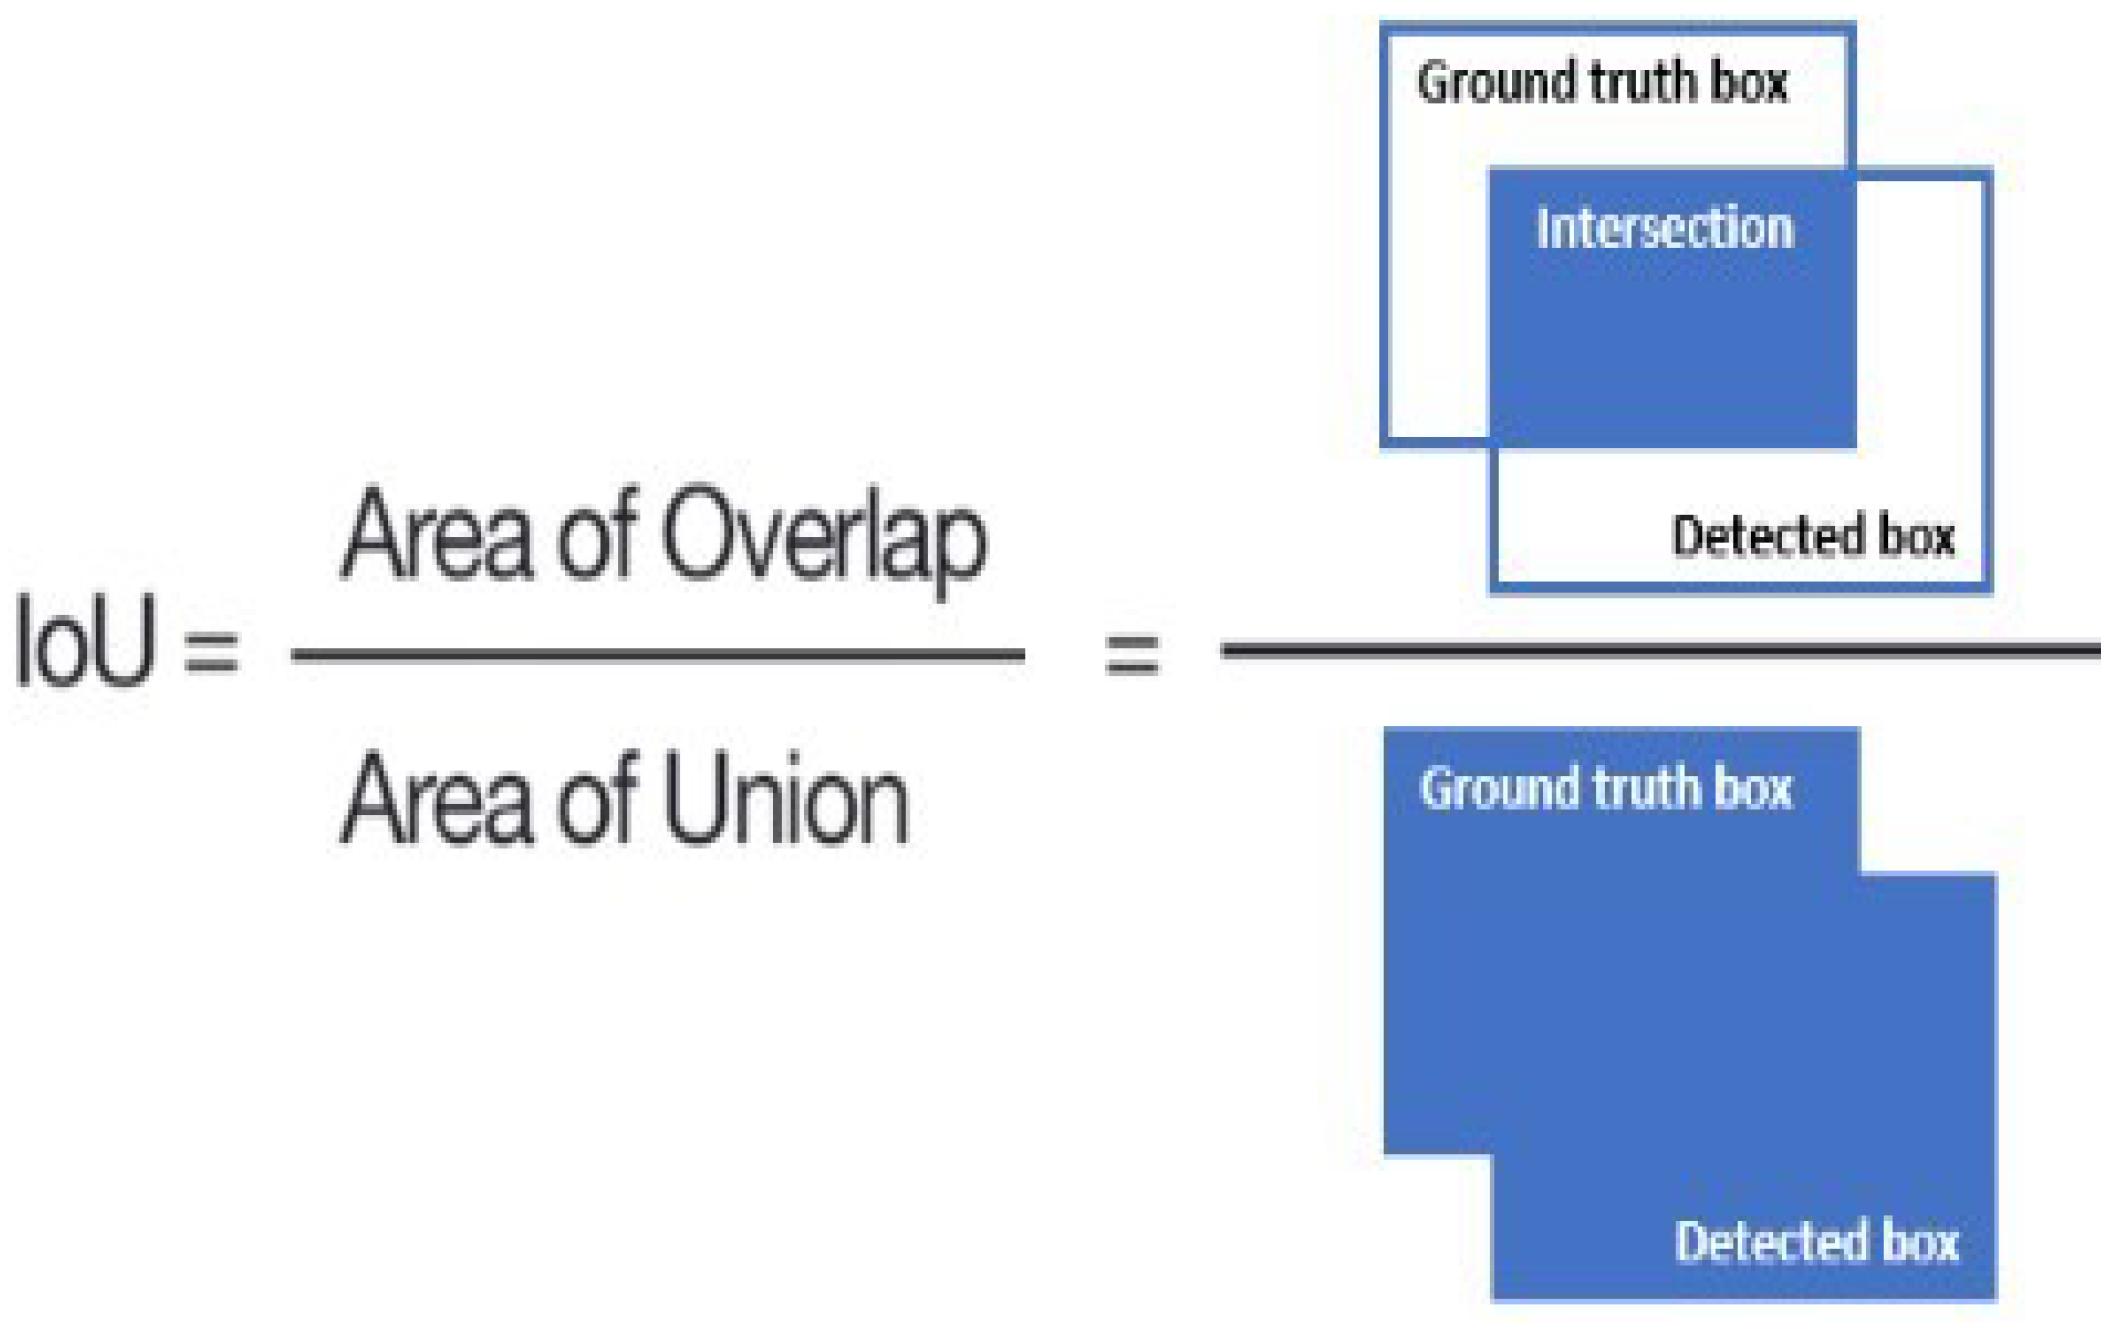
Intersection over Union (IoU): IoU stands as a pivotal metric within the field of computer vision, extensively used in evaluating the accuracy of object detection and segmentation models against a particular dataset. It measures the degree of overlap between the predicted bounding box and the ground truth bounding box by calculating the ratio of their intersection area to the area of their union, as shown in Figure 5. The IoU score is indicative of a model’s accuracy in object localization, with higher IoU values denoting greater congruence between the predicted localization and the actual object position. It is customary to establish an IoU threshold (e.g., 0.5) to distinguish detections as true positives or false positives, thereby facilitating a standardized evaluation of detection accuracy [20].

Figure 5.
Intersection over Union (IoU) for object detection [21].
2.6. Related Works
In the domain of LiDAR-based vehicle detection, techniques can be classified into two groups, both utilizing the inherent characteristics of LiDAR data. The initial method regards LiDAR data as point clouds and utilizes specialized architectures specifically developed for unorganized point sets [22,23,24]. This method allows for direct learning from unprocessed point clouds, as demonstrated by multiple models [16,25]. PointRCNN [25] implements PointNet [22] to extract distinct point characteristics and combines these characteristics at different stages to perform object detection. PointPillars [16] utilizes PointNet to segment point clouds into ’pillars’ and extract features. Nevertheless, those approaches face difficulties in extracting features from locations that are affected by environmental conditions. The second method is transforming LiDAR point clouds into voxelization forms, enabling their compatibility with conventional methods for image detection [26,27,28]. PIXOR [28] is a method that divides point clouds into sections to create maps depending on heights, facilitating the integration of voxel data with other image forms.
The degradation of data quality caused by atmospheric conditions such as fog and haze has led to the development of advanced dehazing methods for visual sensors. However, the LiDAR data’s point clouds exhibit sparsity, making typical dense 3D point cloud cleaning algorithms [29,30,31] inefficient for removing fog. The model based on CNN for denoising fog, proposed by Heinzler et al. [32], has made progress in this field, but could not completely resolve the problem of visibility concerns in LiDAR data induced by fog.
DEF [2] developed an innovative fusion detector that integrates camera, radar, and LiDAR data. Although DEF employs an innovative method, both its radar and camera components are constrained by a restricted angular field of view. RadarNet [33] represents a notable advancement, merging sparse radar data with LiDAR point clouds at the early fusion stage of the feature extraction phase through CNN. This fusion enables object detection with a complete 360° view. Similarly, LiRaNet [34] integrates radar and LiDAR point clouds, mapping roads at the initial state to predict the direction of vehicles more accurately. MVDNet [10] focuses specifically on robust vehicle detection in foggy weather conditions. To accomplish this, MVDNet integrates radar with significantly higher resolution to enhance the information obtained from LiDAR point clouds, compared to the radars utilized in LiRaNet and RadarNet, along with a deep late fusion technique. Utilization of the fusion of multimodal sensors [6,7,17,35], as demonstrated in these advancements, provides redundancy of data, thereby improving the resilience of detection systems against disruptions caused by sensor noise and unfavorable weather circumstances.
Vision transformer (ViT) adapts the transformer architecture, is widely used in natural language processing, and can handle computer vision tasks [36]. With the effectiveness of self-attention in vision transformer, images can be processed for image classification and object detection, and this architecture has also achieved remarkable success compared to CNN. Another novel multi-manifold multi-head attention mechanism for vision transformers (ViT) enhances performance in image identification and classification. This mechanism integrates three separate manifolds [37], namely Euclidean, Grassmann, and symmetric positive definite with multi-head technique, as an alternative to the self-attention mechanism, allowing for a deeper focus on extracting complex features from the image.
3. Methodology
The multi-head attention MVDNet is an advanced variant of the basic MVDNet model, incorporating a multi-head attention layer specifically within the fusion network unit of the MVDNet framework. The foundational structure of the MVDNet model is divided into two distinct stages, as in Figure 6. In the initial stage, the region proposal network (RPN) is tasked with processing input from both LiDAR and radar sensors by extracting feature maps from the sensor data and subsequently generating proposals based on these maps. The second stage, termed the region fusion network (RFN), is responsible for fusing and pooling the region-specific features extracted from each sensor’s data.
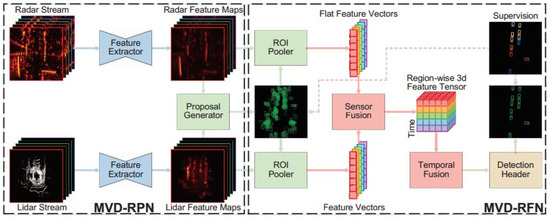
Figure 6.
Architecture of basic MVDNet model [10].
3.1. Region Proposal Network (RPN)
In the MVDNet architecture, as depicted in Figure 6, two separate feature extractor modules are employed for both LiDAR and radar input signals, each sharing an identical structural design. The LiDAR segment incorporates a notably higher number of feature channels, a decision influenced by the greater volume of channels present in LiDAR inputs compared to radar. The feature extraction phase consists of four convolutional layers, each with a 3 × 3 kernel, dedicated to initial feature extraction at a similar resolution of inputs. Subsequently, the process involves downsampling of the output through a max-pooling step. In a further step, this model employs a transposed convolution layer to upscale the feature maps. The output of these upscaled samples is then integrated with the feature maps of higher resolution through a skip connection, as shown in Figure 7. This approach results in a composite set of feature maps for the LiDAR and radar inputs.
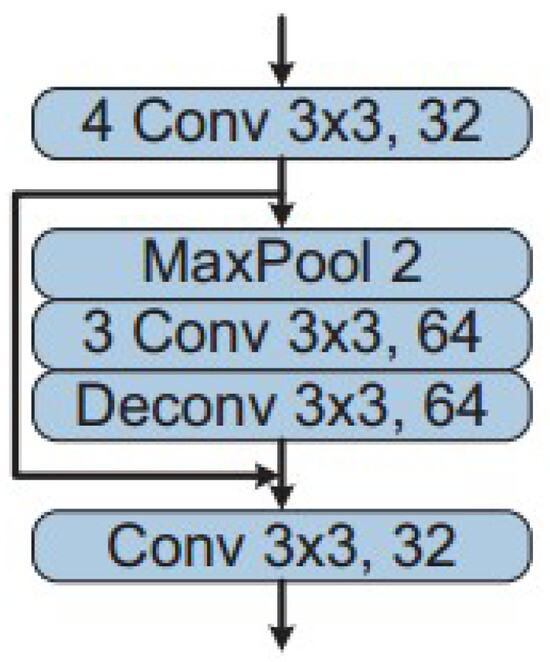
Figure 7.
Feature extractor in MVDNet-RPN stage [10].
The proposal generation phase of the model operates on these integrated feature maps of the sensors. Considering the dynamic nature of moving vehicles, which may appear at various locations in multiple sensor frames, the approach adopted here differs from traditional methods that generate proposals based on feature maps of individual frames. Instead, the model concatenates the sensors’ feature maps from all the available frames. After that, proposals are generated from the combined information of LiDAR and radar sensors.
3.2. Region Fusion Network (RFN)
The MVDNet-RPN module generates proposals that are subsequently employed by region of interest (RoI) poolers to create the region-specific features for each sensor type. The sensor fusion unit integrates the feature tensors derived from LiDAR and radar data. For instance, when a vehicle is completely obscured by fog, resulting in no LiDAR points, the weight of the LiDAR’s feature tensors is adjusted to be less significant. Conversely, in cases where the radar intensity map exhibits a pronounced peak due to some background element, the corresponding radar feature tensors in that area are assigned a reduced weighting.
3.3. Proposed Multi-Head Attention Layer at RFN
The input sequences are projected into several subspaces during the initial stage of multi-head attention. In Figure 8, these input sequences (feature tensors from LiDAR and radar) are typically the queries (Q), keys (K), and values (V). For each attention head h, these sequences are linearly transformed using different learnable weight matrices.
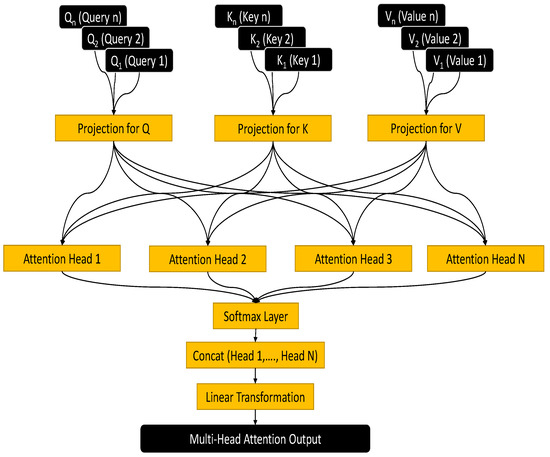
Figure 8.
Mechanism of Multi-Head Attention Layer.
Here, , , and are the weight matrices for the queries, keys, and values, respectively. Each head has its own set of these matrices, which enables the model to simultaneously record various parts of the input.
Each head computes the attention scores by performing a scaled dot-product attention. This operation is a measure of the compatibility between queries and keys.
The scaling factor , derived from the dimension of the keys (), is employed to mitigate the issue of dot products becoming excessively big in size. This is done to avoid the occurrence of vanishing gradients during the training process. After computing the attention outputs for each head, these outputs are concatenated and then linearly transformed. This step combines the information captured by each head into a single output.
Each head output is the result of the attention function:
The concatenated result is then multiplied by another learnable weight matrix .
4. Evaluation
4.1. Training and Dataset
The Oxford Radar RobotCar dataset, consisting of 8862 samples, is divided into two parts—7071 samples (80% of total samples) for training and 1791 samples (20% of data) for testing—ensuring that there is no geographical overlap between the two sets. The training process of the model is initiated with a learning rate of 0.01. This rate is systematically decreased by 0.1 after iterations, and the total number of training span iterations, starting from an untrained state. For the training of models to accurately function in foggy conditions, a randomized methodology is applied to introduce fog into the LiDAR point clouds within the samples of the ORR dataset. The fog simulation was conducted using the fog model from the deep fusion (DEF) [2] framework, applied with 0.5 probability within the used samples. This intervention was specifically targeted at LiDAR samples due to the inherent susceptibility of LiDAR technology to fog, which can significantly affect its performance by reducing visibility.
The collection of the original ORR data involved the use of a car outfitted with a NavTech CTS350-X radar, Wantage, UK, positioned at the middle of the roof. This radar was used in conjunction with two LiDARs named Velodyne HDL-32E, Edinburgh Scotland, UK, the outputs of which were combined. For synchronizing the LiDAR data and radar data, the methodology differed from the conventional pairing of every radar scan with the nearest LiDAR scan in terms of time. Instead, the process entailed concatenating all LiDAR scans (F = 5) occurring within the interval of a single radar scan. Following the synchronization strategy applied for merging LiDAR and radar data in the Oxford Radar RobotCar dataset, which comprises 8862 samples, each sample encapsulates an ensemble of 5 LiDAR scans within the duration assigned to a single radar scan. As a result, the aggregate count of LiDAR scans across all 8862 samples is approximately 44,310 (calculated as 5 LiDAR scans multiplied by 8862 samples), while the total number of radar scans equals 8862, corresponding to one radar scan per sample. For a given radar frame and its concurrent F = 5 LiDAR frames, a point x in the nth LiDAR frame was included if it was within the area defined by the intervals .
4.2. Selection of Multi-Head Number
The selection of an optimal number of heads within a multi-head attention mechanism is a critical decision that substantially affects the performance of a neural network architecture. Increasing the number of attention heads enhances the model’s ability to discern and integrate complex features from the input data, with each head capturing a distinct aspect of the data, thereby enriching the model’s comprehension with a varied perspective.
In the context of each attention head, the dimensions of the key, query, and value vectors are proportionally reduced relative to the model’s total dimensionality, divided evenly among the existing number of heads. Consequently, a higher count of attention heads results in diminished dimensions for each, which may influence the model’s capacity to recognize and process complex patterns. Additionally, the computational demand escalates with more heads, necessitating a careful consideration of available computational resources. In environments with computational constraints, it may be prudent to decrease the number of heads. Alternatively, augmenting the model with additional layers could prove more efficacious than a mere increase in headcount, as deeper layers can enhance feature extraction depth, while more heads broaden the range of feature extraction.
For the multi-head attention mechanism to function optimally, the input’s dimensionality—comprising the dimensions for the key, query, and value vectors—must be divisible by the chosen number of heads. This divisibility ensures an even distribution of the input’s dimensions across each head, allowing for consistent processing. Accordingly, our architectural design considered head counts such as 2, 4, 7, 14, 21, and 49, aligning with the divisibility criterion of our baseline model’s input dimension. Through comprehensive experimental evaluations, our focus was refined to the assessment of 4, 7, and 14 heads to identify the most suitable configuration for our model, balancing between computational efficiency and the ability to capture a wide spectrum of data insights.
4.3. Results
Evaluation of the proposed multi-head attention layer within the fusion network unit of the MVDNet model was conducted by considering the average precision (AP) across varying intersection over union (IoU) thresholds and selecting the number of heads in the attention layer for which the existing MVDNet model performs best. This analysis involved altering the number of heads in the attention layer to 4, 7, and 14. It was observed that the optimal performance was achieved when the head number was set to 7, as detailed in Table 1. Consequently, this configuration was selected for implementation into the MVDNet’s fusion network to enhance its performance.

Table 1.
Comparison of average precision (AP) for different numbers of head in multi-head attention.
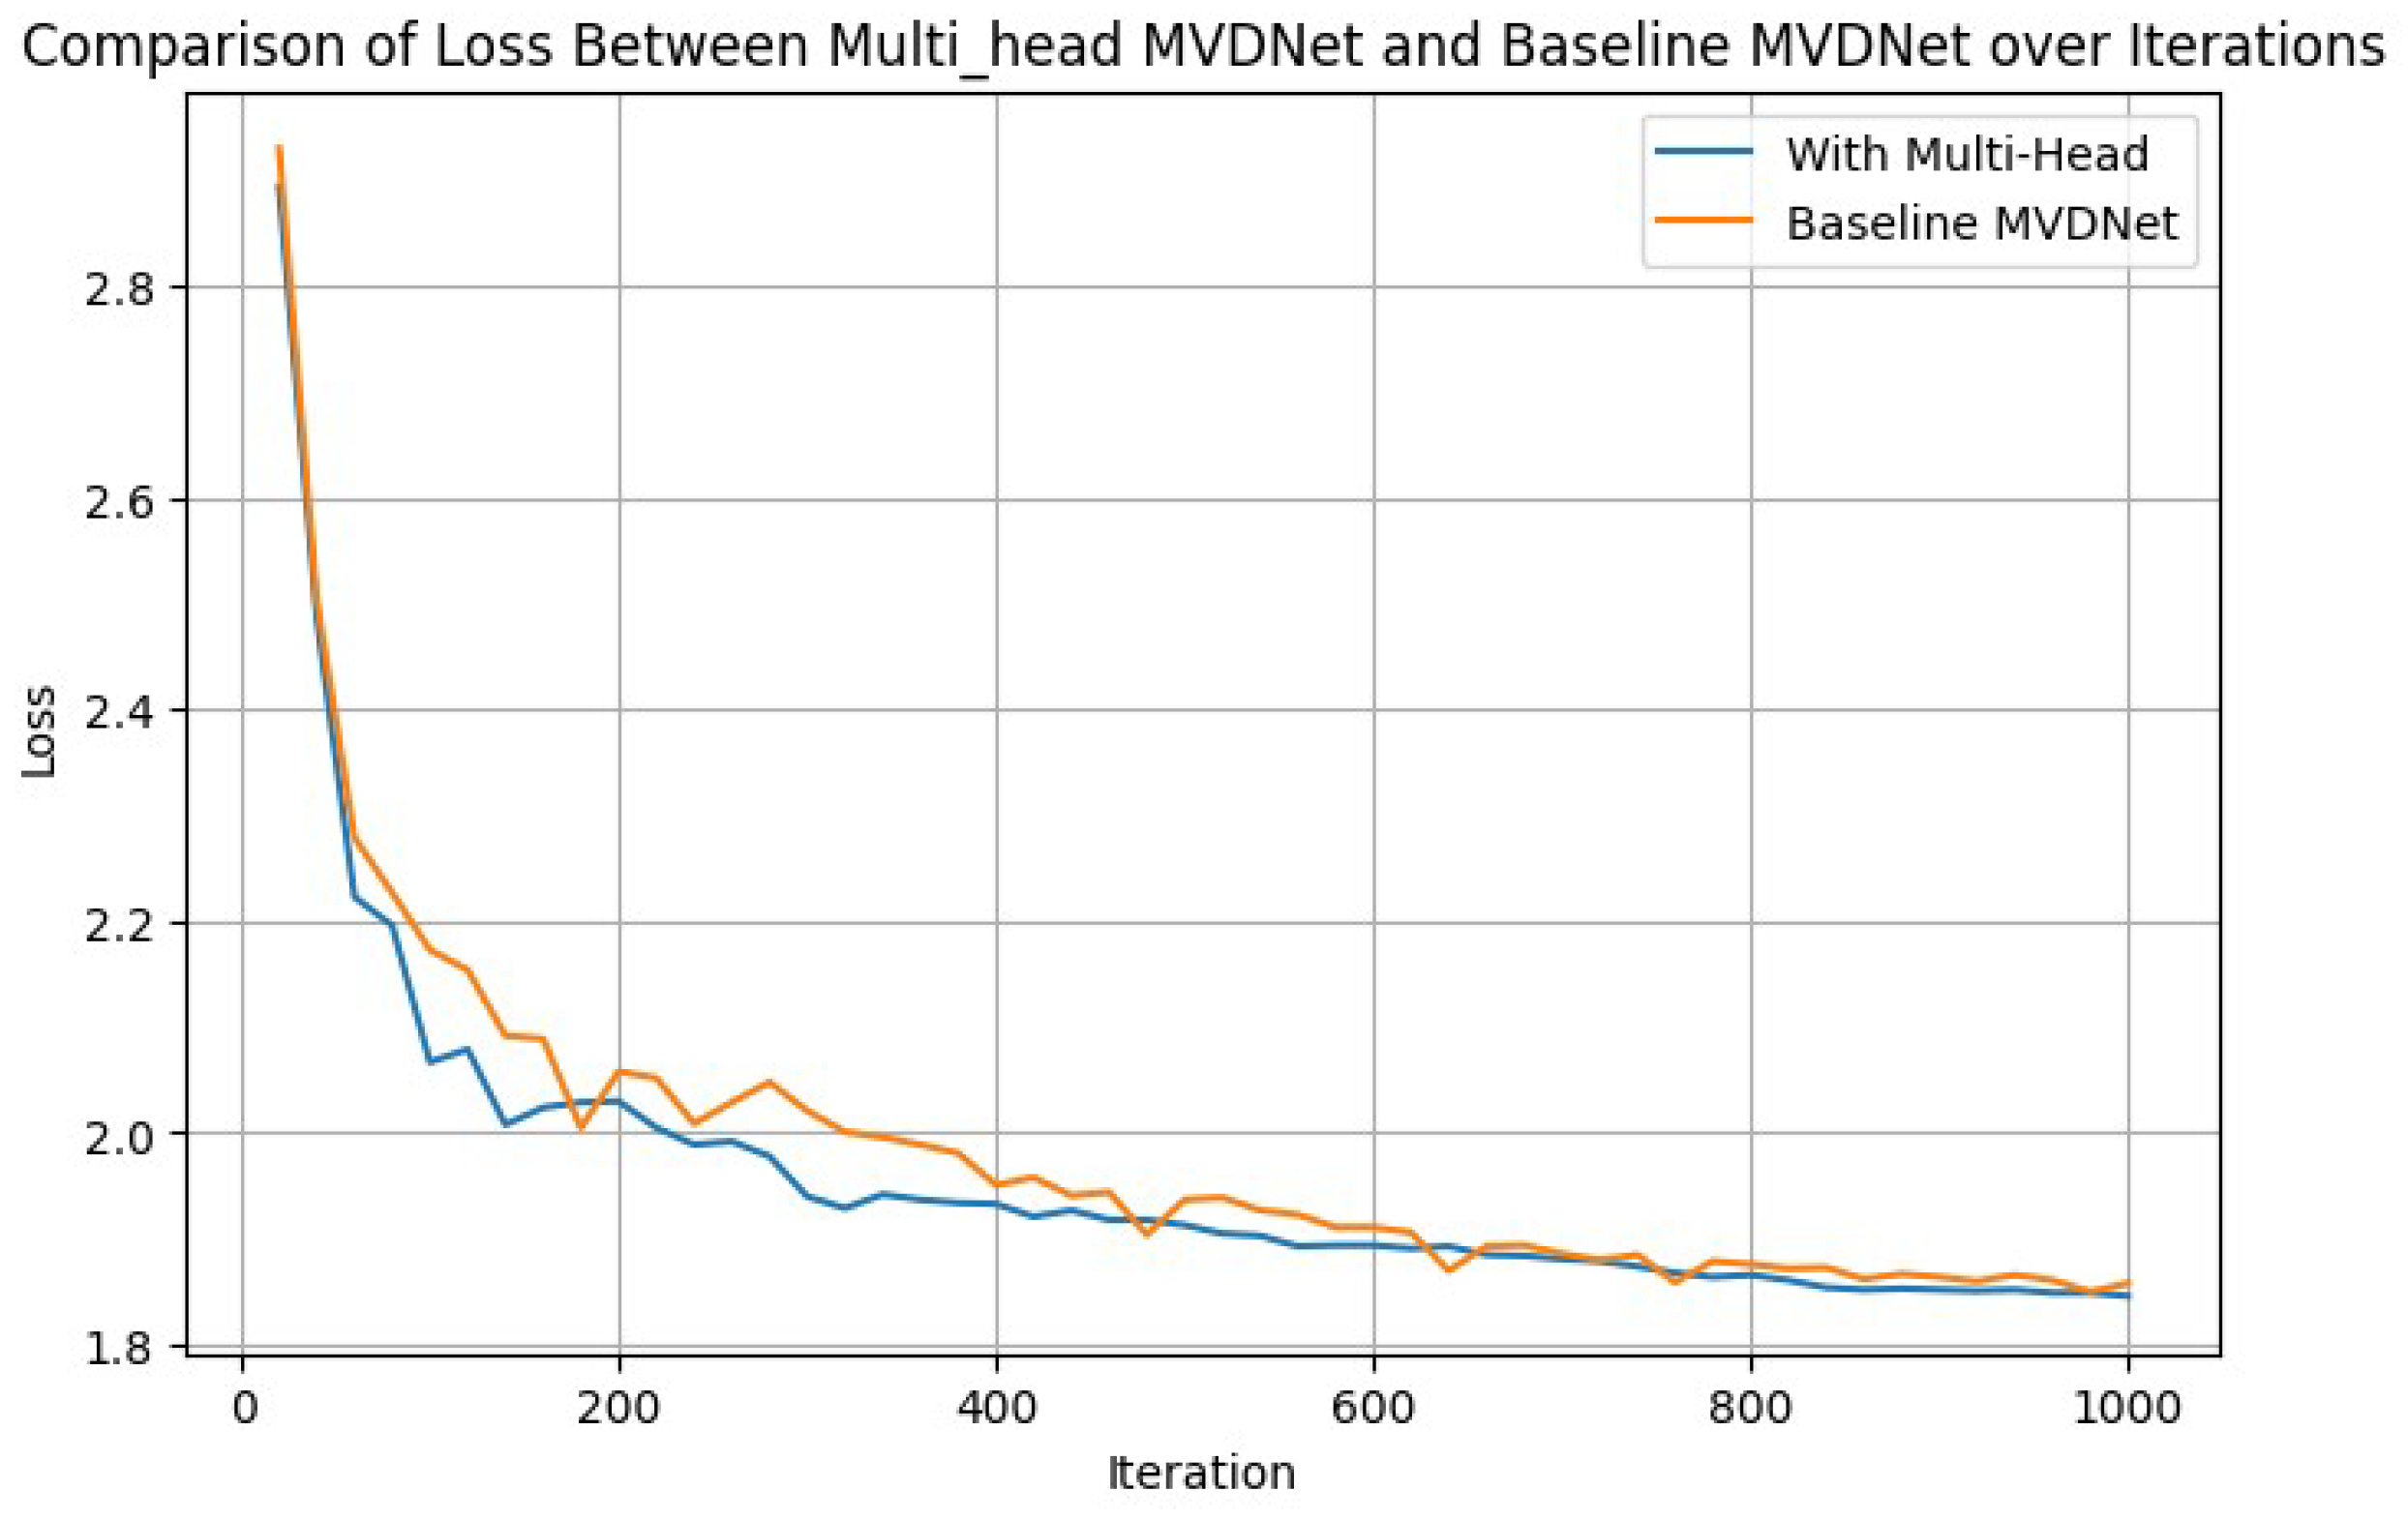
A comparative analysis of the loss ratio demonstrated by the multi-head MVDNet and the base MVDNet for the first epoch is illustrated in Figure 9, as an example of certain iterations. This figure offers an in-depth comparison of the loss metrics between the multi-head vehicle detection network and the baseline MVDNet carefully mapped out over numerous iterations. This side-by-side analysis carried out over 1000 iterations within a single epoch and sheds light on how each network configuration performed over time. The comparison is designed to give a clear view of how well each system operates in terms of detecting vehicles, with a focus on understanding the differences in performance between the innovative multi-head vehicle detection network and the standard MVDNet. By examining the changes in loss metrics through these iterations, we can see which network might be more effective or efficient, providing insights into the potential benefits of using a more complex network structure like the multi-head vehicle detection network for vehicle detection tasks.
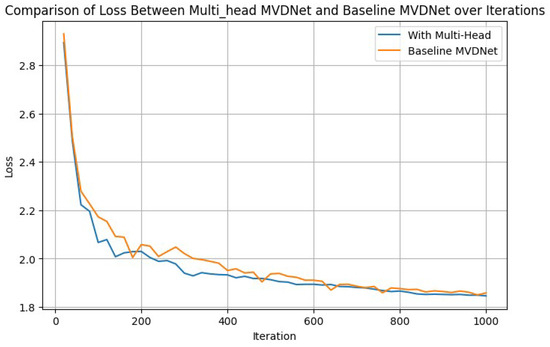
Figure 9.
Example of one epoch: loss graphs over first 1000 iterations.
The performance of the proposed multi-head MVDNet was rigorously tested under varying weather conditions, specifically averaged over foggy and clear scenarios. In this paper, evaluation involved a comparative study between the multi-head MVDNet and several benchmarks: the baseline MVDNet, the DEF LiDAR–radar fusion method, and systems relying on LiDAR only or radar only. The results indicate that the multi-head MVDNet consistently outperformed the methods mentioned in Table 2 across different IoU values (0.5, 0.65, and 0.8).
Table 2.
Comparison of average precision(AP) of the proposed multi-head MVDNet with baseline MVDNet and other methods.
The results detailed in Table 2 illustrate the exceptional performance of the proposed multi-head MVDNet across various intersection over union (IoU) thresholds. Specifically, at an IoU threshold of 0.5, the multi-head MVDNet achieves an impressive average precision (AP) of 91.20%, which represents a significant improvement of 2.05% over the baseline MVDNet (AP of 89.15%) and a 3.01% increase compared to the MVDNet variant without the self-attention mechanism (AP of 88.19%). These findings are visually represented in Figure 10, highlighting the enhancements brought about by the multi-head attention mechanism in vehicle detection accuracy.
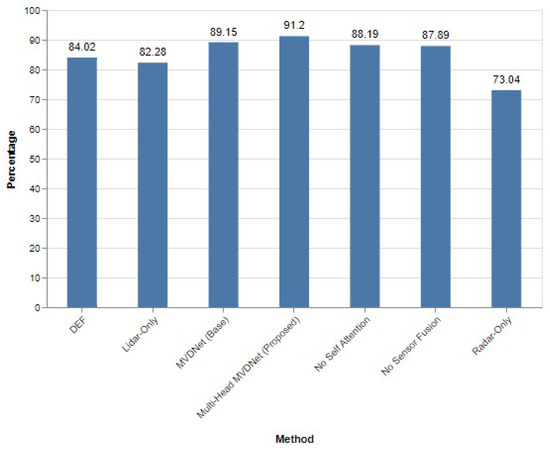
Figure 10.
Performance evaluation of different methods when IoU = 0.5.
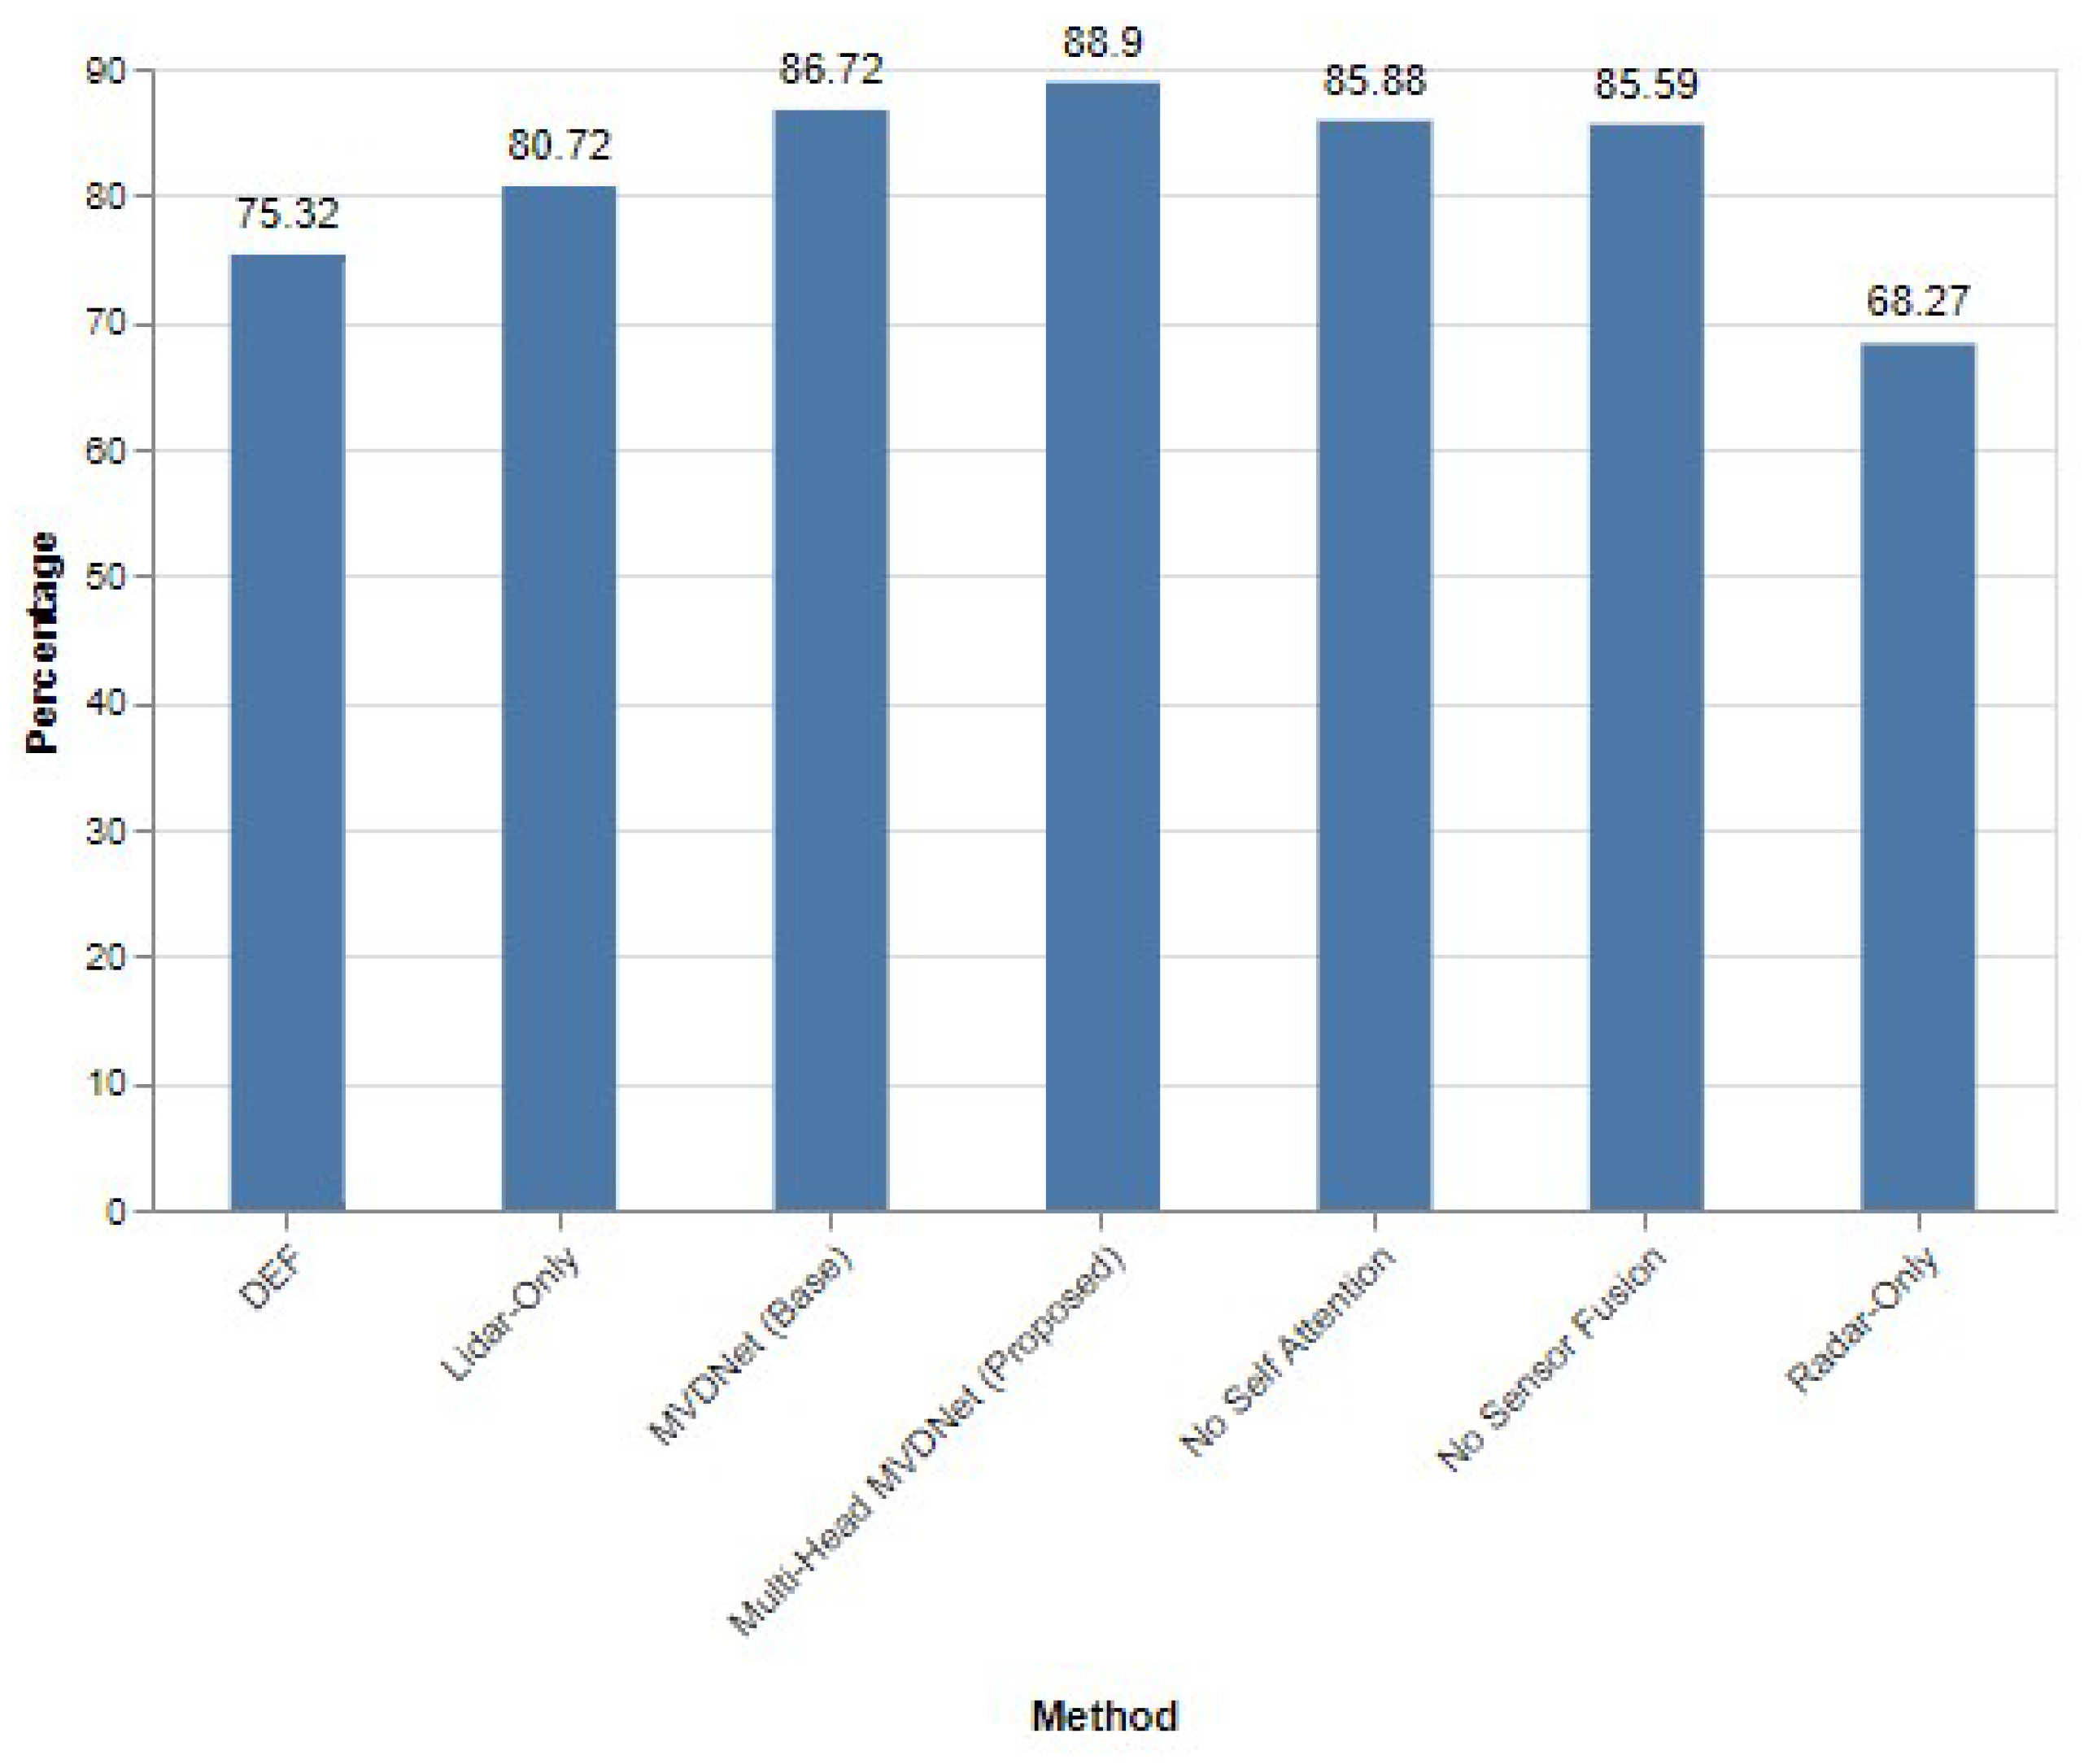
Further examination at a stricter IoU threshold of 0.65 reveals that the multi-head MVDNet not only maintains but extends its lead, with an AP of 88.90%. This marks a 2.18% increase over the baseline MVDNet (AP of 86.72%) and significantly outperforms the radar-only approach (AP of 68.27%) and the LiDAR-only configuration (AP of 80.72%). The advanced performance of the multi-head MVDNet is depicted in Figure 11, showcasing its robustness and superior precision even under higher detection stringencies.
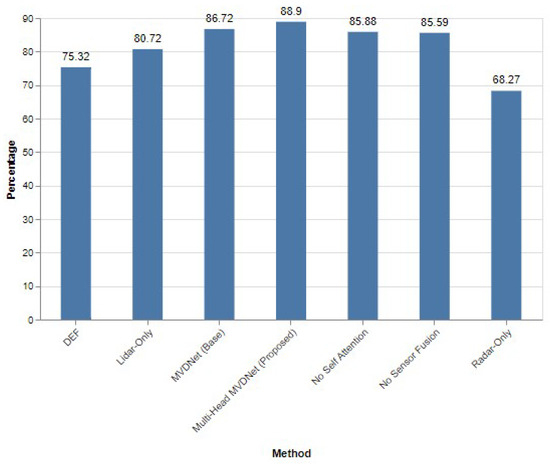
Figure 11.
Performance evaluation of different methods when IoU = 0.65.
At the most demanding IoU threshold of 0.8, the proposed model continues to demonstrate its superiority, achieving an AP of 74.10%, which exceeds the baseline MVDNet’s performance by 2.34% (AP of 71.76%). This performance is especially notable when compared to the significant drop in AP observed in the DEF method (AP of 43.62%) and the radar-only setup (AP of 43.25%), emphasizing the multi-head MVDNet’s enhanced capability to maintain accuracy and reliability in detecting vehicles under tight precision requirements.
5. Conclusions
The implementation of the multi-head MVDNet marks a significant advancement in the field of vehicle detection, particularly under challenging weather conditions like fog or snow. The multi-head MVDNet model builds upon the existing MVDNet framework, which utilizes the complementary strengths of LiDAR and radar through the later fusion of their extracted feature tensors. A pivotal modification in the novel MVDNet model is the integration of a multi-head attention layer within its fusion network. This layer replaces the conventional self-attention mechanism in MVDNet, segmenting the attention process into multiple parts. Through extensive experimentation with various head counts, the configuration utilizing seven heads was identified as the most effective, thereby becoming the chosen setup for multi-head attention. When examining the multi-head MVDNet, the ORR dataset, characterized by its high-resolution radar and LiDAR data, was utilized. The experimental findings indicate that the multi-head MVDNet consistently surpasses the original MVDNet, LiDAR-only, and DEF models in terms of accuracy of vehicle detection. There are plans to further expand the system’s capabilities by experimenting with different types of attention mechanisms.
Additionally, for future real-time implementation in autonomous vehicles, this study will explore adopting a dual-stage computational strategy, building on the existing use of the NVIDIA GTX 1080M GPU for the proposed multi-head vehicle detection network. Initially, the network will continue its training on this GPU, selected for its proven computational efficiency, which is critical to ensuring the model’s robustness and accuracy. Upon successful training, the model will be deployed on an embedded edge computing platform, mirroring methodologies utilized in existing sensor fusion frameworks [38]. Such deployment, aimed at platforms akin to the edge computer, will facilitate efficient real-time processing and decision-making through direct interfacing with the vehicle’s operational systems. This strategic integration of high-performance training and efficient edge-based inference is intended to equip the autonomous driving system with precise environmental interpretations, crucial for the vehicle’s instantaneous response in complex scenarios. Implementing this dual-stage computational approach ensures the practical applicability and scalability of the multi-head vehicle detection network to the real-world hardware used for autonomous vehicles.
Author Contributions
Conceptualization, N.T. and M.E.-S.; methodology, N.T.; software, N.T.; validation, N.T. and M.E.-S.; writing—original draft preparation, N.T.; writing—review and editing, N.T. and M.E.-S.; supervision, M.E.-S. All authors have read and agreed to the published version of the manuscript.
Funding
This research received no external funding.
Data Availability Statement
The data used in this study from the Oxford RobotCar Dataset is available under a Creative Commons Attribution-NonCommercial-ShareAlike 4.0 International License (CC BY-NC-SA 4.0).
Conflicts of Interest
The authors declare no conflicts of interest.
References
- Kalgaonkar, P.; El-Sharkawy, M. NextDet: Efficient Sparse-to-Dense Object Detection with Attentive Feature Aggregation. Future Internet 2022, 14, 355. [Google Scholar] [CrossRef]
- Bijelic, M.; Gruber, T.; Mannan, F.; Kraus, F.; Ritter, W.; Dietmayer, K.; Heide, F. Seeing Through Fog Without Seeing Fog: Deep Multimodal Sensor Fusion in Unseen Adverse Weather. arXiv 2020, arXiv:1902.08913. [Google Scholar]
- Caesar, H.; Bankiti, V.; Lang, A.H.; Vora, S.; Liong, V.E.; Xu, Q.; Krishnan, A.; Pan, Y.; Baldan, G.; Beijbom, O. nuScenes: A multimodal dataset for autonomous driving. arXiv 2020, arXiv:1903.11027. [Google Scholar]
- Geiger, A.; Lenz, P.; Urtasun, R. Are we ready for autonomous driving? The KITTI vision benchmark suite. In Proceedings of the 2012 IEEE Conference on Computer Vision and Pattern Recognition, Providence, RI, USA, 16–21 June 2012; pp. 3354–3361. [Google Scholar] [CrossRef]
- Chen, X.; Ma, H.; Wan, J.; Li, B.; Xia, T. Multi-View 3D Object Detection Network for Autonomous Driving. arXiv 2017, arXiv:1611.07759. [Google Scholar]
- Qi, C.R.; Liu, W.; Wu, C.; Su, H.; Guibas, L.J. Frustum PointNets for 3D Object Detection from RGB-D Data. arXiv 2018, arXiv:1711.08488. [Google Scholar]
- Ku, J.; Mozifian, M.; Lee, J.; Harakeh, A.; Waslander, S. Joint 3D Proposal Generation and Object Detection from View Aggregation. In Proceedings of the 2018 IEEE/RSJ International Conference on Intelligent Robots and Systems (IROS), Madrid, Spain, 1–5 October 2018. [Google Scholar]
- Li, Y.; Duthon, P.; Colomb, M.; Ibanez-Guzman, J. What happens to a ToF LiDAR in fog? arXiv 2020, arXiv:2003.06660. [Google Scholar] [CrossRef]
- Bijelic, M.; Gruber, T.; Ritter, W. A Benchmark for Lidar Sensors in Fog: Is Detection Breaking Down? In Proceedings of the 2018 IEEE Intelligent Vehicles Symposium (IV), Changshu, China, 26–30 June 2018; pp. 760–767. [Google Scholar] [CrossRef]
- Qian, K.; Zhu, S.; Zhang, X.; Li, L.E. Robust Multimodal Vehicle Detection in Foggy Weather Using Complementary Lidar and Radar Signals. In Proceedings of the 2021 IEEE/CVF Conference on Computer Vision and Pattern Recognition (CVPR), Nashville, TN, USA, 20–25 June 2021; pp. 444–453. [Google Scholar] [CrossRef]
- Barnes, D.; Gadd, M.; Murcutt, P.; Newman, P.; Posner, I. The Oxford Radar RobotCar Dataset: A Radar Extension to the Oxford RobotCar Dataset. In Proceedings of the 2020 IEEE International Conference on Robotics and Automation (ICRA), Paris, France, 31 May–31 August 2020; pp. 6433–6438. [Google Scholar] [CrossRef]
- Ziegler, J.; Bender, P.; Schreiber, M.; Lategahn, H.; Strauss, T.; Stiller, C.; Dang, T.; Franke, U.; Appenrodt, N.; Keller, C.G.; et al. Making Bertha Drive—An Autonomous Journey on a Historic Route. IEEE Intell. Transp. Syst. Mag. 2014, 6, 8–20. [Google Scholar] [CrossRef]
- Golovachev, Y.; Etinger, A.; Pinhasi, G.; Pinhasi, Y. Millimeter Wave High Resolution Radar Accuracy in Fog Conditions—Theory and Experimental Verification. Sensors 2018, 18, 2148. [Google Scholar] [CrossRef] [PubMed]
- Vaswani, A.; Shazeer, N.; Parmar, N.; Uszkoreit, J.; Jones, L.; Gomez, A.N.; Kaiser, L.; Polosukhin, I. Attention Is All You Need. arXiv 2023, arXiv:1706.03762. [Google Scholar]
- Group, S.M. What Is Best for Autonomous Cars: LiDAR vs. Radar vs. Cameras. 2020. Available online: https://www.techbriefs.com/component/content/article/37699-what-s-best-for-autonomous-cars-lidar-vs-radar-vs-cameras (accessed on 19 February 2024).
- Lang, A.H.; Vora, S.; Caesar, H.; Zhou, L.; Yang, J.; Beijbom, O. PointPillars: Fast Encoders for Object Detection from Point Clouds. arXiv 2019, arXiv:1812.05784. [Google Scholar]
- Liang, M.; Yang, B.; Wang, S.; Urtasun, R. Deep Continuous Fusion for Multi-Sensor 3D Object Detection. arXiv 2020, arXiv:2012.10992. [Google Scholar]
- Kuang, H.; Liu, X.; Zhang, J.; Fang, Z. Multi-Modality Cascaded Fusion Technology for Autonomous Driving. In Proceedings of the 2020 4th International Conference on Robotics and Automation Sciences (ICRAS), Wuhan, China, 12–14 June 2020. [Google Scholar]
- Powers, D.M.W. Evaluation: From precision, recall and F-measure to ROC, informedness, markedness and correlation. arXiv 2020, arXiv:2010.16061. [Google Scholar]
- Rezatofighi, H.; Tsoi, N.; Gwak, J.; Sadeghian, A.; Reid, I.; Savarese, S. Generalized Intersection over Union: A Metric and A Loss for Bounding Box Regression. In Proceedings of the IEEE/CVF Conference on Computer Vision and Pattern Recognition (CVPR), Long Beach, CA, USA, 15–20 June 2019. [Google Scholar]
- Rosebrock, A. Intersection over Union (IoU) for Object Detection. 2016. Available online: https://pyimagesearch.com/2016/11/07/intersection-over-union-iou-for-object-detection/ (accessed on 19 February 2024).
- Charles, R.Q.; Su, H.; Kaichun, M.; Guibas, L.J. PointNet: Deep Learning on Point Sets for 3D Classification and Segmentation. In Proceedings of the 2017 IEEE Conference on Computer Vision and Pattern Recognition (CVPR), Honolulu, HI, USA, 21–26 July 2017; pp. 77–85. [Google Scholar] [CrossRef]
- Qi, C.R.; Yi, L.; Su, H.; Guibas, L.J. PointNet++: Deep Hierarchical Feature Learning on Point Sets in a Metric Space. In Advances in Neural Information Processing Systems; Guyon, I., Luxburg, U.V., Bengio, S., Wallach, H., Fergus, R., Vishwanathan, S., Garnett, R., Eds.; Curran Associates, Inc.: Red Hook, NY, USA, 2017; Volume 30. [Google Scholar]
- Yan, Y.; Mao, Y.; Li, B. SECOND: Sparsely Embedded Convolutional Detection. Sensors 2018, 18, 3337. [Google Scholar] [CrossRef] [PubMed]
- Shi, S.; Wang, X.; Li, H. PointRCNN: 3D Object Proposal Generation and Detection from Point Cloud. In Proceedings of the IEEE/CVF Conference on Computer Vision and Pattern Recognition (CVPR), Long Beach, CA, USA, 15–20 June 2019. [Google Scholar]
- Simon, M.; Milz, S.; Amende, K.; Gross, H.M. Complex-YOLO: Real-time 3D Object Detection on Point Clouds. arXiv 2018, arXiv:1803.06199. [Google Scholar]
- Zhou, Y.; Tuzel, O. VoxelNet: End-to-End Learning for Point Cloud Based 3D Object Detection. In Proceedings of the 2018 IEEE/CVF Conference on Computer Vision and Pattern Recognition, Salt Lake City, UT, USA, 18–23 June 2018; pp. 4490–4499. [Google Scholar] [CrossRef]
- Yang, B.; Luo, W.; Urtasun, R. PIXOR: Real-time 3D Object Detection from Point Clouds. In Proceedings of the 2018 IEEE/CVF Conference on Computer Vision and Pattern Recognition, Salt Lake City, UT, USA, 18–23 June 2018; pp. 7652–7660. [Google Scholar] [CrossRef]
- Rakotosaona, M.; La Barbera, V.; Guerrero, P.; Mitra, N.J.; Ovsjanikov, M. PointCleanNet: Learning to Denoise and Remove Outliers from Dense Point Clouds. Comput. Graph. Forum 2020, 39, 185–203. [Google Scholar] [CrossRef]
- Casajus, P.H.; Ritschel, T.; Ropinski, T. Total Denoising: Unsupervised Learning of 3D Point Cloud Cleaning. In Proceedings of the 2019 IEEE/CVF International Conference on Computer Vision (ICCV), Seoul, Republic of Korea, 27 October–2 November 2019; pp. 52–60. [Google Scholar] [CrossRef]
- Shen, J.; Cheung, S.C.S. Layer Depth Denoising and Completion for Structured-Light RGB-D Cameras. In Proceedings of the 2013 IEEE Conference on Computer Vision and Pattern Recognition, Portland, OR, USA, 23–28 June 2013; pp. 1187–1194. [Google Scholar] [CrossRef]
- Heinzler, R.; Piewak, F.; Schindler, P.; Stork, W. CNN-Based Lidar Point Cloud De-Noising in Adverse Weather. IEEE Robot. Autom. Lett. 2020, 5, 2514–2521. [Google Scholar] [CrossRef]
- Yang, B.; Guo, R.; Liang, M.; Casas, S.; Urtasun, R. RadarNet: Exploiting Radar for Robust Perception of Dynamic Objects. arXiv 2020, arXiv:2007.14366. [Google Scholar]
- Shah, M.; Huang, Z.; Laddha, A.; Langford, M.; Barber, B.; Zhang, S.; Vallespi-Gonzalez, C.; Urtasun, R. LiRaNet: End-to-End Trajectory Prediction using Spatio-Temporal Radar Fusion. arXiv 2020, arXiv:2010.00731. [Google Scholar]
- Xu, D.; Anguelov, D.; Jain, A. PointFusion: Deep Sensor Fusion for 3D Bounding Box Estimation. In Proceedings of the 2018 IEEE/CVF Conference on Computer Vision and Pattern Recognition, Salt Lake City, UT, USA, 18–23 June 2018; pp. 244–253. [Google Scholar] [CrossRef]
- Dosovitskiy, A.; Beyer, L.; Kolesnikov, A.; Weissenborn, D.; Zhai, X.; Unterthiner, T.; Dehghani, M.; Minderer, M.; Heigold, G.; Gelly, S. An Image is Worth 16x16 Words: Transformers for Image Recognition at Scale. arXiv 2020, arXiv:2010.11929. [Google Scholar]
- Konstantinidis, D.; Papastratis, I.; Dimitropoulos, K.; Daras, P. Multi-Manifold Attention for Vision Transformers. IEEE Access 2023, 11, 123433–123444. [Google Scholar] [CrossRef]
- Shahian Jahromi, B.; Tulabandhula, T.; Cetin, S. Real-Time Hybrid Multi-Sensor Fusion Framework for Perception in Autonomous Vehicles. Sensors 2019, 19, 4357. [Google Scholar] [CrossRef] [PubMed]


Disclaimer/Publisher’s Note: The statements, opinions and data contained in all publications are solely those of the individual author(s) and contributor(s) and not of MDPI and/or the editor(s). MDPI and/or the editor(s) disclaim responsibility for any injury to people or property resulting from any ideas, methods, instructions or products referred to in the content. |
© 2024 by the authors. Licensee MDPI, Basel, Switzerland. This article is an open access article distributed under the terms and conditions of the Creative Commons Attribution (CC BY) license (https://creativecommons.org/licenses/by/4.0/).