Article

An Interfacial Study of Sucrose Ester-Stabilized Water-Free Foams

by
Wael Kaade
1,
Lucille Drouet
1,
Capucine Dousset
1,
Richard Daniellou
1,2,* and
Delphine Huc-Mathis
3,*
1
Chair of Cosmetology, AgroParisTech, 10 Rue Léonard de Vinci, 45100 Orléans, France
2
INRAE, AgroParisTech, UMR Micalis, Université Paris-Saclay, 78350 Jouy-en-Josas, France
3
INRAE, AgroParisTech, UMR SayFood, Université Paris-Saclay, 91120 Palaiseau, France
*
Authors to whom correspondence should be addressed.
Cosmetics 2025, 12(1), 15; https://doi.org/10.3390/cosmetics12010015
Submission received: 18 October 2024 / Revised: 18 December 2024 / Accepted: 15 January 2025 / Published: 21 January 2025

Abstract

:
Sucrose esters are biodegradable surfactants widely used in the food and cosmetic industries due to their vast range of hydrophilic to lipophilic balance (HLB) values. However, their application has mostly been reported in aqueous media. With the rising demand for water-free products, a gap in the literature exists with regards to water-free colloids stabilized by sucrose esters. In particular, only two articles exist on sucrose ester-stabilized water-free foams, or oleofoams. This article explores for the first time the effects of sucrose ester HLB value on the physical properties of foams. The effects of oil triglyceride content on foamability were studied. The results showed that higher temperatures (90–100 °C) were needed to solubilize more hydrophilic sucrose esters, and these rendered the most encapsulated air (up to 62%) due to their high monoester content (>50%). Surface tension results also showed that the more hydrophilic sucrose esters reduced the oil/air surface tension the most. Regarding the oil triglyceride profile, results showed that with longer fatty acid chains, more air was incorporated into the foam. Sucrose esters have important untapped potential for use in the formation and stabilization of water-free foams.

1. Introduction

Sucrose esters (SE) are invaluable non-ionic surface-active emulsifiers and stabilizers highly utilized in food and personal care products. They are mostly used in dispersed systems that contain water [1]. In the food industry, sucrose esters find widespread use in applications ranging from baked goods to confectionery items and beverages, where they contribute to the improvement of texture, shelf-life extension, and overall product quality [2,3]. In the cosmetics industry, sucrose esters stabilize emulsions and enhance the sensory properties of creams, lotions, and other topical formulations. Furthermore, their biodegradable nature and favorable toxicological profile align with the growing consumer demand for environmentally friendly and safe ingredients [4].
Sucrose esters are derived from the esterification of sucrose (hydrophilic head) with fatty acids (lipophilic tail) [5]. A sucrose molecule with one esterified fatty acid chain results in a sucrose monoester. Sucrose esters with low concentrations of monoester are hydrophilic surfactants with high hydrophilic–lipophilic balance (HLB) values. Because a sucrose molecule has eight hydroxyl groups, further esterification reactions are possible to produce sucrose di-, tri-, tera-, penta-, and polyesters [6]. The greater the number of fatty acid chains on a sucrose molecule, the more lipophilic it becomes, until it loses its surface-active properties. Consequently, it is possible to obtain a library of sucrose esters with HLB values ranging between 0 and 18, suitable for studying the stabilization of oil-in-water and water-in-oil emulsions.
Sucrose esters (SEs) are also known for their foaming properties [2], especially in aerated food emulsions. Previous articles have studied the foaming properties of sucrose esters in water-free systems [7]. These systems are called oil foams or oleofoams. These versatile substances are formed through the incorporation of air into a continuous phase of liquid fat or oil, resulting in a stable foam structure. Oleofoams find diverse applications across various industries, including food, pharmaceuticals, and cosmetics, owing to their exceptional emulsifying and stabilizing properties [8]. The literature reports that oleofoams are produced either by cold or hot whipping. In cold whipping, oil containing a high-melting point ingredient (e.g., fatty acids [9], mono- and diglycerides [10], waxes [11]) is heated and then cooled down to create crystals. The mixture is then whipped, and the crystals arrange themselves on the oil/air interface to stabilize the air bubbles. Hot whipping, on the other hand, is when oil containing a high-melting-point ingredient (e.g., sucrose esters) is heated and whipped at a temperature above the melting point of the stabilizing ingredient. To our knowledge, only two articles have reported foams produced using hot whipping and sucrose esters. In the first of these, Liu Y. (2021) produced oleofoams stabilized by a sucrose ester with HLB 5 at 80 °C in various vegetal oils. That pioneering study described how the sucrose ester behaved like a surfactant that stabilized the incorporated air bubbles only at temperatures above its melting points. Once the foam was formed, it rapidly cooled down to rigidify the matrix and crystallize the sucrose ester present on the interface [7]. The second article was a previous work from our group, reporting the production of oleofoams using SE HLB 7 at 90 °C in a medium-chain triglyceride oil, which was a simple refined oil [12]. Analyzing these two articles, we identified gaps that are discussed in this paper.
This paper therefore aims firstly to comprehend the effects of sucrose esters’ HLB values on the foaming properties of oleofoams. This was done by correlating the physical properties of foams to rheological and surface tension measurements. Key parameters that govern the structure and stability of oleofoams, such as over-run, bubble size, and bubble size distribution were studied. Over-run, which refers to the volume of air incorporated into the foam relative to its original volume, plays a significant role in foam texture and stability [12]. The bubble size also provides insights into the foam’s mechanical properties. Additionally, understanding the distribution of bubble size is essential for controlling the foam’s consistency and optimizing its performance for specific applications. Secondly, we aim to highlight the effect of the oil triglyceride content on the physical properties of the foams.

2. Materials and Methods

2.1. Sucrose Ester/Oil Mixture Preparation

The procedure was adapted from Kaade W. et al. (2024) [12]. Briefly, SEs were dissolved in a medium-chain triglyceride (MCT) oil (BASF Personal Care and Nutrition GmbH, Germany) to form a 12.5 wt% mixture. The dissolution was carried out at different temperatures (60, 70, 80, 90, or 100 °C) and the samples were left to homogenize at that fixed temperature for 1, 5, 24, or 72 h. The list of SEs used is found in Table 1.

2.2. Sucrose Ester/Oil Characterization

2.2.1. Differential Scanning Calorimetry (DSC)

To measure the melting points of the different SEs and SE/oil mixtures (from here on abbreviated as SE/MCT), samples of 5–20 mg were loaded into aluminum pans that were then hermetically sealed. These pans were placed in a DSC device (Mettler Toledo, DSC3, Columbus, OH, USA) where they were heated from room temperature to 105 °C at a 5 °C/min rate. Constant temperature was maintained at 105 °C for 2 min and the sample was then cooled to 10 °C at 5 °C/min, with this temperature maintained for 2 min, and finally, the sample was reheated to 105 °C at 5 °C/min. The melting points were collected from this last cycle. Experiments were repeated at least three times.

2.2.2. Rheology

The 12.5 wt.% SE/MCT mixtures were prepared by heating the mixture at 100 °C for 1 h. After that, that mixture was transferred to a concentric cylinder jacket assembly on the rheometer (HR10, TA Instruments, New Castle, DE, USA). To measure the storage modulus (G’) and the loss modulus (G”) at different temperatures, an oscillation temperature ramp protocol was set starting at 100 °C and reducing to 65 °C at 0.08 °C/min. Strain was fixed at 0.01% and the frequency at 0.1 Hz. This was followed by a flow temperature ramp (from 100 to 60 °C at 0.2 °C/min cooling rate and the shear rate fixed at 1 s−1) to measure the viscosity of the mixtures.
For the experiments where MCT oil was mixed with other triglycerides (Section 2.5), mixtures of 15 wt.% (with respect to the oil phase) triglycerides in MCT oil were prepared and contained 5 wt.% (with respect to the total mixture) SE HLB 5. The storage and loss moduli were measured as described above.

2.2.3. Surface Tension

SE/MCT mixtures were prepared at a concentration of 5 wt.% SE by heating the mixture to 100 °C until it was clear and transparent (a period of less than 1 h). These mixtures were placed in a thermostated cuvette (SC30) at temperature of 100 °C. A syringe with a curved needle was filled with air and the tip of the needle was submerged in the lipidic phase so that a rising Laplacian air bubble (3.5 µL) was at the same temperature as that of the oil. The surface tension was measured using a Drop Shape Analyzer DSA30S (Krüss GmbH, Hamburg, Germany). After the surface tension was measured at 100 °C, the temperature of the thermostat was decremented to 90 °C. When the temperature had stabilized, the surface tension was measured. This procedure was repeated until the SE started crystallizing in the cuvette. Measurements were made in duplicate.

2.3. Foam Preparation

Once the mixing step was completed, the SE/MCT mixture was transferred to a thermostated beaker to be whipped (at 60, 70, 80, 90, or 100 °C) using a whisk fitted to a Heidolph homogenizer (Germany) [12]. The whipping speed was fixed at 2000 r.p.m. and the whipping time was 2 min. All foams were prepared in duplicate.

2.4. Foam Characterization

2.4.1. Over-Run

This procedure was the same as reported in Kaade W. et al. (2024) [12], where a spatula with a fixed volume of 1.5 mL was filled to the brim with the SE/MCT mixture (just before whipping), and any excess was trimmed off the spatula. After whipping, three spatulas of 2.5 mL were filled with foam and then trimmed. Both spatulas were left to cool down before weighing and calculating the over-run according to Equation (1):
O v e r r u n = F o a m   v o l u m e O i l   v o l u m e F o a m   v o l u m e × 100

2.4.2. Bubble Size and Size Distribution

Samples of the oleofoam were collected while still hot on 2 microscopy slides. Using an inverted microscope Leica DMI8 (Wetzlar, Germany) at 10× magnification, 2 photographs were taken from each slide (resulting in 4 photographs in total for each foam). These photographs were analyzed using the freeware ImageJ® (version 1.54) to calculate the Sauter mean diameter (d3,2) (Equation (2)) and the bubble size distribution (span) (Equation (3)):
d 3,2 = n i . d i 3 n i . d i 2
where ni and di are the number and diameter of bubbles, respectively, in a particular size fraction;
S p a n = d 90 d 10 d 50
where d90, d50, and d10 are the diameters corresponding to a cumulative 90, 50, and 10% of the total dispersed phase, respectively.
To be statistically significant, a minimum of 500 bubbles were analyzed for each foam.

2.4.3. Stability at 60 °C

The oil drainage from the foams was measured at 60 °C 10 min after whipping and then at 24 h. Foams were added to glass tubes and placed in a static multiple light scattering device (Turbiscan®, Formulaction, Toulouse, France). Drainage was calculated using Equation (4):
% D r a i n a g e = s a m p l e   t o t a l   h e i g h t f o a m   h e i g h t s a m p l e   t o t a l   h e i g h t × 100

2.5. Triglyceride Mixtures

To test the effect of the triglyceride content in the oil, SE/MCT mixtures were prepared using the SE with an HLB value of 5 at a concentration of 5 wt.%. The mixture was heated to 80 °C and left to homogenize for 1 h. Then, the mixture was whipped at 2000 r.p.m. for 2 min at 80 °C. The oil content varied between pure MCT oil and MCT oil mixed with tripalmitin (C16) (TCI Europe N.V.), containing saturated palmitic acid, or triolein (C18) (Indagoo Research Chemicals), containing monounsaturated oleic acid. Table 2 lists the different compositions of the lipidic phase.
Another set of foams was prepared with the same SEs and under the same conditions using vegetal oils (Table 3) instead of MCT oil.

3. Results and Discussion

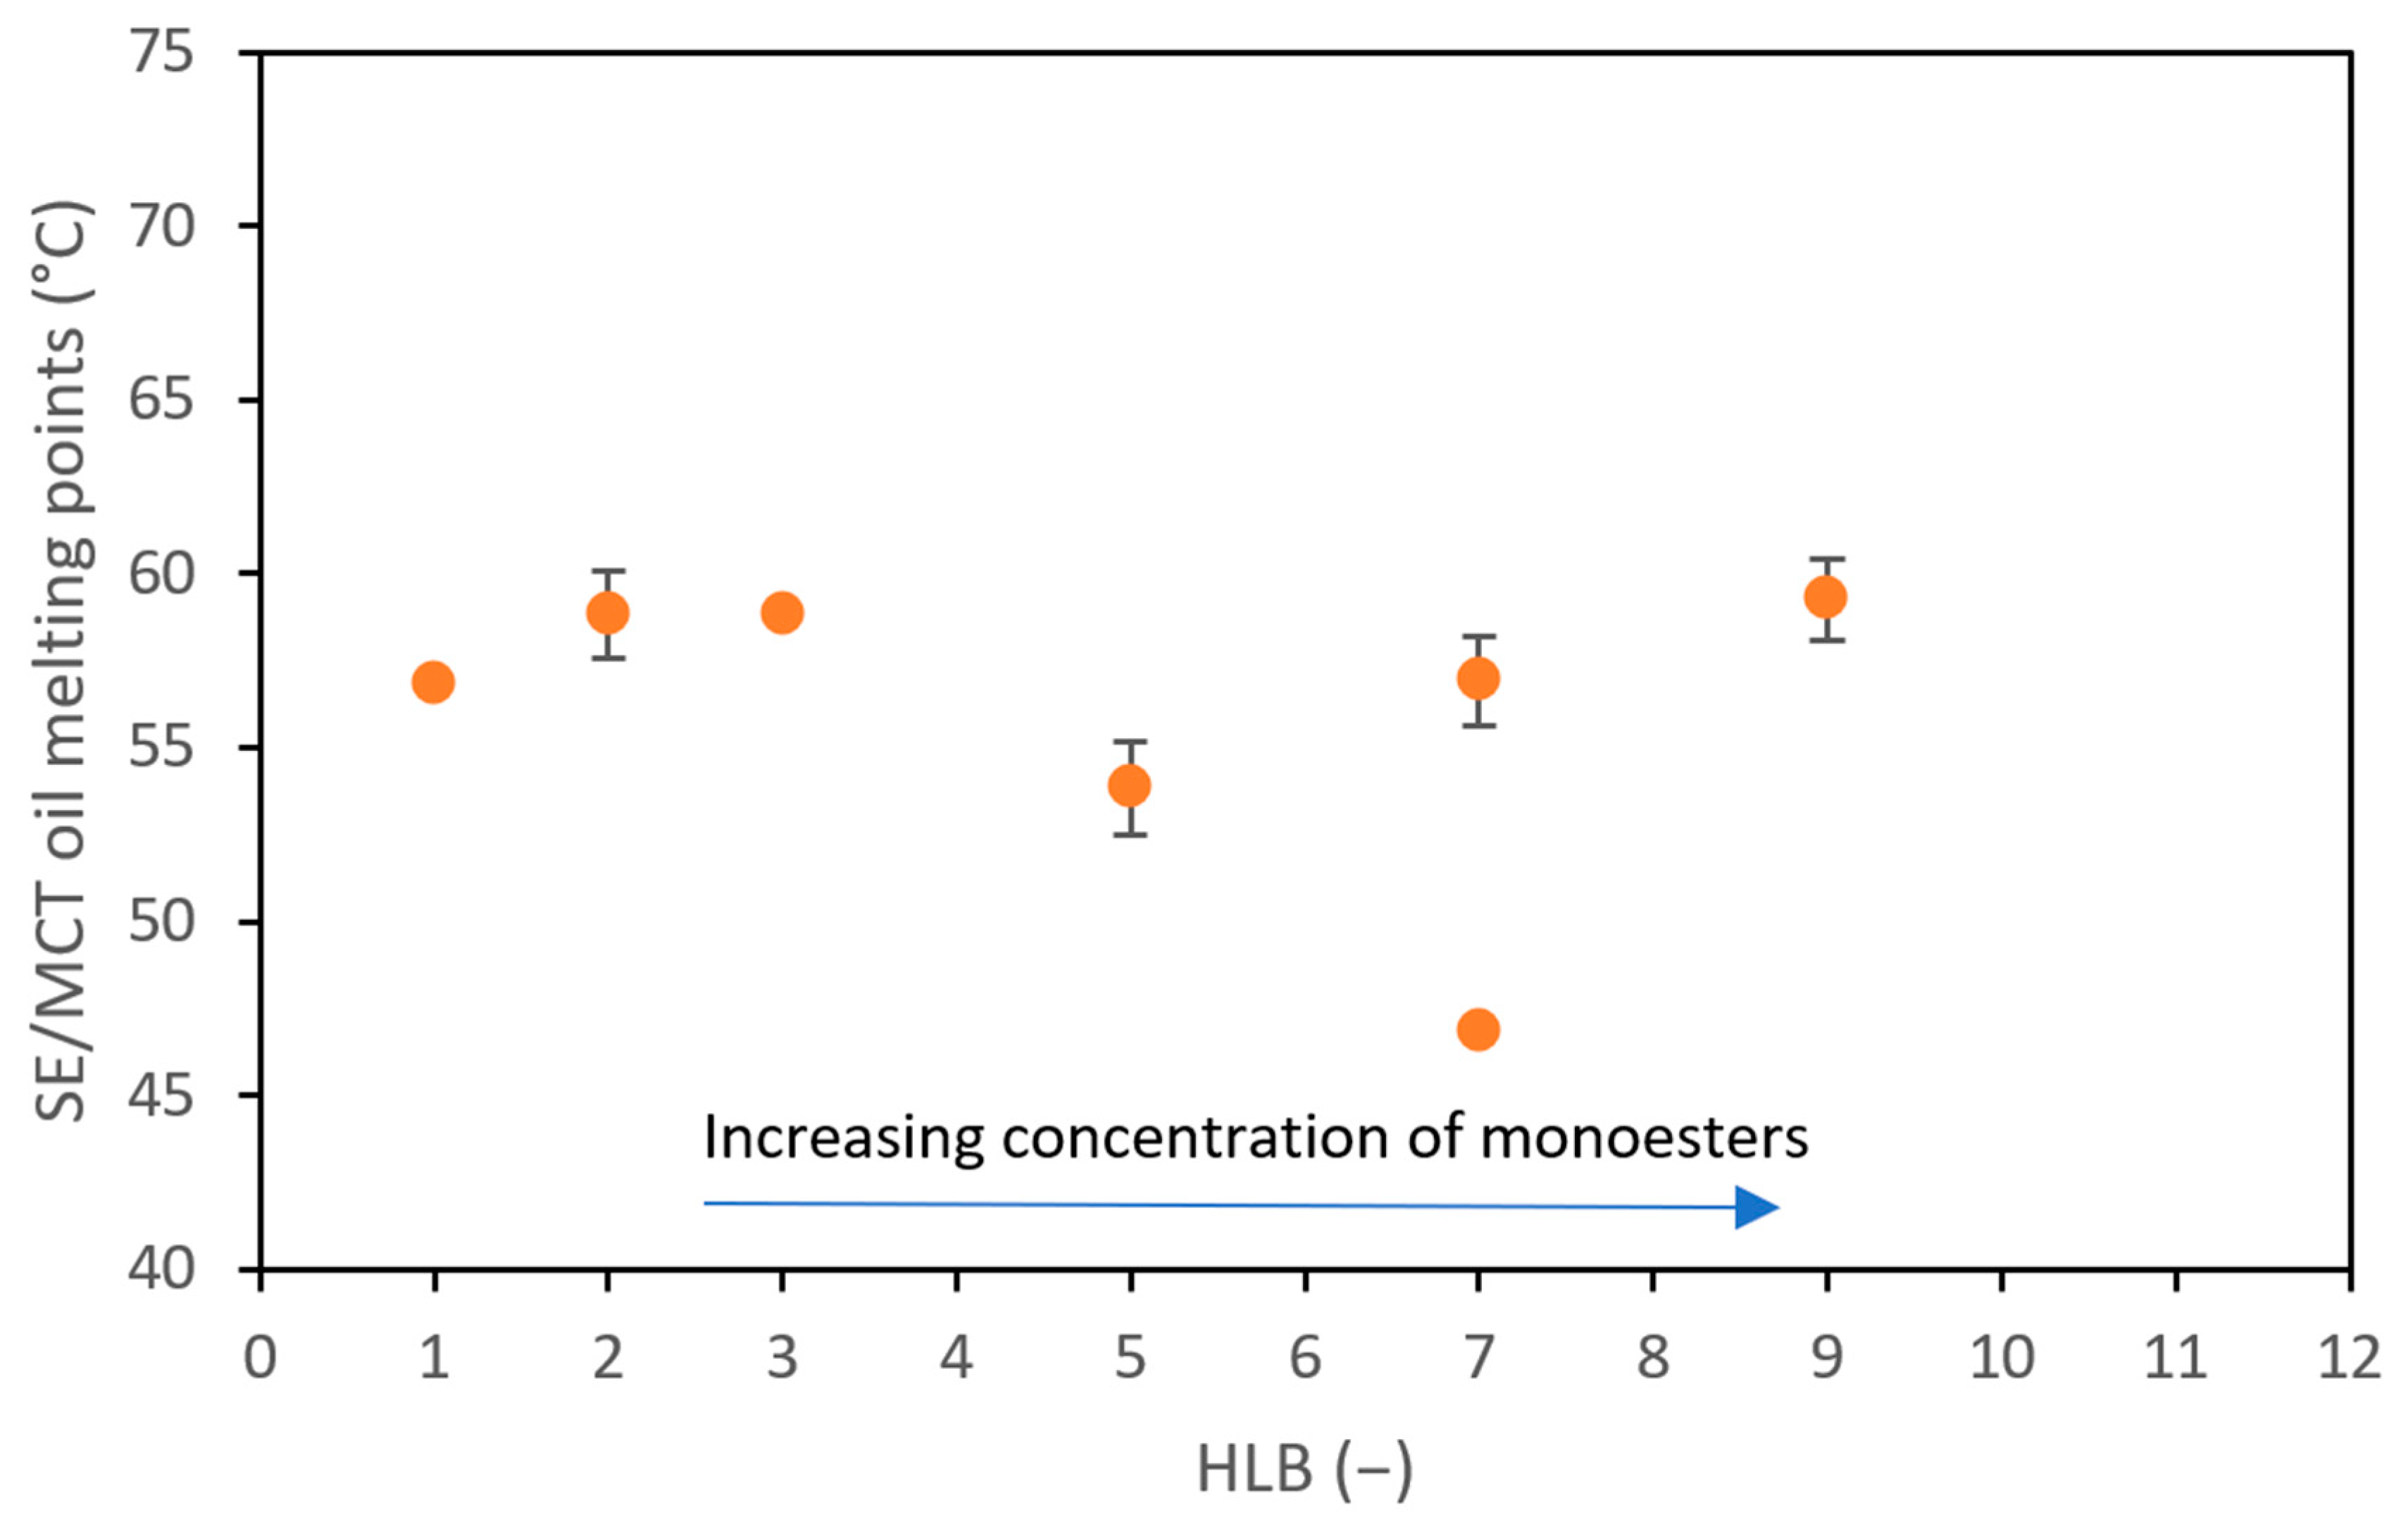
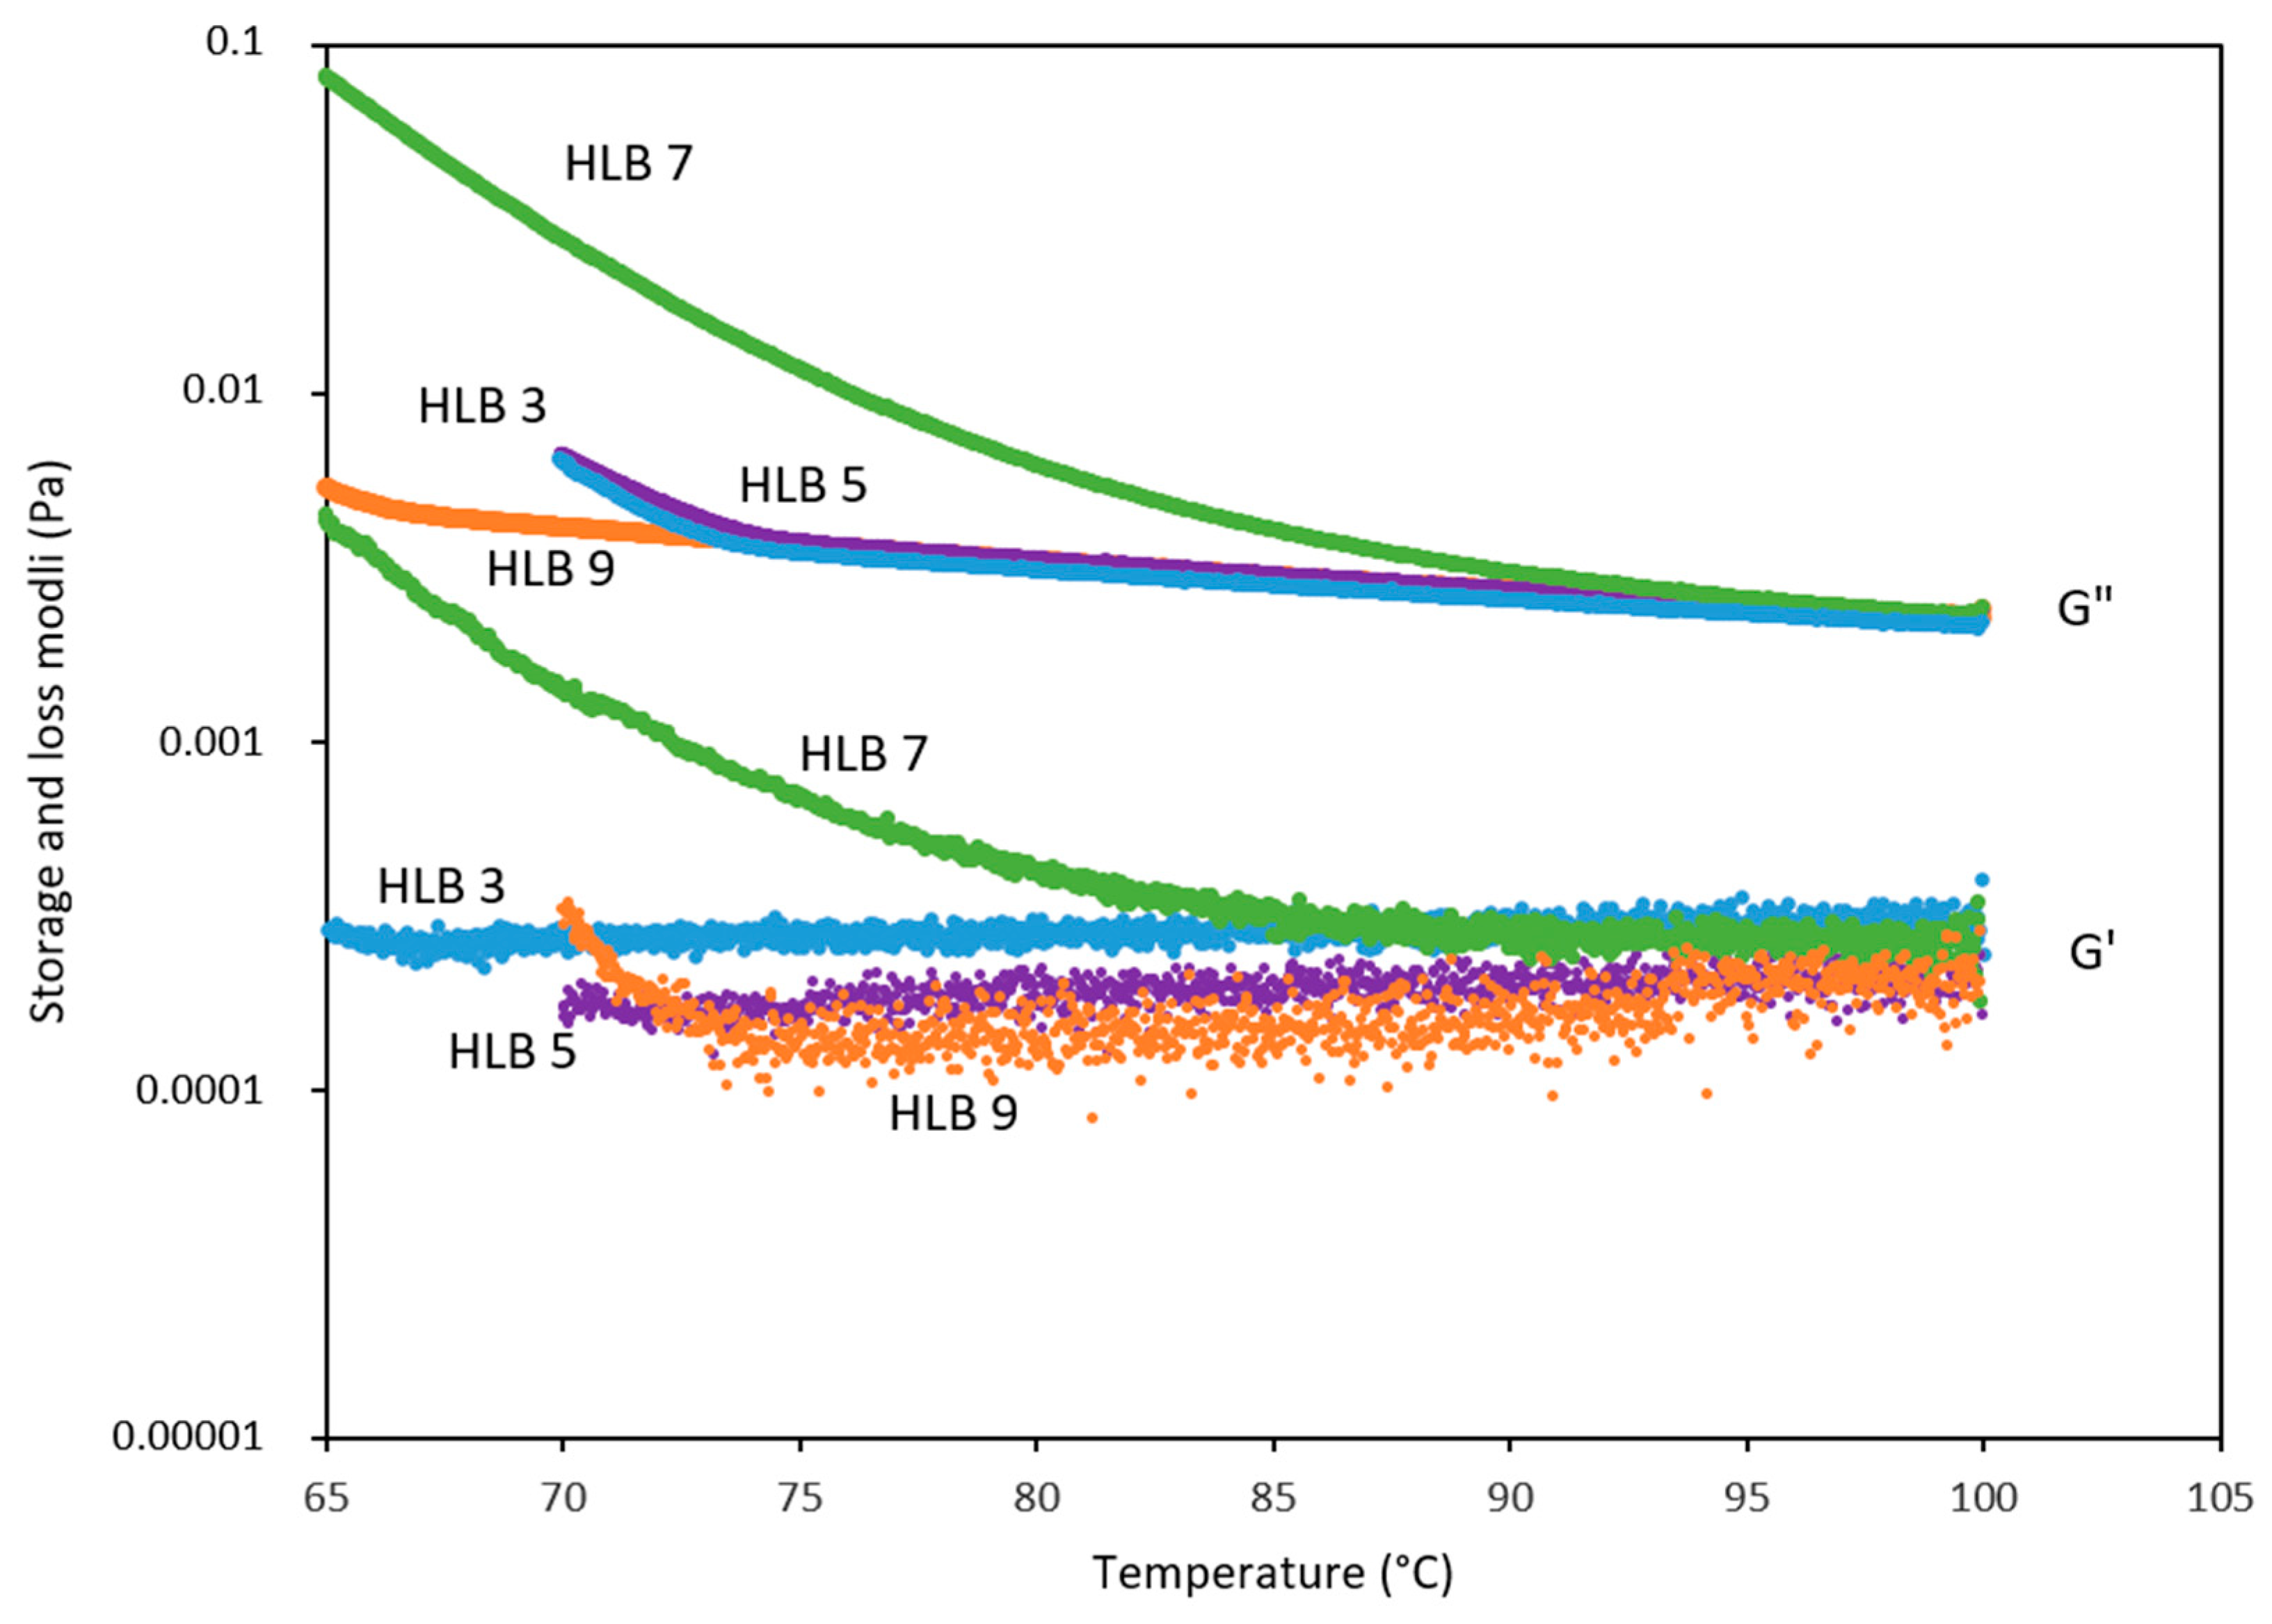
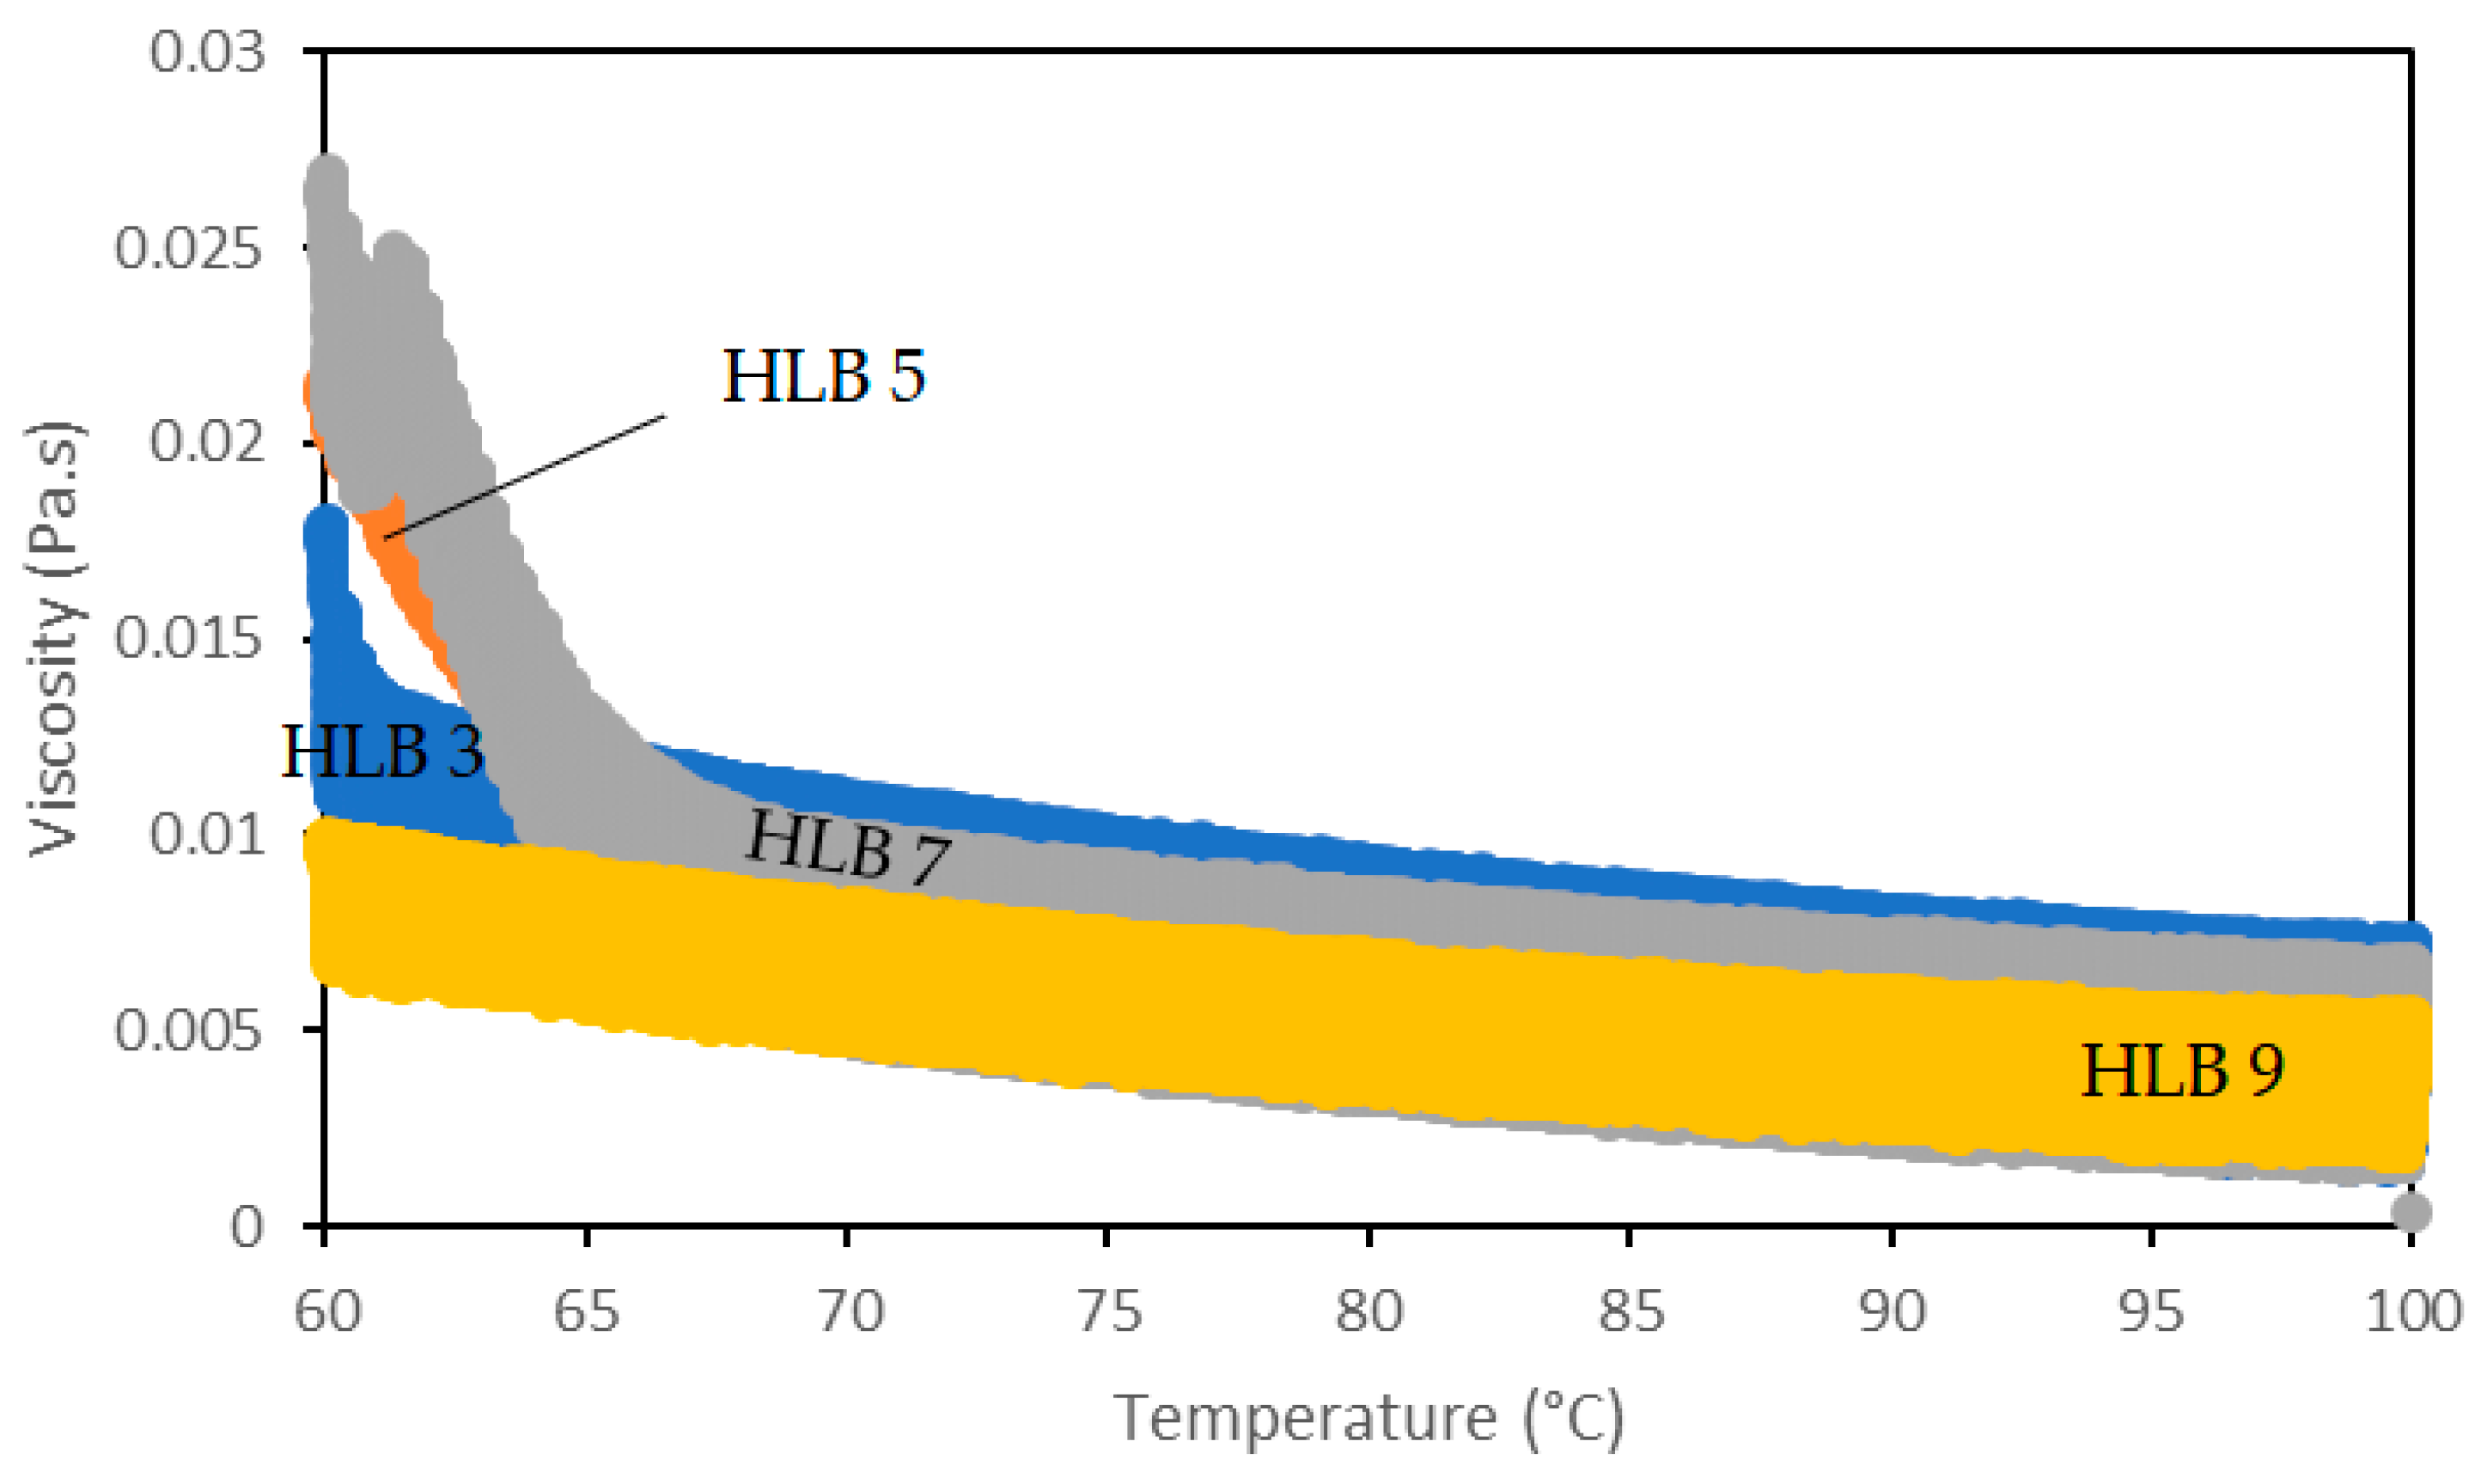
3.1. SE and SE/MCT Characterization

A prescreening test was necessary to test which SE out of the nine that were acquired would be soluble in oil when heated. All the SEs were solid at room temperature. Figure S1 shows the melting points of all the sucrose esters (thermograms in Figure S2 in the Supplementary Materials). Table S1 shows the melting points of SEs described in the literature that are very similar to those used in this paper. The results reported in Figure S1 are in good agreement with the values that appear in Table S1. Note that SEs with HLB values ranging between 5 and 9 have two melting points, most probably due to their mixed composition of not only mono-, di-, and triesters, but also of tetra- and pentaesters [6]. Low HLB values represent very few monoesters (<2%) while high HLB values indicate a majority of monoesters (>75%), resulting in the appearance of only one endothermic peak.
After mixing the SEs with MCT, all the hydrophilic SEs (HLB 11 and above) were not soluble in the oil. For that reason, Figure 1 shows the peak values of the endothermic curves of the 12.5 wt.% SE/MCT oil mixtures. With the addition of the oil, the total enthalpy diminished (Figure S3, Supplementary Materials) but in general, above 60 °C, the SE become soluble in MCT oil. From this point onwards, the SEs with HLB values 11 were eliminated since they were not soluble in the oil and were consequently unable to stabilize oleofoams [7]. Also, it was deemed probable that the SEs with HLB values of 1 and 2 had no emulsifying properties and were rather oil gelators or oil texturizers. We verified this claim in a preliminary study and indeed, these two SEs had no foaming properties. For that reason, they were also eliminated. As a result, and based on this prescreening test, the study continued with the SEs with HLB values of 3, 5, 7, and 9.
Liu Y. et al., (2021) showed that SE foaming capabilities are strongly dependent on temperature, reporting that there exists a one- and a two-phase region for an SE; in the one-phase region, the temperature is high enough to completely dissolve the SE in the oil and obtain excellent foaming properties. As the temperature decreases, the SE/MCT mixture becomes turbid and the more turbid it becomes, the less foam is obtained. Also, Kaade W. et al., (2024) reported that if the mixture is heated far above the melting point of the SE (100 °C for example), the SE also loses its foaming capabilities [12]. In that sense, there exists for every SE a temperature at which the over-run (volume of air incorporated) is at its maximum. This temperature is high enough to dissolve the SE and cross over from the two-phase to the one-phase region, while low enough not to lose the emulsifying properties of the SE. For that reason, and before producing the foams, the SE/MCT mixtures were characterized at different temperatures. The surface tension between the SE/MCT mixtures and air was measured at different temperatures (Figure 2) and the rheological properties of the mixtures (G’, G”, and viscosity) were also measured at different temperatures (Figure 3 and Figure 4).
Kaade W. et al. (2024) reported that the SE C-1807 with an HLB value of 7 had a critical micelle concentration of 1 wt.% in MCT at 90 °C [12]. For that reason, to be certain that the equilibrium surface tension was measured above the CMC point, the SE/MCT mixtures in the current study were prepared at 5 wt.% SE. As can be seen in Figure 2, the surface tension of MCT oil decreased from 26.3 to 23 mN.m−1 with the increase in temperature from 60 to 100 °C, as expected [13]. However, it is noteworthy that in the presence of SE, surface tension increased by 6% for SE HLB 3 when the temperature increased from 60 to 100 °C and also by 6% for SE HLB 5 when the temperature increased from 80 to 100 °C. The surface tension of the mixtures containing SE HLB 7 and 9 remained unchanged at 90 and 100 °C. These results are revisited in relation to the over-run results in the following section.
Regarding the rheological results (Figure 3), from 100 to around 80 °C, the SE/MCT mixtures were liquid (G′ < G″) with low values for both the storage and loss moduli (<0.1 Pa). Approaching the melting points of the SEs, G′ started increasing due to crystal formation, in line with the rheological behavior of the SE HLB 5 reported in the literature [7]. Regarding the viscosity of the mixtures, Figure 4 shows a 75% increase in viscosity when the temperature decreased from 100 to 60 °C. Most importantly, the HLB value of the SE and implicitly, the composition of the SE, had no significant effect on either the storage and loss moduli or the viscosity of the mixtures.

3.2. Foam’s Physical Properties Characterization

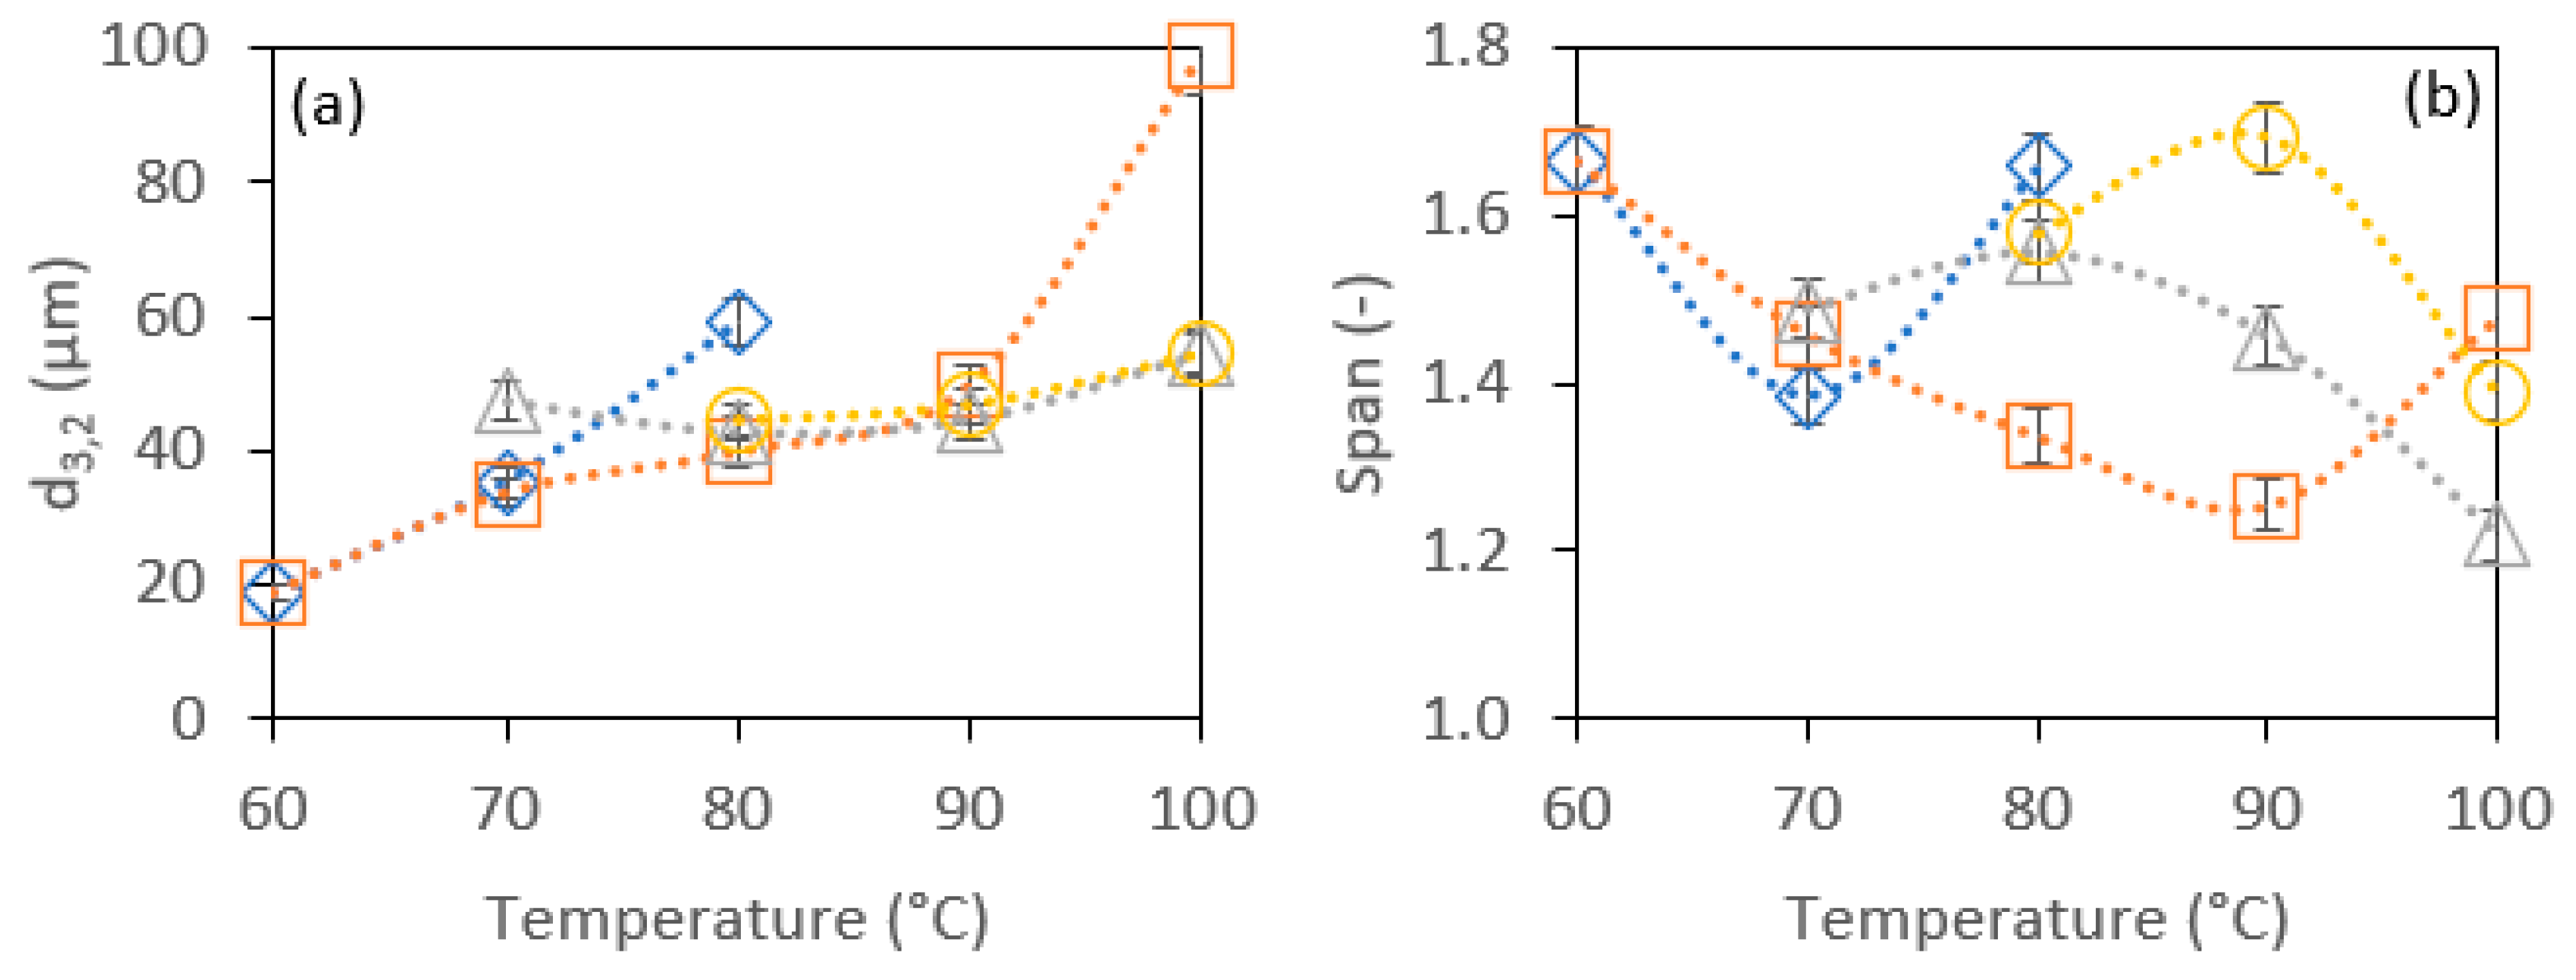
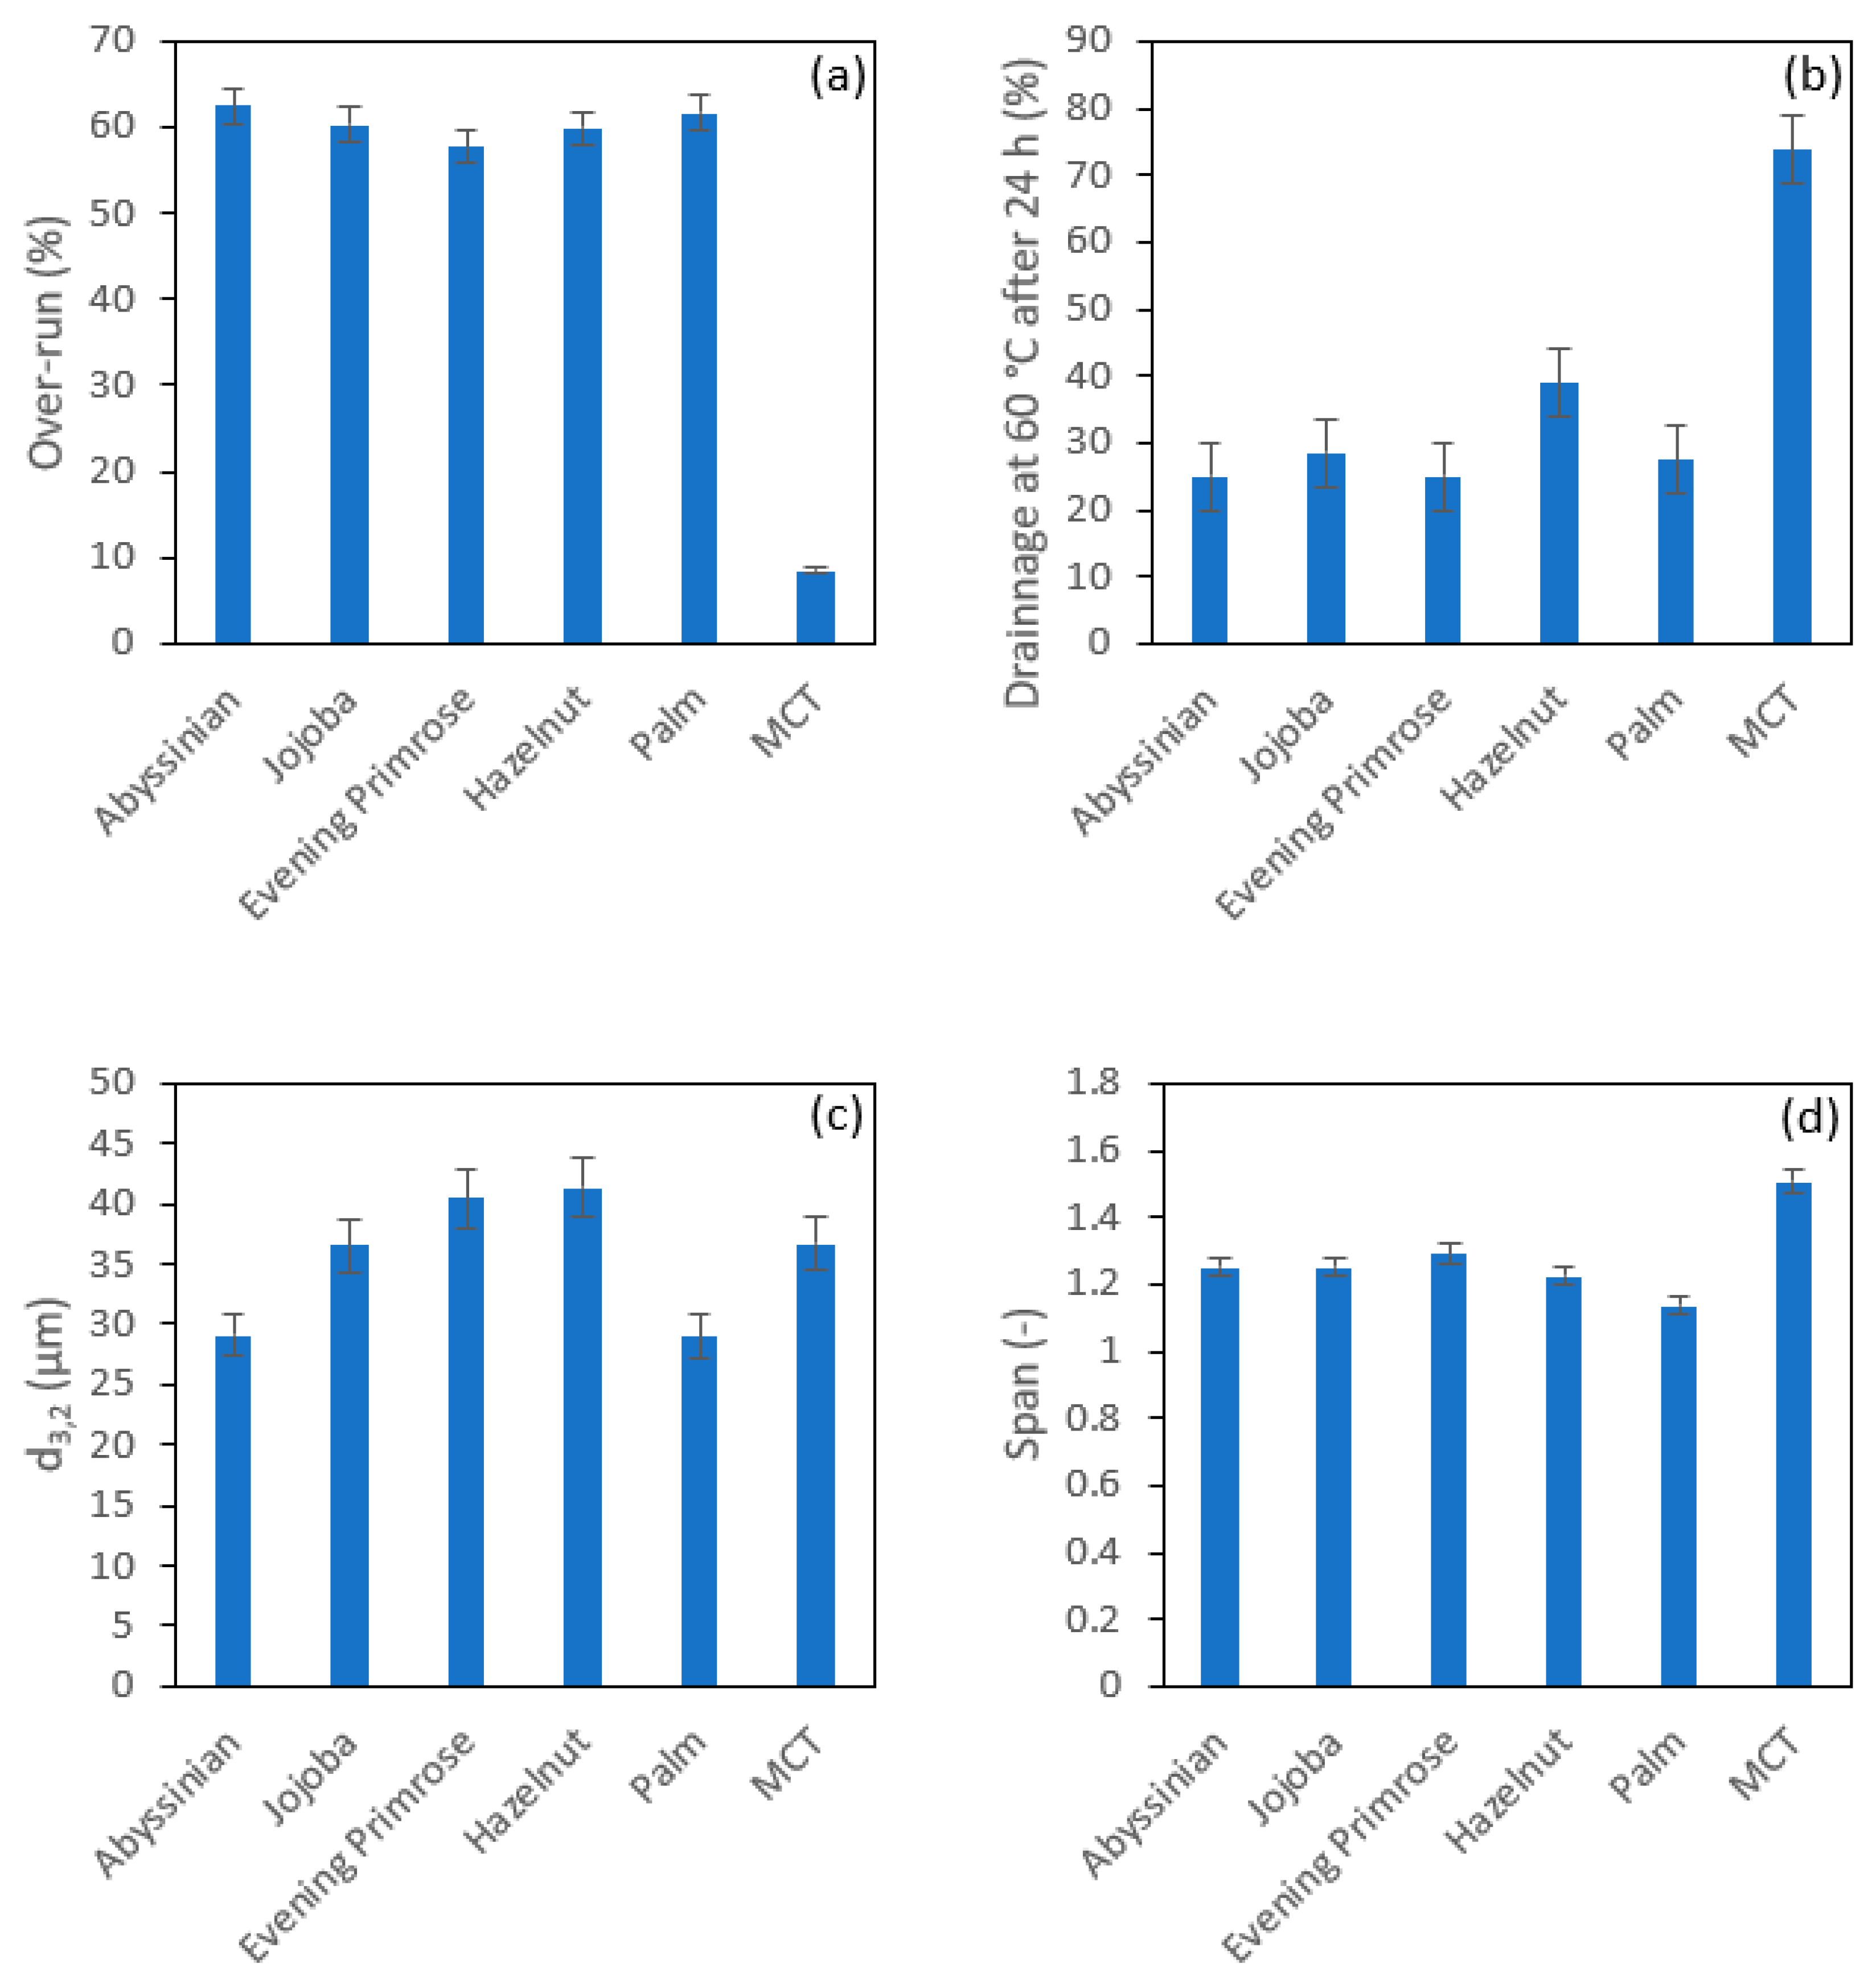
3.2.1. Effect of SE HLB Values and Whipping Temperature on the Foams’ Physical Properties

Foams were produced at five different temperatures (60, 70, 80, 90, and 100 °C) with four different mixing times (1, 5, 24, 72 h) using four different SEs (HLB 3, 5, 7, and 9), comprising 80 different conditions in total. The over-run of the foams was measured immediately after whipping, after which the oil drainage was measured at 60 °C for the next 24 h. At this temperature, the foams were still mobile and able to evolve, while at room temperature, oleofoams remain stable for months [14].
Table S2 (Supplementary Materials) reports the state of the SE/MCT mixtures just before they were whipped. Some mixtures were one-phased (clear with all the SE dissolved) and others remained two-phased. The red squares containing X marks signify that it was not possible to obtain a foam, since these were in the two-phase region. Green squares with X marks also mean that no foam was obtained; however, in this case, these were in the one-phase region. This occurred because the SEs lost its emulsifying properties when exposed to a high temperature for a prolonged period. The graphs of the maximum over-run values obtained with each SE at each temperature and the respective drainage after 24 h for all the foams are shown in Figure 5. These points are represented by the squares with an M marking in Table S2. The over-run results from all the points are presented in Figure S4 in the Supplementary Materials.
As shown in Figure 5a, the foams stabilized with SE HLB 3 gave a maximum over-run of 37% at 60 °C. Increasing the whipping temperature caused the over-run to decrease to 0% at 90 °C and higher. Figure 2 shows that the surface tension was highest at 100 °C (23.7 mN/m) for the SE/MCT with HLB 3 and decreased to 22.3 mN/m at 60 °C. Although according to the Young–Laplace equation, a decrease in surface tension reduces the Laplace pressure [15], allowing the increase of the volume fraction of the dispersed phase the decrease in this case was very small. Thus, an underlying chemical explanation is needed. For the case of the SE/MCT with HLB 5, increasing the temperature from 60 to 80 °C increased the over-run, since this SE was less soluble in oil than SE HLB 3 at 60 °C and it thus required higher energy to completely dissolve it. At 80 °C the highest over-run of 56% was obtained for SE HLB 5. Increasing the temperature further drastically reduced the over-run, similarly to what was observed with SE HLB 3. Similar behavior was observed for the SEs with HLB 7 and 9, where the more monoesters were present in the SEs, the higher the temperature that was needed to dissolve the SE, and any prolonged heating after dissolution drastically reduced the over-run.
The hypothesis presented to explain this phenomenon is that at high temperatures, the excess energy temporarily inactivates the surface properties of the SE. Liu Y et al. (2021) proved by FTIR measurements that intermolecular H bonds formed between the hydroxyl group of the SE and the carbonyl groups in the oil triglycerides. In a previous study, we also proved that in an oil with no triglycerides (ex: hexadecane), SEs were not effective for producing foams. Consequently, we hypothesize that at high temperatures, the excess energy breaks these intermolecular H bonds, rending it impossible to stabilize the air bubbles. Figure 6 shows a schematic representation of this hypothesis.
To go further in proving this, a SE/MCT mixture using SE HLB 5 was mixed at 100 °C for 1 h. Had this mixture been whipped at 100 °C, the over-run obtained would have been 6% (Figure 5a). However, after the hour of mixing was over, the temperature of the mixture was brought down to 80 °C and it was then whipped at 80 °C. The over-run obtained after 2 min of whipping at 2000 r.p.m. was 55%. After the 2 min of whipping was up and after collecting a sample for measuring the over-run, the whipping was continued while the temperature was increased to 100 °C. A few seconds after reaching the temperature of 100 °C, the foam collapsed and only the SE/MCT mixture remained. Note that cooling and heating the mixture between 80 and 100 °C did not cause any rheological changes (Figure 3 and Figure 4) since the conditions were well above the melting point of the SE. This proves the phenomenon of thermo-reversibility, where the H bonds are formed at 80 °C, broken at 100 °C, and then reformed at 80 °C. Of course, it should be mentioned that leaving the SE/MCT mixture at 100 °C for longer than 72 h causes the decomposition or degradation of the SE, which is visible when the mixture passes from completely transparent to having a white deposit at the bottom. This phenomenon is not reversible, of course.
In addition, when the over-run values were plotted versus the interfacial tension values reported in Figure 2, a linear relationship was obtained (Figure S5). It was observed that the most hydrophilic SE was responsible for the highest over-run values (62% with SE HLB 9). However, the very small difference in surface tension (Δ surface tension = 1.7 mN.m−1) could indicate that interfacial rheology might better explain the effect of temperature on the nature of the oil/air interface. However, this remains out of the scope of this article.
Regarding the stability of the foams, Figure 5b shows the percentage of oil drainage measured after storing the foams at 60 °C for 24 h. A graph with the drainage values only 10 min after whipping is shown in Figure S6 in the Supplementary Materials. Figure 5b is a mirror image of Figure 5a, in that the foam with the highest over-run was the most stable at 60 °C under this stability test. We showed in a previous study [12] that at room temperature, the foams remained stable for at least 5 months. For that reason, stability testing at a higher temperature might be indicative of the stability of the foam for a much longer time.
The Sauter mean diameter and the bubble size of the foams whose over-run values are shown in Figure 5a are presented in Figure 7a,b, revealing that the bubbles obtained at the lowest whipping temperature (60 °C) were three times smaller than those produced at 100 °C (Figure 7a, Figure 8 and Figure S7). This was as expected, since SE crystallization had already started at 60 °C and the viscosity was four times higher than at 100 °C (Figure 4). A higher viscosity of the continuous phase resulted in a lower bubble size in the dispersed phase [16]. Regarding the distribution of bubble size (span), all of the foams were polydispersed with span values above 1 (Figure 7b and Figure 8).

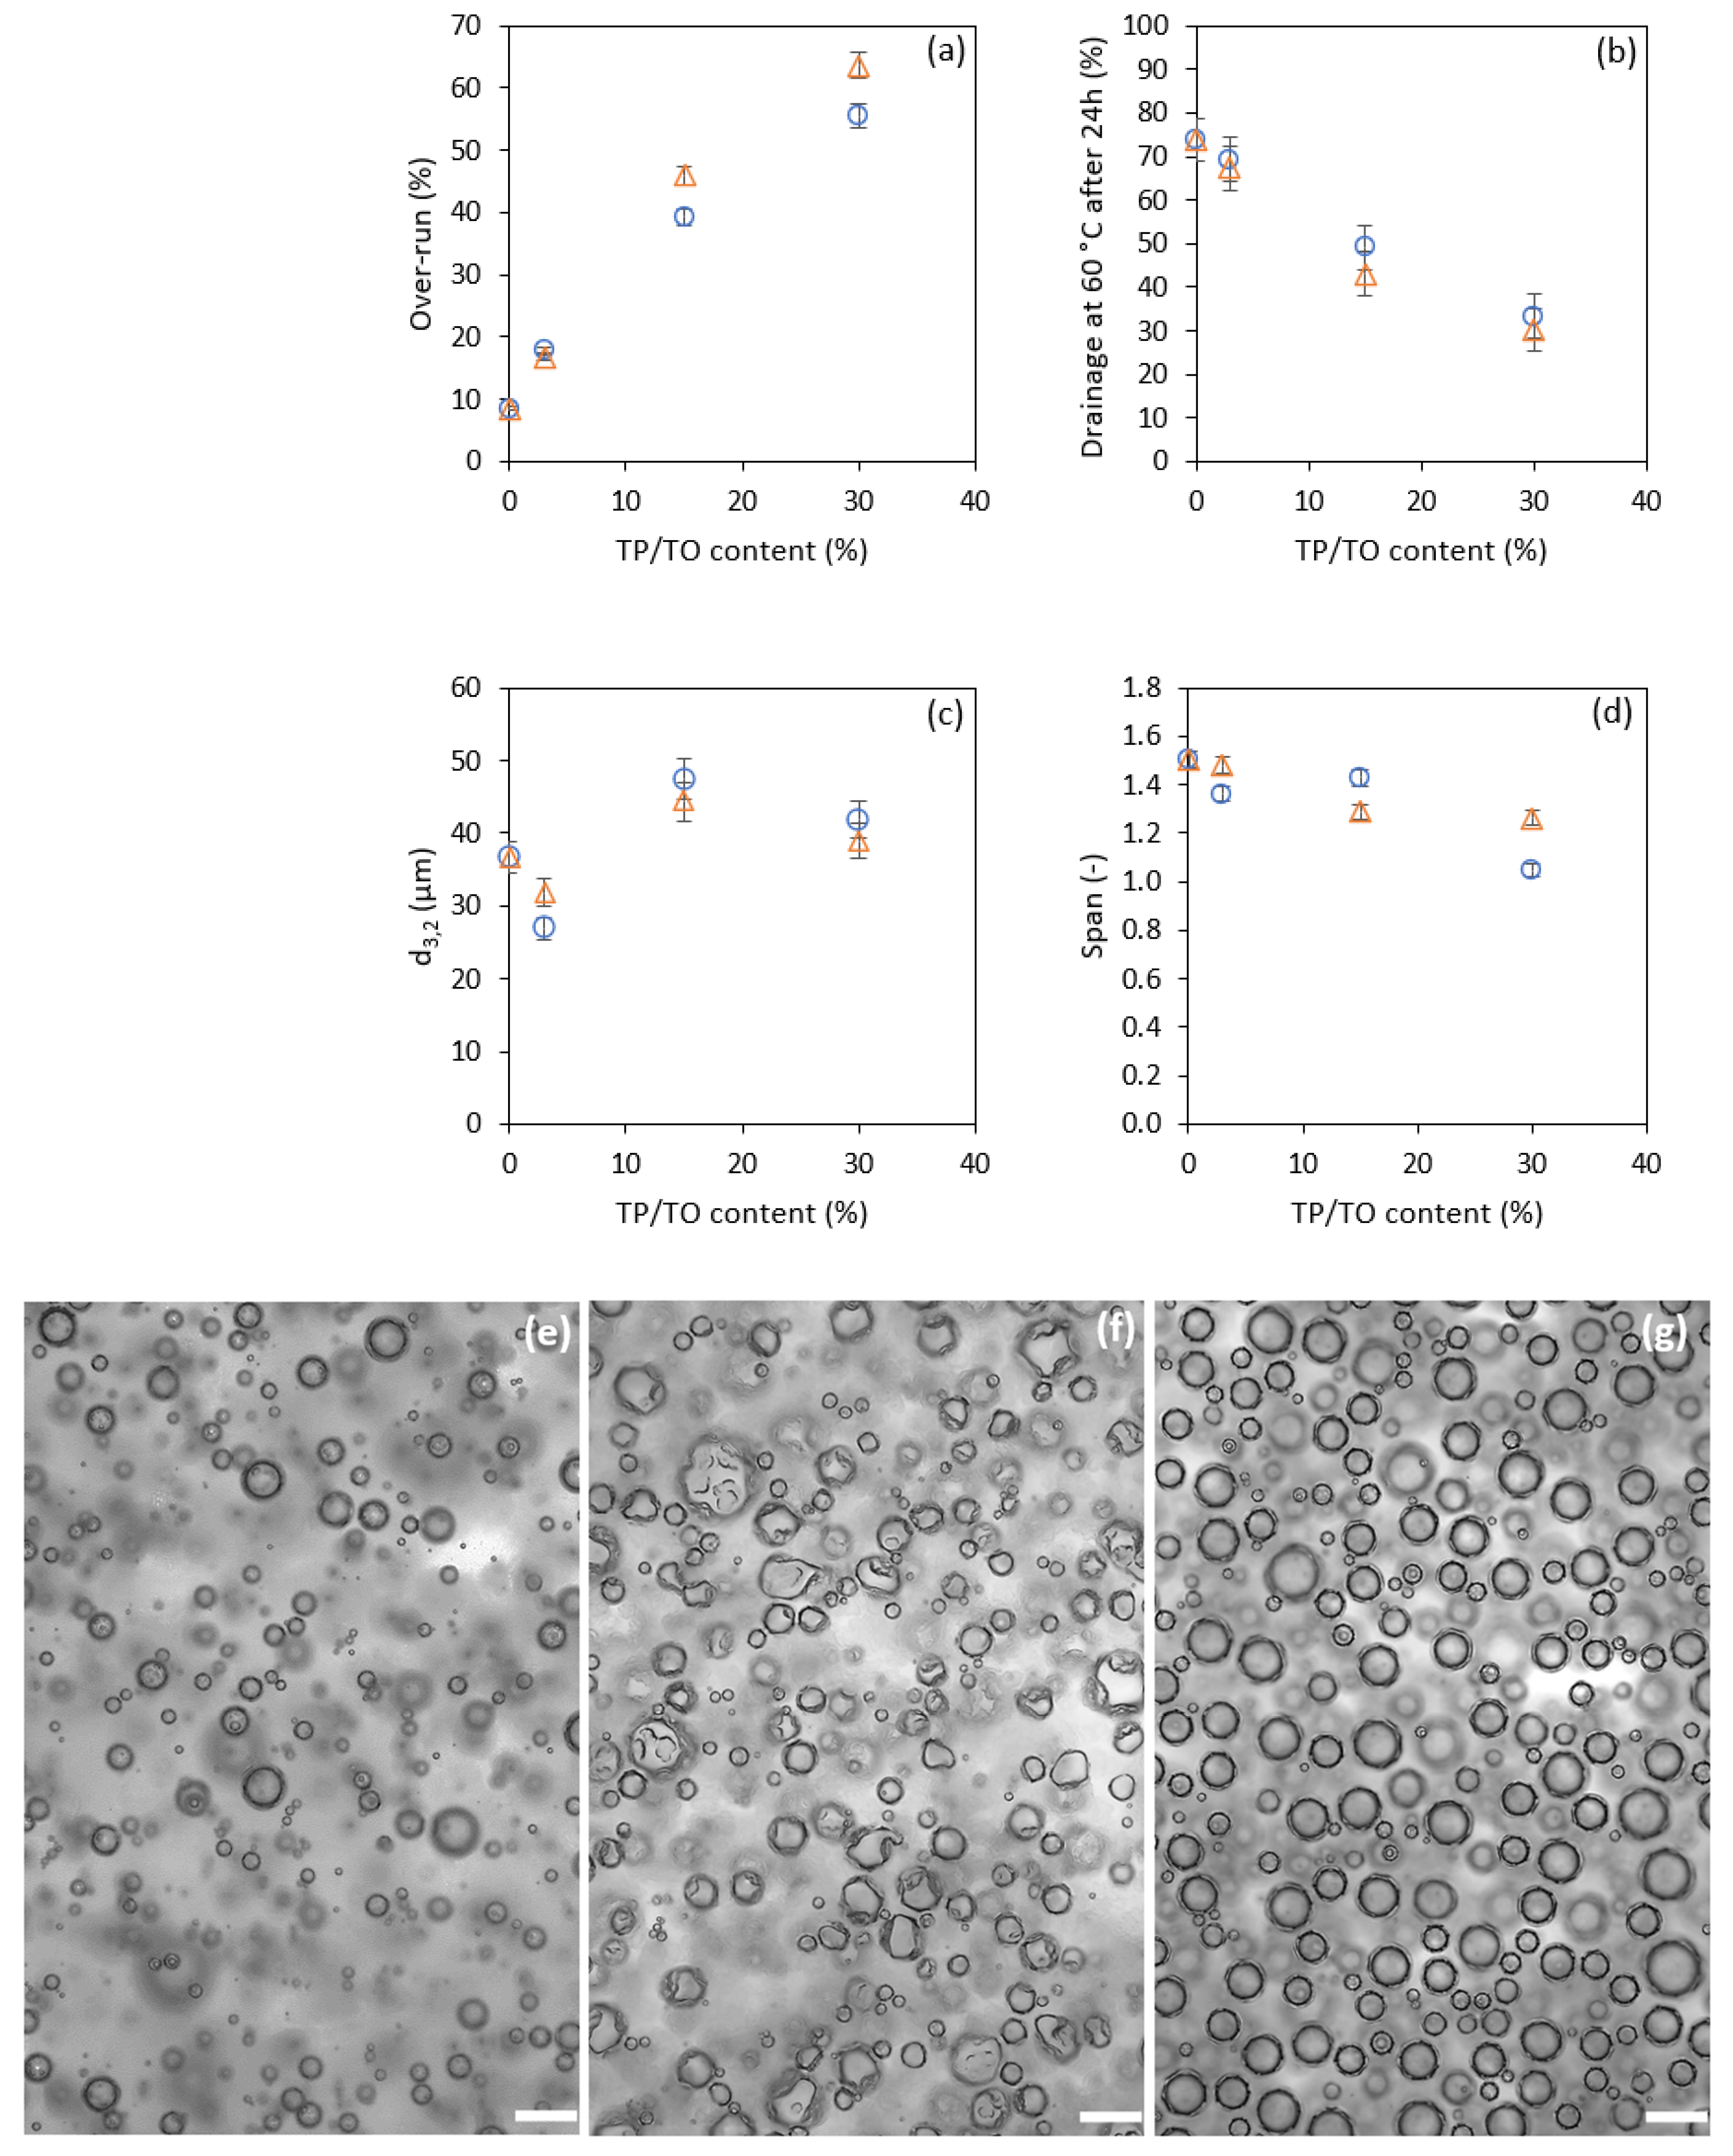
3.2.2. Effect of Triglyceride Content on the Foams’ Physical Properties

Liu Y. et al. (2021) produced olefoams using rapeseed oil, sunflower oil, peanut oil, and olive oil at 80 °C [7]. These foams were stabilized using 5 wt.% SE HLB 5 (C-1805). The over-run values obtained with each of the oils were 62%, 62%, 68%, and 63%, respectively. In our previous study [12], we indicated that using MCT oil with a concentration of SE lower than 12.5 wt.%, it was not possible to obtain foams stable enough to manipulate within the first few seconds after whipping. Thus, at 5 wt.% SE, and comparing the over-run values obtained in the literature with vegetal oils (>60%) and that obtained with MCT oil (<10%), the discrepancy is clearly large. For that reason, we hypothesize that the oil triglyceride content and in particular, the fatty acid chain length plays a role in stabilizing the air bubbles and therefore, the final over-run value.
To prove this hypothesis, we prepared mixtures of MCT oil with tripalmitin (C16) (TP) and MCT oil with triolein (C18) (TO). The percentages of these mixtures are given in Table 2. All the other parameters were fixed. SE HLB 5 was used to prepare the foam at a concentration of 5 wt.%. The SE/oil mixtures were left to mix for 1 h at 80 °C before the clear mixture was whipped at 2000 r.p.m. for 2 min. The melting points and rheological properties of the of the SE/oil mixtures (before whipping) are given in Figures S8 and S9 in the Supplementary Materials. Briefly, all the SE/oil mixtures had melting points below 60 °C (Figure S8), and the addition of TP and TO to the MCT oil did not significantly change the storage and loss moduli (Figure S9). Consequently, the differences in the physical properties of whipped foams were not attributed to the rheological properties of the SE/oil mixtures but rather to the triglyceride content.
Figure 9a shows that in the absence of TP and TO, the over-run obtained was around 9%. Increasing TP or TO content increased the over-run; going from 0 wt.% to 30 wt.% of each triglyceride in the oil phase resulted in over-run values of 55% (511% increase) and 63% (600% increase), respectively. Note that with 12.5 wt.% SE HLB 5/MCT oil mixture at 80 °C, as reported in the previous section, the maximum over-run obtained was 56%. Knowing that MCT oil is composed of caprylic (C8) and capric (C10) triglycerides, it is clear that the longer the fatty acid chains in the oil, the better stabilized are the incorporated air bubbles. We hypothesize that foams with TO have thicker air/oil interfaces because of their longer fatty acid chains. Figure 9g shows that the bubbles in the MCT/TO foams had sharper geometrical edges compared with the bubbles in the MCT foams (Figure 9e) or MCT/TP foams (which collapsed upon cooling, Figure 9f). The literature on hot-whipped olefoams is scarce, but it is well known that cold-whipped olefoams containing longer fatty acid chains result in foams with higher over-run values and greater stability [17,18].
Surface tension measurements (at 80 °C) of MCT oil, MCT + 15 wt.% TO, and MCT + 15 wt.% TP containing different concentrations of SE HLB 5 were carried out (Figure S10, Supplementary Materials) to examine whether the triglyceride content affected the surface tension or the surface coverage. However, the results showed that no significant differences existed between the three mixtures. All three mixtures showed a critical micelle concentration of around 2 % SE and a surface coverage of 7.5 × 10⁻⁷ molecules.m−2 at 80 °C. Using the same SE HLB 5 and also at 80 °C, Liu Y. et al. (2021) reported a higher surface coverage of 1.53 x 10⁻⁶ molecules.m−2 using extra virgin olive oil [7].
Since rheology and surface coverage cannot explain the differences in over-run obtained between MCT oil and MCT mixed with longer-chain triglyceride, we hypothesize that interfacial rheology measurements might give a better idea of the viscoelastic properties of the interface and the effect of the different-sized triglyceride chains on the interfacial arrangement. Knowing that on the oil/air interface, there are fatty acid chains with different lengths of carbon chain (C16 and C18) and different degrees of saturation, we can imagine a heterogeneous interface with different viscoelastic properties.
Regarding the effects of the triglyceride content on the stability of the foams, bubble size, and span, no significant effect was noted for TP and TO (Figure 9b–d).
Finally, to test whether the effect of the triglyceride chain length observed in these simple systems was reproducible in more complex oils, five vegetal oils were selected with at least 50% of their triglyceride chain length content made up of one kind of triglyceride. These oils are listed in Table 3, and the predominant triglyceride present is highlighted in grey. These oils were mixed with 5 wt% SE HLB 5 and whipped under the same conditions described at the beginning of this section. DSC measurements (Figure S11, Supplementary Materials) showed that all these oils with the SE melted at around 60 °C. Figure 10a shows that all the oils had an over-run of about 60%, except for the MCT oil (9%). Although each vegetal oil had one particular major triglyceride, they each still contained a cocktail of triglycerides with different fatty acid chain lengths (Table 3). Consequently, it was not possible to differentiate the oils based on their fatty acid content. A similar observation was made for bubble size, which ranged between 29 and 41 µm, and the span, which remained higher than 1. The storage and loss moduli of the hazelnut oil/SE mixture were measured and compared to those of the MCT oil/SE mixture. Figure S12 in the Supplementary Materials shows a slight increase in the loss modulus for the hazelnut oil/SE mixture, but this does not explain the big difference in over-run between the two mixtures. For that reason, and similarly to the conclusion from Figure 9a, the presence of long-chain triglycerides in the oil increased the volume fraction of air encapsulated. To further prove that the viscosity of the oil did not play so major a role in determining the foam over-run compared with the oil’s triglyceride content, we carried out a comparative study. Two mixtures were prepared: mixture 1 containing MCT oil + 10 wt.% SE HLB 1, and mixture 2 containing MCT oil + 10 wt.% SE HLB 1 + 5 wt.% SE HLB 5. Note that the SE HLB was used as an oil gelator. The two mixtures were whipped at 80 °C and as expected, mixture 1 resulted in 0% over-run while mixture 2 resulted in 8% over-run, which was similar to the 9% over-run obtained from the mixture containing MCT oil + 5 wt.% SE HLB 5 and no SE HLB 1. This showed that increasing the SE content from 5 wt.% to 15 wt.% did not increase the amount of air encapsulated.

4. Conclusions

This article is a first attempt at understanding the effects of SE HLB value and oil triglyceride content on the physical properties of waterless foams. Using SEs with HLB values ranging from 3 to 9, it was shown that the more hydrophilic the SE, the higher the temperature required to solubilize it in MCT oil. At the same time, the SE that contained the highest percentage of monoesters (SE HLB 9) was fully soluble in the oil, producing foams with the highest over-run values (62% at 12.5 wt.% SE HLB 9) compared with the other SEs studied. The rheological results did not indicate a difference between the SEs, but surface tension reduction showed that the most hydrophilic SE produced foams with the highest over-run values. To our knowledge, no other studies have discussed the effects of monoester content on the stabilization of foams. We hypothesize that the percentage of monoesters is a controlling factor, since monoester are chemically favorable for forming H bonds with the oil triglycerides. More importantly, we proved the thermal reversibility of the SE where the H bonds were broken under excessive heat and reformed upon cooling.
It was also shown that the oil content (triglyceride chain length in particular) played a role in stabilizing the oleofoams. Adding 30 wt.% of triolein to MCT oil did not increase the viscosity of the mixture but still increased over-run from 9 to 63%.
Future works should provide a more definite answer about the effects of SE HLB value and oil triglyceride content by carrying out interfacial rheology measurements. That would also bring a clearer idea of the oil/air interfacial arrangement.

Supplementary Materials

The following are available online at https://www.mdpi.com/article/10.3390/cosmetics12010015/s1; Figure S1. Melting points of the SE with different HLB values. Figure S2. Thermogram of the sucrose esters. Figure S3. Thermograms of the 12 wt.% SE in MCT. Figure S4. Foams’ over-run reported as a function of SE HLB at different temperatures and the drainage of these foams at 60 °C 10 minutes after whipping. Color gradient: darkest to lightest refers to increasing mixing time from 1 h to 72 h. Figure S5. Maximum over-run obtained at all the temperatures for each SE plotted versus the surface tension of the SE/MCT mixture measured at the respective temperature. Legend: ◊: HLB 3; □: HLB 5; Δ: HLB 7; O: HLB 9. Figure S6. Drainage after 10 min of the foams stabilized by SE with different HLB values at different temperatures. Legend: ◊: HLB 3; □: HLB 5; Δ: HLB 7; O: HLB 9. Figure S7. Microscopic images of the foams stabilized with the SE HLB 5 at (a) 80 °C and (b) 100 °C and with SE HLB 9 at (c) 80 °C and (d) 100 °C. The scale bar is equivalent to 50 µm. Figure S8. Melting points of the oil mixtures with 5 wt.% SE HLB 5. Legend: Δ: 15% TO; O: 15% TP. Figure S9. Storage and shear moduli as a function of temperature and triglyceride content. Figure S10. Surface tension (at 80 °C) of ◊: MCT oil, □: MCT+15 wt.% TP, and Δ: MCT+15 wt.% TO containing varying concentrations of SE HLB 5. Figure S11. Melting points of the vegetal oils and 5 wt.% SE HLB 5 mixtures. Figure S12. Storage and loss moduli of hazelnut and MCT oil s containing 5 wt.% SE. Table S1. SE melting points found in the literature. Table S2. State of oil/SE mixtures at different times and temperatures of mixing. Green refers to one-phase regions and red refers to two-phase regions. Squares containing X marks signify no foam formation and squares containing M marks refer to the condition that results in a maximum over-run under the relevant condition.

Author Contributions

Conceptualization, W.K. and D.H.-M.; methodology, W.K. and C.D.; formal analysis, W.K.; investigation, W.K. and L.D.; writing-original draft preparation, W.K., writing-review and editing, R.D. and D.H.-M.; supervision, R.D. and D.H.-M. All authors have read and agreed to the published version of the manuscript.

Funding

The authors wish to thanks Orléans Métropole for the funding of the grant 001.

Institutional Review Board Statement

Not applicable.

Informed Consent Statement

Not applicable.

Data Availability Statement

Available upon request.

Conflicts of Interest

The authors declare no conflict of interest.

References

  1. Zhao, Y.; Ren, Z.; Shi, L.; Zhang, Y.; Weng, W. Effects of Pre-Emulsion Prepared Using Sucrose Esters with Different Hydrophile-Lipophile Balances on Characteristics of Soy Protein Isolate Emulsion Films. Food Res. Int. 2023, 165, 112542. [Google Scholar] [CrossRef] [PubMed]
  2. Zeng, D.; Cai, Y.; Liu, T.; Huang, L.; Wang, J.; Zhao, M.; Zhu, S.; Zhao, Q. Effect of Hydrophobic Sucrose Esters with Different Fat Acid Composition and Esterification Degree on Whipped Cream Properties. Food Hydrocoll. 2024, 146, 109183. [Google Scholar] [CrossRef]
  3. Hu, X.; Binks, B.P.; Cui, Z. High Internal Phase Emulsions Stabilized by Adsorbed Sucrose Stearate Molecules and Dispersed Vesicles. Food Hydrocoll. 2021, 121, 107002. [Google Scholar] [CrossRef]
  4. Scott, L.N.; Bergfeld, W.F.; Belsito, D.V.; Hill, R.A.; Klaassen, C.D.; Liebler, D.C.; Marks, J.G.; Shank, R.C.; Slaga, T.J.; Snyder, P.W.; et al. Safety Assessment of Saccharide Esters as Used in Cosmetics. Int. J. Toxicol. 2021, 40, 52S–116S. [Google Scholar] [CrossRef] [PubMed]
  5. Bin Sintang, M.D.; Danthine, S.; Patel, A.R.; Rimaux, T.; Van De Walle, D.; Dewettinck, K. Mixed Surfactant Systems of Sucrose Esters and Lecithin as a Synergistic Approach for Oil Structuring. J. Colloid Interface Sci. 2017, 504, 387–396. [Google Scholar] [CrossRef] [PubMed]
  6. Szuts, A.; Pallagi, E.; Regdon, G.; Aigner, Z.; Szabó-Révész, P. Study of Thermal Behaviour of Sugar Esters. Int. J. Pharm. 2007, 336, 199–207. [Google Scholar] [CrossRef] [PubMed]
  7. Liu, Y.; Binks, B.P. A Novel Strategy to Fabricate Stable Oil Foams with Sucrose Ester Surfactant. J. Colloid Interface Sci. 2021, 594, 204–216. [Google Scholar] [CrossRef] [PubMed]
  8. Qiu, C.; Wang, S.; Wang, Y.; Lee, W.J.; Fu, J.; Binks, B.P.; Wang, Y. Stabilisation of Oleofoams by Lauric Acid and Its Glycerol Esters. Food Chem. 2022, 386, 132776. [Google Scholar] [CrossRef]
  9. Liu, Y.; Binks, B.P. Foams of Vegetable Oils Containing Long-Chain Triglycerides. J. Colloid Interface Sci. 2021, 583, 522–534. [Google Scholar] [CrossRef] [PubMed]
  10. Saremnejad, F.; Mohebbi, M.; Koocheki, A. Practical Application of Nonaqueous Foam in the Preparation of a Novel Aerated Reduced-Fat Sauce. Food Bioprod. Process. 2020, 119, 216–225. [Google Scholar] [CrossRef]
  11. Wettlaufer, T.; Flöter, E. Wax Based Oleogels and Their Application in Sponge Cakes. Food Funct. 2022, 13, 9419–9433. [Google Scholar] [CrossRef]
  12. Kaade, W.; Huc-Mathis, D.; Drouet, L.; Dousset, C.; Blumenthal, D.; Daniellou, R. An Experimental Design Approach to Modeling Water-Free Foams. Colloids Surf. A Physicochem. Eng. Asp. 2024, 699, 134700. [Google Scholar] [CrossRef]
  13. Esteban, B.; Riba, J.R.; Baquero, G.; Rius, A.; Puig, R. Temperature Dependence of Density and Viscosity of Vegetable Oils. Biomass Bioenergy 2012, 42, 164–171. [Google Scholar] [CrossRef]
  14. Cholakova, D.; Tcholakova, S. Sucrose Ester Surfactants: Current Understanding and Emerging Perspectives. Curr. Opin. Colloid Interface Sci. 2024, 73, 101832. [Google Scholar] [CrossRef]
  15. Delahaije, R.J.B.M.; Sagis, L.M.C.; Yang, J. Impact of Particle Sedimentation in Pendant Drop Tensiometry. Langmuir 2022, 38, 10183–10191. [Google Scholar] [CrossRef] [PubMed]
  16. L’Estimé, M.; Schindler, M.; Shahidzadeh, N.; Bonn, D. Droplet Size Distribution in Emulsions. Langmuir 2024, 40, 275–281. [Google Scholar] [CrossRef]
  17. Grossi, M.; Fang, B.; Rao, J.; Chen, B. Oleofoams Stabilized by Monoacylglycerides: Impact of Chain Length and Concentration. Food Res. Int. 2023, 169, 112914. [Google Scholar] [CrossRef] [PubMed]
  18. Liu, Y.; Binks, B.P. Fabrication of Stable Oleofoams with Sorbitan Ester Surfactants. Langmuir 2022, 38, 14779–14788. [Google Scholar] [CrossRef] [PubMed]
Figure 1. Melting points of 12.5 wt.% SE/MCT oil mixtures.
Cosmetics 12 00015 g001
Figure 2. 5 wt.% SE/MCT-air surface tension at different temperatures. Legend: O: MCT oil with no SE; ◊: HLB 3; Δ: HLB 5; x: HLB 7; □: HLB 9.
Cosmetics 12 00015 g002
Figure 3. Storage and shear moduli as a function of temperature and SE HLB value.
Cosmetics 12 00015 g003
Figure 4. Viscosity of 12.5 wt.% SE/MCT oil mixtures as a function of temperature.
Cosmetics 12 00015 g004
Figure 5. (a) Over-run and (b) drainage after 24 h, for foams stabilized by SEs with different HLB values at different temperatures. Legend: ◊: HLB 3; □: HLB 5; Δ: HLB 7; O: HLB 9. Results for SE HLB 7 adapted from Kaade W. et al. (2024) [12].
Cosmetics 12 00015 g005
Figure 6. Schematic of the thermoreversible emulsifying power of SE. Legend: Cosmetics 12 00015 i001: di, tri, poly ester Cosmetics 12 00015 i002: monoester; Cosmetics 12 00015 i003: triglyceride chain; yellow background: MCT oil.
Cosmetics 12 00015 g006
Figure 7. (a) Sauter mean diameter and (b) span of the foams stabilized using SEs with different HLB values at different temperatures. Legend: ◊: HLB 3; □: HLB 5; Δ: HLB 7; O: HLB 9.
Cosmetics 12 00015 g007
Figure 8. Microscopic images of the foams stabilized with SE HLB 3 at (a) 60 °C and (b) 80 °C and with SE HLB 7 at (c) 80 °C and (d) 100 °C. The scale bar is equivalent to 50 µm.
Cosmetics 12 00015 g008
Figure 9. Effect of oil triglyceride content on (a) over-run, (b) drainage at 60 °C after 24 h, (c) bubble size, (d) span. Figures (eg) illustrate MCT oil, MCT + 15 wt.% TP, and MCT + 15 wt.% TO. Legend: Δ: 15% TO; O: 15% TP. The scale bar is equivalent to 50 µm.
Cosmetics 12 00015 g009
Figure 10. Over-run (a), drainage (b), bubble size (c), and bubble size distribution (d) of vegetal oils stabilized by 5 wt.% SE HLB 5 at 80 °C.
Cosmetics 12 00015 g010
Table 1. List of SEs used.
Sucrose EstersHLBFatty Acids *% MonoesterManufacturer
SP01-C<1Stearic/palmitic<1Sisterna *
SP10-C2Stearic/palmitic10Sisterna
C-18033Stearic20MKFC **
C-18055Stearic30MKFC
C-18077Stearic40MKFC
S909Stearic50Synose ***
C-181111Stearic55MKFC
SP70-C15Stearic/palmitic70Sisterna
C-181616Stearic75MKFC
* Sisterna (Roosendaal, The Netherlands), ** Mitsubishi-Kagaku Food Corporation (Tokyo, Japan), *** Zhejiang Synose Tech Co., Ltd. (Zhejiang, China).
Table 2. The triglyceride composition of the oil phases.
MCT Oil (%)Tripalmitin (%)MCT Oil (%)Triolein (%)
10001000
973973
85158515
70307030
Table 3. List of oils tested, with the fatty acid profiles provided by the manufacturer.
OilFatty Acid Content Reported by the Manufacturer
Abyssinian
(Aromazone)
54.53%Erucic acid22:1Monounsaturated
16.15%Oleic acid18:1Monounsaturated
2.21%Palmitic acid16:0Saturated
8.23%alpha-Linoleic acid18:3n3Polyunsaturated
3.16%Linoleic acid 18:2n6Polyunsaturated
Jojoba
(Aromazone)
65–90%Gadoleic acid20:1Monounsaturated
5–30%Erucic acid22:1Monounsaturated
5–15%Oleic acid18:1Monounsaturated
0.5–5%Nervonic acid24:1Monounsaturated
Evening Primrose
(Aromazone)
74.21%Linoleic acid18:2n6Polyunsaturated
9.21%gamma-Linolenic acid18:3n6Polyunsaturated
7.07%Oleic acid18:1Monounsaturated
2.19%Stearic acid18:0Saturated
6.47%Palmitic acid16:0Saturated
Hazelnut
(Aromazone)
82.59%Oleic acid18:1Monounsaturated
5.52%Palmitic acid16:0Saturated
2.47%Stearic acid18:0Saturated
7.62%Linoleic acid18:2n6Polyunsaturated
Palm
(Aromazone)
40–46%Palmitic acid16:0Saturated
36–44%Oleic acid18:1Monounsaturated
3.5–6%Stearic acid18:0Saturated
8–14%Linoleic acid18:2n6Polyunsaturated
Disclaimer/Publisher’s Note: The statements, opinions and data contained in all publications are solely those of the individual author(s) and contributor(s) and not of MDPI and/or the editor(s). MDPI and/or the editor(s) disclaim responsibility for any injury to people or property resulting from any ideas, methods, instructions or products referred to in the content.

