1. Introduction
The education sector can benefit significantly by incorporating information technologies and improving the academic performance of students [
1,
2]. However, students’ resistance to new technologies can impede their successful adoption or use. Therefore, determining the factors that explain and predict acceptance of these technologies is necessary to design effective adoption strategies.
One of these technologies, augmented reality (AR), has been employed in different fields [
3], from tourism and navigation to entertainment and advertisement, geometry modeling and scene construction, assembly and maintenance, information assistant management, training, and education [
4].
In the education sector, AR has been adopted in several areas of knowledge [
5] because it provides additional value to mobile learning objects by providing greater interactivity and an attractive learning environment [
6]. The inclusion of AR technology helps students in improving their creativity, critical thinking, and problem-solving skills [
7].
In engineering education, one of the areas where AR has been used is electronics [
8,
9]. Students frequently find it difficult to understand electricity concepts because electricity and its working mechanism are invisible [
10]. Visualizing electricity through an AR app allows students to understand these concepts more intuitively [
11] and improve their academic achievements [
12].
Incorporating the AR technology in different stages of the educational process could also allow future engineering skills to be incorporated into Industry 4.0, which is characterized by even more digitized and optimized operations in an integrated network under the concept of industrial AR [
13]. For example, companies with modern production systems currently anticipate AR apps that can support the assembly process through virtual instructions [
14].
Despite these benefits, the analysis of how users accept and use various innovative technologies is lacking [
15]. Technology acceptance is meant to explain technology usage behavior and is associated with behavioral intention [
16]. Given this, models are used to predict or explain the behavior of individuals on the implementation of information technologies.
One of the most important models, the technology acceptance model (TAM), proposed by Davis [
17], is an adaptation of the theory of reasoned action [
18]. The TAM incorporates the following variables: perceived ease of use, perceived usefulness, attitude toward using, and behavioral intention to use.
Some studies have suggested the TAM’s incapacity to model new scenarios. However, these studies focus on commercial applications, mainly marketing and AR apps’ perceived value. Vishwakarma et al. [
19], while researching an AR app in tourism, indicated that the applicability of the TAM is limited because it explains the adoption of new information and communication technologies only from the viewpoint of users and not consumers. They used the value-based adoption model [
20], which considers adoption from a consumer’s perspective, rather than from a technology user perspective.
Nevertheless, the extended versions of the TAM remain valid in education as apps are provided to students to support the educational process and autonomous learning. Given that the commercialization of apps is not considered, students are not treated as consumers.
The TAM has been applied to study the adoption of new information and communication technologies such as wearables [
21], Google Glass [
22], and AR in science [
23] and geometry [
24,
25]. In the educational field, the TAM has been recently employed to examine the adoption of massive open online courses [
26,
27], digital communication [
28], e-learning [
29,
30], mobile learning [
31,
32,
33], and the use of open-source software [
34].
In engineering education, only one study was found that addressed the acceptance of the AR technology using structural equation modeling to analyze the causal relationship between variables. Ibañez et al. [
35] used the TAM to explore students’ perceptions regarding problem-solving in electromagnetism. The results of the evaluation demonstrated that the behavioral intention to use was dependent on perceived enjoyment. However, the authors had to remove the perceived usefulness construct because of inconsistency in students’ responses. The personal or environmental characteristics were not considered.
As AR technology has proven to be useful for improving academic performance, higher education institutions need to incorporate it more intensively in their teaching and learning processes. The AR technology allows the creation of virtual laboratories that can be used for different subjects, thereby optimizing the use of available resources. Further, being an app, students can download and use it freely. Based on the features provided by smartphones or tablets, each student could have a laboratory in his or her hands to experiment and perform exercises, thereby catalyzing autonomous learning processes in students. The AR technology can also promote distance learning, as students do not necessarily need to visit laboratories.
However, this scenario is not possible if the actors involved are not willing to use this technology. If the variables that influence the willingness to use technology are appropriately understood, then the actions that lead to reinforcing the disposition of certain students to use such technology can be encouraged. Thus, if an early-stage technology reveals that potential users are unlikely to accept it, appropriate interventions could be applied to achieve acceptance; otherwise, these resources could be invested in the development and implementation of other higher impact technologies.
The characteristics of the current generation of students must also be considered. Being digital natives, they are increasingly immersed in digital technologies [
36]. The acceptance of technologies by digital natives requires incorporating a series of individual and relevant factors [
29]. One of them is technology readiness, which comprises four dimensions: optimism and innovativeness as drivers, and discomfort and insecurity as inhibitors [
37] with optimism and innovativeness being stable individual dimensions for measurement [
38]. Although technology readiness dimensions have been employed in examining the technological acceptance of digital natives as consumers [
39], they have not been used by incorporating them into the TAM in education. In addition, the studies on the incorporation of mobile learning in the formal educational context are scarce [
40].
To address this gap, we propose an extended TAM to analyze the influence of technology optimism and technology innovativeness on AR acceptance. The study seeks to contribute to the relevant literature by determining variables that can explain and predict students’ use of AR technology in engineering education. This could have implications for the policies that higher education institutions may have for adopting these technologies.
2. Theoretical Background and Hypotheses
We focus on theoretical constructs proposed by Davis [
17] in the TAM: perceived ease of use, perceived usefulness, attitude toward using, and behavioral intention to use. Further, the TAM uses two theoretical constructs proposed by Parasuraman [
37], technology optimism and technology innovativeness, in addition to the subjective norm, because they are related to behavioral intention to use.
Subjective norm refers to the belief that an important person or group of people will approve and support a particular behavior. It is determined by the perceived social pressure from other people to behave in a specific manner and a person’s motivation to comply with those people’s expectations [
41]. Expectations of other people, whose opinions are important to a person, can make him or her believe that technology could improve his or her performance [
42] or can render the technology trustworthy [
43]. In an academic environment, students’ beliefs regarding the use of technology can be influenced by the opinion of academics and classmates [
44].
Technology innovativeness is defined as a person’s inclination to try new information technologies [
45]. It is related to people’s tendency to be pioneering users of technology and be leaders in its use [
37]. These users rarely consider new technologies as complex or beyond their understanding and are likely to regret losing the opportunity to explore new technologies [
46]. Additionally, technology optimism refers to having a positive view of technology, including control, flexibility, convenience, and efficiency [
45]. It is related to persons’ positive vision toward technology because they feel they have greater control over their lives [
37] and are prepared to use it [
47].
Based on the above, we can infer that if a student is in an environment where technology benefits are highlighted or their use is promoted, students would believe that using these technologies can positively impact their study and encourage them to be pioneers in using these technologies. Therefore, we propose the following hypotheses:
Hypothesis 1 (H1). Subjective norm has a positive effect on technology optimism.
Hypothesis 2 (H2). Subjective norm has a positive effect on technology innovativeness.
Hypothesis 3 (H3). Technology optimism has a positive effect on technology innovativeness.
Perceived usefulness can be characterized as how a person thinks a particular technology will improve task performance [
48], for instance, the shorter time necessary to perform a task or activity, or higher precision [
49].
Further, attitude toward using refers to the user’s evaluation regarding the convenience of using a determined technology [
50].
If students are optimistic about the benefits that technology can provide to improve the teaching and learning process, then they may be more likely to find that specific technology easier to use, and in turn, believe that using it might be convenient and help achieve the expected results. The same could happen with a student who is a pioneer in using new technologies. With a particular technology, these students may believe that using it can be convenient and have a positive attitude toward it. Therefore, we propose the following hypotheses:
Hypothesis 4 (H4). Technology optimism has a positive effect on perceived usefulness.
Hypothesis 5 (H5). Technology optimism has a positive effect on attitude toward using.
Hypothesis 6 (H6). Technology innovativeness has a positive effect on attitude toward using.
The perceived ease of use is defined as the degree to which a person believes that a specific technology can be used effortlessly [
49].
If students perceive that an AR app is easy to use, they might find it useful to incorporate it as a tool in their learning process. Similarly, this app was easy to use, and because of its convenience, it could also elicit a positive attitude from students.
At the same time, this positive attitude that students may have toward the app could, in turn, be explained by how useful they find incorporating it into their educational process. This leads to our next set of hypotheses:
Hypothesis 7 (H7). Perceived ease of use has a positive effect on perceived usefulness.
Hypothesis 8 (H8). Perceived ease of use has a positive effect on attitude toward using.
Hypothesis 9 (H9). Perceived usefulness has a positive effect on attitude toward using.
Finally, behavioral intention to use refers to an individual’s perception of what others think he or she should do about a determined behavior [
18]. Studies on AR have illustrated that behavioral intention to use is influenced by attitude toward using [
48,
51]. Thus, this leads to our next hypothesis:
Hypothesis 10 (H10). Attitude toward using has a positive effect on behavioral intention to use.
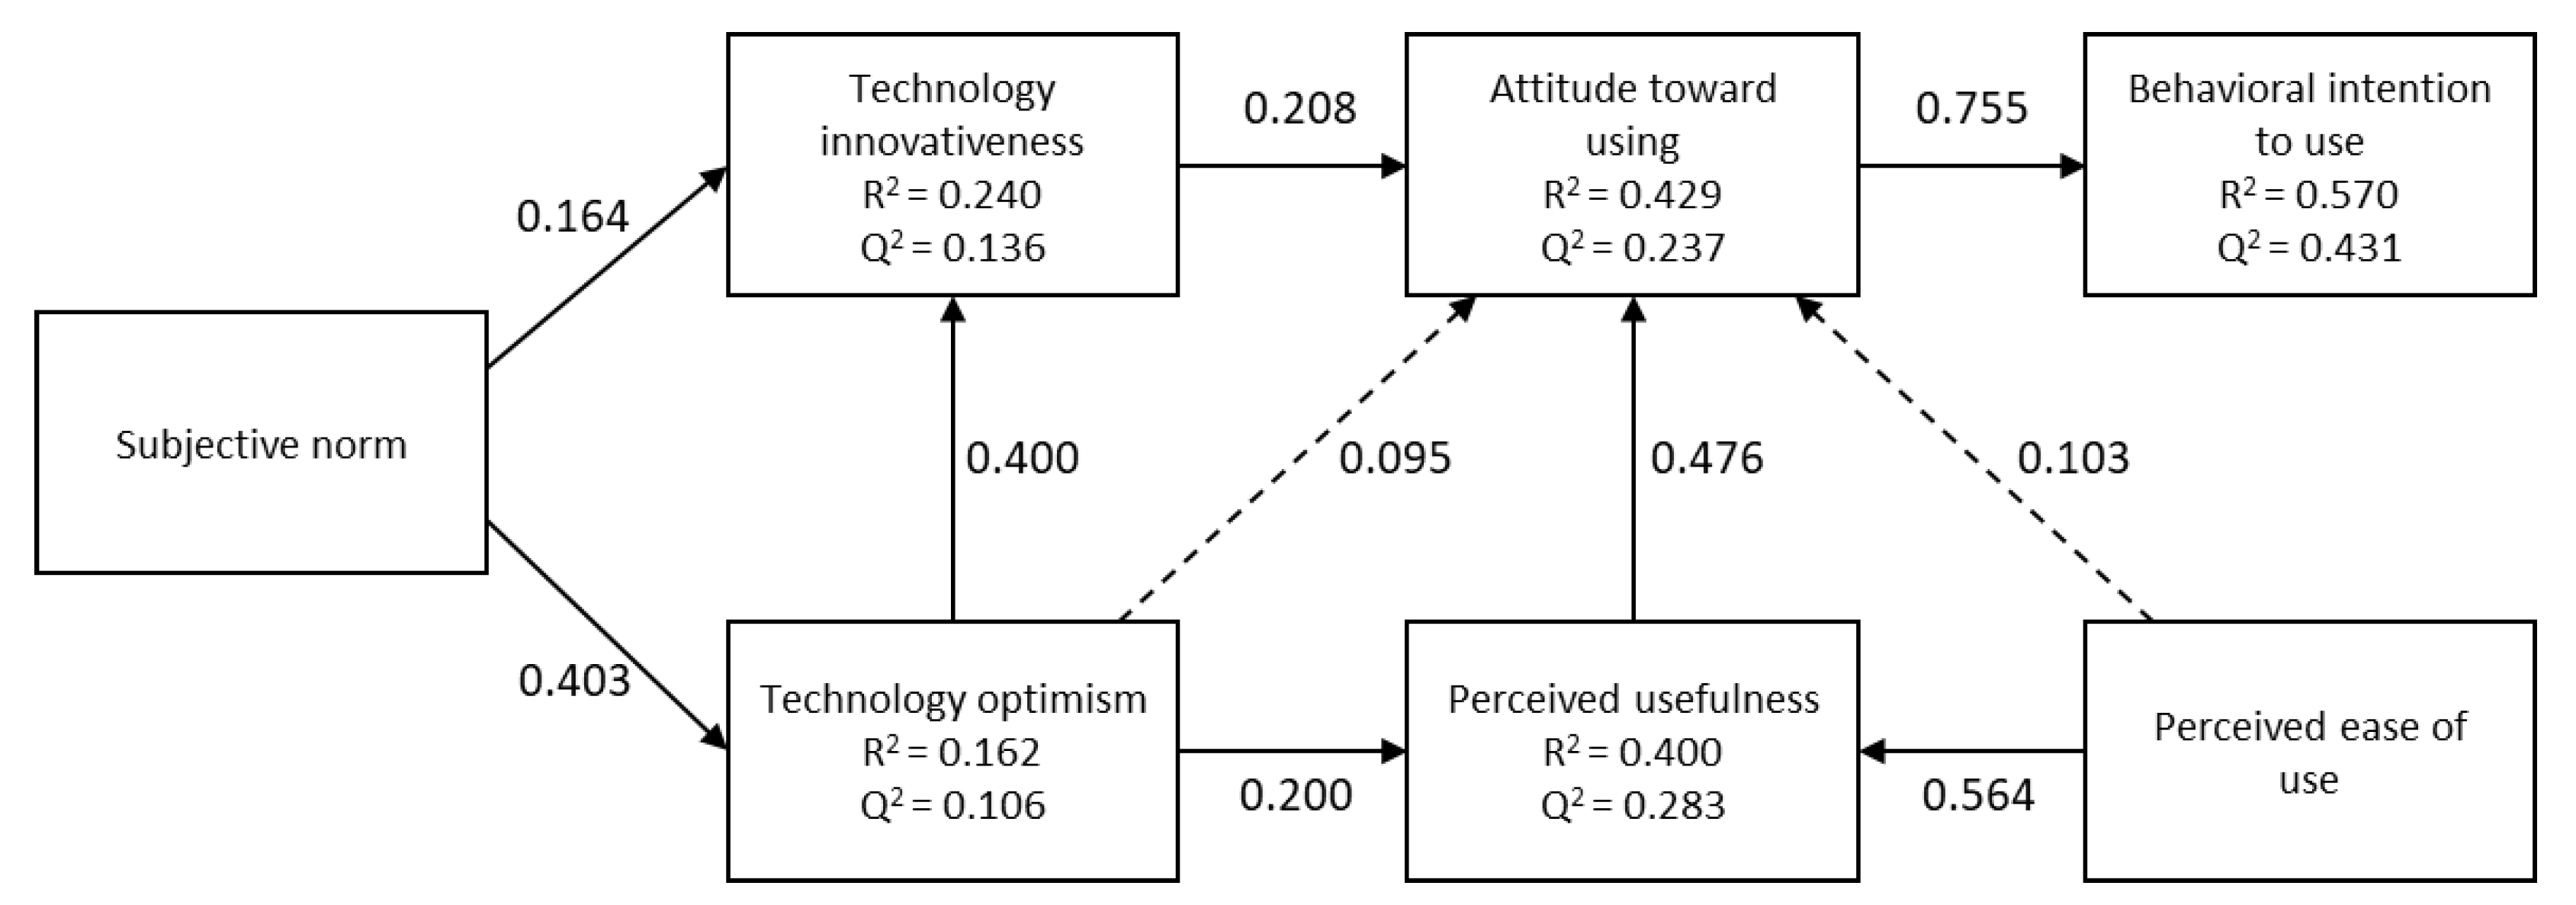
We propose the research model depicted in
Figure 1. This model comprises an extended TAM that incorporates the variables technology optimism and technology innovativeness, which have not been previously investigated in the context of AR apps in engineering education.
3. Interactive AR App
Some apps have been developed as a support for learning electrical circuits, which help visualize electricity. Matcha and Rambli [
10] developed a prototype to analyze the relationship between current and resistance in a circuit. Restivo et al. [
11] developed the app “CD Circuit Puzzle.” The circuit elements were used as Lego pieces to understand their operation, perceive different situations, and practice solutions. However, these apps only reach a medium degree of interaction (level III, complex interaction: the student can manipulate graphical objects to analyze their behavior [
52]). Therefore, we developed an AR app that reaches a high of interactivity (level IV, real-time interaction: the student can interact in a simulation where stimuli generate complex responses [
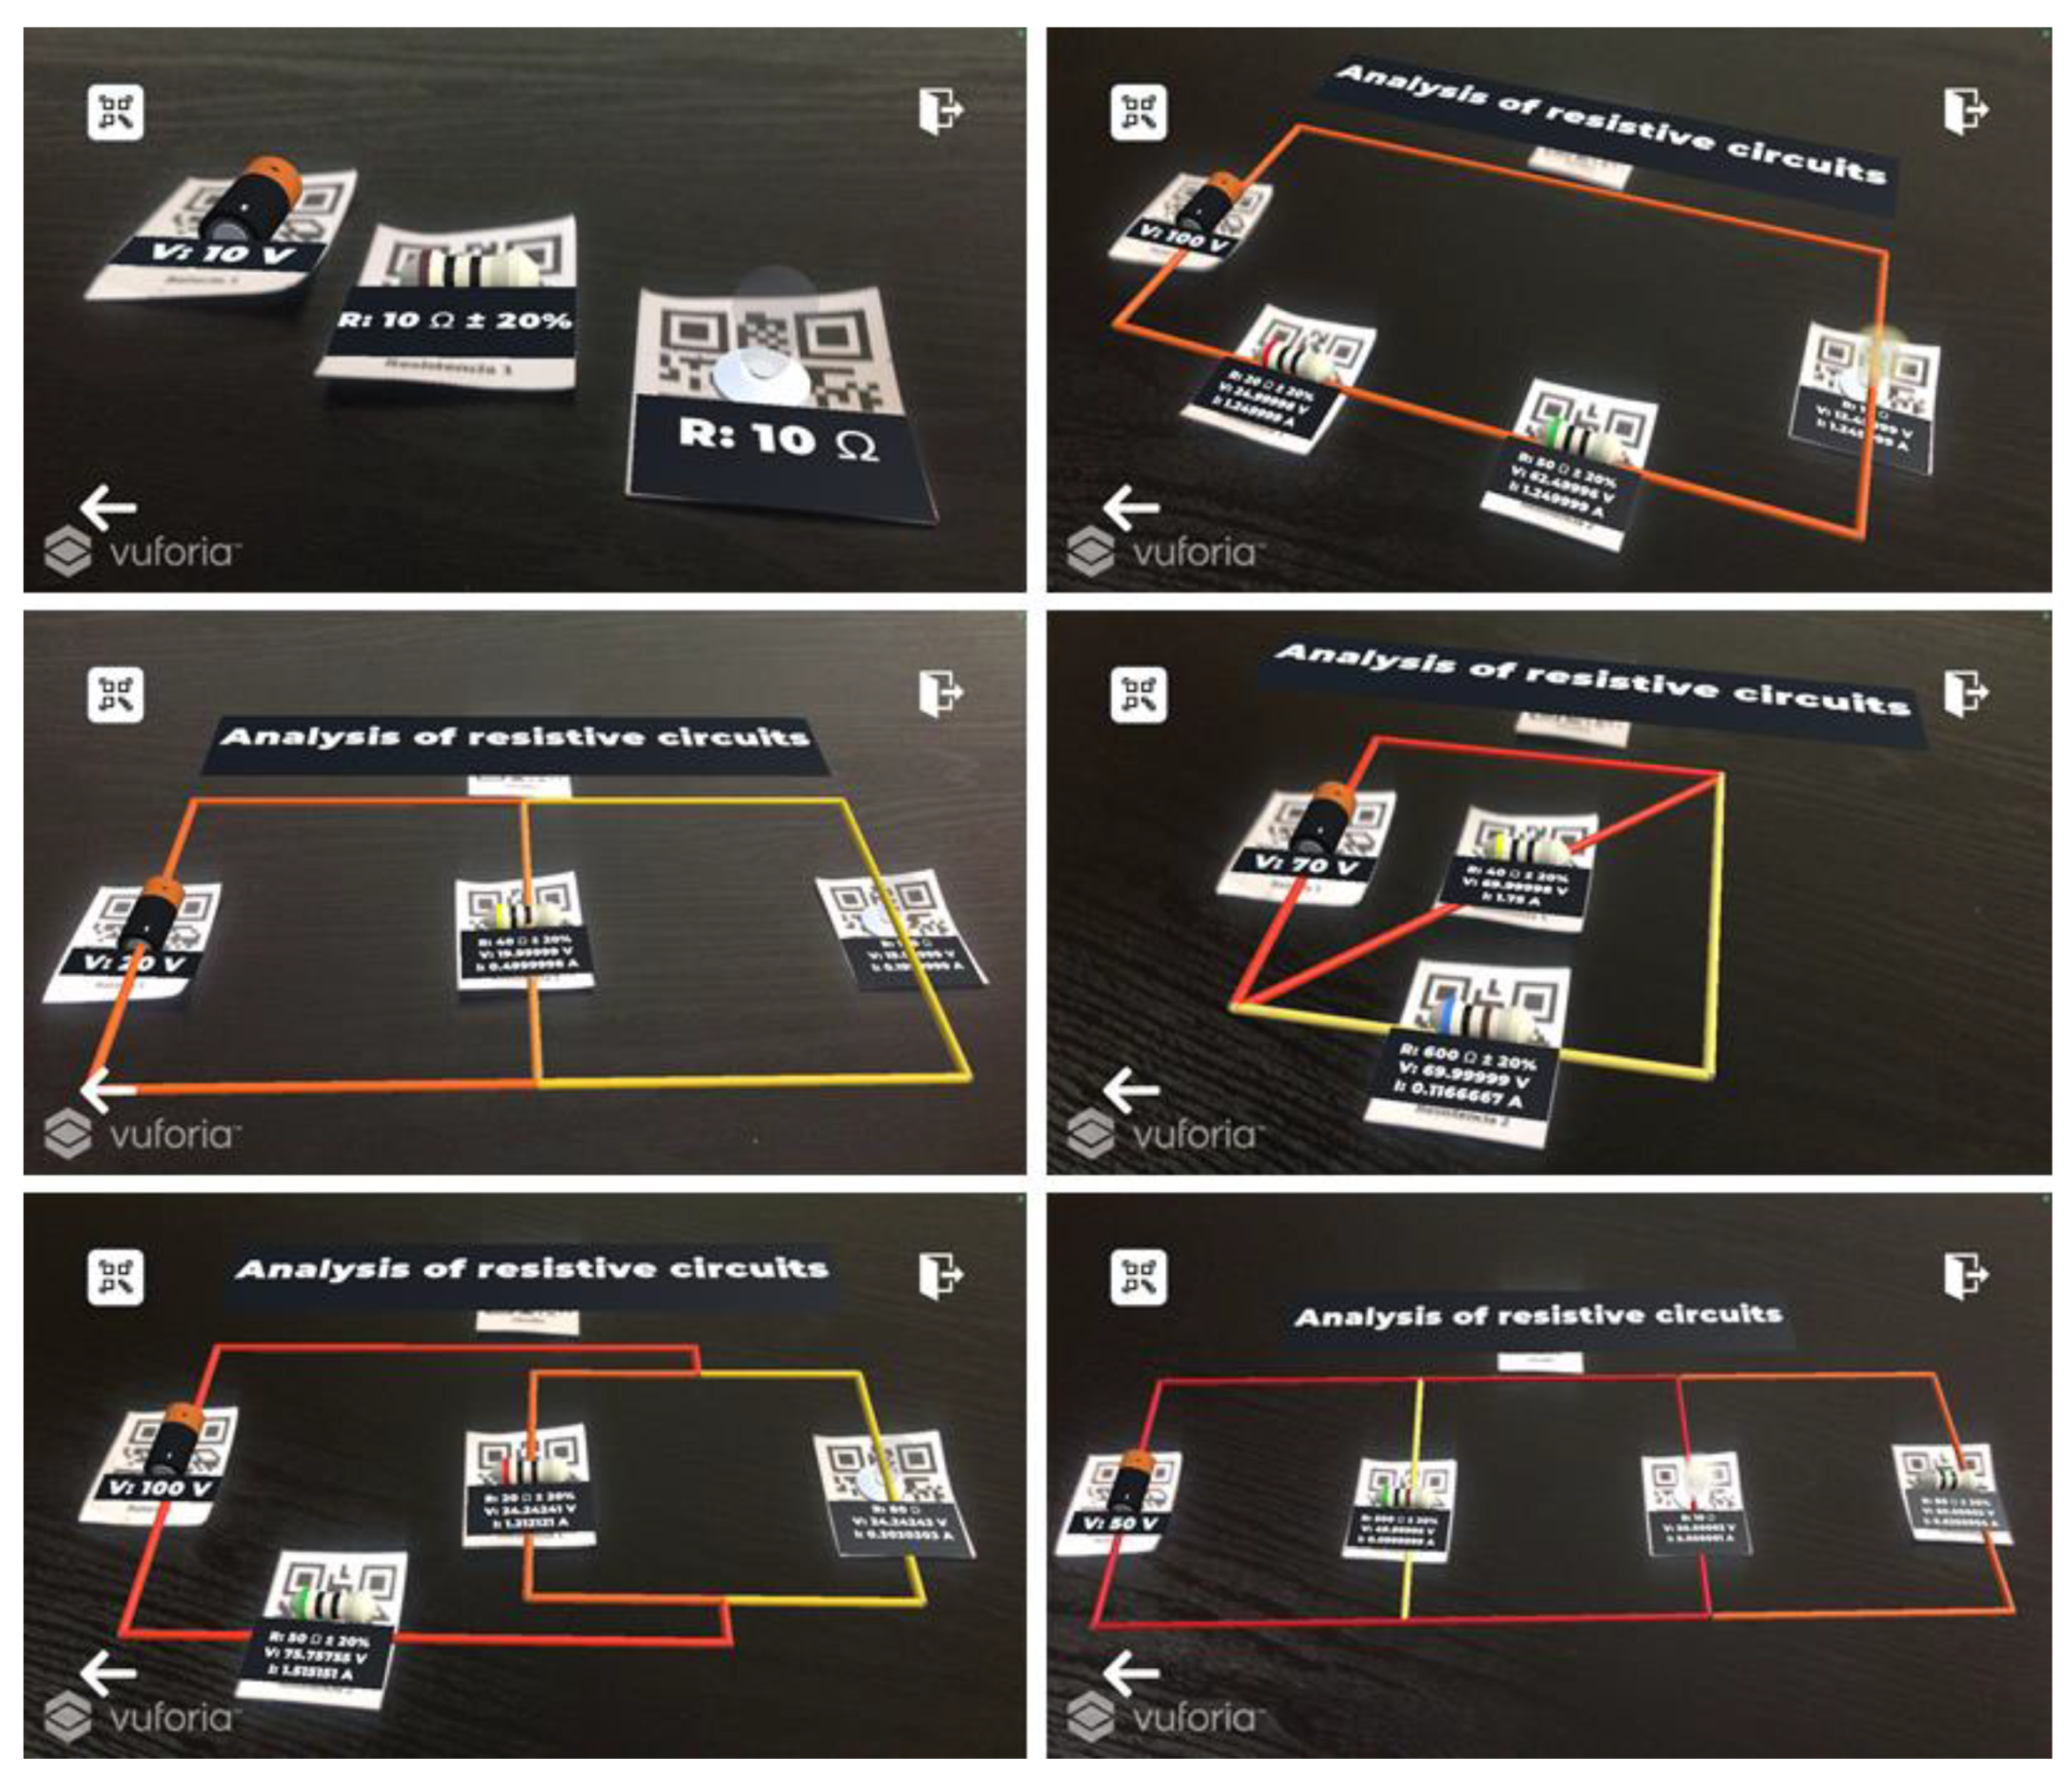
52]). This app, named “INGAR DC Analysis,” analyzes direct current (DC) in resistive circuits. This app allows the user to change the batteries’ voltage values and the resistance value of the light bulbs and resistors under controlled safety conditions, generating real-time amperage calculations present in the circuit.
This app can be used in theoretical classes, laboratories, or as a support tool for autonomous learning using smartphones or tablets. The AR app’s purpose is to enable students to work with electrical circuits and visualize how electricity functions.
In the app, AR figures (batteries, light bulbs, and resistors) can be manipulated in serial or parallel resistive circuits by students. The app has five types of serial and parallel circuits to choose from (
Figure 2).
By manipulating QR codes as targets, students can experience various circuit configurations by incorporating and combining batteries, light bulbs, and resistors, and varying their voltages and resistances.
With this, the app calculates and displays the resulting values of voltage and amperage of light bulbs and resistors in real time, using the loop method and applying Kirchhoff’s voltage law [
53].
According to the amperage value circulating in each branch of the circuit, a color is assigned. A gray branch means no amperage. A 12-color scale ranging from faint yellow to bright red was used, depending on the amperage value.
Thus, students can visualize the different intensities of current passing through each branch of the circuit and the values of amperage and voltage circulating through each light bulb or resistor.
The app was developed in Unity 3D using the Vuforia SDK. The development of the app is facilitated using prefabs, which were obtained from the SDK. Three-dimensional objects were developed with the Blender software. Batteries, resistors, and light bulbs were created as objects in AR to interact with the resistive circuit. QR codes are used by the circuit, batteries, light bulbs, and resistors code as a target to position each AR element in the space. An optical tracker for its operation is used.
4. Methodology
The model and the proposed hypotheses were simultaneously tested applying structural equations through partial least squares (PLS), using the Smart PLS 3.2.9 © software [
54]. The PLS technique was adopted because it combines unobserved variables representing theoretical concepts and data from measurements, which are used to provide evidence on the relationships between latent variables [
55]. This method is appropriate as the approximation includes complex models as well as compound variables [
56].
The application of the PLS technique consists of different steps, with the first step being the model fit [
57]. The fit test is performed for the estimated model by applying a bootstrapping process of 5000 subsamples [
58]. Second, the measurement model is evaluated, and third, the fit of the model is analyzed [
59]. Type B compound variables were considered for this model [
60].
A review of the literature to compile the survey was conducted. Questionnaires from previous studies were used, as these questions were previously validated. A survey comprising 22 indicators was employed for data collection.
Table 1 presents the studies used to adapt the questions for the constructs and indicators.
The convenience sampling method—a non-probability sampling technique involving the sample being drawn from a pool of population that is easy to reach or contact—was used in this study. This type of sampling is useful for pilot testing. The sample corresponds to students studying Industrial Engineering, Mechanical Engineering, Mining Engineering, Civil Engineering, and Environmental Engineering at the University of La Serena, Chile. These branches of engineering were selected because they include subjects in which electrical circuits are taught. Student participation was voluntary, not associated with evaluation, and students were not offered extra scores to participate in the study. The prototype of the AR app was used in a guided session with the students. The pilot test has been widely used to determine behavioral intention in AR apps [
23,
24,
51,
64,
65,
66,
67].
The research took place in March 2020. The experience and the survey were carried out in an ad hoc laboratory implemented using tablets. In the beginning, a 3 min video was shown that demonstrated how the interactive AR app worked. Then, the students experimented interacting with the app for 30 min, performing various guided exercises (similar to other studies of AR acceptance in education [
35,
48,
68] and other fields [
51,
67]). Students understood different types of current intensity behaviors while practicing with serial or parallel circuits and modifying values of voltage and resistance. Moreover, students were able to interact with the app freely. At the end of the experience, the survey was conducted. Anonymity and strict confidentiality of data were guaranteed.
5. Results
The survey had 190 respondents, of which 115 were males and 75 were females. The average age was 21 years, and the students were in their third or fourth academic year. In terms of the engineering field, 77 were industrial engineering students, while 38, 32, 26, and 17 were students from mining, mechanical, civil, and environmental engineering, respectively.
As the loadings of each indicators’ variance inflation factor is lower than 3.3, Cronbach’s alpha and Dijkstra–Henseler’s rho for each construct are greater than 0.7, the constructs’ composite reliabilities are also higher than 0.7, and as their average variance extracted is above 0.5 (
Table 2), reliability, convergent validity, and variance inflation factor requirements are satisfied [
69,
70,
71]. Analyzing Fornell–Larcker criterion, the square root of the average variance extracted from each construct is greater than its correlation with any other construct (
Table 3). The Heterotrait–Monotrait ratio of correlations is below 1.0 (
Table 4). Therefore, discriminant validity is achieved according to Fornell–Larcker criterion and the Heterotrait–Monotrait ratio [
58,
72,
73].
To assess the goodness of fit in the estimated model, we follow the procedure proposed by Dijkstra and Henseler [
74]. The standardized root mean squared residual for the model should be below 0.10, as argued by Williams et al. [
55] and corroborated by Ringle et al. [
75]. The deviations are not significant because the 99% bootstrap quantiles of the values of the three measures, the standardized root mean squared residual (0.065), the unweighted least squares discrepancy (1.085), and the geodesic discrepancy (0.243) were more significant than the original values [
58].
Table 5 lists the R
2 values, which are significant and greater than 0.1 for each of the latent variables [
76]. The Stone–Geisser coefficient (Q
2) is also presented, which was estimated by blindfolding [
77]. Each variable has a predictive relevance with values greater than 0, that is, high predictive validity [
78]. Therefore, R
2 values and Stone–Geisser’s Q
2 values have a satisfactory predictive power [
70,
79]. The results are consistent with those in other studies capturing TAM’s predictive power in the educational setting [
80,
81]. The results obtained for the model are presented in
Table 6 and depicted in
Figure 3. Eight hypotheses are accepted, while two are rejected.
6. Discussion
Students’ technology optimism depends on a small range of subjective norms (R2 = 0.162; H1). This indicates that there would be other factors that help to better explain this factor.
Technology innovativeness depends moderately on subjective norms and technology optimism (R2 = 0.240; H2 and H3). Technology optimism has a statistically significant complementary mediation between subjective norms and technology innovativeness. The direct effect of subjective norms on technology innovativeness is 0.164, while the indirect effect because of technology optimism is 0.161 (0.403 × 0.400). This implies that technology optimism explains approximately half of the impact that subjective norms have on technology innovativeness.
Perceived usefulness is dependent on technology optimism and perceived ease of use (R2 = 0.400; H4 and H7). However, perceived ease of use (0.564) has a more significant impact than technology optimism (0.200), which indicates that the students relate the level of ease in using an app, given its usefulness to achieve more significant learning.
Attitude toward using is dependent on perceived usefulness and technology innovativeness (R2 = 0.429; H6 and H9). Perceived usefulness (0.476) has a greater impact than technology innovativeness (0.208), implying that students must be clear about the app’s usefulness for their studies and be willing to use it. However, technology optimism and perceived ease of use have no statistically significant impact on attitude toward using (H5 and H8).
Technology optimism has an indirect effect on attitude toward using, which is caused by the moderation of technology innovativeness (0.400 × 0.208 = 0.083) and perceived usefulness (0.200 × 0.476 = 0.095), although both these effects are negligible.
Although perceived ease of use does not have a statistically significant effect on attitude toward using, a complete mediation is produced by perceived usefulness (0.564 × 0.476 = 0.268), which means that the app should not only be easy to use but also be found useful by students in improving their academic performance.
Finally, the results show that behavioral intention to use strongly depends on attitude toward using (R2 = 0.570; H10). From the model, behavioral intention to use is expected to increase by approximately 0.755 when the attitude toward using factor increases by one.
6.1. Theoretical Contributions
In this study, we proposed an extended model of the TAM to explore factors that may influence the intention of use of an AR app by students (digital natives). Many studies have investigated the technological adoption of AR. However, few have considered the educational field, more specifically, engineering.
Moreover, few studies have emphasized students’ characteristics, such as technology optimism and technology innovativeness, which are especially important because students are now digital natives. The inclusion of subjective norms also becomes relevant to determine if they influence students’ evaluated characteristics, and eventually, in adopting this technology. As these are factors independent of the technology being assessed, the results can have an important implication in adopting other technologies.
Thus, we presented an extended TAM incorporating factors not studied in this context. This modification provides additional information on the acceptance of AR technology, identifying factors external to the technology and specific to the users. Particularly, in this case, the student’s environment may affect the student’s disposition or beliefs about technologies, which may impact the acceptance of a particular technology.
Hence, these findings help us understand the motivations and foundations that university students (digital natives) have in adopting AR technology in the future in the academic environment.
Finally, the results show that TAM remains valid and with a satisfactory predictive level when evaluated in an educational context. However, a study using an app with a poor design (e.g., less interactivity, aesthetics) may not reach the same conclusions.
As a limitation, this study was conducted in Chile in a developing country context. However, it may allow comparison and complement other studies conducted in other countries with different realities in the future.
6.2. Practical Implications
In general, the findings demonstrate that personal and environmental aspects influence the willingness to use the app. This implies that higher education institutions can influence their students to adopt new technologies and convince them that their use will help improve their academic performance. This could be achieved by disseminating the encouraging results because of the inclusion of this technology in education. The ease of use of the app influences the perception that students have about its usefulness. Therefore, this aspect should be considered when developing apps in this area.
However, the willingness of students to use this technology depends on how many students believe that they can improve their academic performance by using it and not how easy they think it is to use the app. This is consistent with the findings of Arvanitis et al. [
82], who used an app in science education, and Wojciechowski et al. [
48], who used an app in the field of chemistry. As the study by Ibañez et al. [
35] had to remove the attitude toward using construct, their results cannot be compared. However, these findings differ from those in other areas such as tourism [
47,
64], where the attitude toward using is influenced by perceived ease of use and not by perceived usefulness. This is logical because when a person uses an app to study, they expect it to impact academic results positively. By contrast, when that person uses an app in a more playful environment, other factors, such as how easy it is to use that app, motivate them.
7. Conclusions
In this paper, we presented an extended TAM to determine factors that explain AR technology acceptance in engineering education. An AR app to analyze direct current in resistive circuits was developed to test the model.
The findings suggest that the academic environment can influence beliefs concerning the use of technologies and reflect how students could be affected by important role models. For example, if faculty and friends have a favorable opinion about the early adoption of technologies, students will be more willing to use new technologies. Similarly, if the student is in an environment where the benefits of using technologies by faculty and friends are valued, then he or she will have a favorable view of their use and will believe that it is convenient to use these technologies.
The findings also suggest that students would be willing to use this app if they find it useful, not just easy to use. Therefore, we suggest that the studies demonstrating that AR improves academic performance should be disseminated among educational communities.
As future work, we recommend considering relevant characteristics of this technology (e.g., interactivity levels, application stability) to analyze their influence on its acceptance. Given that we have demonstrated the direct effect of technology innovativeness in our proposed model, we also suggest investigating its moderating effect. Further, determining the variables that explain the intention of use by academics and addressing the impact on academic performance is also recommended.


