
The Friendly Health Issue Network to Support Computer-Assisted Education for Clinical Reasoning in Multimorbidity Patients

 ,
,  ,
, 
Abstract
:1. Introduction
2. Theoretical Background
2.1. Clinical Reasoning
2.2. Computer-Based Medical Education
3. HIN: A Formal Background
3.1. The Petri Nets for Modelling Health Evolutions
- It is based on two fundamental concepts, HI and evolution. The transition from one HI to another occurs through a well-defined evolution;
- It is generated by the entire additional set of evolutions connecting the patient’s HIs. At any given time, the set of active HIs identify the specific health status of the patient: this implies that the clinical history can be considered as a linear system;
- It can comprise independent sub-histories, therefore, it can be considered as a discrete distributed system: the evolution of an HI may be independent of (or may overlap with) another evolution;
- It is an asynchronous system because even though concurrent evolutions can occur, HIs are only accounted to evolve one per time. Accordingly, every single evolution is only capable to partially and locally affect the whole clinical history;
- It is a system without memory because the identification of the new potential evolutions from a given health status does not depend on how such status has been reached.
3.2. Main Features of HIN
4. The f-HINe Model
- f-HINe can have isolated nodes (i.e., non-developing HIs);
- Minimum f-HINe consists of only one HI node;
- f-HINe is a diagram with direct edges;
- f-HINe can be unconnected, i.e., made up of both several connected diagram parts (one per each developing HI) and isolated nodes;
- f-HINe features no cycles, except for recurrences;
- The static branch node is only an intermediate node and is always connected to HI nodes;
- Between two HIs there can at most stand one and only one evolution.
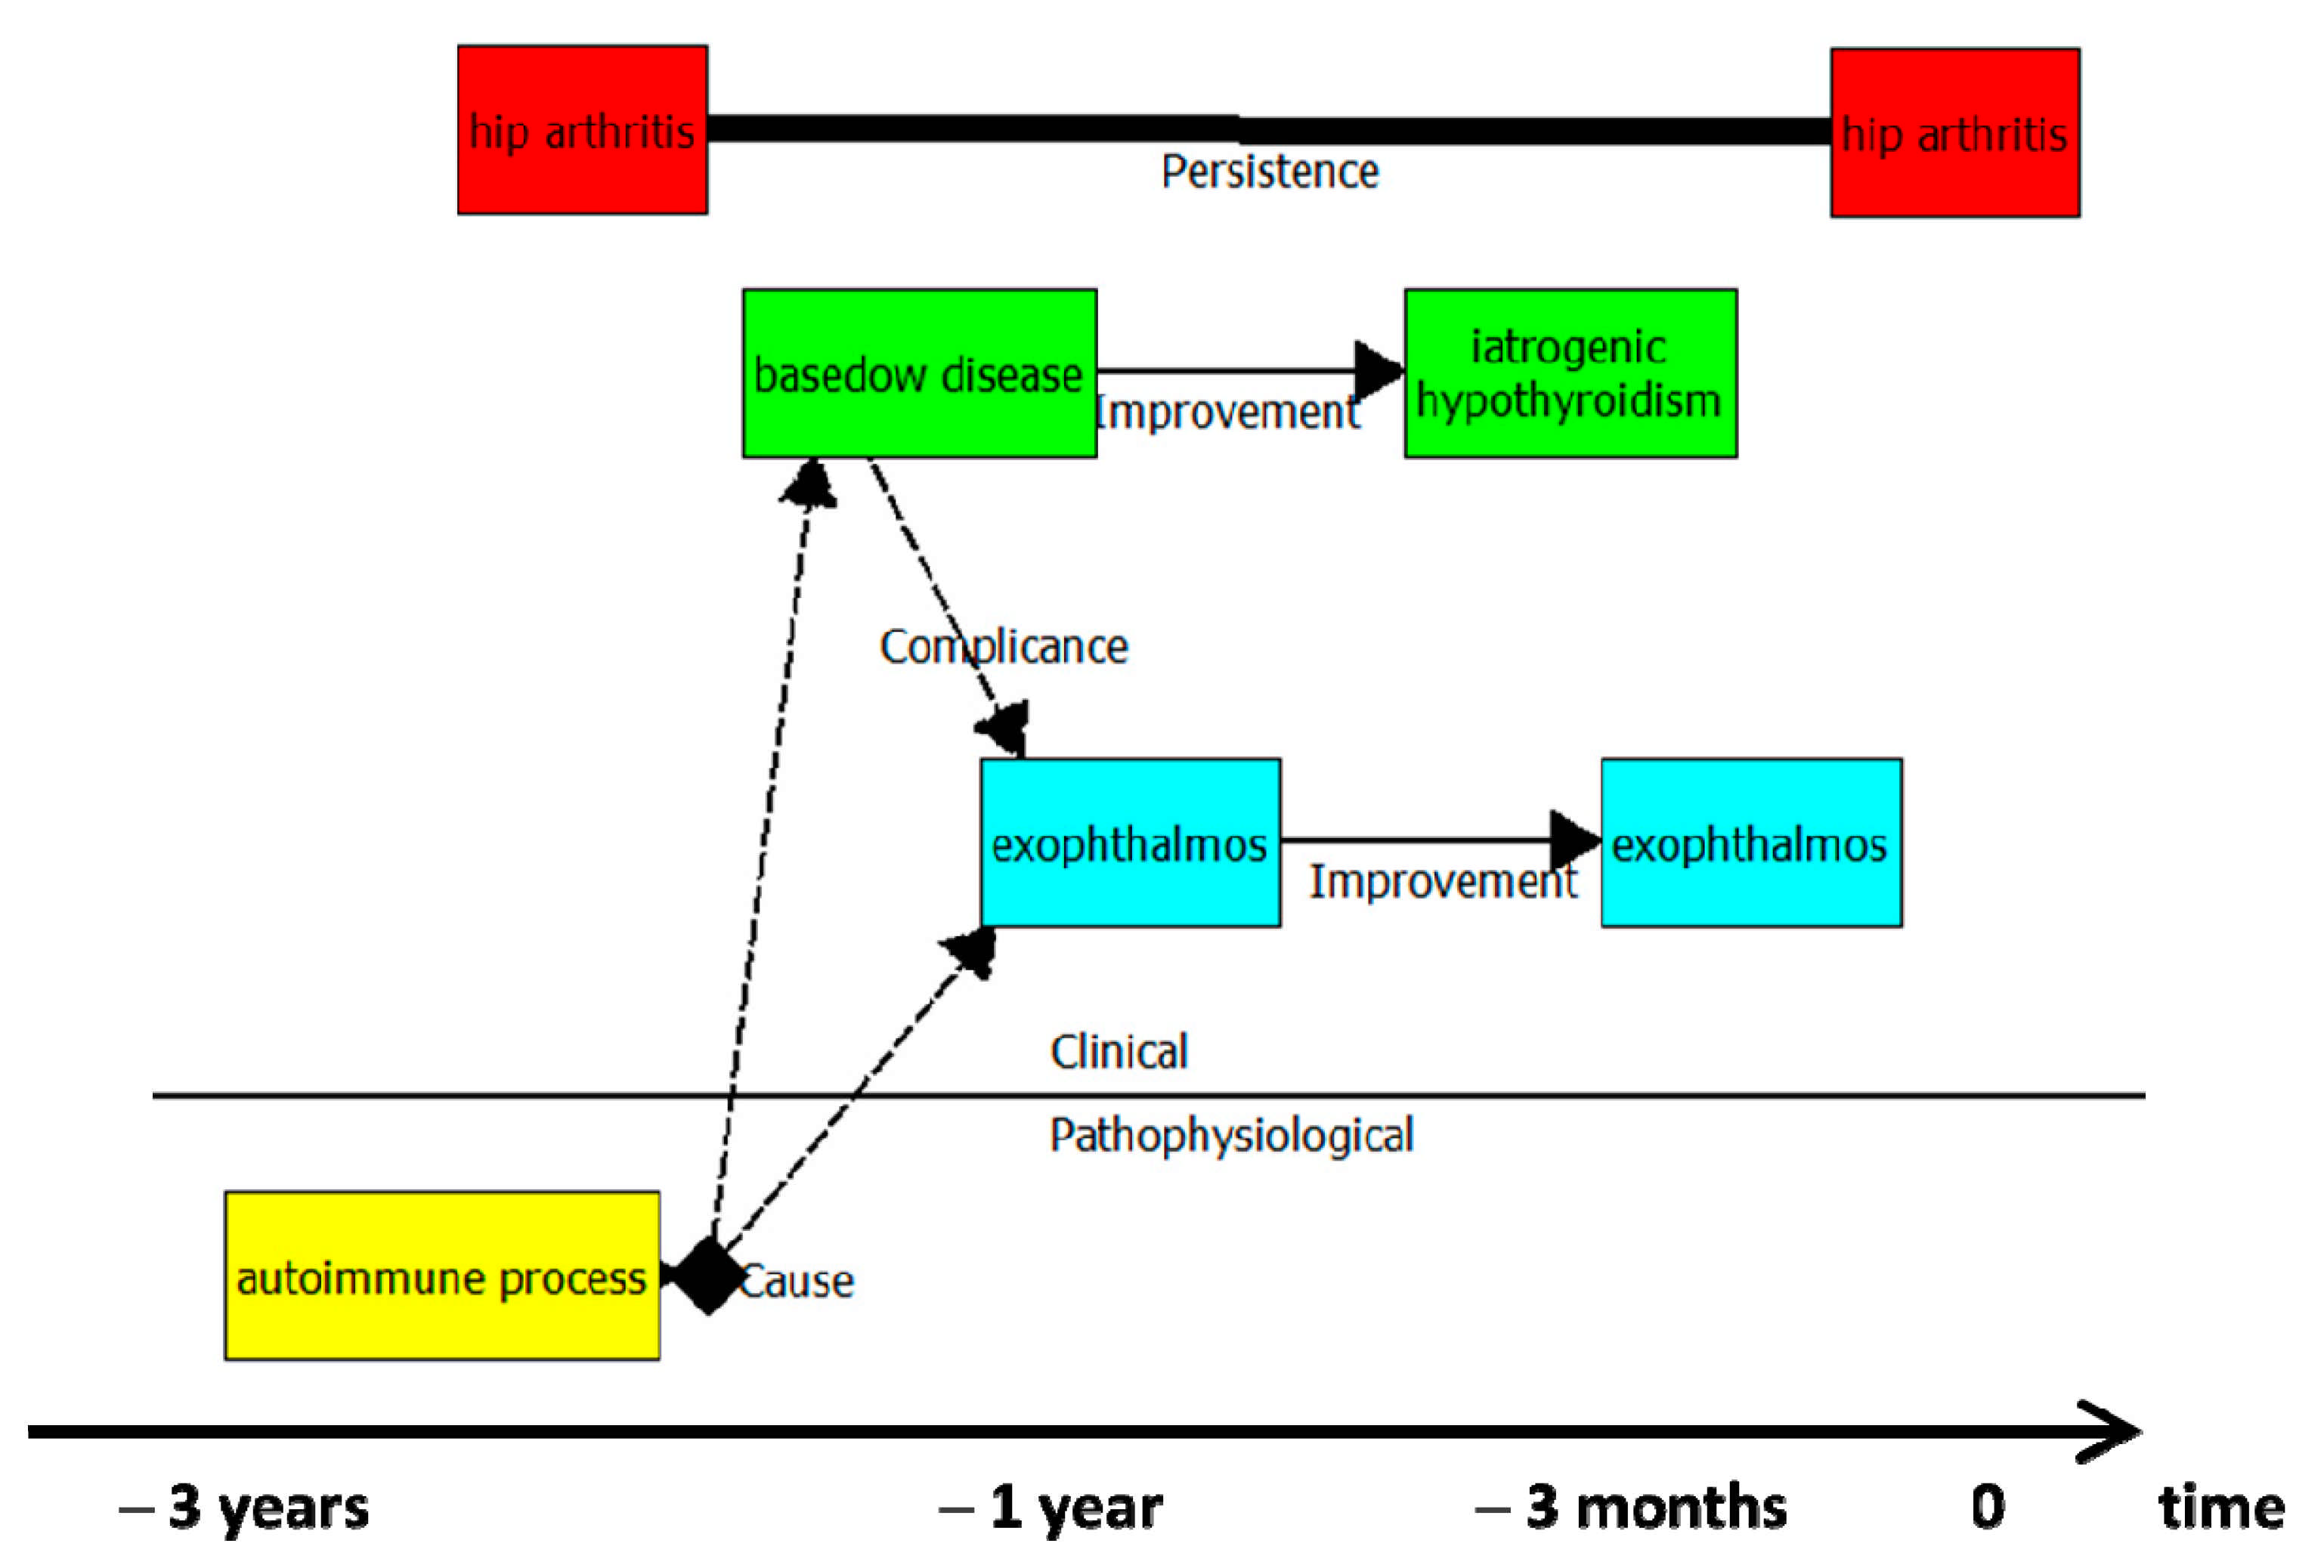
- red colour identifies issues that do not interfere with the remainder clinical evolutionary pathway; green is for endocrinological issues; light blue means ocular issues; yellow marks instead immunological pathophysiological conditions;
- the autoimmune process (pathophysiological issue) stands as the cause of clinical conditions;
- the clinical history depicted span over three years.
- Many details (the medication for arterial hypertension, the level of pain and muscle stiffness for the hip arthrosis) are “hidden” in the diagram but accessible to the user through the sheets associated with each HI and evolution;
- A difference exists between the evolution “recurrence” (see the non-complicated diverticular disease) and the “worsening-improvement” commuting dynamic (see hip arthrosis). While for the latter, the manifestations of the disease do not disappear, in the former each extemporaneous manifestation of the disease is independent of the previous/the following ones.
5. Software Application for The Design of f-HINe Diagrams
5.1. Introduction
5.2. Editor
- Each HI node has at most one input transition [0:1], excluding recurrences;
- Each HI node can have at most one integer output transition and unlimited dashed transitions (i.e., cause, complication, comorbidity);
- The aggregator node must have either two input or output transitions;
- The aggregator node must have at least one input and one output transition;
- If the inputs to an aggregator node are all dashed, then the output transitions are all dashed. If there is at least one solid input transition, then the output transitions are all solids;
- Input transitions of an aggregator must be of the same type (one type for dashed lines and one for solid lines);
- Output transitions of an aggregator must be either all solids or all dashed and report the same name;
- A transition cannot connect two aggregator nodes;
- A ‘Persistence’ transition can only connect two HI nodes;
- A ‘Persistence’ transition can only connect two HI nodes with the same health problem;
- Nodes connected to a ‘Persistence’ transition cannot have recurrences.
- {2} → {3}, worsening (Wo)
- {3} → {4}, cause with comorbidity (Ca1)
- {4} → {6}, cause (Ca2)
- {4} → {7}, cause (Ca2)
- {3} → {5}, cause (Ca3)
- {1} → {4}, cause with comorbidity (Ca1)
- {5} → {8}, examining in-depth with comorbidity (Ex)
- {7} → {8}, examining in-depth with comorbidity (Ex)
- {6} → {8}, examining in-depth with comorbidity (Ex)
- Type 2 Diabetes Mellitus & Food contamination → Chronic infection from helicobacter pylori → Epigenetic alterations → Epigenetic alterations → Epigenetic alterations & Anorexia → Gastric carcinoma;
- Type 2 Diabetes Mellitus & Food contamination → Chronic infection from helicobacter pylori → Epigenetic alterations → Epigenetic alterations & Anorexia → Epigenetic alterations → Gastric carcinoma.
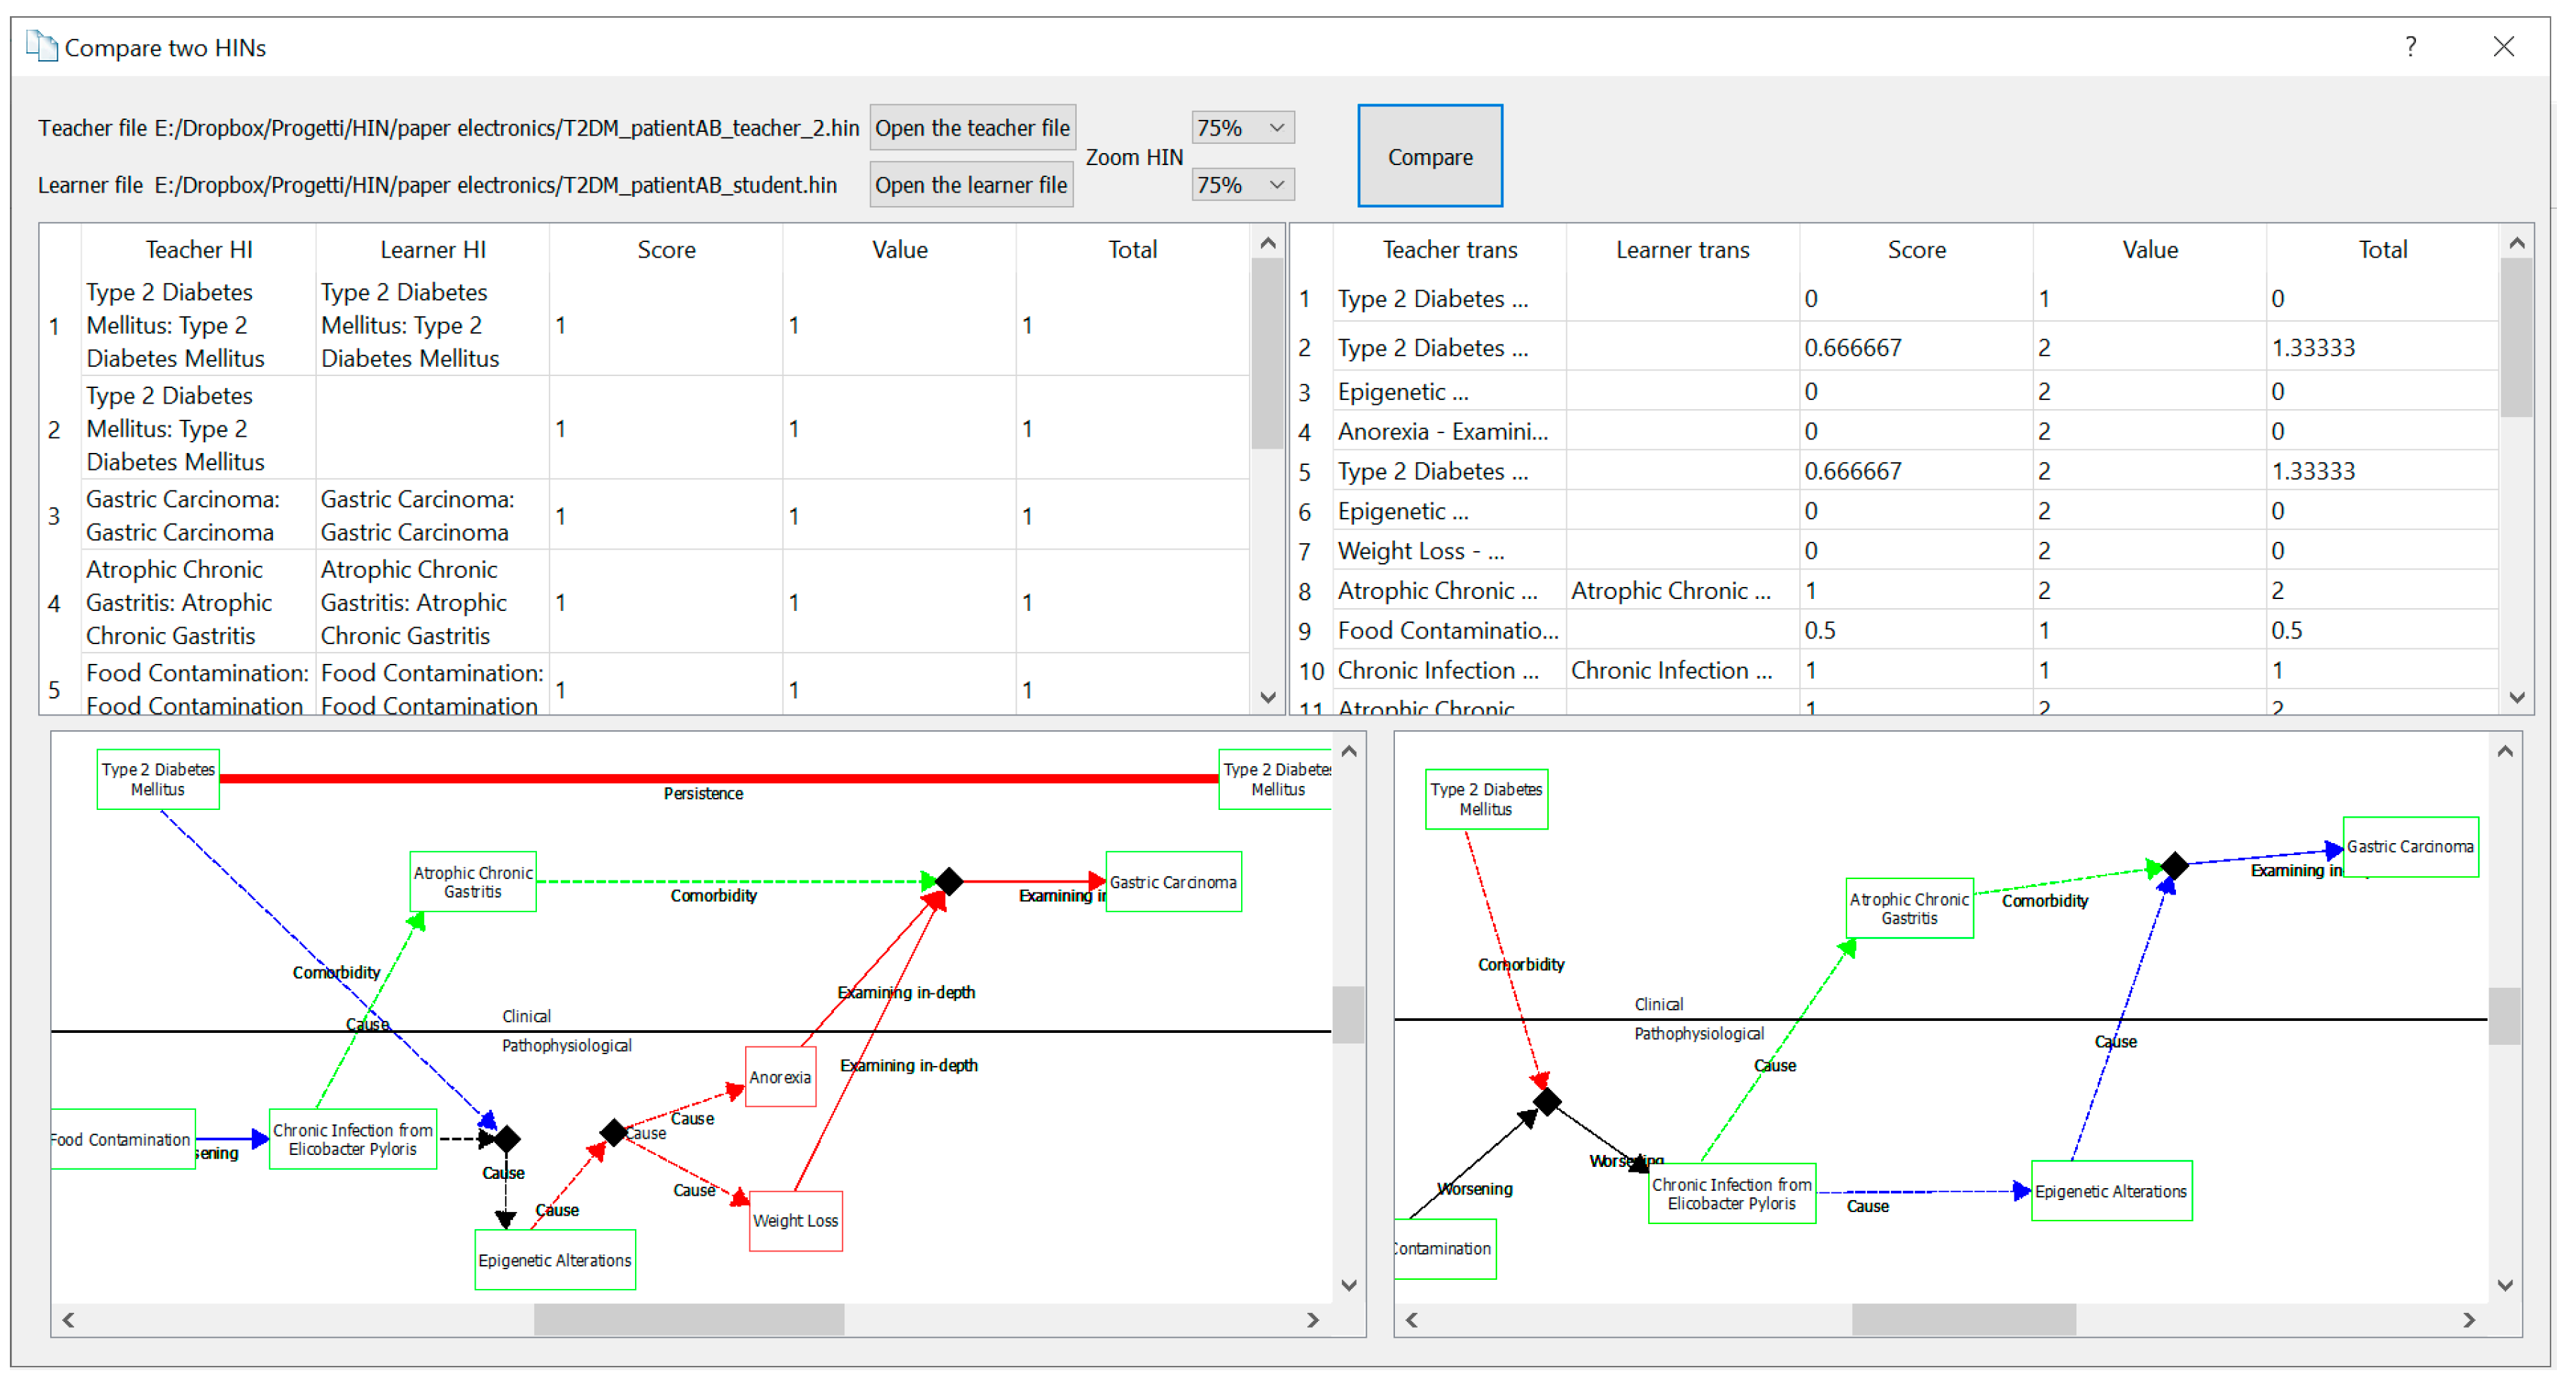
5.3. Comparator
6. Discussion
7. Conclusions and Prospects
- Testing of the f-HINe model and the related fHINscene software as an innovative teaching method in the Departments of Public Health, and Veterinary Medicine and Animal Production, at the “Federico II” University of Naples.
- Further investigations to improve the retrieval of clinical cases from the GP’s EHRs that do not conform to the POMRs to make exercises based on the f-HINe diagram representing a real clinical case.
- Testing the possibility of incorporating the clinical history of a patient, drawn by f-HINe, with the related care pathway, to highlight the links between clinical-diagnostic reasoning and the various diagnostic–therapeutic phases followed by the patient in a primary care environment based on the social-health integration.
- Validating the f-HINe model and the related fHINscene software as an environment for the assessment of the CRM ability, through exercises based on the interpretation, completion, and design of HINs. In this regard, the ability of the software to compare two HINs and measure their “distance” is fundamental, because of the high number of students attending clinical courses. The functionality of comparison between the teacher’s and student’s solution could greatly alleviate the teachers’ workload for correcting the assignments. Studies are underway to extend the rules developed in the editor and comparator modules of the fHINscene software.
Author Contributions
Funding
Acknowledgments
Conflicts of Interest
References
- Eva, K.W. What every teacher needs to know about clinical reasoning. Med. Educ. 2005, 39, 98–106. [Google Scholar] [CrossRef]
- Croskerry, P. A universal model of diagnostic reasoning. Acad. Med. 2009, 84, 1022–1028. [Google Scholar] [CrossRef]
- Posel, N.; Mcgee, J.B.; Fleiszer, D.M. Twelve tips to support the development of clinical reasoning skills using virtual patient cases. Med. Teach. 2015, 37, 813–818. [Google Scholar] [CrossRef]
- Durning, S.J.; Artino, A.R., Jr.; Schuwirth, L.; van der Vleuten, C. Clarifying assumptions to enhance our understanding and assessment of clinical reasoning. Acad. Med. 2013, 88, 442–448. [Google Scholar] [CrossRef] [PubMed]
- Vetrano, D.L.; Roso-Llorach, A.; Fernández, S.; Guisado-Clavero, M.; Violán, C.; Onder, G.; Fratiglioni, L.; Calderón-Larrañaga, A.; Marengoni, A. Twelve-year clinical trajectories of multimorbidity in a population of older adults. Nat. Commun. 2020, 11, 1–9. [Google Scholar] [CrossRef] [PubMed]
- Boyd, C.M.; Fortin, M. Future of multimorbidity research: How should understanding of multimorbidity inform health system design? Public Health Rev. 2010, 32, 451–474. [Google Scholar] [CrossRef] [Green Version]
- Coleman, K.; Austin, B.T.; Brach, C.; Wagner, E.H. Evidence on the chronic care model in the new millennium. Health Aff. 2009, 28, 75–85. [Google Scholar] [CrossRef] [PubMed] [Green Version]
- Dawes, M. Co-morbidity: We need a guideline for each patient not a guideline for each disease. Fam. Pract. 2010, 1, 1–2. [Google Scholar] [CrossRef]
- Salisbury, C. Multimorbidity: Redesigning health care for people who use it. Lancet 2012, 380, 7–9. [Google Scholar] [CrossRef]
- Barnett, K.; Mercer, S.W.; Norbury, M.; Watt, G.; Wyke, S.; Guthrie, B. Epidemiology of multimorbidity and implications for health care, research, and medical education: A cross-sectional study. Lancet 2012, 380, 37–43. [Google Scholar] [CrossRef] [Green Version]
- Doessing, A.; Burau, V. Care coordination of multimorbidity: A scoping study. J. Comorbidity 2015, 5, 15–28. [Google Scholar] [CrossRef] [Green Version]
- De Clercq, P.A.; Blom, J.A.; Korsten, H.H.; Hasman, A. Approaches for creating computer-interpretable guidelines that facilitate decision support. Artif. Intell. Med. 2004, 31, 1–27. [Google Scholar] [CrossRef]
- Peleg, M. Computer-interpretable clinical guidelines: A methodological review. J. Biomed. Inform. 2013, 46, 744–763. [Google Scholar] [CrossRef] [PubMed] [Green Version]
- Riaño, D.; Ortega, W. Computer technologies to integrate medical treatments to manage multimorbidity. J. Biomed. Inform. 2017, 75, 1–3. [Google Scholar] [CrossRef] [PubMed]
- Boudko, S.; Leister, W. Treatment pathways as petri nets in patient workflow management. In Proceedings of the 19th International Conference on Information Integration and Web-Based Applications & Services, Salzburg, Austria, 4–6 December 2017. [Google Scholar]
- Zeinalnezhad, M.; Chofreh, A.G.; Goni, F.A.; Klemeš, J.J.; Sari, E. Simulation and improvement of patients’ workflow in heart clinics during covid-19 pandemic using timed colored petri nets. Int. J. Environ. Res. Public Health 2020, 17, 8577. [Google Scholar] [CrossRef]
- Kang, C.W.; Imran, M.; Omair, M.; Ahmed, W.; Ullah, M.; Sarkar, B. Stochastic-petri net modeling and optimization for outdoor patients in building sustainable healthcare system considering staff absenteeism. Mathematics 2019, 7, 499. [Google Scholar] [CrossRef] [Green Version]
- Oueida, S.; Kotb, Y.; Aloqaily, M.; Jararweh, Y.; Baker, T. An edge computing based smart healthcare framework for resource management. Sensors 2018, 18, 4307. [Google Scholar] [CrossRef] [PubMed] [Green Version]
- Beccuti, M.; Bottrighi, A.; Franceschinis, G.; Montani, S.; Terenziani, P. Modeling clinical guidelines through Petri Nets. In Conference on Artificial Intelligence in Medicine in Europe; Springer: Berlin/Heidelberg, Germany, 2009; pp. 61–70. [Google Scholar]
- Piemme, T.E. Computer-assisted learning and evaluation in medicine. JAMA 1988, 260, 367–372. [Google Scholar] [CrossRef]
- Hussein, R.; Lin, E.C.; Grindrod, K. Effects of computer-based education on health professionals’ knowledge, skills, and behavior: A scoping review. J. Am. Pharm. Assoc. 2021, 61, e44–e68. [Google Scholar] [CrossRef]
- Ricci, F.L.; Consorti, F.; Pecoraro, F.; Luzi, D.; Mingarelli, V.; Tamburis, O. HIN-Health Issue Network as Means to Improve Case-Base Learning in Health Sciences Education. Stud. Health Technol. Inform. 2018, 255, 262–266. [Google Scholar]
- Royce, C.S.; Hayes, M.M.; Schwartzstein, R.M. Teaching critical thinking: A case for instruction in cognitive biases to reduce diagnostic errors and improve patient safety. Acad. Med. 2019, 94, 187–194. [Google Scholar] [CrossRef]
- O’Sullivan, E.D.; Schofield, S. Cognitive bias in clinical medicine. J. R. Coll. Physicians Edinb. 2018, 48, 225–231. [Google Scholar] [CrossRef] [PubMed]
- Pelaccia, T.; Tardif, J.; Triby, E.; Charlin, B. An analysis of clinical reasoning through a recent and comprehensive approach: The dual-process theory. Med. Educ. Online 2011, 16, 5890. [Google Scholar] [CrossRef] [PubMed]
- Young, M.E.; Thomas, A.; Lubarsky, S.; Gordon, D.; Gruppen, L.D.; Rencic, J.; Ballard, T.; Holmboe, E.; Da Silva, A.; Ratcliffe, T.; et al. Mapping clinical reasoning literature across the health professions: A scoping review. BMC Med. Educ. 2020, 20, 1. [Google Scholar] [CrossRef] [PubMed] [Green Version]
- Durning, S.J.; Artino, A.R.; Boulet, J.R.; Dorrance, K.; van der Vleuten, C.; Schuwirth, L. The impact of selected contextual factors on experts’ clinical reasoning performance (does context impact clinical reasoning performance in experts?). Adv. Health Sci. Educ. Theory Pract. 2012, 17, 65–79. [Google Scholar] [CrossRef] [PubMed]
- Croskerry, P. Critical thinking and reasoning in emergency medicine. In Patient Safety in Emergency Medicine; Croskerry, P., Cosby, K.S., Schenkel, S.M., Wears, R.L., Eds.; Lippincott Williams & Wilkins: Philadelphia, PA, USA, 2008; pp. 213–218. [Google Scholar]
- Barrows, H.S.; Norman, G.R.; Neufeld, V.R.; Feightner, J.W. The clinical reasoning of randomly selected physicians in general medical practice. Clin. Invest. Med. 1982, 5, 49–55. [Google Scholar]
- Tricco, A.C.; Lillie, E.; Zarin, W.; O’Brien, K.K.; Colquhoun, H.; Levac, D.; Moher, D.; Peters, M.D.J.; Horsley, T.; Weeks, L.; et al. PRISMA Extension for Scoping Reviews (PRISMA-ScR): Checklist and Explanation. Ann. Intern. Med. 2018, 169, 467–473. [Google Scholar] [CrossRef] [Green Version]
- Cook, D.A.; Durning, S.J.; Sherbino, J.; Gruppen, L.D. Management Reasoning: Implications for Health Professions Educators and a Research Agenda. Acad. Med. 2019, 94, 1310–1316. [Google Scholar] [CrossRef] [PubMed]
- Audétat, M.C.; Cairo Notari, S.; Sader, J.; Ritz, C.; Fassier, T.; Sommer, J.M.; Nendaz, M.; Caire-Fon, N. Understanding the clinical reasoning processes involved in the management of multimorbidity in an ambulatory setting: Study protocol of a stimulated recall research. BMC Med. Educ. 2021, 21, 31. [Google Scholar] [CrossRef]
- Jayasinghe, S. Describing complex clinical scenarios at the bed-side: Is a systems science approach useful? Exploring a novel diagrammatic approach to facilitate clinical reasoning. BMC Med. Educ. 2016, 16, 264. [Google Scholar] [CrossRef] [Green Version]
- Car, J.; Carlstedt-Duke, J.; Car, L.T.; Posadzki, P.; Whiting, P.; Zary, N.; Atun, R.; Majeed, A.; Campbell, J. Digital Health Education Collaboration. Digital education in health professions: The need for overarching evidence synthesis. J. Med. Internet Res. 2019, 21, e12913. [Google Scholar] [CrossRef] [PubMed]
- Kyaw, B.M.; Posadzki, P.; Dunleavy, G.; Semwal, M.; Divakar, U.; Hervatis, V.; Car, L.T. Offline digital education for medical students: Systematic review and meta-analysis by the Digital Health Education Collaboration. J. Med. Internet Res. 2019, 21, e13165. [Google Scholar] [CrossRef] [Green Version]
- Sen, A.; Leong, C.K.C. Technology-Enhanced Learning. In Encyclopedia of Education and Information Technologies; Tatnall, A., Ed.; Springer: Cham, Switzerland, 2020. [Google Scholar]
- Cook, D.A.; Hatala, R.; Brydges, R. Technology-enhanced simulation for health professions education: A systematic review and meta-analysis. JAMA 2011, 306, 978–988. [Google Scholar] [CrossRef]
- Kononowicz, A.A.; Woodham, L.A.; Edelbring, S.; Stathakarou, N.; Davies, D.; Saxena, N.; Tudor Car, L.; Carlstedt-Duke, J.; Car, J.; Zary, N. Virtual Patient Simulations in Health Professions Education: Systematic Review and Meta-Analysis by the Digital Health Education Collaboration. J. Med. Internet Res. 2019, 21, e14676. [Google Scholar] [CrossRef]
- Thistlethwaite, J.E.; Davies, D.; Ekeocha, S.; Kidd, J.M.; MacDougall, C.; Matthews, P.; Purkis, J.; Clay, D. The effectiveness of case-based learning in health professional education. A BEME systematic review: BEME Guide No. 23. Med. Teach. 2012, 34, e421–e444. [Google Scholar] [CrossRef]
- Wahabi, H.A.; Esmaeil, S.A.; Bahkali, K.H.; Titi, M.A.; Amer, Y.S.; Fayed, A.A.; Jamal, A.; Zakaria, N.; Siddiqui, A.R.; Semwal, M.; et al. Medical Doctors’ Offline Computer-Assisted Digital Education: Systematic Review by the Digital Health Education Collaboration. J. Med. Internet Res. 2019, 21, e12998. [Google Scholar] [CrossRef] [PubMed] [Green Version]
- Zis, P.; Artemiadis, A.; Bargiotas, P.; Nteveros, A.; Hadjigeorgiou, G.M. Medical studies during the COVID-19 pandemic: The impact of digital learning on medical students’ burnout and mental health. Int. J. Environ. Res. Public Health 2021, 18, 349. [Google Scholar] [CrossRef] [PubMed]
- Ricci, F.L.; Consorti, F.; Pecoraro, F.; Luzi, D.; Mingarelli, V.; Miotti, S.; Tamburis, O. Understanding Petri Nets in Health Sciences Education: The Health Issue Network Perspective. Stud. Health Technol. Inform. 2020, 270, 484–488. [Google Scholar] [PubMed]
- Peterson, J.L. Petri Net Theory and the Modeling of Systems; Prentice Hall: Hoboken, NJ, USA, 1981. [Google Scholar]
- Reisig, W. A Primer in Petri Net Design; Springer: Berlin/Heidelberg, Germany, 2012. [Google Scholar]
- Pais, R.; Gomes, L.; Barros, J.P. From UML state machines to Petri nets: History attribute translation strategies. In Proceedings of the IECON 2011-37th Annual Conference of the IEEE Industrial Electronics Society, Melbourne, Australia, 7 November 2011; pp. 3776–3781. [Google Scholar]
- Ricci, F.L.; Pecoraro, F.; Luzi, D.; Consorti, F.; Tamburis, O. A Straightforward Formalization of the HIN Model. IRPPS Working Paper 2020, 121, 1–31. [Google Scholar]
- European Network of Living Labs. Available online: https://enoll.org (accessed on 20 July 2021).
- Ricci, F.L.; Pecoraro, F.; Luzi, D.; Consorti, F.; Tamburis, O. HIN (Health Issue Network). Rete dei Problemi di Salute. Uso Delle Reti di Petri per L’educazione Nelle Scienze Mediche. IRPPS Working Paper 2020, 122, 1–40. [Google Scholar]
- World Organization of National Colleges, Academies, and Academic Associations of General Practitioners/Family Physicians. ICPC-2-R: International Classification of Primary Care, 2nd ed.; Oxford University Press: Oxford, UK; New York, NY, USA, 2005; ISBN 9780198568575. [Google Scholar]
- QT Company. QT Framework Version 5.14. Available online: https://www.qt.io/product/framework (accessed on 29 July 2021).
- Italian Ministry of Health. ICD-9-CM Italian Version 2007. Available online: https://www.salute.gov.it/portale/documentazione/p6_2_2_1.jsp?lingua=italiano&id=2251 (accessed on 29 July 2021).
- Daley, B.J.; Torre, D.M. Concept maps in medical education: An analytical literature review. Med. Educ. 2010, 44, 440–448. [Google Scholar] [CrossRef]
- Saeidifard, F.; Heidari, K.; Foroughi, M.; Soltani, A. Concept mapping as a method to teach an evidence-based educated medical topic: A comparative study in medical students. J. Diabetes Metab. Disord. 2014, 13, 86. [Google Scholar] [CrossRef] [Green Version]
- MacDermott, P.; Clarke, D.N.; McDermott, P.; Clarke, D.N. Mind Maps in Medicine; Churchill Livingstone: Edinburgh, UK, 1998; ISBN 9780443051951. [Google Scholar]
- Vilela, V.; Barbosa, L.; MirandaVilela, A.; Neto, L. The use of mind maps as support in medical education. J. Contemp. Med. Edu. 2013, 1, 199. [Google Scholar] [CrossRef]
- Middleton, S.; Roberts, A. Integrated Care Pathways: A Practical Approach to Implementation; Butterworth-Heinemann: Oxford, UK; Boston, MA, USA, 2000; ISBN 9780750640879. [Google Scholar]
- Pradhan, M.; Edmonds, M.; Runciman, W.B. Quality in healthcare: Process. Best Pract. Res. Clin. Anaesthesiol. 2001, 15, 555–571. [Google Scholar] [CrossRef]
- Beuscart-Zéphir, M.C.; Pelayo, S.; Anceaux, F.; Maxwell, D.; Guerlinger, S. Cognitive analysis of physicians and nurses cooperation in the medication ordering and administration process. Int. J. Med. Inform. 2007, 76, S65–S77. [Google Scholar] [CrossRef]
- Vincent, C.; Taylor-Adams, S.; Stanhope, N. Framework for analysing risk and safety in clinical medicine. BMJ 1998, 316, 1154–1157. [Google Scholar] [CrossRef] [PubMed] [Green Version]
- Jun, G.T.; Ward, J.; Morris, Z.; Clarkson, J. Health care process modelling: Which method when? Int. J. Qual. Health Care 2009, 21, 214–224. [Google Scholar] [CrossRef] [Green Version]
- Jun, G.T.; Ward, J.; Clarkson, P.J. Systems modelling approaches to the design of safe healthcare delivery: Ease of use and usefulness perceived by healthcare workers. Ergonomics 2010, 53, 829–847. [Google Scholar] [CrossRef] [Green Version]
- Leminen, S.; Westerlund, M.; Nyström, A.G. Living Labs as Open-Innovation Networks. Technol. Innov. Manag. Rev. 2021, 2, 6–11. [Google Scholar] [CrossRef]
- Favela, J.; Kaye, J.; Skubic, M.; Rantz, M.; Tentori, M. Living labs for pervasive healthcare research. IEEE Pervasive Comput. 2015, 14, 86–89. [Google Scholar] [CrossRef]
- Scally, G.; Donaldson, L.J. Clinical governance and the drive for quality improvement in the new NHS in England. Br. Med. J. 1998, 317, 61–65. [Google Scholar] [CrossRef]
- Colin-Thomé, D. Development opportunities in the “new” NHS for personal, population and system care: The coming of age for clinical governance? Clin. Gov. Int. J. 2013, 18, 6–17. [Google Scholar] [CrossRef]
- Liyanage, H.; Luzi, D.; de Lusigan, S.; Pecoraro, F.; McNulty, R.; Tamburis, O.; Krause, P.; Rigby, M.; Blair, M. Accessible Modelling of Complexity in Health (AMoCH) and associated data flows: Asthma as an exemplar. J. Innov. Health Inform. 2016, 23, 433–438. [Google Scholar] [CrossRef] [Green Version]
- Checkland, P. Soft Systems Methodology: A Thirty Year Retrospective. Syst. Res. Behav. Sci. 2000, 17, S11–S58. [Google Scholar] [CrossRef]
- Checkland, P.; Poulter, J. Soft systems methodology. In Systems Approaches to Managing Change: A Practical Guide; Springer: London, UK, 2010; pp. 191–242. [Google Scholar]
- Berg, M.; Aarts, J.; van der Lei, J. ICT in health care: Sociotechnical approaches. Methods Inf. Med. 2003, 42, 297–301. [Google Scholar] [CrossRef] [PubMed]
- Lamp, J. Using Petri Nets to model weltanschauung alternatives In Soft Systems Methodology. In Proceedings of the Third Australian Conference on Requirements Engineering ACRE’98, Geelong, Australia, 26–27 October 1998. [Google Scholar]
- Cook, D.A.; Levinson, A.J.; Garside, S.; Dupras, D.M.; Erwin, P.J.; Montori, V.M. Instructional design variations in internet–based learning for health professions education: A systematic review and meta-analysis. Acad. Med. 2010, 85, 909–922. [Google Scholar] [CrossRef] [PubMed] [Green Version]
- Sinclair, P.M.; Kable, A.; Levett-Jones, T.; Booth, D. The effectiveness of Internet-based e-learning on clinician behaviour and patient outcomes: A systematic review. Int. J. Nurs. Stud. 2016, 1, 70–81. [Google Scholar] [CrossRef]
- Hudson, J.N. Computer-aided learning in the real world of medical education: Does the quality of interaction with the computer affect student learning? Med. Educ. 2004, 38, 887–895. [Google Scholar] [CrossRef] [PubMed]
- Nathoo, A.N.; Goldhoff, P.; Quattrochi, J.J. Evaluation of an interactive case-based online network (ICON) in a problem based learning environment. Adv. Health Sci. Educ. 2005, 10, 215–230. [Google Scholar] [CrossRef]
- Hege, I.; Ropp, V.; Adler, M.; Radon, K.; Mäsch, G.; Lyon, H.; Fischer, M.R. Experiences with different integration strategies of case-based e-learning. Med. Teach. 2007, 29, 791–797. [Google Scholar] [CrossRef] [PubMed]
- Benis, A.; Tamburis, O.; Chronaki, C.; Moen, A. One Digital Health: A unified framework for future health ecosystems. J. Med. Internet Res. 2021, 23, e22189. [Google Scholar] [CrossRef] [PubMed]
- Podder, V.; Dhakal, B.; Shaik, G.U.; Sundar, K.; Sivapuram, M.S.; Chattu, V.K.; Biswas, R. Developing a case-based blended learning ecosystem to optimize precision medicine: Reducing overdiagnosis and overtreatment. Healthcare 2018, 6, 78. [Google Scholar] [CrossRef] [PubMed] [Green Version]
- Jin, J.; Bridges, S.M. Educational technologies in problem-based learning in health sciences education: A systematic review. J. Med. Internet Res. 2014, 16, e251. [Google Scholar] [CrossRef] [PubMed]
- Prosser, M.; Sze, D. Problem-based learning: Student learning experiences and outcomes. Clin. Linguist. Phon. 2014, 28, 131–142. [Google Scholar] [CrossRef]


| Type of Evolution | f-HINe Primitive | Examples |
|---|---|---|
| Recurrence |  | A = acute diverticulitis Evolution = recurrence Meaning = the patient had recurrent episodes of acute diverticulitis |
| Worsening/Examining in-depth/Improvement | 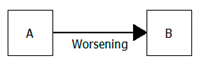 | A = 2nd degree kidney failure B = 3rd degree kidney failure Evolution = worsening Meaning = a 2nd degree kidney failure worsened into a 3rd degree A = abdominal pain B = acute appendicitis Evolution = examining in-depth Meaning = an abdominal pain was interpreted as an acute appendicitis |
| Complication/Cause | 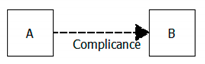 | A = diabetes B = diabetic foot Evolution = complication Meaning = diabetes complicates with a diabetic foot |
| Worsening with co-morbidity |  | A = mild dementia B = severe dementia C = pneumonia Evolution = worsening with comorbidity Meaning = dementia of a patient worsened after the onset of a pneumonia |
| Complication with co-morbidity | 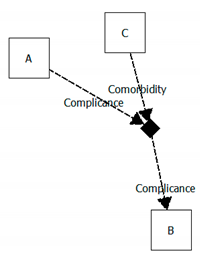 | A = peripheral artery disease B = gangrene of the foot C = heart failure Evolution = complication with comorbidity Meaning = the peripheral artery disease of a patient complicates with gangrene of the foot after an episode of heart failure |
| Function ComputeReachabilityGraph() |
|---|
|
function fireTransition(pathList)
|
| 1 | 2 | 3 | 4 | 5 | 6 | 7 | 8 | |
|---|---|---|---|---|---|---|---|---|
| 1 | {Ca1} | {Ca1,Ca2} | {Ca1,Ca2} | {Ca1,Ca2,Ex} | ||||
| 2 | {Wo} | {Wo,Ca1} | {Wo,Ca3} | {Wo,Ca1,Ca2} | {Wo,Ca1,Ca2} | {Wo,Ca1,Ca2,Ex}; {Wo,Ca3,Ex} | ||
| 3 | {Ca1} | {Ca3} | {Ca1,Ca2} | {Ca1,Ca2} | {Ca1,Ca2,Ex}; {Ca3,Ex} | |||
| 4 | {Ca2} | {Ca2} | {Ca2,Ex} | |||||
| 5 | {Ex} | |||||||
| 6 | {Ex} | |||||||
| 7 | {Ex} | |||||||
| 8 |
Publisher’s Note: MDPI stays neutral with regard to jurisdictional claims in published maps and institutional affiliations. |
© 2021 by the authors. Licensee MDPI, Basel, Switzerland. This article is an open access article distributed under the terms and conditions of the Creative Commons Attribution (CC BY) license (https://creativecommons.org/licenses/by/4.0/).
Share and Cite
Pecoraro, F.; Ricci, F.L.; Consorti, F.; Luzi, D.; Tamburis, O. The Friendly Health Issue Network to Support Computer-Assisted Education for Clinical Reasoning in Multimorbidity Patients. Electronics 2021, 10, 2075. https://doi.org/10.3390/electronics10172075
Pecoraro F, Ricci FL, Consorti F, Luzi D, Tamburis O. The Friendly Health Issue Network to Support Computer-Assisted Education for Clinical Reasoning in Multimorbidity Patients. Electronics. 2021; 10(17):2075. https://doi.org/10.3390/electronics10172075
Chicago/Turabian StylePecoraro, Fabrizio, Fabrizio L. Ricci, Fabrizio Consorti, Daniela Luzi, and Oscar Tamburis. 2021. "The Friendly Health Issue Network to Support Computer-Assisted Education for Clinical Reasoning in Multimorbidity Patients" Electronics 10, no. 17: 2075. https://doi.org/10.3390/electronics10172075
APA StylePecoraro, F., Ricci, F. L., Consorti, F., Luzi, D., & Tamburis, O. (2021). The Friendly Health Issue Network to Support Computer-Assisted Education for Clinical Reasoning in Multimorbidity Patients. Electronics, 10(17), 2075. https://doi.org/10.3390/electronics10172075