Abstract
In virtual reality technology, it is necessary to develop improvements and apply new techniques that allow rapid progress and innovative development. Nowadays, virtual reality devices have not yet demonstrated the great potential they could develop in the future. One main reason for this is the lack of precision to represent three-dimensional scenarios with a similar solvency to what our visual system obtains from the real world. One of the main problems is the representation of images using the RGB color system. This digital colorimetry system has many limitations when it comes to representing faithful images. In this work we propose to develop a virtual reality environment incorporating hyperspectral textures into a virtual reality system. Based on these hyperspectral textures, the aim of our scientific contribution is to improve the fidelity of the chromatic representation, especially when the lighting conditions of the scenes and its precision are relevant. Therefore, we will present the steps followed to render three-dimensional objects with hyperspectral textures within a virtual reality scenario. Additionally, we will check the results obtained by applying such hyperspectral textures by calculating the chromaticity coordinates of known samples.
1. Introduction
The digital revolution, has continued inexorably since the invention of the transistor in the 1950s, the beginning of the information age []. This progress can be seen in many aspects of our everyday life, such as our communication or our computing skills, and even in recreational aspects such as television, cinema, video games, etc. []. One of the latest twists and turns of this technological advance has been the generalization of the use of the 3D world in digital environments. Not only thinking about the visualization of 3D contents, but also about the design of all kinds of products in 3D environments, from furniture or vehicles to videogames or films. This form of native 3D design has been complemented by the existence of new devices that allow capturing and digitization of the real world in 3D, such as 3D scanners. These devices are also constantly evolving and have advanced a lot, from the first laser scanners that obtained the black and white point cloud, to the current, much simpler ones, which use image-based techniques and structured lighting to determine the point cloud with an associated RGB color texture []. Recently, a new technique has emerged that allows real 3D objects to be digitized by capturing multiple images of the same object from different angles. This type of technique, based on photogrammetric calculations, also generates the point cloud of the 3D object and an RGB color texture and can be used for all types of small or large objects [,]. In the above cases, the generated spatial coordinates XYZ that form the 3D point cloud are complemented with additional color information in the form of an RGB color texture in the best case. The RGB color space is used as native digital space to represent the color of 3D objects; however, this option is not the most appropriate if maximum fidelity is sought in the color reproduction of the object in the digital world compared with the visual appearance of the object in the real world []. When the color appears in this type of real-world digital capture, there exists also the need to make those captures with the greatest possible color fidelity, as is done with other types of 2D digital captures, such as digital cameras and flatbed scanners []. More pressing is this need with the emergence of new 3D visualization devices such as virtual reality devices.
Virtual Reality (VR) has experienced great development in recent years. The quality improvement of head-mounted displays (HMD) allows immersive visual experiences in virtual environments and is expected to have many applications, in both recreational and professional fields [,,]. The quality of these immersive experiences is a key factor and depends on the capability to generate the feeling of presence over a distance. From this perspective, virtual reality is achieved by creating an immersive experience, in which the senses receive different information from that of the real world. This immersive experience is based on deceiving our senses, bringing the corresponding information to the brain with a situation that is not real. Over the years, there have been several attempts to achieve this goal of deceiving our senses causing minimal visual fatigue [,]. Based on the need to improve the ability to reproduce more faithful images within a virtual reality system, the main aim of our work is to apply hyperspectral textures to objects scanned with a 3D scanner. This task has the complexity of introducing spectral files into a virtual reality system and working with them, considering the changes of light sources.
2. Related Work
From an immersive image quality point of view in a virtual reality scenario, we have seen how numerous works have made great efforts in applying computer graphics techniques to improve the final rendering. Examples are ray tracing [,], eye tracking [] or zone-based rendering [,]. All these improvements make virtual reality systems more realistic [] but none of them are focused on color fidelity using different light sources. However, just as in the physical world the light source plays a determining role in the human visual system and in the way we perceive the color of objects, it also does so in virtual reality. Therefore, it is necessary to use advanced techniques such as the use of spectral information in the color texture assigned to a 3D object to create a feeling of similarity to reality [,].
The rendering of real 3D objects in virtual reality systems is done by scanning physical objects and then inserting them into a three-dimensional scene [], in which depth plays an important role, since we are not talking about 2D images. Currently, the RGB color space is used to specify the color of such objects, as the use of the RGB color space is widespread across all digital devices. However, this color space is not the most appropriate if we want to ensure maximum color fidelity because this color space is device-dependent [,]. Moreover, if we want to reproduce how the light interact with objects in the real world inside a virtual reality scene, it will be necessary to use a more adequate color space such as CIE 1931 XYZ []. This device-independent color space allows us to compute the color of the real objects using the spectral reflectance of the surface of the objects and the spectral power distribution of the light source []. Of course we still have a need to use the RGB color space because this is the native color space of all HMDs. It is necessary to remark that we are still working in the framework of metameric matching of real-world colors using the light stimuli generated at the displays located inside the HMDs []. In this paradigm we have only three primary lights mixed in proper amounts to match the desired color. There is no spectral matching of the color generated at the display and the real-world color used as a reference. Like all tri-primary color systems, we are only matching the color using the phenomenon of metamerism. This is the reason why it is important to include spectral information of the light source and the objects at virtual reality systems, because metamerism does not support changes in light sources.
The aim of the work has been to develop a system capable of introducing spectral information on previously scanned objects. For this purpose, we simulated an LED light booth (Just Normlicht) with 12 LED spotlights []. Inside that light booth we included several fruits, 3D geometrical figures and a Color-Checker (X-rite) chart. The colors of these 3D objects were chosen to have well-known basic hues (red, orange, yellow, green and blue). The reason for not including any blue fruit or food was the difficulty of obtaining it. To complete the chromatic rainbow we included 3D geometrical figures (one blue) and a 3D capture of an original ColorChecker chart that provide us several important colors at daily-live like (brown, pink, purple and mid-tones). In the light booth simulation, we can switch between different light sources (TL84 and simulators of A, D50 and D65 illuminants).This means that the color of the objects shown at the virtual light booth will be calculated and represented in relation to the chosen light source. In our hypothesis, this allows the user to obtain a more faithful image of the displayed scenario and its components. The representation of 3D objetcs with hyperspectral textures, previously presented as preliminary work [], will improve the graphical representation of the virtual scenario. Figure 1 shows the initial representation of the project created in the virtual reality system.It shows a ColorChecker, a caps with an absolute white diffuser (Labsphere, North Sutton, NH, USA), four fruits and four geometrical figures.
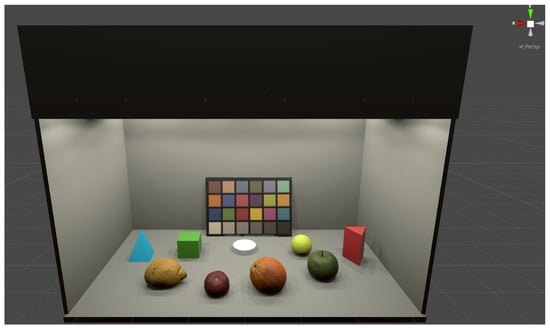
Figure 1.
Proposed virtual reality scenario for the introduction of hyperspectral information.
3. Materials and Methods
3.1. Color Characterization of Head Mounted Display
One of the main problems regarding the color management in virtual reality devices is the high refresh frequency of images, between 90 and 120 Hz, due to the low latency in the interaction of the user with the environment. This high frequency reduces the time available for colorimetric calculations. For this reason, we chose a display characterization model that does not require complex calculations, but only seeks to relate, as simply and accurately as possible, the values of the Digital-to-Analog-Converter (DAC) with the chromatic values of the stimulus in any reference color space. In a recent work, the authors detailed a simple color characterization model for this type of VR device []. This model follows the typical structure of a linear transformation between XYZ and R’G’B’ color spaces using a 3 × 3 matrix (Equation (2)) where the R’G’B’ vector is a linearized value using a gamma correction (Equation (1)) of the original RGB coordinates.
Based on this chromatic characterization model, we carried out the necessary measurements to characterize chromatically the display of a HTC Vive Headset for Virtual Reality. The measurement instrument employed in this work was a Konica-Minolta CS-2000 tele-spectroradiometer with a spectral resolution of 1 nm between 380 and 780 nm, a <2% radiance measurement error and CIE 1931 x = 0.0015; y = 0.0010 color error for an illuminant A. The measurements were performed through the lens of the HMD following the recommendations about color measurements in Near-eye displays (NEDs) [,,]. To perform the measurements, we set up the virtual light booth showing only one color capsule at a central point on the booth floor. The color of this capsule was fixed directly in RGB coordinates without any relation to the light or the texture because, at this stage of the chromatic characterization, we only want to record the relation between the digital RGB values and their color coordinates in a space independent of the device. First, we measure the XYZ tristimulus values for each independent R, G, and B channel on the display, in steps of 5 DAC values from 0 to 255 (8-bit depth) per channel. Next, we determined the relationship between the device-dependent and the device-independent color space coordinates (RGB vs. XYZ). This allowed us to obtain a gamma value, with which we linearize the color transformation, and generate the final matrix necessary for the color management. This matrix is the one we will finally use in our Algorithm 1 in Section 4 to apply the color space change. This chromatic characterization is applicable to any scene or scenario since the color relation is established between the RGB DAC values and the XYZ color space, without any other constrain. It should be noted that, strictly speaking, this 3 × 3 matrix and the 3 gamma values are only valid for our system, composed of an HTC Vive HMD, a PC with Windows 10 and Unity as the graphics engine, since any adjustment made in hardware or in software set-up will influence the values of that matrix and constants. However, previous works have indicated that the variations from one individual system to another of the same manufacturer, always taking the default values, are usually small []. Another option is to work with the gamma and matrix of the sRGB standard, since all display manufacturers tend to use this standard, although the appropriate checks would have to be made. Figure 2 shows the measurement procedure in the HMD.
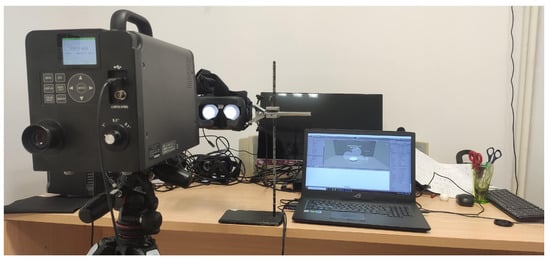
Figure 2.
Experimental setup used for the chromatic characterization of the HTC Vive Device.
3.2. 3D Reconstruction with a Scanner
In order to achieve the structure of the real objects, we used a 3D scanner. We scanned them with a Go!Scan 20 3D scanner (Creaform, Levis, QC, Canada) and processed the 3D object model with VXscan and VXelements 4 software (Creaform, Levis, QC, Canada). This scanner has a resolution of 0.5 mm and an accuracy of 0.100 mm. With this device we can capture the geometry of an object with good representation; however, the color representation is not good enough. Together with the point cloud that defines the geometry of the object, this scanner provides an image file with the RGB color texture associated with the 3D object. To obtain that texture, this device employs an RGB CCD camera and an internal dual peak LED light source with a color temperature of 5000 K. In order to add the spectral information to the RGB texture provided by the 3D scanner, we developed a MATLAB script that calculates the color RGB of the measured points of the object using the spectral reflectance of these points. In order to do this we employed the spectral power distribution of the internal light source of the 3D scanner and the custom ICC color profile of this device. By computing the color difference between the RGB colors from the 3D Scanner and the RGB color from the MATLAB script, we associated a spectral reflectance to each pixel of the RGB texture following the criteria of minimizing the color difference. Figure 3 shows the scanner used to obtain the geometry of the objects used in the virtual representation. In addition, Figure 3 shows the spectral power curve of the internal LED light source employed by the 3D scanner. This LED is specific to the scanner and its power distribution was measured with our Konica-Minolta CS-2000 tele-spectroradiometer.
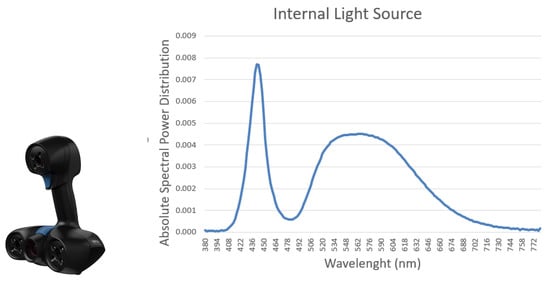
Figure 3.
Scanner used for the object simulation process (left) and spectral power distribution of the scanner (right).
3.3. Hyperspectral Texture Datasets
Firstly, we defined the 3D objects by means of .obj files and their corresponding color texture file with RGB values. Then, we used the database of a published work that analyzed the spectral reflectance of several fruits and vegetables []. By means of a script developed in MATLAB, we replace the texture generated by the scanner in RGB values by another texture file using the spectral reflectance values of the published datasets. This hyperspectral texture was originally generated using several .bmp files, defining for each file the spectral reflectance of a different wavelength, in 4 nm steps from 380 to 780 nm. After this, the hyperspectral texture files were converted to a binary file in order to be read by graphics engine software (Unity) as a binary array of bytes. In this manner, it is possible to make the necessary spectral calculations inside Unity software, including the effect of different light sources over the 3D objects. As a result from these calculations we will obtain the colorimetric information expressed in tristimulus values XYZ to be represented in the virtual reality system.
3.4. Light Sources Measurements
In order to represent and simulate different light sources in a virtual reality system, the first step is to obtain the spectral power distribution (SPD) of these light sources. For this purpose, we measured the SPD of the light sources of a real light booth in our laboratory.The measurements were performed employing our tele-spectroradiometer with a measurement geometry of 0°/45° over a Spectralon (Labsphere, Sutton, NH, USA), a diffuse reflectance standard with a Lambertian spectral reflectance of 99.9% in the visible range. Figure 4 shows the set up scenario used to obtain these spectral curves.
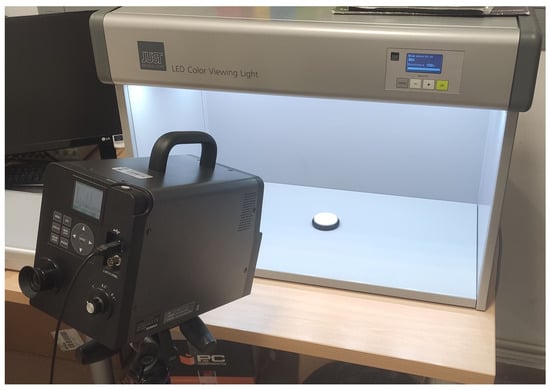
Figure 4.
Set up of measurement of spectral power curves of real light sources.
Once the measurement was completed, we obtained the SPD of the simulator for TL84, D50, A and D65 light sources. Figure 5 shows the spectral curves of these LED light sources.
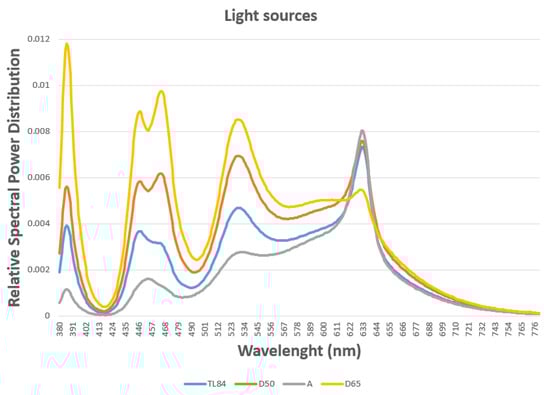
Figure 5.
Absolute Spectral Power Distribution of different light sources.
4. System Development
4.1. Light Representations in a Virtual Reality System
The first step of our system was to simulate different light sources in a virtual reality system using its spectral power distribution curves, defined in separates .csv files. The Unity Game Engine permit allows us to read those .csv files and incorporate the different SPDs to a script that calculates the tristimulus value for each light source using a CIE 1931 colorimetric standard observer. Using the chromatic characterization model defined before, we can obtain the RGB value necessary to simulate each light source in a virtual reality system. Figure 6 shows the different simulations of light sources that we made to compare objects with hyperspectral textures. These scenes represent an LED light booth (Just Normlicht) with 12 LED spotlights.
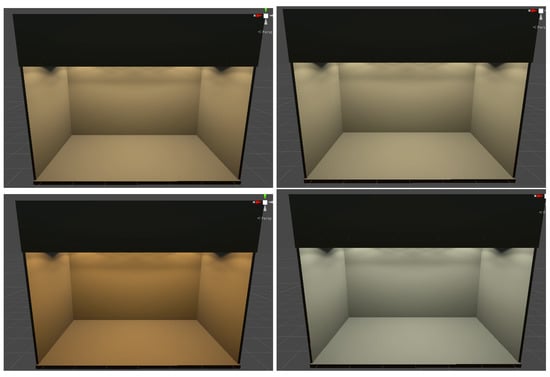
Figure 6.
Different light sources represented in our virtual reality scene. TL84 (top left), D50 (top right), A (bottom left) and D65 (bottom right).
4.2. Graphics and Lighting Settings
In order to obtain the best visual appearance and the most realistic graphic rendering possible [], we chose the high quality options in the set up of the Unity Software. In addition, options such as reflections were activated to give a more natural look to the virtual scenario. Furthermore, we need to know that The High Definition Render Pipeline (HDRP) allows us to render Lit Materials using either Forward or Deferred rendering. Unity allows us to configure our Unity Project to only use one of these modes, or allow it to use both and switch at runtime on a per-Camera basis. When we use a Forward HDRP, Unity calculates the lighting in a single pass when rendering each individual Material. However, if we use Deferred HDRP, Unity processes the lighting for every GameObject in the Scene. With this definition, based on giving the best possible image of the virtual scenario, we considered using a Deferred render pipeline.
As for the illumination settings, a spot light type was used. Like a point light, a spot light has a specified location and range over which the light falls off. However, the spot light is constrained to an angle, resulting in a cone-shaped region of illumination. The center of the cone points in the forward (Z) direction of the light object. The light also diminishes at the edges of the spot light’s cone. By widening the angle the width of the cone is increased and this increases the size of this fade, known as the ‘penumbra’. To simulate the scenario most realistically, the illumination range and the angle of each spotlight of the physical light booth was measured. Figure 7 shows the operation of a Spot light and the screenshot of the settings used in Unity.
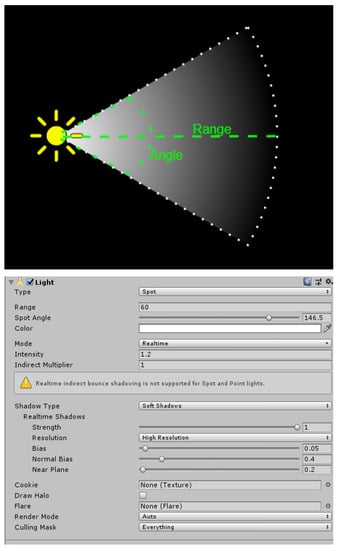
Figure 7.
An image of the operation of a spot light (top) and a screenshot of the options chosen in our virtual reality system for the simulation of lights (bottom).
4.3. Algorithms for Hyperspectral Rendering
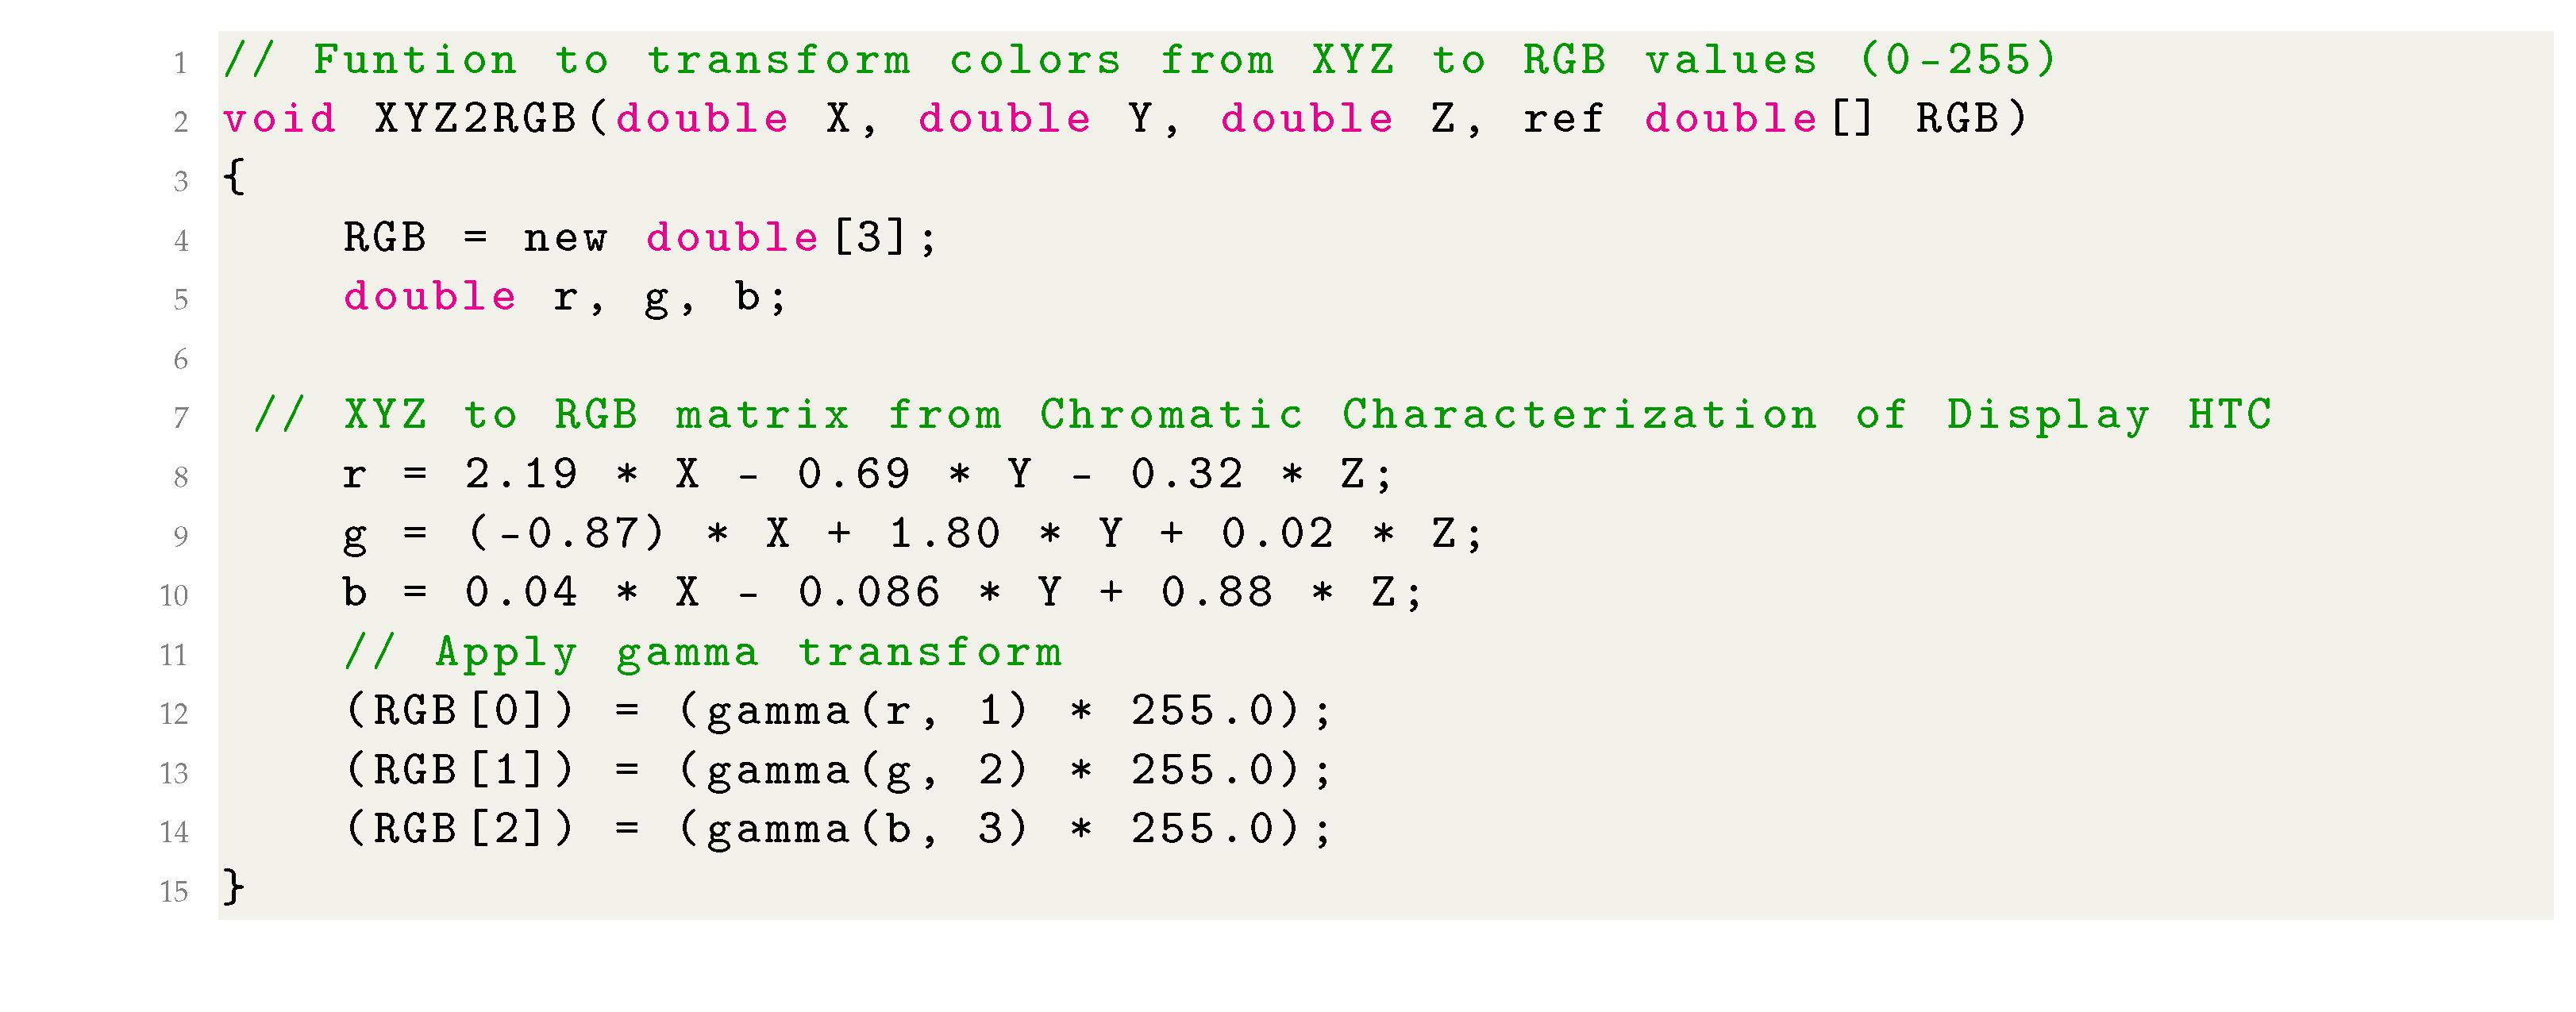
Once our hyperspectral textures have been read, we have to calculate the RGB values corresponding to the result of the obtained XYZ tristimulus values. For this, we used the 3 × 3 transformation matrix. The procedure to obtain this matrix is detailed in Section 3.1. In Algorithm 1, we can see the code we developed for this function in our virtual reality system. The calibration matrix is independent of the virtual stage, and will be able to generate all the RGB colors corresponding to the X, Y and Z values passed by the parameters. We have to say that this matrix will be different for each virtual reality device, but it will be valid on the same device for any scenario and color. To calculate the color of each object, we will have to pass by parameter the X, Y and Z values and the model used will convert it to RGB.
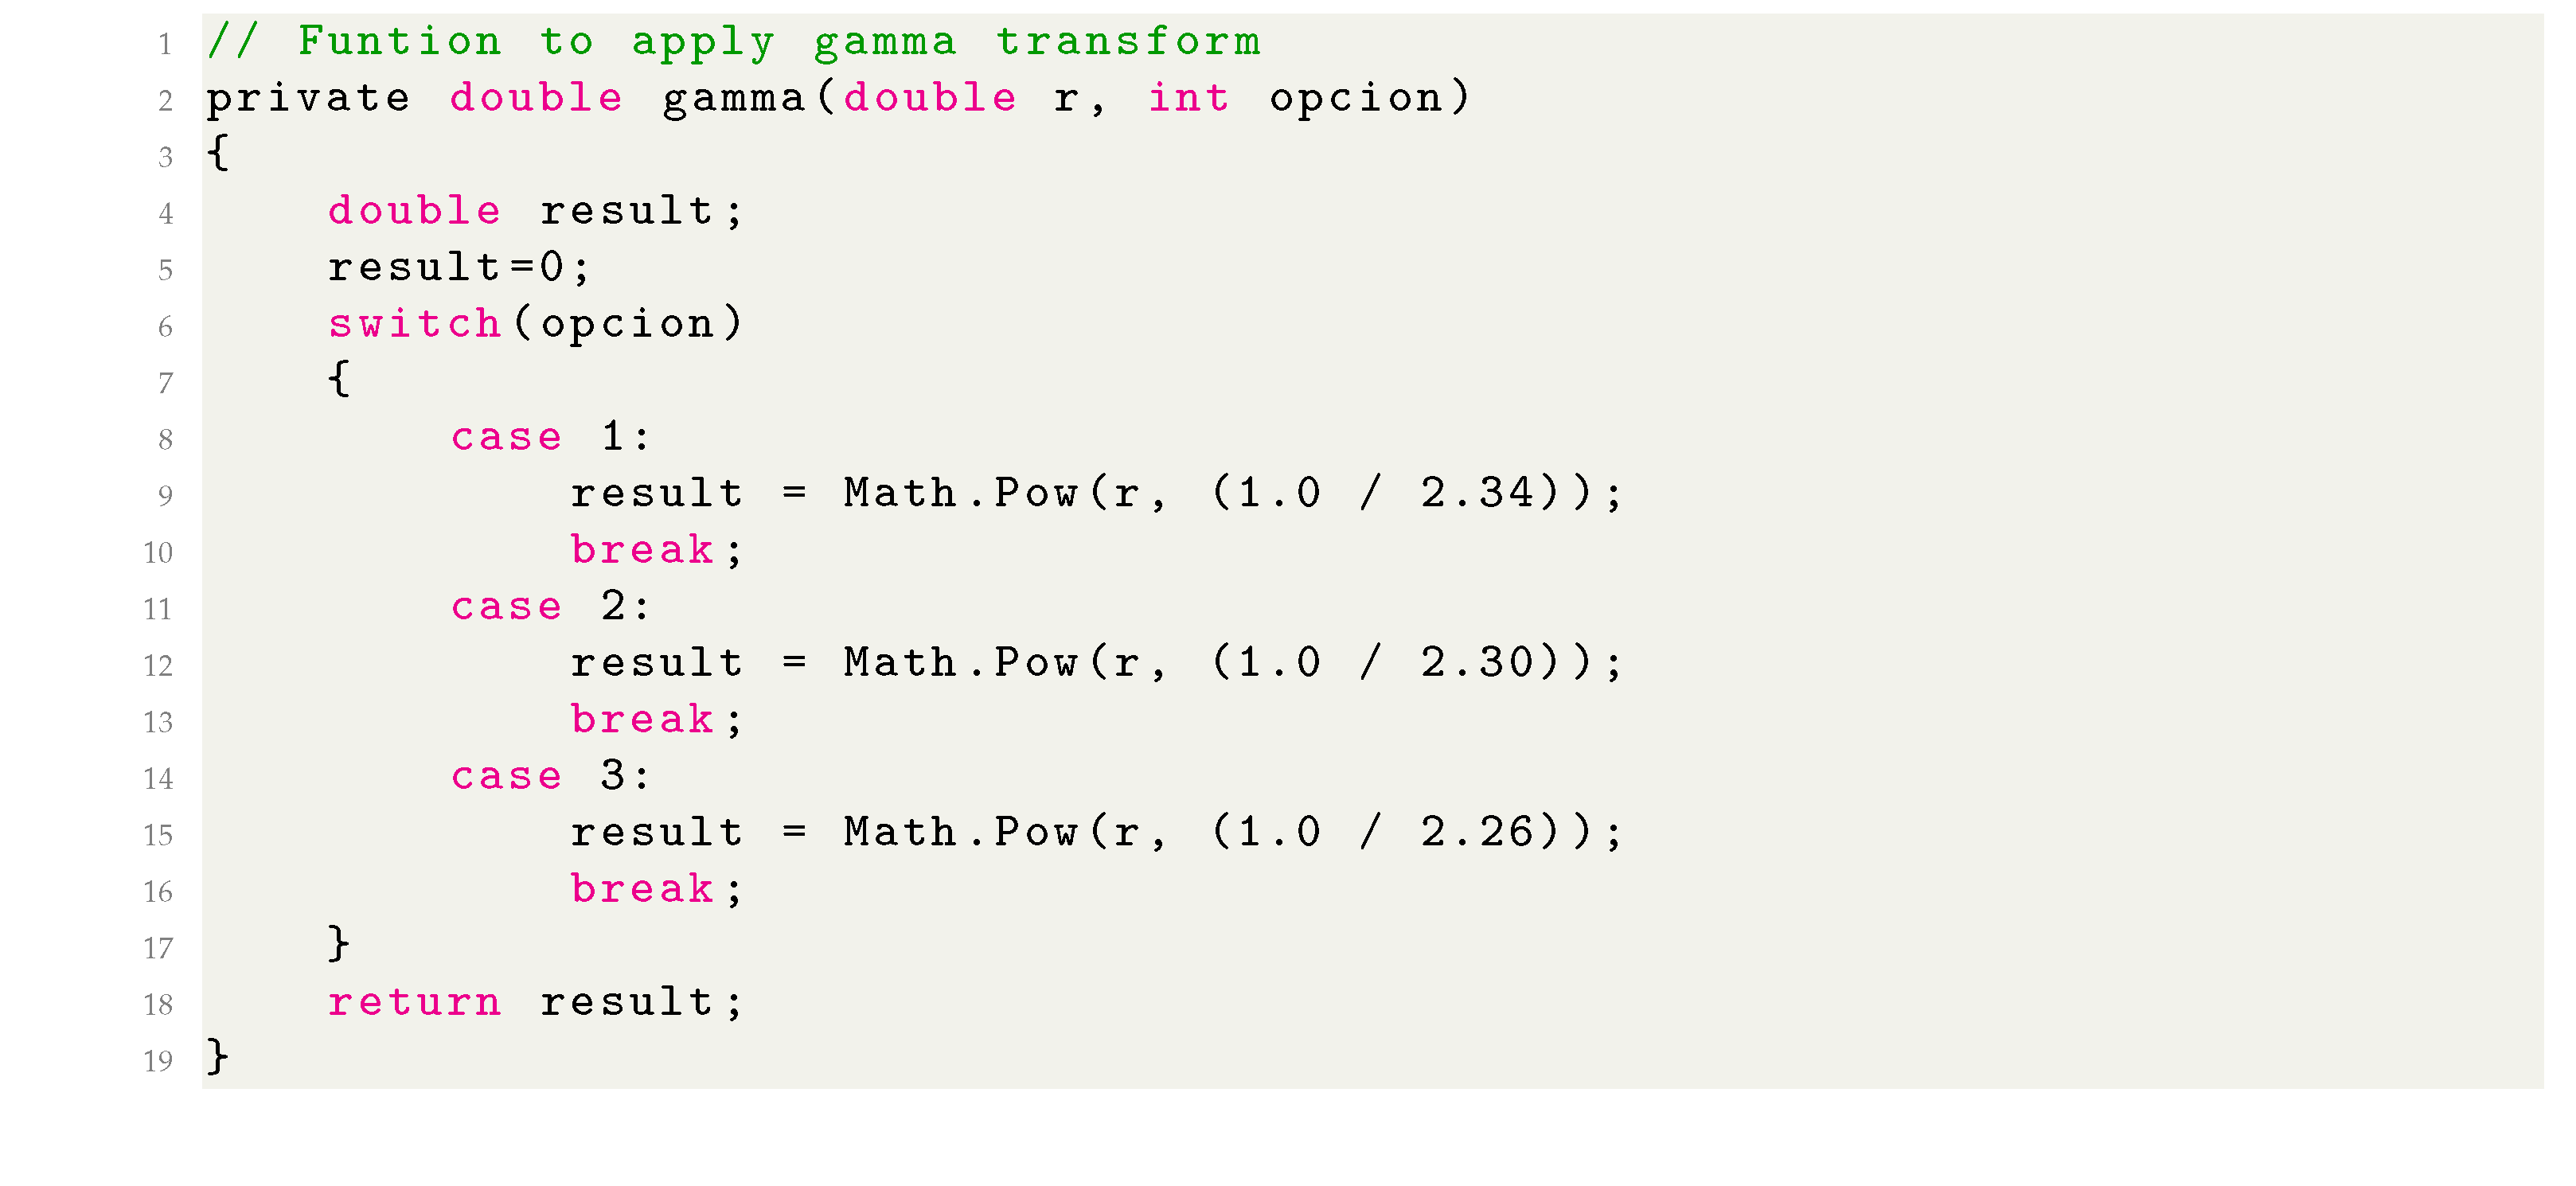
In addition, to obtain the final RGB values, it is necessary to apply the non-linear transform using the three gamma values, one for each RGB channel. Algorithm 2 shows the code corresponding to this function.
| Algorithm 1: Algorithm transformation from XYZ values to RGB. |
 |
| Algorithm 2: Gamma function example. |
 |
5. Results
After performing all the above tasks, we obtained a virtual reality system in which we introduced a spectral color management system and we applied it to hyperspectral textures associated to 3D objects. Figure 8 shows the result of the scenario presented in Section 2 under the four light sources studied in this work and its application of hyperspectral textures on the objects.
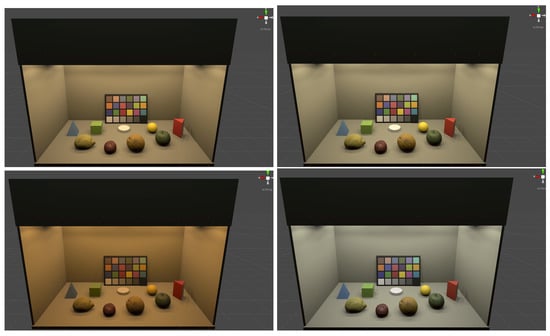
Figure 8.
Screenshots of the final virtual scenarios using hyperspectral information and different light sources. TL84 (top left), D50 (top right), A (bottom left) and D65 (bottom right).
Figure 8 shows that it is possible to simulate real objects in a virtual reality scenario by changing their color appearance when the spectral properties of light change. However, it is necessary to carry out quantitative checks that allow us to confirm or not our hypothesis that with this new procedure we can obtain a more faithful color representation than that used by the classical system up to now. This verification will be done in the following sections in two ways. First of all, it is necessary to check whether in our system a simple surface color measured in a real light booth can be faithfully reproduced in a virtual reality scene. Secondly, it is necessary to verify that, by applying hyperspectral textures, we can obtain greater fidelity in the reproduction of the color when we apply spectral changes to the light sources.
5.1. Checking Correspondence between Reality and Virtual World
In order to check if we have developed a system with a high degree of fidelity in color reproduction or not, we used 10 samples from the NCS (Natural Color System) atlas book. NCS was developed after 15 years of scientific research with the aim of creating a standard in color specification in the Swedish industry. However, it has already spread worldwide as an universal color language, and is a national standard in countries as diverse as Sweden, Mexico, South Africa, and Spain. Today it is a widely used system both at industrial and professional or private level, from the process of product design in large companies or branding, to the choice of color for projects by individuals, designers, architects, interior designers, etc. It is also supported by color tools of the best quality and repeatability year after year, with which to choose the color through a physical sample [,].
For the purpose of reproducing these color samples in our virtual reality system, we measured the color of these samples with the tele-spectroradiometer. We obtained the CIE 1931 x,y chromaticity coordinates when the samples are illuminated by any of the four light sources studied in this work. Figure 9 shows the set up used to perform these measurements as well as the 10 chosen samples.
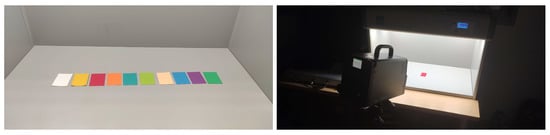
Figure 9.
NCS samples used to check results (left) and the chromaticity measurement procedure (right).
Once the physical measurements of the 10 randomly chosen NCS samples were taken, we entered the spectral reflectances provided by the manufacturer into our virtual reality system. Again, we repeated the same measurement procedure but this time directly on the HMD. This procedure is similar to the one used in the chromatic characterization measurements in Section 3.1 but, in this case, the RGB color assigned to the circular capsule came from the spectral color management system. With these new measurements, we have the CIE 1931 x,y chromaticities for the physical values and for the values measured in our virtual reality system. Figure 10 shows the comparison between physical and virtual samples under the four light sources studied.
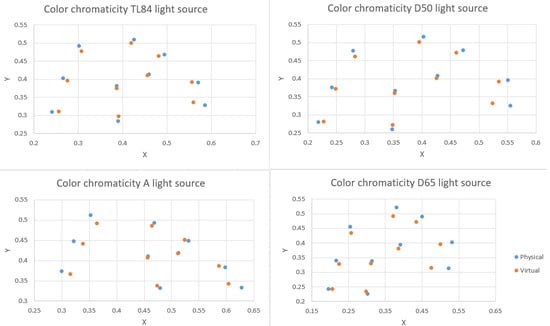
Figure 10.
Different x,y chromaticity coordinates of NCS samples for different light sources. TL84 (top left), D50 (top right), A (bottom left) and D65 (bottom right).
In order to establish an error level between the two measurements, we have applied the CIEDE2000 formula that allows us to know the color difference between two samples, one real and the other virtual. In Table 1 we can see the different errors obtained for each light source in each of the NCS samples chosen.

Table 1.
Color difference between real and virtual NCS samples under different light sources.
5.2. Color Differences Found Using Both Color Management Procedures
As a second point of checking, it is necessary to verify that, by applying hyperspectral textures to 3D objects, we can obtain a greater fidelity in the reproduction of the color when we apply spectral changes to the light sources. In order to perform this check, we measured the color of the 3D objects shown at the virtual reality scenario under the four light sources used in this work. We made this measurement in two ways, applying the hyperspectral texture and the spectral computation of color and only applying the RGB texture provided by the 3D scanner. Table 2 shows the color difference between both color representation system and the color reference calculated theoretically from the spectral reflectance obtained from the published dataset and the measured SPDs of the four light sources. We used CIEDE2000 again as the color difference formula.
Table 2.
Color difference in all objects in the scene under different light sources with and without hyperspectral textures.
6. Conclusions
In view of the results obtained, we can extract several conclusions related to the introduction of hyperspectral information into a virtual reality system. The first conclusion is that we were able to control the colorimetric values of virtual objects related to real objects shown in a real light booth when the lighting conditions are changed. In order to check whether the results obtained guarantee a good color representation and to estimate the average error, we analyzed 10 physical samples of known NCS values. The average color differences obtained for each light source when we compare the real and the virtual samples are in the range from 3.19 to 3.60 units at the 00 color difference formula. If we take into account that the chromatic characterization error committed in Section 3.1 was 1.8 (calibration error) and this error is one of the contributions to the color reproduction error, we can conclude that the obtained average color reproduction error associated to our method has little relevance to the human visual system. On the other hand, we checked whether our new method of representing 3D objects in virtual reality systems using hyperspectral textures is better or not than the usual method based on RGB textures. The average color difference obtained when comparing the color of the 3D objects displayed in virtual reality with the theoretical color of these objects is always less when we use hyperspectral textures than when we do not use them. Therefore, this provides an obvious improvement in the color rendering of three-dimensional objects in a virtual reality system. We can emphasize that the registered color differences are better using this procedure than those recorded using a color management system with RGB textures. This gives us a breakthrough within the virtual reality paradigm. At the same time, it opens up a wide range of possibilities for future work.
Author Contributions
Conceptualization, F.D.-B., H.C., and P.J.P.; methodology, F.D.-B. and P.J.P.; software, F.D.-B., H.C. and P.J.P.; validation, F.D.-B., P.J.P. and H.C.; formal analysis, P.J.P.; investigation, F.D.-B., H.C. and P.J.P.; writing—original draft preparation, F.D.-B., H.C. and P.J.P.; writing—review and editing, F.D.-B., H.C. and P.J.P.; supervision, P.J.P.; All authors have read and agreed to the published version of the manuscript.
Funding
This works was supported by the grants GR18131, IB16004 and IB20094 of the Regional Government of the Junta de Extremadura, and partially financed by the European Regional Development Fund.
Acknowledgments
We would like to thank Ángel M. Felicísimo and María-Eugenia Polo for their collaboration in this work, with great knowledge in photogrammetry and 3D modeling, who have provided us with their scanner to be able to reconstruct 3D objects.
Conflicts of Interest
The authors declare no conflict of interest.
References
- Greenwood, J. The Third Industrial Revolution: Technology, Productivity, and Income Inequality; Number 435; American Enterprise Institute: Washington, DC, USA, 1997. [Google Scholar]
- Javidi, B.; Okano, F. Three-Dimensional Television, Video, and Display Technologies; Springer Science & Business Media: Berlin/Heidelberg, Germany, 2002. [Google Scholar]
- Polo, M.E.; Felicísimo, Á.M. Analysis of uncertainty and repeatability of a low-cost 3D laser scanner. Sensors 2012, 12, 9046–9054. [Google Scholar] [CrossRef] [Green Version]
- Aicardi, I.; Chiabrando, F.; Lingua, A.M.; Noardo, F. Recent trends in cultural heritage 3D survey: The photogrammetric computer vision approach. J. Cult. Herit. 2018, 32, 257–266. [Google Scholar] [CrossRef]
- Barba, S.; Barbarella, M.; Di Benedetto, A.; Fiani, M.; Gujski, L.; Limongiello, M. Accuracy assessment of 3D photogrammetric models from an unmanned aerial vehicle. Drones 2019, 3, 79. [Google Scholar] [CrossRef] [Green Version]
- Choi, I.; Kim, M.; Gutierrez, D.; Jeon, D.; Nam, G. High-Quality Hyperspectral Reconstruction Using a Spectral Prior; Technical Report; ACM: New York, NY, USA, 2017. [Google Scholar]
- Durán-Dominguez, G.; Felicisimo, A.; Polo, M. 3D study of cultural heritage for conservation: Reliability of the portable 3D laser scanners. In Proceedings of the International Congress on Science and Technology for the Conservation of Cultural Heritage, Seville, Spain, 24–27 June 2014; pp. 357–362. [Google Scholar]
- Wang, Y.; Liu, W.; Meng, X.; Fu, H.; Zhang, D.; Kang, Y.; Feng, R.; Wei, Z.; Zhu, X.; Jiang, G. Development of an immersive virtual reality head-mounted display with high performance. Appl. Opt. 2016, 55, 6969–6977. [Google Scholar] [CrossRef] [PubMed]
- Xu, M.; Hua, H. High dynamic range head mounted display based on dual-layer spatial modulation. Opt. Express 2017, 25, 23320–23333. [Google Scholar] [CrossRef] [Green Version]
- Cwierz, H.; Díaz-Barrancas, F.; Llinás, J.G.; Pardo, P.J. On the Validity of Virtual Reality Applications for Professional Use: A Case Study on Color Vision Research and Diagnosis. IEEE Access 2021, 9, 138215–138224. [Google Scholar] [CrossRef]
- Kongsilp, S.; Dailey, M.N. Motion parallax from head movement enhances stereoscopic displays by improving presence and decreasing visual fatigue. Displays 2017, 49, 72–79. [Google Scholar] [CrossRef]
- Lambooij, M.; Fortuin, M.; Heynderickx, I.; IJsselsteijn, W. Visual discomfort and visual fatigue of stereoscopic displays: A review. J. Imaging Sci. Technol. 2009, 53, 30201. [Google Scholar] [CrossRef] [Green Version]
- Wald, I.; Dietrich, A.; Benthin, C.; Efremov, A.; Dahmen, T.; Gunther, J.; Havran, V.; Seidel, H.P.; Slusallek, P. Applying ray tracing for virtual reality and industrial design. In Proceedings of the IEEE Symposium on Interactive Ray Tracing, Salt Lake City, UT, USA, 18–20 September 2006; IEEE: Piscataway, NJ, USA, 2006; pp. 177–185. [Google Scholar]
- Fujita, M.; Harada, T. Foveated real-time ray tracing for virtual reality headset. In Proceedings of the SIGGRAPH Asia, Shenzhen, China, 3–6 December 2014. [Google Scholar]
- Clay, V.; König, P.; Koenig, S. Eye tracking in virtual reality. J. Eye Mov. Res. 2019, 12. [Google Scholar] [CrossRef]
- Seay, A.F.; Krum, D.M.; Hodges, L.; Ribarsky, W. Simulator sickness and presence in a high FOV virtual environment. In Proceedings of the IEEE Virtual Reality, Yokohama, Japan, 13–17 March 2001. [Google Scholar]
- Hilton, P. Ultra-Wide FOV Retinal Display; Physics Applications Ltd.: Dayton, OH, USA, 2008; Volume 56. [Google Scholar]
- Hvass, J.; Larsen, O.; Vendelbo, K.; Nilsson, N.; Nordahl, R.; Serafin, S. Visual realism and presence in a virtual reality game. In Proceedings of the 3DTV Conference: The True Vision-Capture, Transmission and Display of 3D Video (3DTV-CON), Piscataway, NJ, USA, 7–9 June 2017; pp. 1–4. [Google Scholar]
- Kim, M.H. 3D Graphics Techniques for Capturing and Inspecting Hyperspectral Appearance. In Proceedings of the International Symposium on Ubiquitous Virtual Reality, Daejeon, Korea, 10–13 July 2013; IEEE: Piscataway, NJ, USA, 2013; pp. 15–18. [Google Scholar]
- Guimarães, T.T.; Mariani, D.H.D.; Kupssinskü, L.S.; Rossa, P.; Horota, R.K.; De Freitas, R.; Roupinha, L.; Weppo, B.E.; Weschenfelder, A.; Spigolon, A.L.D.; et al. Mosis Lab Hyperspectral-Visualization and Correlation of Hyperspectral Data on Immersive Virtual Reality. In Proceedings of the IEEE International Geoscience and Remote Sensing Symposium IGARSS, Brussels, Belgium, 11–16 July 2021; IEEE: Piscataway, NJ, USA, 2021; pp. 5747–5750. [Google Scholar]
- Bruno, F.; Bruno, S.; De Sensi, G.; Luchi, M.L.; Mancuso, S.; Muzzupappa, M. From 3D reconstruction to virtual reality: A complete methodology for digital archaeological exhibition. J. Cult. Herit. 2010, 11, 42–49. [Google Scholar] [CrossRef]
- Hill, B.; Roger, T.; Vorhagen, F.W. Comparative analysis of the quantization of color spaces on the basis of the CIELAB color-difference formula. Acm Trans. Graph. (TOG) 1997, 16, 109–154. [Google Scholar] [CrossRef]
- Ibraheem, N.A.; Hasan, M.M.; Khan, R.Z.; Mishra, P.K. Understanding color models: A review. ARPN J. Sci. Technol. 2012, 2, 265–275. [Google Scholar]
- Diaz-Barrancas, F.; Cwierz, H.; Pardo, P.; Perez, A.; Suero, M. Improvement of realism sensation in virtual reality scenes applying spectral and colour management techniques. In Proceedings of the 25th Symposium of the International Colour Vision Society (ICVS 2019), Riga, Latvia, 5–9 July 2019; p. 79. [Google Scholar]
- Rhyne, T.M. Applying color theory to digital media and visualization. In Proceedings of the 2017 CHI Conference Extended Abstracts on Human Factors in Computing Systems, Denver, CO, USA, 6–11 May 2017; pp. 1264–1267. [Google Scholar]
- Akbarinia, A.; Gegenfurtner, K.R. Color metamerism and the structure of illuminant space. JOSAA 2018, 35, B231–B238. [Google Scholar] [CrossRef]
- Cwierz, H.C.; Diaz-Barrancas, F.; Pardo, P.J.; Perez, A.L.; Suero, M.I. Colour Management in Virtual Reality applied to Lighting Simulations. AIC Lisbon 2018. [Google Scholar] [CrossRef]
- Diaz-Barrancas, F.; Cwierz, H.C.; Pardo, P.J.; Perez, A.L.; Suero, M.I. Visual fidelity improvement in virtual reality through spectral textures applied to lighting simulations. Electron. Imaging 2020, 2020, 259-1–259-4. [Google Scholar] [CrossRef]
- Díaz-Barrancas, F.; Cwierz, H.; Pardo, P.J.; Pérez, Á.L.; Suero, M.I. Spectral Color Management in Virtual Reality Scenes. Sensors 2020, 20, 5658. [Google Scholar] [CrossRef]
- Penczek, J.; Austin, R.L.; Obheroi, S.; Hasan, M.; Cook, G.J.; Boynton, P.A. 54-5: Measuring Direct Retinal Projection Displays. In SID Symposium Digest of Technical Papers; Wiley Online Library: Hoboken, NJ, USA, 2020; Volume 51, pp. 807–810. [Google Scholar]
- Hong, H. A measurement method of the focal distance of the virtual image in an augmented reality or virtual reality device. J. Soc. Inf. Disp. 2021, 29, 230–236. [Google Scholar] [CrossRef]
- Varshneya, R.; Draper, R.S.; Penczek, J.; Pixton, B.M.; Nicholas, T.F.; Boynton, P.A. 50-4: Standardizing Fundamental Criteria for Near Eye Display Optical Measurements: Determining the Eye-box. In SID Symposium Digest of Technical Papers; Wiley Online Library: Hoboken, NJ, USA, 2020; Volume 51, pp. 742–745. [Google Scholar]
- Pardo, P.J.; Martínez-Borreguero, G.; Pérez, Á.L.; Suero, M.I. Worldwide Uniformity of Color Reproduction in Handheld Video-Game Consoles and Applications. J. Disp. Technol. 2012, 8, 233–240. [Google Scholar] [CrossRef]
- Ennis, R.; Schiller, F.; Toscani, M.; Gegenfurtner, K.R. Hyperspectral database of fruits and vegetables. JOSAA 2018, 35, B256–B266. [Google Scholar] [CrossRef] [PubMed]
- Díaz-Barrancas, F.; Cwierz, H.C.; Pardo, P.J.; Perez, A.L.; Suero, M.I. Colour appearance in immersive three-dimensional virtual environments. Color. Technol. 2021, 137, 38–43. [Google Scholar] [CrossRef]
- Hård, A.; Sivik, L.; Tonnquist, G. NCS, natural color system—From concept to research and applications. Part I. Color Res. Appl. 1996, 21, 180–205. [Google Scholar] [CrossRef]
- Smith, N.; Whitfield, T.; Wiltshire, T. Accuracy of the NCS atlas samples. Color Res. Appl. 1991, 16, 108–113. [Google Scholar] [CrossRef]
Publisher’s Note: MDPI stays neutral with regard to jurisdictional claims in published maps and institutional affiliations. |
© 2021 by the authors. Licensee MDPI, Basel, Switzerland. This article is an open access article distributed under the terms and conditions of the Creative Commons Attribution (CC BY) license (https://creativecommons.org/licenses/by/4.0/).