Article

Characteristic Study of Visible Light Communication and Influence of Coal Dust Particles in Underground Coal Mines

1
College of Information and Communication Engineering, Xi’an University of Science and Technology, Xi’an 710054, China
2
College of Computer Science Technology, Xian University of Science and Technology, Xi’an 710054, China
3
Department of Information and Communication Engineering, Yeungnam University, Gyeongsan 38541, Korea
*
Authors to whom correspondence should be addressed.
Electronics 2021, 10(8), 883; https://doi.org/10.3390/electronics10080883
Submission received: 25 February 2021 / Revised: 29 March 2021 / Accepted: 4 April 2021 / Published: 8 April 2021
(This article belongs to the Special Issue Recent Advancements in Indoor Positioning and Localization)

Abstract

:
The critical environment of the underground mines is a risky zone for mining applications and it is very hazardous to engage the miners without a sophisticated communication system. The existing wired networks are susceptible to damage and the wireless radio systems experience severe fading that restricts the complete access to the entire assembly of a mine. Wireless optical communication is a better approach that can be incorporated in the erratic atmosphere of underground mines to overcome such issues, as lights are already used to illuminate the mine galleries. This study is focused on investigating the characteristics of visible light communication (VLC) in an underground coal mine. The entire scope of VLC is elaborated along with the influence of coal dust particles and the scattering model. The impact of coal dust clouds on visibility and attenuation is analyzed for visible light transmission. The shadowing effect generated by the pillars and mining machinery is estimated by employing the bimodal Gaussian distribution (BGD) approach in coal mines. The characteristic model of VLC for underground coal mines is presented by classifying the area of the mine into mine gallery and sub-galleries. The transmission links of VLC are categorized as the line of sight (LOS) link for direct propagation and the non-LOS (NLOS) link for reflected propagation. The scenarios of LOS and NLOS propagation are considered for each evaluating parameter. Furthermore, the performance of the proposed framework is examined by computing the received signal power, path loss, delay spread (DS), and signal to noise ratio (SNR).

1. Introduction

The coal mines have a substantial contribution towards employment and play a big part in the universal economy. Coal serves a major portion of energy requirements by producing electricity; coal-fired power plants currently generate 37% of the global electricity requirement [1]. The mining environment is quite harsh for mining applications and it is very difficult to extract various kinds of minerals from the erratic atmosphere of mines. The mining sector is composed of a risky environment where multiple kinds of hazardous gases, probability of explosion, and other kinds of accidents can easily dominate and endanger the safety of the workers [2]. Therefore, multiple advanced control systems have been installed in mines to ease the mining process and ensure the safety of this critical environment [3]. However, one of the major challenges in underground mines is the lack of a stable communication framework that can provide complete access to the entire structure of the mine. The underground mine is usually composed of an irregular pillar structure and rough boundary surfaces, which makes it very difficult for the radio frequency (RF) based wireless system to work efficiently [4]. This deficiency generates a high risk for the safety of a worker.
During emergencies, it is very difficult to track trapped individuals for rescue operations. Hence, it is very necessary to maintain a stable link of communication for consistent monitoring of some vital parameters such as humidity level, gas intensity, explosions, dust concentration, and more importantly, the current location of a trapped miner.
The existing communication systems used for underground mines are commonly wired or wireless systems that do not provide full network accessibility in the hazardous atmosphere of mines. The wired systems are becoming obsolete, whereas the wireless RF systems are strongly attenuated due to the non-uniform internal structure and randomly distributed medium indexes in the mine galleries [5]. On the other hand, the optical fiber cable is the most efficient source of transmission that has the capability of high-speed data propagation and can provide high bandwidth than wired protocols of guided transmission [6]. Hence, the primary focus of this work is to analyze the highly efficient optical transmission capabilities wirelessly. Optical wireless communication (OWC) is an advanced next-generation technique and it can be employed in an indoor environment for short-range communications [7].
Since the mines do not have any source of natural illumination due to their underground complex structure, illuminating the galleries of a mine is achieved by using light emitting diodes (LED). The energy of these electronic lights can be utilized in a better way to provide an additional benefit of data transmission. An optical wireless framework is a sophisticated approach to eliminate the challenges of poor visibility in a hazardous surrounding of coal mine and to facilitate the sensitive environment with better wireless communication [8].
The visible light communication (VLC) approach is suggested to mitigate the challenges in the critical environment of coal mines. Figure 1 exhibits the fundamental structure of VLC for underground mines. It is an emerging and promising technique of communication in the domain of OWC. It has unique characteristics that make it superior for indoor short-range networks such as high data rate, unlicensed spectrum, cost-effectiveness, green energy, and immunity to electromagnetic interference (EMI) [9]. The installation of the VLC setup can be an appropriate approach in the risky atmosphere of coal mines by utilizing the LEDs of cold light sources, but the existence of toxic material, flammable gases, and coal dust attenuate the optical signal [10]. The channel modeling for the VLC system in the critical environment of coal mines is more difficult as compared to a typical indoor atmosphere.
The internal architecture of mines comprises irregular structures with rough boundary surfaces and the presence of mining machinery makes it difficult to efficiently model all the possible scenarios for visible light propagation. The randomly distributed pillars and large mining objects generate a shadowing effect that can easily break the optical link. The existence of the minute coal particles comprising water vapors and particulate matter reduces the visibility and causes scattering of the optical signals. If the size of suspended coal particles is larger than the wavelength of the optical signal, it generates the Mie scattering effect which is a critical factor for the attenuation of the optical transmission [11]. Similarly, the non-uniform geometry of the ceiling generates geometric loss, which requires angular positioning of the LEDs and photodiodes (PDs) [12].
In most of the recent studies [12,13,14,15], VLC systems for mines have been discussed, however, the entire scope of a VLC framework has not been discussed elaborately. A complete study of the VLC framework should include channel modeling for classified zones, the impact of suspended coal dust particles, path loss estimation, visibility attenuation model, Mie scattering, and shadowing effect. In the same way, other research works focus on investigating the characteristics of OWC. For example, Reference [16] proposed geometry-based single bounce (GBSB) model to estimate the characteristics of the VLC channel for multiple fields of view scenarios, and the results are reported in terms of the channel impulse response (CIR) and mean excess delay. Similarly, Reference [17] utilizes the recursive approach to examine the CIR for multipath fading for a particular indoor environment and the impact of spectral reflectance induced due to the indoor reflectors. The authors present a study on the effective inversion algorithm for the particle size distribution measurement by using the spectral extinction approach in [18]. None of these studies presented a ray-tracing model to compute the channel response of visible light communication for multiple reflections effect of non-line of sight (NLOS) link in coal mines.
The chief objective of this research is to examine the characteristics of VLC in underground coal mines. The channel modeling for the VLC framework is designed to estimate the optical received power by incorporating the transmission links for line of sight (LOS) and NLOS scenarios. The entire structure of the coal mine is divided into the gallery and sub-gallery. The concept of the mine gallery depicts the area for transportation of coal and all the connected branches to the mine gallery are nominated as sub-galleries as shown in Figure 2. The sub-gallery comprises a room-and-pillar structure that represents the mining environment for the extraction of coal. In brief, this study makes the following contributions
  • An extensive study of the VLC framework was performed to examine the characteristics of VLC for underground coal mines which are missing in the literature.
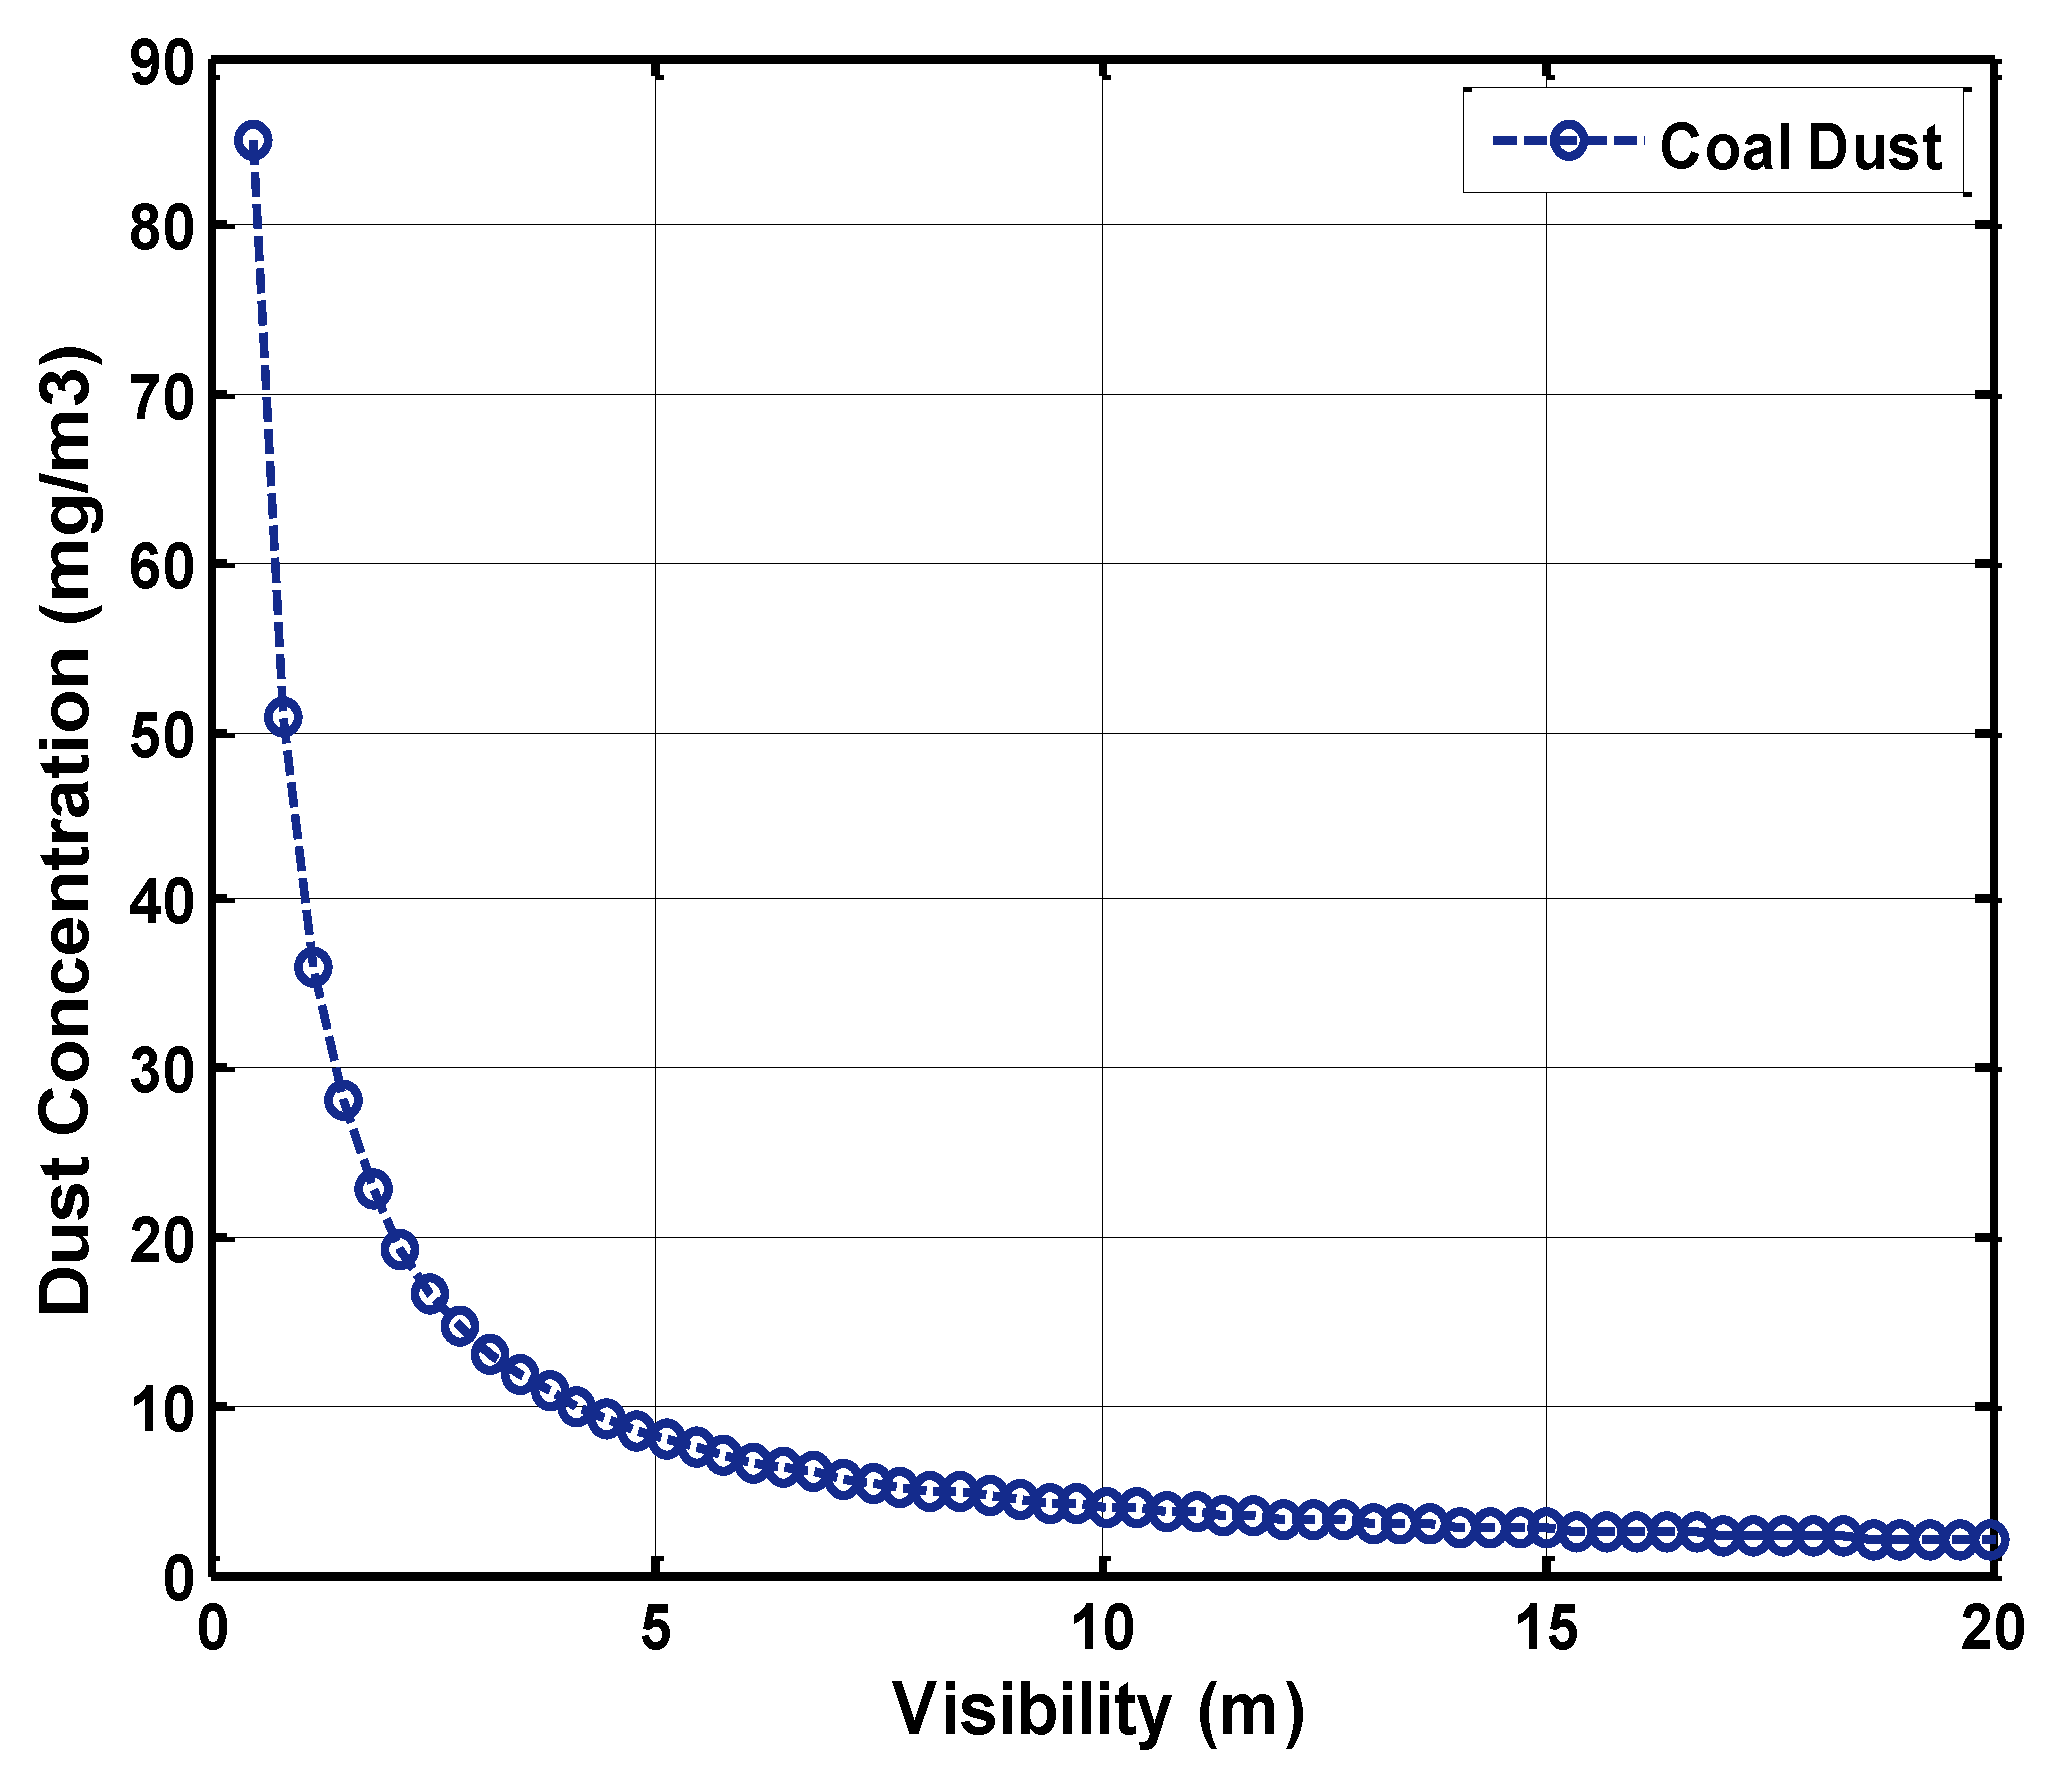
  • The influence of coal dust on visible light propagation was investigated by considering its concentration effect on the visibility reduction. The attenuation due to the suspended coal dust particles is estimated by using the attenuation visibility model.
  • In the absence of a reflection point, a shadow will be generated by the obstacle that blocks the visible light propagation. The probability of error due to the shadowing is examined in this study by utilizing the bimodal Gaussian distribution (BGD). Moreover, the Mie scattering phenomena were modeled and the analysis of scattering against the particle size of coal dust is discussed.
  • The performance of the proposed framework is examined by computing the received signal power, path loss, delay spread (DS), and signal to noise ratio (SNR).
The rest of this manuscript is organized as follows. A few research papers related to the current study are discussed in Section 2 while Section 3 describes the channel modeling of visible light communication. The illuminance modeling for mine gallery and sub-gallery is presented in Section 4. Section 5 presents the analysis and findings on the influence of coal dust particles. Simulation results are presented in Section 6 and finally Section 7 provides the conclusion.

2. Related Work

The study of VLC is growing progressively and advanced techniques are being analyzed by various research communities for their potential applications. The channel modeling of VLC plays a vital role to achieve efficient and reliable outcomes from such techniques. VLC is a novel branch of OWC. Unlike the research on OWC systems, which has been matured over the years for typical indoor environments, there exists a huge gap in the domain of sophisticated VLC systems for underground mines. A brief overview of existing research in the area of VLC is presented in this section.
A recursive approach for infrared spectrum has been proposed for indoor environment in [19], which has been extended later for VLC modeling where the wavelength of the infrared signal was replaced by the optical source [17]. Several simulations were performed to compare the delay profile of VLC with the infrared communications to prove that VLC provides larger transmission bandwidth. Similarly, a ray-tracing scheme has been suggested to examine the characteristics of VLC in [20]. Unlike previous works that consider Lambertian sources, the research obtains CIR for nonideal sources and mixed specular-diffuse reflections. Results show that the specular and mixed cases create fluctuations in CIR and results indicate deviations from diffuse cases.
Some authors presented channel modeling based on the geometry of the environment where the physical characteristics and their propagation effects have been considered for the VLC system [21]. A study to investigate the SNR induced by an organic LED is conducted for an indoor atmosphere and a detailed analysis is presented to observe illumination characteristics in [22]. Experiments are conducted in a room to investigate the potential of utilizing the SNR and bandwidth for communication through LEDs. Simulations conducted using deterministic and Monte Carlo techniques show the possibility of using SNR and bandwidth for communication. The impact of employing the array of LEDs and the study of distributed wavelength for visible light transmission in mines has been discussed in [23].
Various studies have been presented to estimate the positioning and localization by visible light in the underground mines. A visible light-based positioning system is presented in [24] where a trilateration approach is adopted for positioning and tracking people in the mine environment. Several fixed reference points are deployed containing three LEDs per reference cell. Experiments indicate that increasing the number of reference points increases the positioning accuracy. Similarly, a positioning approach for underground mining tunnels is introduced in [25] where LEDs and photodetector are utilized. A hybrid VLC-RF approach is proposed to examine its effectiveness by utilizing phasor measurement units in underground deep tunnels [26]. The study achieves high accuracy positioning results in global positioning system (GPS) denied environments like underground mines, and tunnels using the proposed approach.
A study is conducted to mitigate the inter-cell interference (ICI) in underground mines by introducing an approach of angle diversity receiver (ADR) [27]. The channel model used for experiments considers both LOS and NLOS scenarios. Results indicate that hemi-dodecahedron ADR can provide a maximum user data rate of 250 Mbps in mining roadway and 120 Mbps for mine working face environments. A scattering model is presented in [14] along with the shadowing effect induced by the presence of mining objects and the geometrical influence of transceivers is suggested for rough boundary surfaces. The positioning of LEDs and PDs is characterized in terms of tilt and rotational angles to examine the impact on scattering coefficients by considering the physical non-flat structure of mine walls and most results are reported in the form of CIR. But the channel model for received signal power has not been discussed, the visibility factor induced due to the floating concentration of dust particles is not provided in the literature, illuminance model to compare light intensities in a different zone of mines has not been investigated and SNR with respect to classified galleries is still missing in the literature.
A path loss model is discussed in [28] by considering the area of mining roadway and workface to distinguish its characterization based on the Lambertian model along with the effect of LOS and NLOS scenarios. A neural network-based optical channel is suggested in [29] and the analysis is conducted in the dark gallery by employing the auto-regressive exogenous approach. However, the scattering effect and non-uniform internal structure are not sufficiently explained. The impact of reflections induced due to the surrounding boundary is examined by incorporating the VLC Lambertian model and the performance is evaluated by symbol error rate (SER) in [8]. Correspondingly, the scattering effect and shadowing are analyzed by using the independent channel phenomena but the analytical model is not included in [30].
The above cited research works analyze and investigate various aspects of VLC concerning its use in harsh environments such as underground mines, and tunnels, etc. However, the complete scope of VLC and the influence of various deteriorating factors is an unexplored area. This study aims at analyzing various factors of the VLC system for underground coal mines.

3. VLC Channel Model for Coal Mines

This section discusses the channel modeling of VLC in the underground coal mine by using the ray-tracing approach, which describes the accurate behavior of light propagation and its interaction with physical parameters. The basics of the Lambertian model are utilized to demonstrate the characteristics of the optical signal in the coal mine atmosphere. The VLC framework is utilized by implanting the array of LEDs on the top ceiling with a specific periodic distance (4 m) to cover the entire area of the mine galleries and it is assumed that the optical response of each LED is following the Lambertian radiation pattern (LRP) that can be given as
R ( ϕ ) = m + 1 2 π c o s m ϕ , ϕ π 2 , π 2
where ϕ is the angle of irradiance and m denotes the mode number of LRP. At the reception side, a photo-diode (PD) is embedded on the helmet of a coal miner to develop a VLC link between miners and mining infrastructure for data transmission. Let A R x be the receiver’s aperture that is collecting optical radiation with the incident angle θ , and then the effective collection of radiation intensity will be proportional to A R x c o s θ .
The intensity modulation (IM) technique is used to modulate the data on the optical signal by switching the intensity of LED that cannot be noticed by the naked eye whereas the direct detection (DD) scheme is used at the reception node in the VLC link. The data signal that needs to be transmitted through the LED node is converted into an electrical unipolar waveform. Later, this signal is modulated on the visible light to generate a field of view (FOV). The modulated light intensity received by the PD mounted on the miner’s helmet is converted back to an electrical signal for demodulation after passing through noise filters to purify the data. The existence of mining equipment and irregular geometry generates multiple reflections of the optical signal; the reflected signal collected by the receiver is considered under the NLOS link. The other light sources for illumination generate interference, which restricts the data rate of the VLC system and causes optical noise. The received signal y ( t ) of VLC channel inclusive of background noise n ( t ) can be modeled as
y ( t ) = γ x ( t ) h ( t ) + n ( t )
where γ is the efficiency of conversion, x ( t ) is the transmitted signal, ⊗ denotes the convolution process and h ( t ) represents the impulse response. Two kinds of VLC links have been considered in this study: LOS and NLOS. The LOS link that propagates the direct light from LED to PD and the NLOS link where the light signal hits the reception node through the aid of a reflector, as its geometry is shown in Figure 3.
The impulse response h L O S ( t , T x , R x ) of VLC LOS link can be given as [31]
h L O S ( t , T x , R x ) = m + 1 2 A R x c o s m ( ϕ R x T x ) c o s ( θ R x T x ) T o ( θ R x T x ) g ( θ R x T x ) π R R x T x 2 δ ( t R T x R x c ) if 0 θ R x T x Ψ R x T x 0 , if θ R x T x > Ψ R x T x
where ϕ R x T x , θ R x T x , R R x T x , denotes the angle of light emission, angle of incidence, and link distance between transmitting point T x and reception point R x , respectively. A R x is the receiver aperture, T o ( θ R x T x ) represents the coefficient of optical transmission, the speed of light is denoted by c, Dirac function is denoted by δ ( ) , Ψ R x T x signifies the FOV of receiver R x , g ( θ R x T x ) is the gain function and m is the Lambertian mode number. Correspondingly, for the NLOS path, the light signal propagates through multiple reflections and the final impulse response can be computed by taking the sum of all reflective factors. If k is the order of reflection and j is the number of reflection source, the total impulse response for NLOS link through the reflectors is given as [32]
h N L O S ( t , T x , R x ) = h L O S 0 ( t , T x , R x ) + k = 1 h N L O S k ( t , T x , R x )
where h L O S 0 ( t , T x , R x ) indicates the case of zero reflective source that leads to utilizing the LOS impulse response, and the CIR to estimate the effect of multipath reflections can be modeled as
h N L O S k ( t , T x , R x ) = m + 1 2 π j = 1 J ( 1 R j T x 2 R R x j 2 A R x c o s ( ϕ j T x ) c o s ( θ j T x ) A j p j c o s ( ϕ R x j ) c o s ( θ R x j ) T 0 ( θ R x j ) g ( θ R x j ) δ ( t R j T x + R R x j c ) ) if 0 θ R x j Ψ R x j 0 , if θ R x j > Ψ R x j
where ϕ j T x , θ j T x are the angle of emission and the incidence angle between T x and reflection point j, respectively. A j denotes j th area of reflection, J is the maximum number of reflection sources, p j represents the reflectivity and R j T x is the source to reflection distance. Similarly, ϕ R x j , θ R x j , R R x j , Ψ R x j signifies the emission angle, incidence angle, link distance, and reflector to receiver FOV, respectively.
The direct current (DC) gain of the channel can be given as
H L O S ( 0 ) = h L O S ( t , T x , R x ) d t
For the LOS VLC link, the received power of propagated light signal can be expressed as [16,32]
P R x L O S = P T x H L O S ( 0 )
P R x L O S = I T x ( α T x , β T x ) A R x c o s ( θ R x T x ) ( L E R ) ( R R x T x 2 + h 2 )
where I T x ( α T x , β T x ) represents the luminous intensity of transmitter T x with the incidence angle α T x and irradiance angle β T x , h is the miner’s height and L E R is the luminous efficacy of radiation. For the NLOS VLC link, the reception node receives the optical signal through multiple reflectors and total power can be computed by the addition of all reflected contributions. Similarly, the received power of light signal reflected from multiple sources is given as [16,32]
P R x N L O S = P T x H N L O S ( 0 )
P R x N L O S = I T x ( α T x , β T x ) j = 0 J s i n ( θ j T x ) A j A R x p j c o s ( ϕ R x j ) c o s ( θ R x j ) ( L E R ) R j T x 2 ( R R x j 2 + h 2 )
The net received power of visible light signal can be computed by the addition of the received power of both links as
P R X = P R x L O S + P R x N L O S
The SNR is computed by using optical received power P R x and the expression is given as [17]
S N R = ( γ P R x ) 2 σ t o t a l 2
where σ t o t a l 2 is the noise power, which is the sum of thermal noise and shot noise produced by the existence of other sources in the mine.

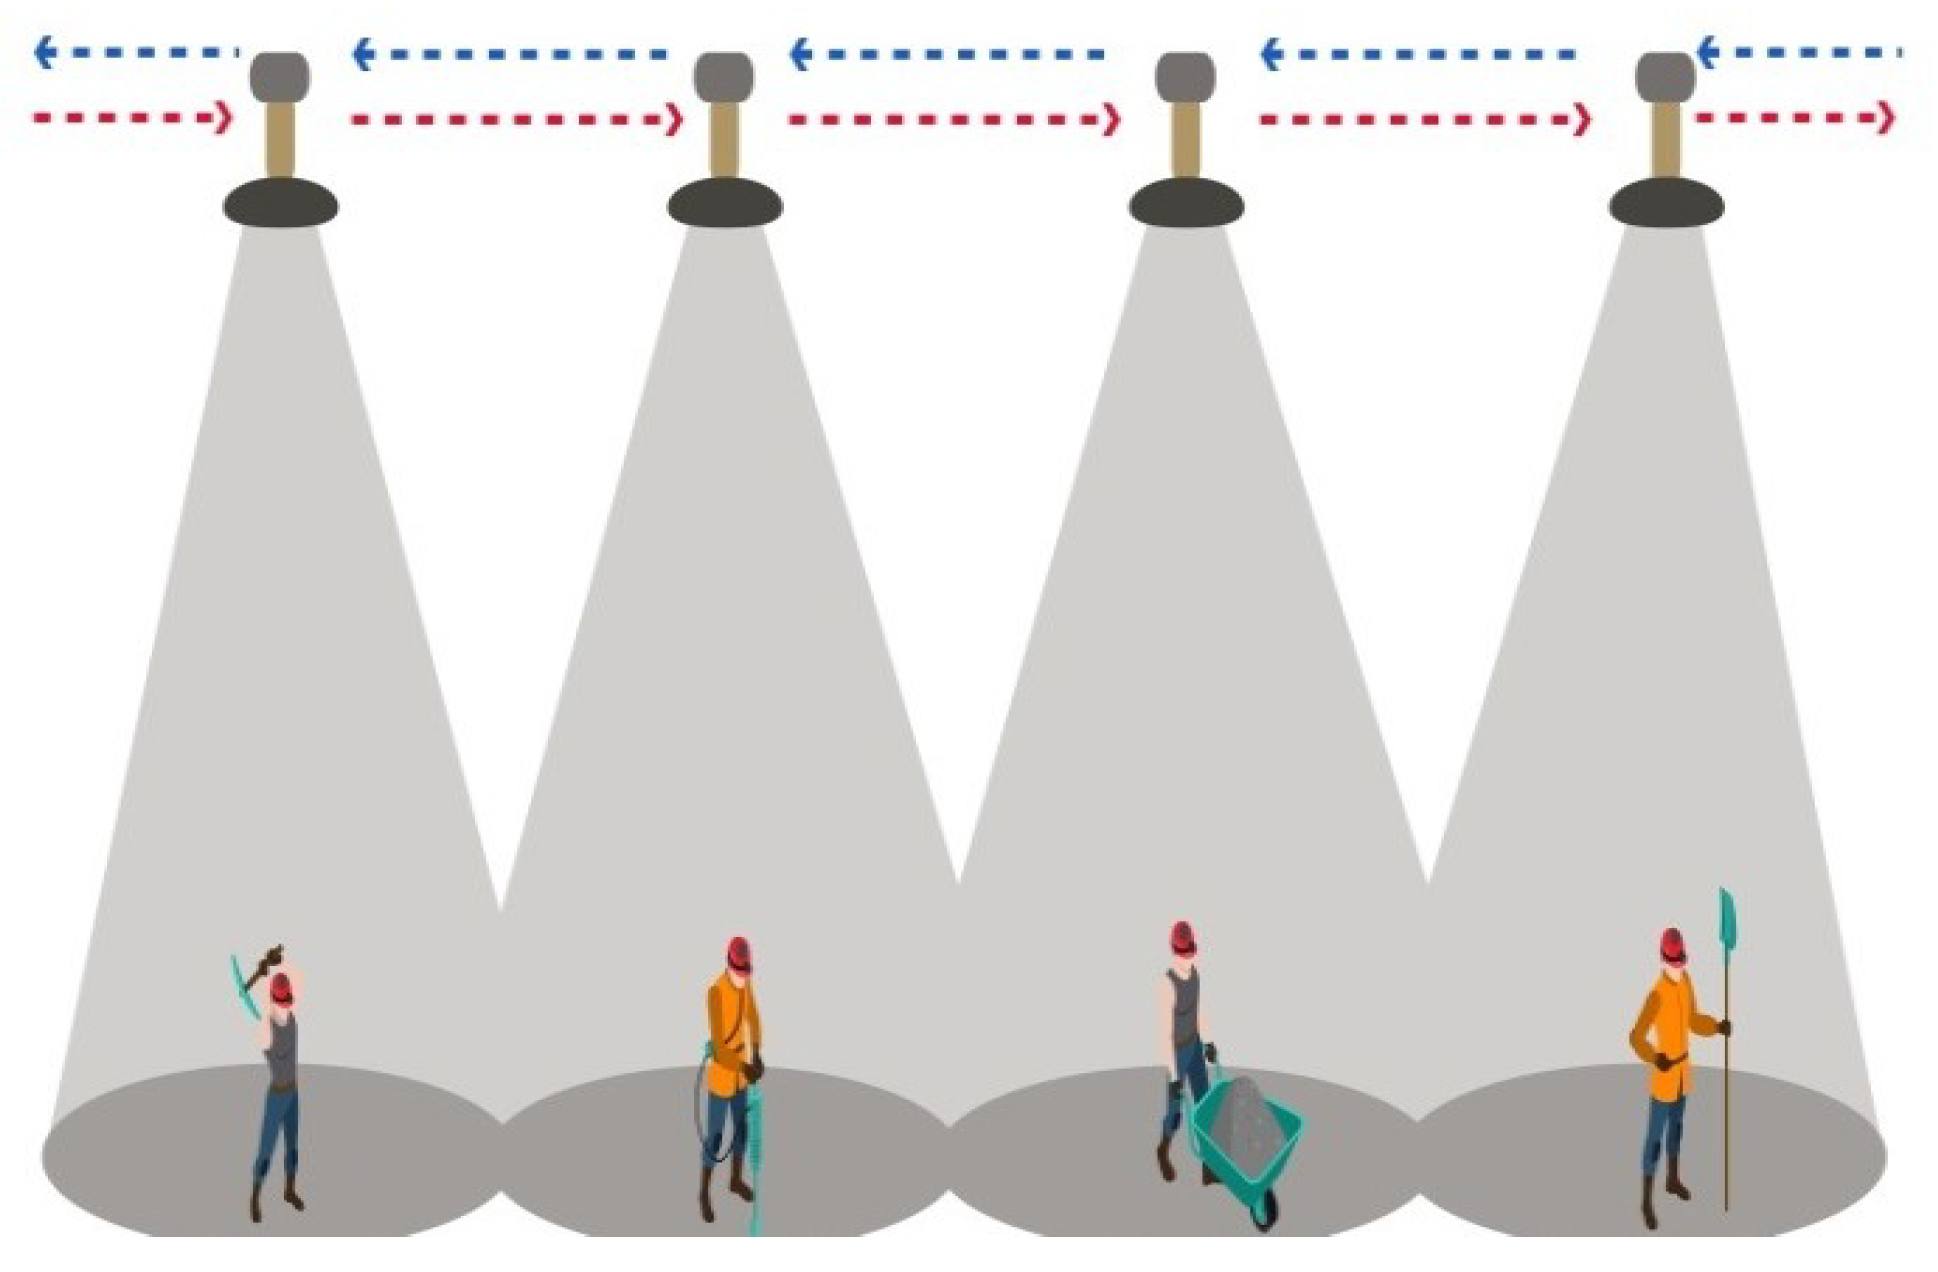
4. Underground Mine Illumination Model

The approach of lighting in the dark environment of the coal mine is quite significant for the safety of workers. The mounted LEDs on the ceiling illuminate the mine galleries and also provide a reliable channel for communication. The distribution of luminance is an effective way to mitigate the blind spots and shadowing effect in mine galleries. The threshold optical power density to illuminate the path of the gallery must be 0.15 W/m 2 and the array of LEDs can be implanted in an organized way to provide uniform illumination of minimum 108 lux [8]. These values are considered a basic standard for the underground mines to deliver better lighting and data transmission. Let d be the link distance between LED source and receiving point, N the number of LEDs, S ( λ ) the radiation distribution spectrum, then the optical power in terms of luminous flux Q can be given as [33]
Q = N 380 n m 720 n m 683 S ( λ ) v ( λ ) d λ
where v ( λ ) represents the visual sensitivity for the naked eye and λ is the wavelength of visible light. The illuminance on the reception area with the luminous intensity E ( ϕ ) and angle of emission ϕ can be expressed as [33,34]
E ( ϕ ) = Q A r = I ( ϕ ) d 2 , I ( ϕ ) = j = 1 N j I o c o s m ( ϕ )
where I o represents the center luminous intensity of LEDs.
Figure 4 shows the simulation result of illumination for mine gallery and sub-gallery. The horizontal distribution concerning distance is conducted and it can be seen that the illumination parameter is declining with the rise of distance as optical intensity has the square of inverse relationship with the distance between the LED source and reception point. The luminance for mine gallery is quite higher than the sub-gallery. Because the sub-gallery is more occupied by the mining equipment, coal dust and specifically the ceiling height of sub-galleries is always higher than the mine gallery.

5. Influence of Coal Dust Particles on VLC

The concentration of suspended coal dust particles has a strong impact on the propagated light signal. The area of the mining workface is contaminated with the heavy concentration of coal particles, which generates the absorption and scattering effect. Similarly, the existence of floating coal dust reduces the visibility for the optical signal that shortens the range of the optical link [35]. The presence of water vapors in the coal particles absorbs the optical power of the transmitted signal and particulate matter of coal dust scatters the optical beams. Both effects generate severe attenuation on the incident light and the transmission intensity of the visible light signal for this case can be expressed as [18]
I = I o e ( 3 2 ) ( C L K e d )
where C denotes the suspended particles of coal dust, L is the range of the optical link, K e denotes the attenuation coefficient for light signal ( K e = Q s c a + Q a b s ) , and d is the link distance.

5.1. Coal Dust Concentration and Visibility

Visibility is an important parameter to consider while modeling the wireless optical network. The gallery of a coal mine is composed of coal dust particles which affect the friendly environment for optical transmission and induces a strong reduction of visibility. The visibility data is a dynamic parameter due to the variation in the concentration of coal dust. The particular values of visibility are collected from multiple coal mines of Xi’an, China, and a model of suspended coal dust concentration with respect to visibility is given as [36]
C = 4050 V 1.016
where C denotes the concentration of coal dust and V represents the visibility.
A relationship between coal dust concentration and visibility is plotted in Figure 5. It can be seen that visibility has an inverse relation with the concentration of coal dust. The drastic change can be noticed in the visibility when the concentration of coal dust exceeds a particular limit. The visibility reduces to less than 2 m for the occupied suspended particles of more than 10 mg/m 3 and there is a very slight decline in the concentration of coal dust for the rest of the visibility range.
The concentration of coal dust normally describes the number of dust particles within a unit volume, which further reflects the visibility; this visibility parameter can be used to estimate the approximate attenuation. The visibility data are utilized to compute the coal dust attenuation for optical signal in an underground mine and the expression for attenuation is given as [37]
A = 4.714 × 10 16 ϵ i 0 r 3 p ( r ) d r λ V ( ϵ r + 2 ) 2 + ϵ i 2 e x p ( 1.25 h ) o r 2 N ( r ) d r
where r is the radius of a coal dust particle, p ( r ) is the log-normal particle radius distribution, λ denotes the wavelength, V denotes the visibility, h is the vertical height, N ( r ) denotes the probability density distribution function. The parameter ϵ r and ϵ i are the real and imaginary parts of the permittivity for coal particles, respectively.
Figure 6 shows the plotted relation of visibility and dust attenuation for optical transmission. The plotted results show the theoretical values using Equation (17); however, the value of V parameter in Equation (17), is obtained from the visibility data measured in three different coal mines of China, and this visibility data are utilized to estimate the attenuation. The graph of dust attenuation for VLC decreases with the rise of visibility. The visibility reflects the clarity of the atmospheric medium for visible light propagation. Dust attenuation will be increased with the hike of polluted coal dust particles that causes optical power absorption and visibility reduction. The attenuation can also be reduced by using the optical signal of a higher wavelength but this study is focused to investigate the characteristics of the VLC spectrum only.

5.2. Mie Scattering for Visible Light Communication in Coal Mines

The impact of scattering in underground coal mines requires special attention while modeling the VLC systems in such a harsh environment. For a typical indoor environment, the scattering effect produced by the dust can be ignored but it is very important to consider it for the optimal VLC framework in coal mines. The sub-gallery of coal mines is composed of workface units where mining machinery is doing its job that causes to float heavy concentration of coal dust particles. These particles interact with the optical signal and lead to generate scattering effect, as presented in Figure 7. This section is focused to analyze the Mie scattering phenomena for VLC in the coal mine. The characteristic study of Mie scattering is quite significant for the VLC system. The particulate matter of suspended coal dust is assumed to be spherical and uniformly distributed in mine sub-galleries. When the incident light interacts with the suspended particulate matter, its intensity can be classified into parallel and vertical components at the observant point. Hence, the scattered intensity I s c a can be expressed as [34].
I s c a = I v + I p
I v = I ( ϕ ) λ 2 4 π 2 r 2 f 1 s i n 2 θ
I p = I ( ϕ ) λ 2 4 π 2 r 2 f 2 c o s 2 θ
where I v and I p are the vertical and parallel component of the scattered intensity of light, respectively, I ( ϕ ) denotes the illuminance, r represents the distance between the observation point and suspended particle, θ denotes the polarization angle of incident light, and ϕ is the scattering angle. Components f 1 and f 2 are the intensity functions for vertical and parallel components, respectively. These parameters reflect the scattering angle ϕ , particle size α , and refractive index of spherical suspended particles. The expressions for intensity functions are given as [32,34]
f 1 = | g 1 ( q , ϕ , α ) | 2
f 2 = | g 1 ( q , ϕ , α ) | 2
where q is the refractive index, while g 1 and g 2 are the amplitude functions that can be given as
g 1 = m = 1 2 m + 1 m ( m + 1 ) a m γ m + b m x m
g 2 = m = 1 2 m + 1 m ( m + 1 ) a m x m + b m γ m
where a m and b m represents the scattering coefficients and γ m and x m denote the functions of scattering angle. The mathematical expressions of a m and b m are given as [13,19]:
a m = Ψ m ( β ) Ψ ´ m ( q β ) l Ψ ´ m ( q β ) Ψ m ( q β ) ξ m ( β ) Ψ ´ m ( q β ) l ξ ´ m ( q β ) Ψ m ( q β )
b m = m Ψ m ( β ) Ψ ´ m ( q β ) Ψ ´ m ( q β ) Ψ m ( q β ) m ξ m ( β ) Ψ ´ m ( q β ) ξ ´ m ( q β ) Ψ m ( q β )
Ψ m ( z ) = z π 2 1 2 j m + 1 2 ( z )
ξ m ( z ) = z π 2 1 2 H m + 1 2 ( z )
where β represents the particulate size parameter β = π α λ , z is the height of the transmitter, j m + 1 2 and H m + 1 2 are the Bessel and Hankel functions, respectively. The scattering angle parameters can be expressed as [32]
λ m = d P m ( c o s ϕ ) d c o s ϕ
x m = d d ϕ P m ( 1 ) ( c o s ϕ )
where P m ( 1 ) ( c o s ϕ ) represents the first order Legendre polynomial function. The scattering coefficient Q s and extinction coefficient Q e can be derived from the above expression as
Q s = 2 β 2 m = 1 ( 2 m + 1 ) ( | a m | 2 + | b m | 2 )
Q e = 2 β 2 m = 1 ( 2 m + 1 ) R e ( a m + b m )
Simulation results for scattering coefficient and extinction coefficient are shown in Figure 8. It can be seen that the size of the coal particle has a very low effect on the scattering coefficient and its intensity increases with a very low difference but a drastic change can be noticed in the extinction coefficient when the particle size exceeds 500 nm. The maximum obtained value of Q e is 1.35, and a maximum value of 0.39 is captured by Q s .

6. Results and Discussion

Multiple evaluating parameters based on the proposed theoretical model were simulated and analyzed in this section to examine the capability of the VLC framework in the harsh environment of the coal mine. The CIR and received power are validated by presenting the comparison analysis between experimental and theoretical outcomes. The simulation model parameters that were used under this investigation are briefly presented in Table 1.

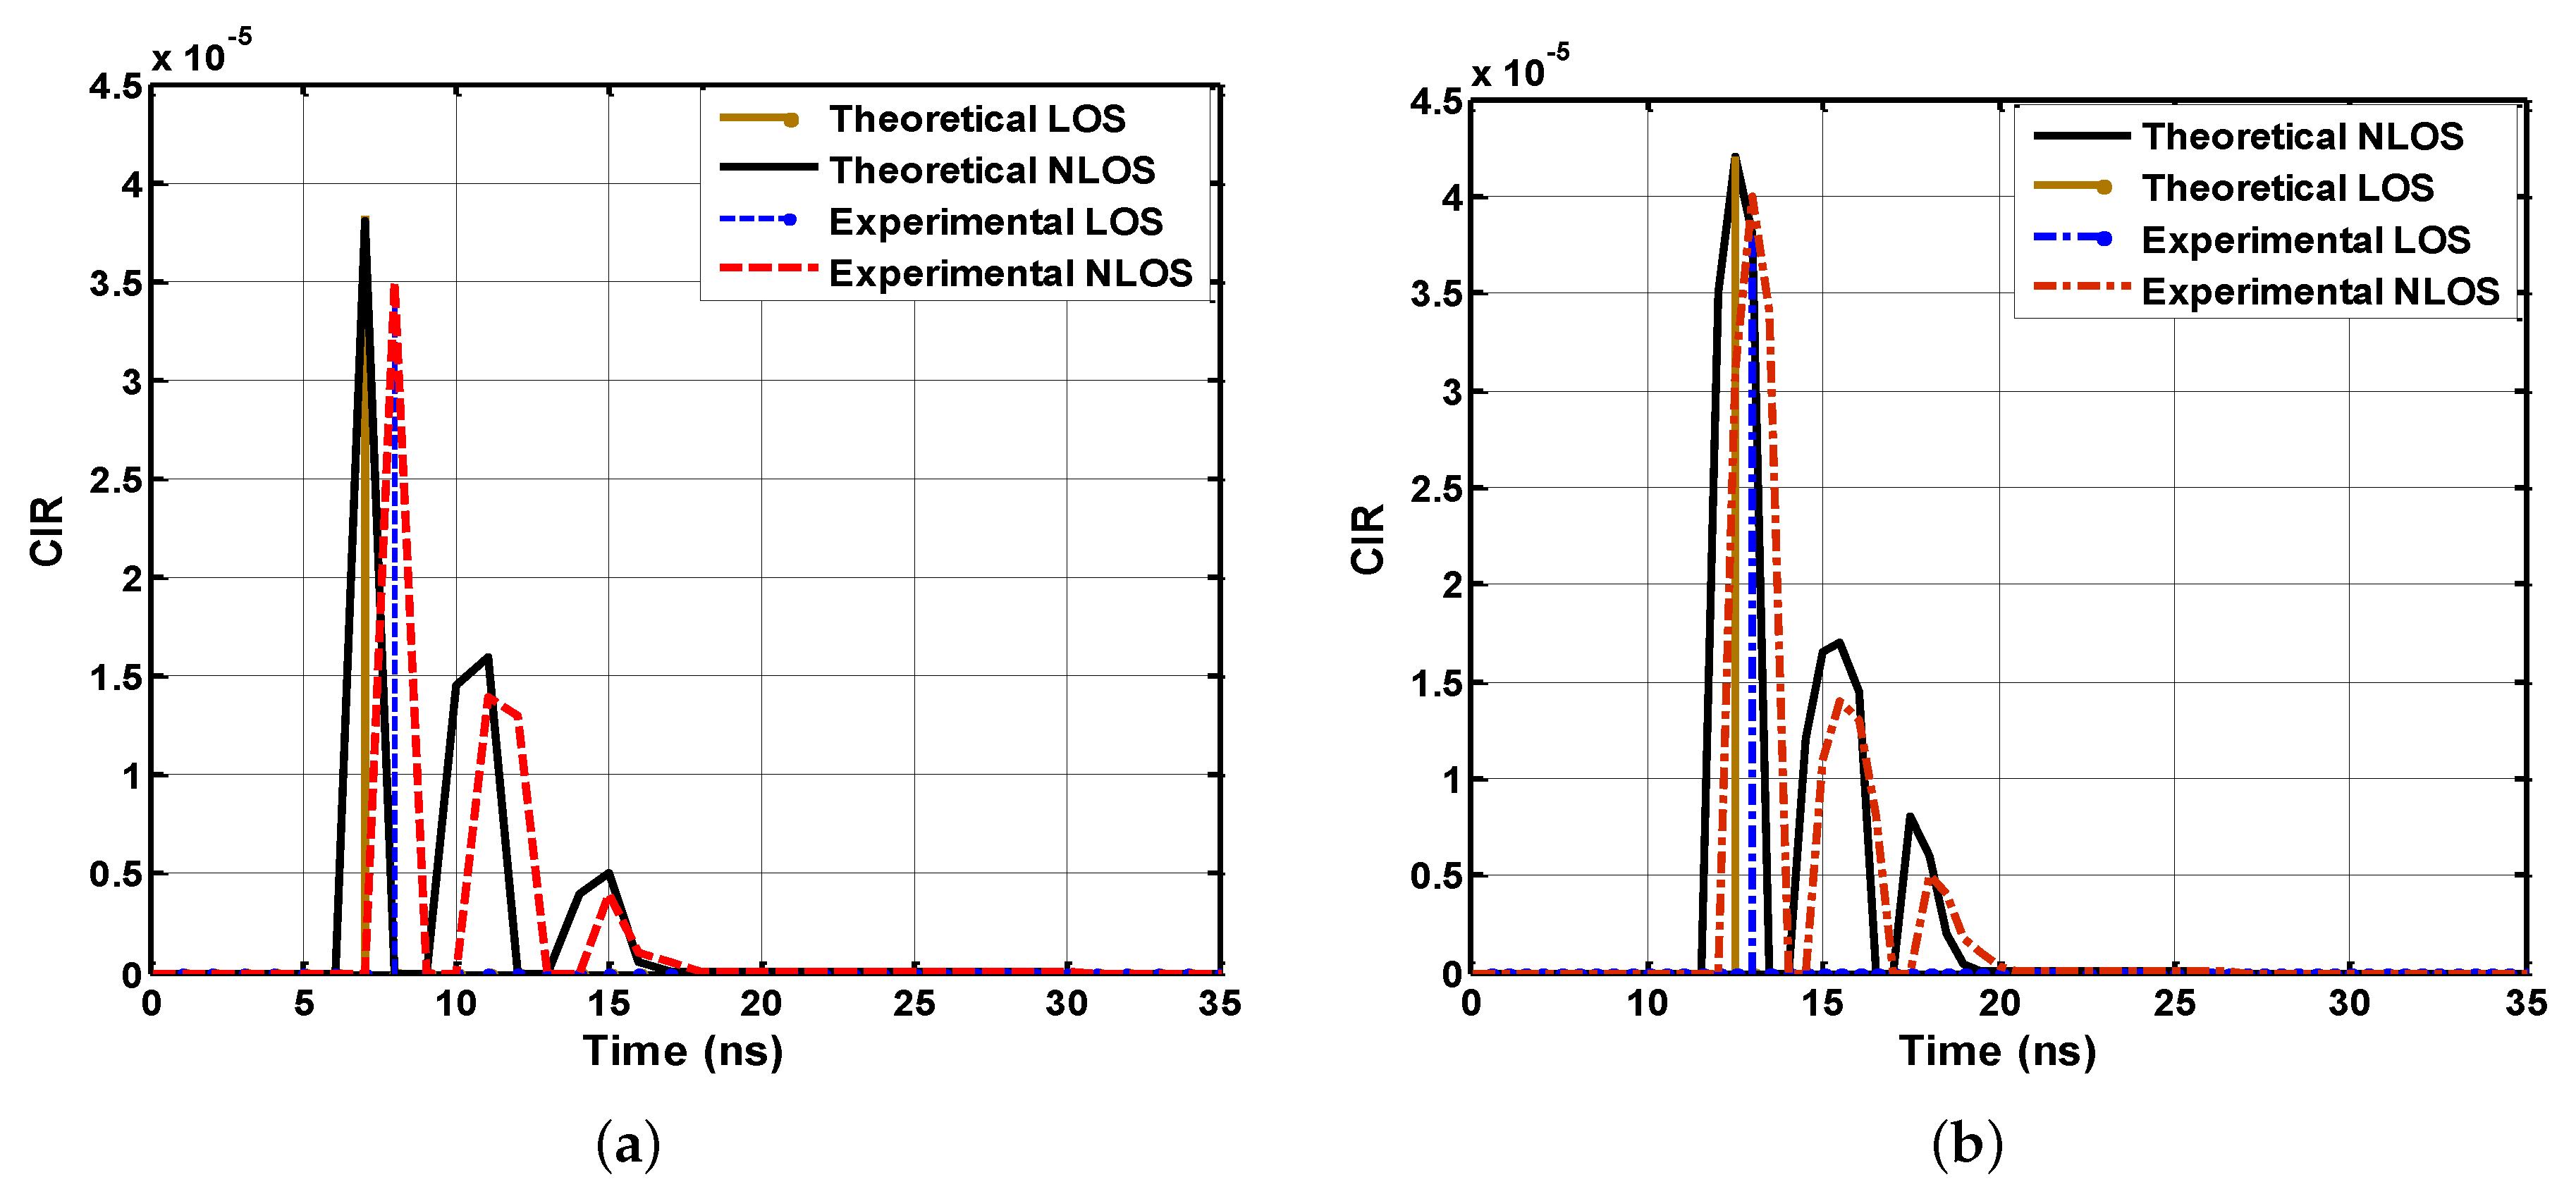
6.1. Channel Impulse Response
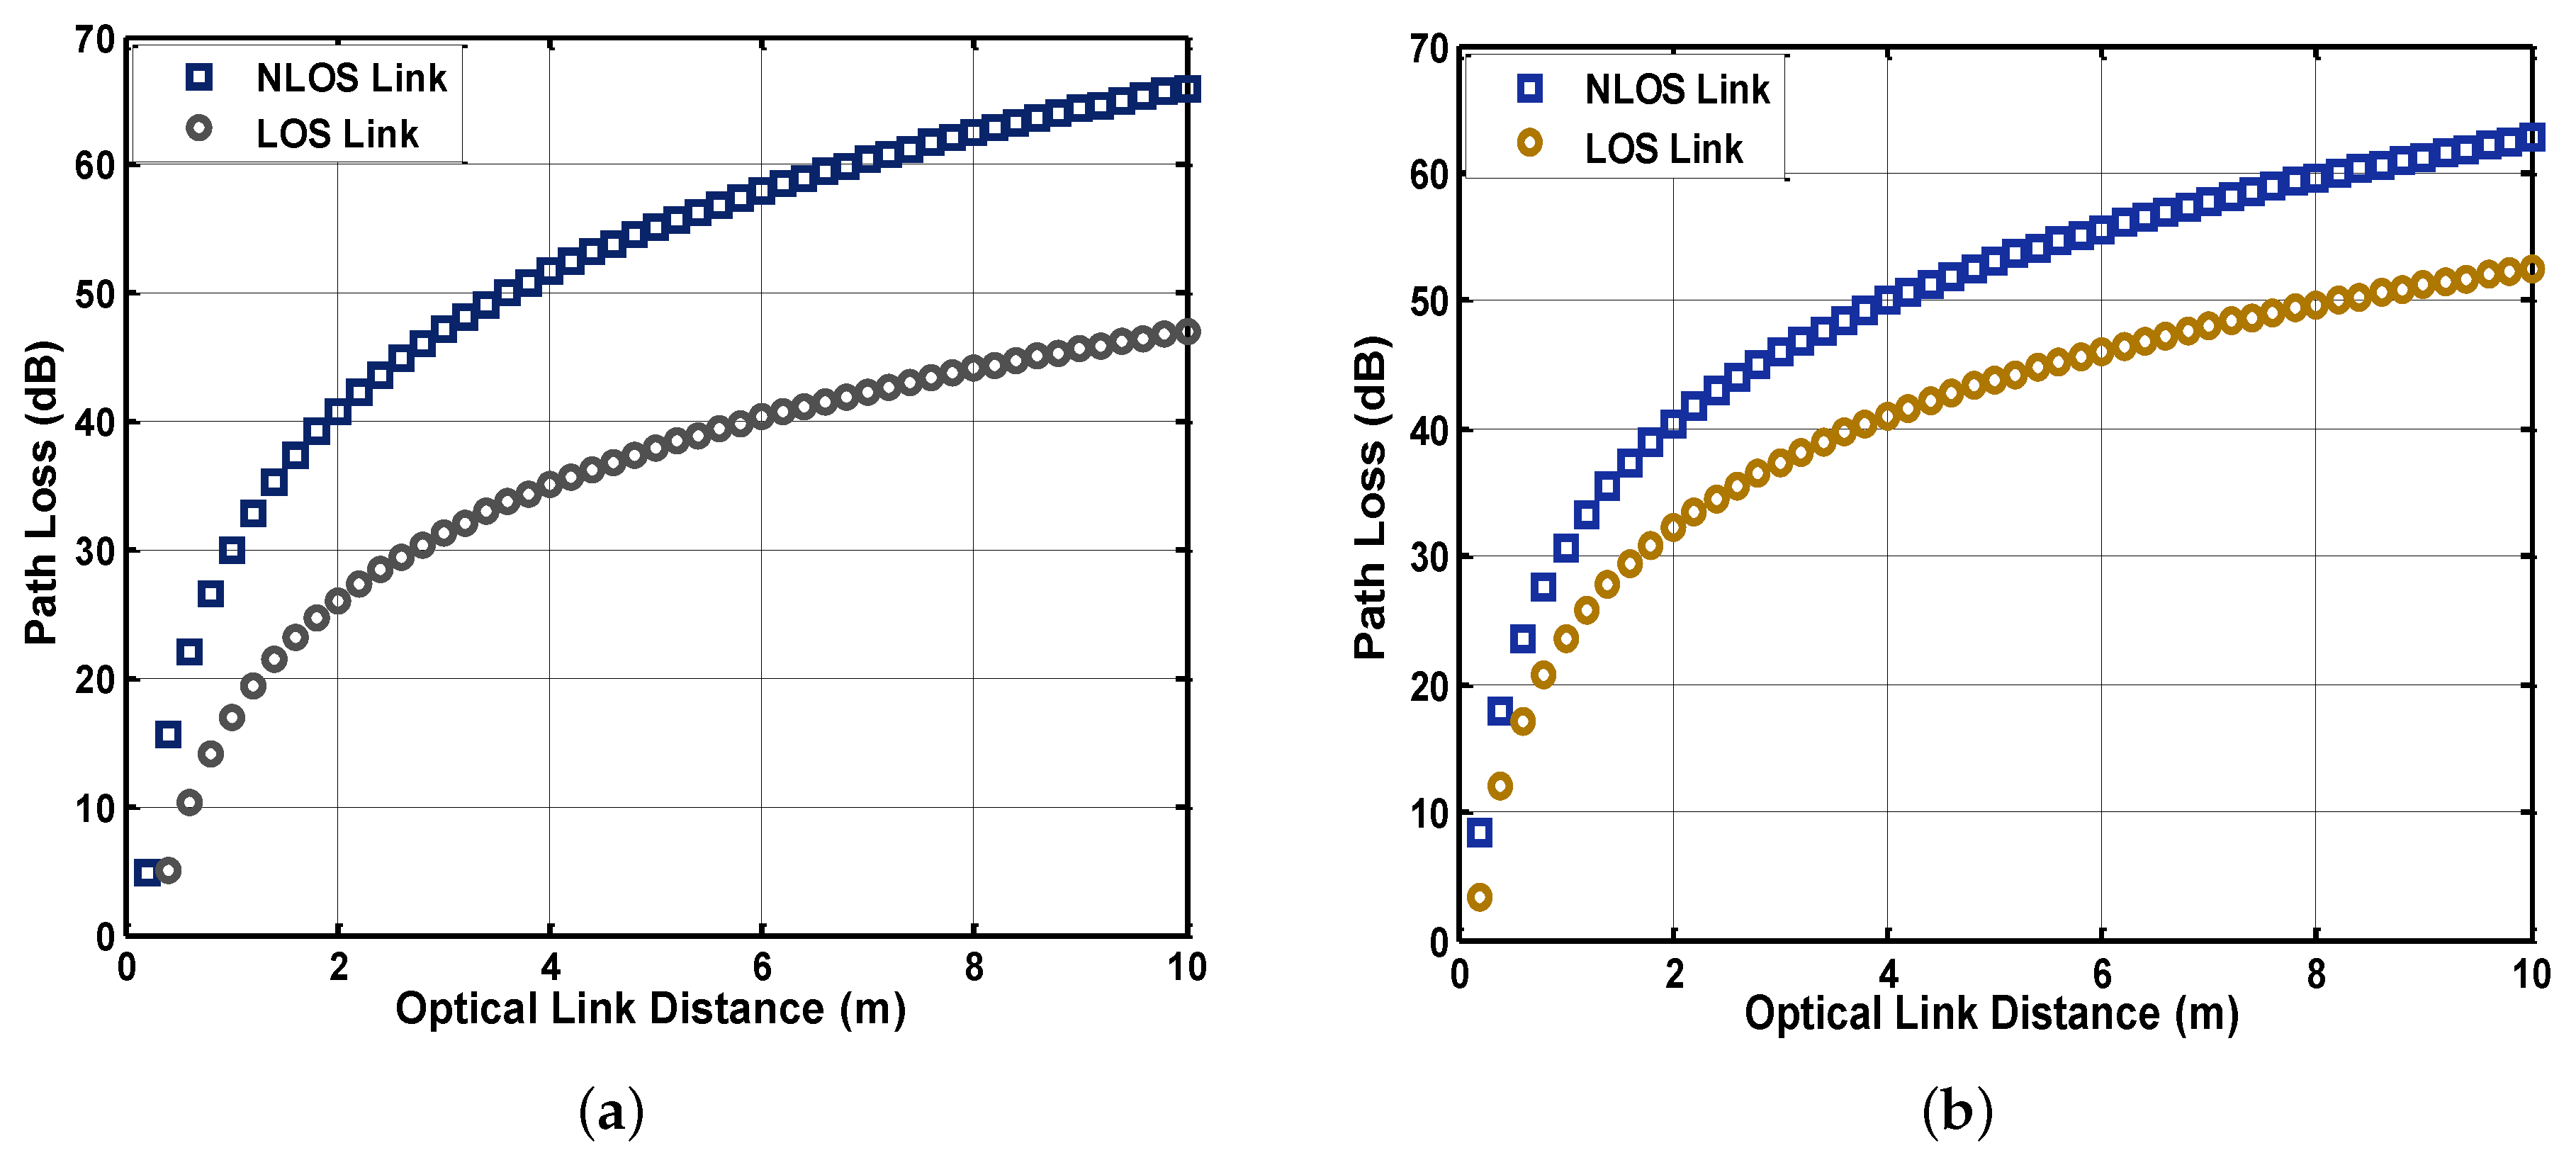
The environment of coal mine considered for NLOS multipath propagation composed of mine gallery and sub-gallery. The experimental calibration was carried out by taking the dimensions (width × length × height) 5 m × 6 m × 6 m and 8 m × 6 m × 6 m for the mine gallery and sub-gallery, respectively. The LED was implanted on the center of the ceiling pointing vertically downwards with a semi-angle 60 ° at the coordinate location 2.5 m × 3 m × 6 m and 4 m × 3 m × 6 m for the mine gallery and sub-gallery, respectively. The FOV of PD is 60 ° and its aperture value is considered 1.2 cm 2 . The mixed reflection scheme was taken while computing the CIR for the NLOS link. The inner boundary material is raw coal and some mining metal objects are considered for estimating the multipath reflection effect. The order of reflection effect is restricted to three bounces ( k = 3 ) , and the value of reflection coefficients are given in Table 1. The height of the miner was assumed to be 1.8 m, which depicts the height of the PD. The PD is located at 2 m × 2 m × 1.8 m in the mine gallery and 3 m × 2 m × 1.8 m in the sub-gallery. The CIR for LOS is computed by using Equation (3) and the CIR for NLOS link is calculated by using Equations (4) and (5). Figure 9 shows the plotted results of CIR for both galleries of coal mine and comparison analysis between theoretical and experimental outcomes has been presented as well.
It can be seen from Figure 9 that three peaks appear in the graph, corresponding to the third order reflection ( k = 3 ) of the visible light. The power after each bounce is clearly decreased and the arrival time is increased with the particular delay for the higher-order reflections. Figure 9b shows that the delay is enhanced in the environment of the sub-gallery as its dimension is larger than the mine gallery. There is a slight difference between experimental and theoretical outcomes due to the use of commercial equipment and calibration errors.

6.2. Path Loss

The impact of multipath fading is normally considered in radio communication systems but this attenuating factor also affects the VLC system due to the rough boundary walls of coal mine and mining equipment. However, the physical geometry of a coal mine and the deteriorating factors induce path loss for visible light propagation. The propagation loss for visible light transmission can be characterized as [38]
P L = 10 l o g 10 0 h ( t ) d t
For a typical mine environment, the logarithmic distance-dependent path loss in optical communication has a direct relation with the reference distance and the shadowing effect of light due to the obstacles in the transmission path. The distance-based path loss for the underground mines can be expressed as [39]
P L = P L ( d r ) + 10 n l o g 10 d d r + χ
where d r is the reference distance, n denotes the exponent of propagation loss, d signifies the link distance and χ is the random variable that reflects the shadowing factor. The degrading influence of irregular mine structure experienced by the VLC channel is computed in the form of path loss for both galleries. The path loss is examined by considering LOS and NLOS links. The computed values of P L ( d r ) , n, d r in the mine gallery are 23, 3.6, and 4 for LOS link and 24, 3.2, and 4 for NLOS link, respectively. Similarly, these values are different for the sub-gallery environment such as 23, 1.2, and 5 for LOS and 24, 1.4, and 4 for NLOS sub-gallery link, respectively.
It can be observed from Figure 10 that the behavior of path loss is initially exponential for the near region and becomes linear while moving away from the transmitting source. The gap of propagation loss between both links is not huge if the miner exists in the near zone of transmitting LED. Also, the path loss exponent n is considered different for both links and galleries. Figure 10a shows the result of path loss in the mine gallery environment, and the simulated result for the sub-gallery is depicted in Figure 10b. It is quite clear that the mine gallery is usually narrow than sub-galleries and this compact space of the mine gallery leads to generate multiple reflections for the propagated light signal. The loss is considered more appropriate in the area of multiple reflectors. Therefore, it can observe that the path loss for the sub-gallery is lower than the mine gallery.

6.3. Received Power

The relation of received power and optical link distance is plotted by using Equations (8) and (10). The behavior of visible light propagation is examined in terms of received power in both environments of mine galleries. Figure 11a,b show the simulated results for optical received power in the mine gallery and sub-gallery, respectively. It can be seen from Figure 11 that the LOS link dominates in both zones of galleries and the performance of the NLOS VLC link is dependent on certain environmental conditions. The optical link of 10 m is investigated in the critical atmosphere of coal mine and the impact of environmental circumstance is evaluated in terms of link classification. The received power difference between LOS and NLOS link is appropriately high due to the number of reflections from the surrounding. The reflected surface absorbs and scatters the optical beams from the original path which affects the signal power for the receiver end. It reveals the scenario of the internal rough boundary of the coal mine, space between boundary walls, and the existence of mining infrastructure which causes to generate reflections for visible light propagation. The received power is computed by considering the three bounces of reflection effect ( k = 3 ) for the NLOS link. Note that the reflection order and the sources of reflection are considered same in both galleries while computing received power but the angular geometry and distance are entirely different. The distance between the reflected surface and optical receiver is usually high in sub-galleries, which deteriorates the optical power for the VLC link. The larger dimension of the sub-gallery increases the distance from reflection point to receiver that leads to induce low received power at the reception point. The NLOS VLC link in the sub-gallery attained low received power with the value of −68 dBm at a maximum distance of 10 m whereas the −59 dBm received power is obtained in the case of mine gallery.
It can be observed that the declining behavior of received power is proportional to the optical link distance. The value of signal power is decreased instantly in the first 2 m of distance, and after 5 m, this response becomes linear. The optical source is mounted on the roof ceiling of the mine gallery and the compact irregular coal surface absorbs the power of light right after the emission of the beam. The distance of the light source and boundary surfaces is noticeably less than the miner’s reception node that causes a severe attenuating effect on the overall power of the received signal.

6.4. Delay Spread

The root mean square (RMS) DS is an important factor to examine the multipath propagation effect for visible light propagation in underground coal mines and this kind of dispersion degrades the bandwidth of the channel. The compact environment of the mine gallery and the irregular occupied structure of the sub-gallery generate multiple sources of reflectors that cause the original light signal to split. These multiple signals propagate on the channel of different path lengths and hit the receiver at a different time span by induces a delay. The time difference between multiple signal receptions and the particular delay after the arrival of the first light signal is declared as excess delay τ i . This kind of multipath reflection induces the temporal dispersion that has a direct relation with the CIR of the VLC system. The RMS DS σ τ for VLC channel can be given as [32,40]
σ τ = i τ i μ τ 2 i h i 2 ( t )
where h i denotes the CIR in terms of the numeric sum of all the samples of channel components and μ τ is the mean excess delay which depends on the time of the propagated signal from source to receiver and it can be expressed as [40]
μ τ = i τ i h i 2 ( t ) i h i 2 ( t )
The behavior of RMS DS is plotted in Figure 12. The number of reflections plays a key role in generating a DS in the environment of the coal mine. The compact and rough boundary walls of the mine gallery produce a higher number of reflections than the sub-gallery, which generates a high value of RMS DS. It can be reduced by mitigating the specific sources of reflection.
Figure 12 shows that the RMS DS initially increased and then its graph gradually declined while going away from the transmitter. The computed values of RMS DS are high in the environment of the mine gallery with the non-uniform pattern whereas this hike is quite lower in the sub-gallery due to the availability of large room space. It can be observed that the peak value of RMS delay spread is attained at 1 m distance in the mine gallery, whereas this value appears at 2 m distance in the sub-gallery. Because the structure and the physical geometry of mine gallery and sub-gallery are different, it leads to generating different temporal dispersion effects. The mine gallery is composed of compact space and its narrow dimension induces more reflections that cause to attain the peak value at 1 m. The sub-gallery is wider than the mine gallery that reduces the intensity of the dispersion effect. The maximum obtained values are 0.54 ns and 0.24 ns; similarly, the minimum values are 0.18 ns and 0.05 ns for mine gallery and sub-gallery respectively.

6.5. Signal to Noise Ratio

The suggested VLC link is evaluated by analyzing its SNR following the environments of mine gallery and sub-gallery. The SNR as a function of optical link distance is computed by using Equation (12). The integrated received power of LOS and NLOS link is used to compile the SNR. Hence, the dependency of received signal power will reflect the response of SNR in the galleries of underground coal mines. The value of noise power is considered to be different for both environments according to their physical characteristics and geometry. It can be seen from Figure 13 that the SNR decreases exponentially in the near zone of transmitting LED, and then the response becomes linear for the rest of the optical link distance. The attenuating factors of mine have a severe impact in the near zone of the optical link that leads to the exponential decline of SNR. The sub-gallery of the coal mine is wider and more occupied by mining tools than the mine gallery, which generates more noise sources. These degrading sources generate noise and strongly affect the optical signal power, which results in a lower SNR for mine sub-gallery.
Therefore, the plotted value of SNR is better in the environment of the mine gallery. The maximum to minimum obtained range of SNR is 67 dB to 17 dB and 51 dB to 4 dB for the mine gallery and sub-gallery, respectively.

6.6. Shadowing

The impact of shadowing is very important to consider while characterizing the VLC model in underground mines. The room-and-pillar structure in coal mines and various kinds of mining machinery generates the severe shadowing effect that can easily impair the VLC system in that particular area [41]. The optical communication usually operates on the LOS approach and mild shadowing can be mitigated through the implantation of particular reflectors to improve the accessibility of light. The impact of shadowing for VLC can be calculated by employing the BGD model [42]. The blocking object in the path of visible light is the main source of shadow that can be estimated by identifying the particular source as a cylindrical object with a specific height and width. The BGD can signify the distinct propagation modes induced due to the different polarizations and the probability density function (PDF) of BGD can be given as:
f ( x , μ o , σ o , μ 1 , σ 1 ) = 1 2 2 π ( σ o ) 2 e x p ( x μ 0 ) 2 a ( σ 0 ) 2 + 1 2 2 π ( σ 1 ) 2 e x p ( x μ 1 ) 2 a ( σ 1 ) 2
where μ 0 , σ 0 represents the means and standard deviation of the first Gaussian distribution respectively. Similarly, μ 1 , σ 1 are the means and standard deviation of the second Gaussian distribution.
Figure 14 shows the simulated result in terms of probability of error to estimate the impact of shadowing in mine gallery and sub-gallery environment. The probability of error is plotted against the distance between the light transmitting source and the obstruction. It can generally be observed from the behavior of propagated light that a mild shadow is induced when the distance between the light source and blocking object is short, if this distance increases or the blocking object moves away from the light source within its optical range, this mild shadow becomes severe. The severe shadow occupies more area than a mild shadow that leads to generating high bit error. Therefore, it can be seen that the probability of error increases with the rise of distance, and the shadowing effect is slightly low in mine gallery as compared to the sub-gallery. It reveals that the environment of the mine gallery is less occupied than the sub-gallery.

7. Conclusions

This study proposes a VLC framework to mitigate the existing challenge of the unstable communication system for underground coal mines. The complete framework of VLC was investigated in this research including the influence of floating coal dust particles and the channel modeling for the erratic environment of a mine. The structure of the coal mines is composed of irregular geometry, rough boundary surface, interrupting obstacles, and clouds of coal dust that degrade the communication performance of traditional models. A characteristic study is presented to estimate the received optical power for the VLC framework in the underground coal mine. The proposed study elaborates on the possibility to compute the LOS and NLOS link as the boundary walls of the coal mine reflect the light that induces an NLOS link. The entire area of the coal mine was analyzed by classifying it into the mine gallery and sub-gallery. The coal dust floats in the air and the high concentration of suspended coal particles scatters the optical signal. Mie scattering model is explained and the intensity of scattering against the variation in the particle size of coal dust is demonstrated. The visibility reduction due to the clouds of coal dust is estimated and the illuminance comparison in both galleries is demonstrated. The impact of shadowing is examined by computing the probability density function and it is suggested to mitigate it by employing multiple reflectors to restore the blocked link. The compact space of the mine gallery with its rough boundary surface generates more reflections and induces the NLOS links, which further enhances the propagation loss and reduces the received optical power. Furthermore, a detailed analysis is conducted in terms of optical signal power, path loss, SNR, and RMS DS to evaluate the effectiveness of the suggested VLC framework in both galleries.

Author Contributions

Conceptualization, F.J.; data curation, A.H. and I.A.; formal analysis, F.J., M.U.S., and I.A.; investigation, M.U.S. and A.H.; methodology, A.W.; resources, M.U.S.; software, A.H. and I.A.; writing—original draft, F.J.; writing—review and editing, A.W. All authors have read and agreed to the published version of the manuscript.

Funding

This research did not receive any funding.

Conflicts of Interest

The authors declare no conflict of interest.

References

  1. World Coal Association. Coal and Electricity. Available online: https://www.worldcoal.org/coal-facts/coal-electricity/#:~:text=Coal%20plays%20a%20vital%20role,largest%20source%20of%20electricity%20worldwide (accessed on 21 March 2021).
  2. Yarkan, S.; Guzelgoz, S.; Arslan, H.; Murphy, R.R. Underground mine communications: A survey. IEEE Commun. Surv. Tutor. 2009, 11, 125–142. [Google Scholar] [CrossRef]
  3. Singh, A.; Kumar, D.; Hötzel, J. IoT Based information and communication system for enhancing underground mines safety and productivity: Genesis, taxonomy and open issues. Ad Hoc Netw. 2018, 78, 115–129. [Google Scholar] [CrossRef]
  4. Forooshani, A.E.; Bashir, S.; Michelson, D.G.; Noghanian, S. A survey of wireless communications and propagation modeling in underground mines. IEEE Commun. Surv. Tutor. 2013, 15, 1524–1545. [Google Scholar] [CrossRef]
  5. Patri, A.; Nimaje, D.S. Radio frequency propagation model and fading of wireless signal at 2.4 GHz in an underground coal mine. J. S. Afr. Inst. Min. Metall. 2015, 115, 629–636. [Google Scholar] [CrossRef]
  6. Tang, B.; Cheng, H. Application of distributed optical fiber sensing technology in surrounding rock deformation control of TBM-excavated coal mine roadway. J. Sens. 2018, 2018, 8010746. [Google Scholar] [CrossRef]
  7. Schulze, H. Frequency-domain simulation of the indoor wireless optical communication channel. IEEE Trans. Commun. 2016, 64, 2551–2562. [Google Scholar] [CrossRef]
  8. Wu, G.; Zhang, J. Demonstration of a visible light communication system for underground mining applications. DEStech Trans. Eng. Technol. Res. 2016. [Google Scholar] [CrossRef] [Green Version]
  9. Pathak, P.H.; Feng, X.; Hu, P.; Mohapatra, P. Visible light communication, networking, and sensing: A survey, potential and challenges. IEEE Commun. Surv. Tutor. 2015, 17, 2047–2077. [Google Scholar] [CrossRef]
  10. Murad, F.A.Z.; Murdas, I.A.; Jabbar, A.R. Dust effect on the performance of optical wireless communication system. J. Univ. Babylon Eng. Sci. 2018, 26, 259–268. [Google Scholar]
  11. Yu, X.; Shi, Y.; Wang, T.; Sun, X. Dust-concentration measurement based on Mie scattering of a laser beam. PLoS ONE 2017, 12, e0181575. [Google Scholar] [CrossRef] [Green Version]
  12. Zhai, Y.; Zhang, S. Visible light communication channel models and simulation of coal workface energy coupling. Math. Probl. Eng. 2015, 2015, 271352. [Google Scholar] [CrossRef]
  13. Céspedes, M.M.; Guzmán, B.G.; Jiménez, V.P.G. Lights and Shadows: A Comprehensive Survey on Cooperative and Precoding Schemes to Overcome LOS Blockage and Interference in Indoor VLC. Sensors 2021, 21, 861. [Google Scholar] [CrossRef] [PubMed]
  14. Játiva, P.P.; Azurdia-Meza, C.A.; Sánchez, I.; Seguel, F.; Zabala-Blanco, D.; Firoozabadi, A.D.; Gutiérrez, C.A.; Soto, I. A VLC Channel Model for Underground Mining Environments With Scattering and Shadowing. IEEE Access 2020, 8, 185445–185464. [Google Scholar] [CrossRef]
  15. Almadani, Y.; Plets, D.; Bastiaens, S.; Joseph, W.; Ijaz, M.; Ghassemlooy, Z.; Rajbhandari, S. Visible Light Communications for Industrial Applications—Challenges and Potentials. Electronics 2020, 9, 2157. [Google Scholar] [CrossRef]
  16. Al-Kinani, A.; Wang, C.X.; Haas, H.; Yang, Y. Characterization and modeling of visible light communication channels. In Proceedings of the 2016 IEEE 83rd Vehicular Technology Conference (VTC Spring), Nanjing, China, 15–18 May 2016; IEEE: New York, NY, USA, 2016; pp. 1–5. [Google Scholar]
  17. Lee, K.; Park, H.; Barry, J.R. Indoor channel characteristics for visible light communications. IEEE Commun. Lett. 2011, 15, 217–219. [Google Scholar] [CrossRef]
  18. Wang, L. Research on Retrieval Algorithm of Particle Size Distribution Based on Spectral Extinction Method; Harbin Institute of Technology: Harbin, China, 2013. [Google Scholar]
  19. Barry, J.R.; Kahn, J.M.; Krause, W.J.; Lee, E.A.; Messerschmitt, D.G. Simulation of multipath impulse response for indoor wireless optical channels. IEEE J. Sel. Areas Commun. 1993, 11, 367–379. [Google Scholar] [CrossRef] [Green Version]
  20. Miramirkhani, F.; Uysal, M. Channel modeling and characterization for visible light communications. IEEE Photonics J. 2015, 7, 1–16. [Google Scholar] [CrossRef]
  21. Al-Kinani, A.; Wang, C.X.; Haas, H.; Yang, Y. A geometry-based multiple bounce model for visible light communication channels. In Proceedings of the 2016 International Wireless Communications and Mobile Computing Conference (IWCMC), Paphos, Cyprus, 5–9 September 2016; IEEE: New York, NY, USA, 2016; pp. 31–37. [Google Scholar]
  22. Chun, H.; Chiang, C.J.; O’Brien, D.C. Visible light communication using OLEDs: Illumination and channel modeling. In Proceedings of the 2012 International Workshop on Optical Wireless Communications (IWOW), Pisa, Italy, 22 October 2012; IEEE: New York, NY, USA, 2012; pp. 1–3. [Google Scholar]
  23. Ding, J.; Wang, K.; Xu, Z. Impact of LED array simplification on indoor visible light communication channel modeling. In Proceedings of the 2014 9th International Symposium on Communication Systems, Networks & Digital Sign (CSNDSP), Manchester, UK, 23–25 July 2014; IEEE: New York, NY, USA, 2014; pp. 1159–1164. [Google Scholar]
  24. Iturralde, D.; Azurdia-Meza, C.; Krommenacker, N.; Soto, I.; Ghassemlooy, Z.; Becerra, N. A new location system for an underground mining environment using visible light communications. In Proceedings of the 2014 9th International Symposium on Communication Systems, Networks & Digital Sign (CSNDSP), Manchester, UK, 23–25 July 2014; IEEE: New York, NY, USA, 2014; pp. 1165–1169. [Google Scholar]
  25. Iturralde, D.; Seguel, F.; Soto, I.; Azurdia, C.; Khan, S. A new VLC system for localization in underground mining tunnels. IEEE Lat. Am. Trans. 2017, 15, 581–587. [Google Scholar] [CrossRef]
  26. Soto, I.; Nilson Rodrigues, R.; Massuyama, G.; Seguel, F.; Palacios Jativa, P.; Azurdia-Meza, C.A.; Krommenacker, N. A hybrid VLC-RF portable phasor measurement unit for deep tunnels. Sensors 2020, 20, 790. [Google Scholar] [CrossRef] [PubMed] [Green Version]
  27. Palacios Játiva, P.; Román Cañizares, M.; Azurdia-Meza, C.A.; Zabala-Blanco, D.; Dehghan Firoozabadi, A.; Seguel, F.; Montejo-Sánchez, S.; Soto, I. Interference mitigation for visible light communications in underground mines using angle diversity receivers. Sensors 2020, 20, 367. [Google Scholar] [CrossRef] [Green Version]
  28. Wang, J.; Al-Kinani, A.; Sun, J.; Zhang, W.; Wang, C.X. A path loss channel model for visible light communications in underground mines. In Proceedings of the 2017 IEEE/CIC International Conference on Communications in China (ICCC), Qingdao, China, 22–24 October 2017; IEEE: New York, NY, USA, 2017; pp. 1–5. [Google Scholar]
  29. Riurean, S.; Stoicuta, O.; Leba, M.; Ionica, A.; Rocha, Á. Underground channel model for visible light wireless communication based on neural networks. In World Conference on Information Systems and Technologies; Springer: Berlin, Germany, 2020; pp. 293–305. [Google Scholar]
  30. Wang, J.; Al-Kinani, A.; Zhang, W.; Wang, C.X.; Zhou, L. A general channel model for visible light communications in underground mines. China Commun. 2018, 15, 95–105. [Google Scholar] [CrossRef]
  31. Lee, I.E.; Sim, M.L.; Kung, F.W.L. Performance enhancement of outdoor visible-light communication system using selective combining receiver. IET Optoelectron. 2009, 3, 30–39. [Google Scholar] [CrossRef]
  32. Ghassemlooy, Z.; Popoola, W.; Rajbhandari, S. Optical Wireless Communications: System and Channel Modelling with Matlab®; CRC Press: Boca Raton, FL, USA, 2019. [Google Scholar]
  33. Grubor, J.; Randel, S.; Langer, K.D.; Walewski, J.W. Broadband information broadcasting using LED-based interior lighting. J. Light. Technol. 2008, 26, 3883–3892. [Google Scholar] [CrossRef] [Green Version]
  34. Wu, D.; Ghassemlooy, Z.; Rajbhandari, S.; Le Minh, H. Channel characteristics analysis and experimental demonstration of a diffuse cellular indoor visible light communication system. Mediterr. J. Electron. Commun. 2012, 8, 1–7. [Google Scholar]
  35. Esmail, M.A.; Fathallah, H.; Alouini, M.S. Effect of dust storms on FSO communications links. In Proceedings of the 2016 4th International Conference on Control Engineering & Information Technology (CEIT), Hammamet, Tunisia, 16–18 December 2016; IEEE: New York, NY, USA, 2016; pp. 1–6. [Google Scholar]
  36. Baddock, M.C.; Strong, C.L.; Leys, J.; Heidenreich, S.; Tews, E.; McTainsh, G.H. A visibility and total suspended dust relationship. Atmos. Environ. 2014, 89, 329–336. [Google Scholar] [CrossRef] [Green Version]
  37. Cao, M.; Wang, H.; Yao, Y.; Hou, S. Performance Evaluation of FSO Communications under Sand-Dust Conditions. Int. J. Antennas Propag. 2019, 2019, 2046896. [Google Scholar] [CrossRef]
  38. Miramirkhani, F.; Narmanlioglu, O.; Uysal, M.; Panayirci, E. A mobile channel model for VLC and application to adaptive system design. IEEE Commun. Lett. 2017, 21, 1035–1038. [Google Scholar] [CrossRef]
  39. Dimitrov, S.; Mesleh, R.; Haas, H.; Cappitelli, M.; Olbert, M.; Bassow, E. Path loss simulation of an infrared optical wireless system for aircrafts. In Proceedings of the GLOBECOM 2009—2009 IEEE Global Telecommunications Conference, Honolulu, HI, USA, 30 November–4 December 2009; IEEE: New York, NY, USA, 2009; pp. 1–6. [Google Scholar]
  40. Wang, J.; Al-Kinani, A.; Zhang, W.; Wang, C.X. A new VLC channel model for underground mining environments. In Proceedings of the 2017 13th International Wireless Communications and Mobile Computing Conference (IWCMC), Valencia, Spain, 26–30 June 2017; IEEE: New York, NY, USA, 2017; pp. 2134–2139. [Google Scholar]
  41. Seguel, F.; Soto, I.; Adasme, P.; Krommenacker, N.; Charpentier, P. Potential and challenges of VLC based IPS in underground mines. In Proceedings of the 2017 First South American Colloquium on Visible Light Communications (SACVLC), Santiago, Chile, 13 November 2017; IEEE: New York, NY, USA, 2017; pp. 1–6. [Google Scholar]
  42. Farahneh, H.; Hussain, F.; Fernando, X. A new alarming system for an underground mining environment using visible light communications. In Proceedings of the 2017 IEEE Canada International Humanitarian Technology Conference (IHTC), Toronto, ON, Canada, 21–22 July 2017; IEEE: New York, NY, USA, 2017; pp. 213–217. [Google Scholar]
Figure 1. Fundamental visible light communication (VLC) model for underground coal mines.
Electronics 10 00883 g001
Figure 2. Structural design of coal mine galleries.
Electronics 10 00883 g002
Figure 3. Geometrical classification of VLC link in terms of line of sight (LOS) and non-line of sight (NLOS) propagation.
Electronics 10 00883 g003
Figure 4. Distribution of horizontal illumination for mine gallery and sub-gallery environments.
Electronics 10 00883 g004
Figure 5. Estimation of coal dust concentration by using visibility data.
Electronics 10 00883 g005
Figure 6. Approximate dust attenuation for VLC link.
Electronics 10 00883 g006
Figure 7. Basic outline of scattering patterns.
Electronics 10 00883 g007
Figure 8. Distribution of scattering intensity in terms of extinction coefficient and scattering coefficient for various coal particle sizes.
Electronics 10 00883 g008
Figure 9. Channel impulse response (CIR) analysis for k = 3 , (a) Mine gallery, and (b) Sub-gallery.
Electronics 10 00883 g009
Figure 10. Distance dependent path loss in mine; (a) path loss in mine gallery; (b) path loss in sub-gallery.
Electronics 10 00883 g010
Figure 11. Received power analysis between LOS and NLOS VLC links. (a) Received power in mine gallery. (b) Received power in sub-gallery.
Electronics 10 00883 g011
Figure 12. Comparison analysis of root mean square (RMS) delay spread (DS) response between the mine gallery and sub-gallery of the coal mine environment.
Electronics 10 00883 g012
Figure 13. Estimation of the signal to noise ratio (SNR) for the integrated LOS and NLOS VLC links.
Electronics 10 00883 g013
Figure 14. Probability of error as a function of distance to estimate the shadowing effect for VLC.
Electronics 10 00883 g014
Table 1. The simulation parameters for VLC model.
ParameterValue
Mine gallery width × height5 m × 6 m
Sub-gallery width × height8 m × 6 m
Center luminous intensity100 cd
Semi-angle at half power60°
Optical Transmit power5 W
Dark current10 nA
Responsivity0.55 A/W
Link distance1–10 m
LEDs Wavelength580 nm
Scattering coefficient0.4
Extinction coefficient1.3
Receiver FOV60°
Reflection coefficient of metal object0.8 [20]
Reflection coefficient of side walls0.6 [14]
Publisher’s Note: MDPI stays neutral with regard to jurisdictional claims in published maps and institutional affiliations.

